Relationship of Cepstral Peak Prominence-Smoothed and Long-Term Average Spectrum with Auditory–Perceptual Analysis

 ,
,  ,
,
Abstract
1. Introduction
2. Materials and Methods
2.1. Study Design
2.2. Ethical Aspects
2.3. Research Team
- Researcher 1: responsible for measuring the acoustical parameters.
- Researchers 2, 3, and 4: responsible for auditory–perceptual analysis.
2.4. Sample
- (1)
- VHG—25 females, 28 males; 53 total participants (mean age = 31.0 years);
- (2)
- DG—29 females, 20 males; 49 total participants (mean age = 26.4 years).
2.5. Procedures
2.5.1. Voice Recording
2.5.2. Acoustic Measures
- Open Praat and the voice sample and then select “Analyze Periodicity”;
- Click “To PowerCepstrogram”;
- A new window will open. Keep the standard values of the software: Pitch floor (Hz) = 60, Timestep (s) = 0.002, Maximum frequency (Hz) = 5000, and Pre-emphasis (Hz) = 50;
- Click on the new generated file, select “Query”, and then click “Get CPPS”;
- On the new window, deselect the “Subtract tilt before smoothing” box. Then adjust Time-averaging window (s) = 0.01, Quefrency-averaging window (s) = 0.001, Peak search pitch range (Hz) = 60–330, Tolerance (0–1) = 0.05, Interpolation = Prabolic, Tilt line quefrency range (s) = 0.001–0.0 (=end), Line type = straight, and Fit method = robust;
- A new window will open with the CPPs value.
2.5.3. Auditory–Perceptual Analysis
2.6. Data Analysis
3. Results
4. Discussion
5. Conclusions
Author Contributions
Funding
Conflicts of Interest
References
- Zhang, Z. Mechanics of human voice production and control. J. Acoust. Soc. Am. 2016, 140, 2614–2635. [Google Scholar] [CrossRef] [PubMed]
- Ramig, L.O.; Verdolini, K. Treatment efficacy. J. Speech Lang. Hear. Res. 1998, 41, S101–S116. [Google Scholar] [CrossRef] [PubMed]
- Sataloff, R.T.; Abaza, M.M. Impairment, disability, and other medical-legal aspects of dysphonia. Otolaryngol. Clin. N. Am. 2000, 33, 1143–1152. [Google Scholar] [CrossRef]
- Brinca, L.; Batista, A.P.F.; Tavares, A.I.; Gonçalves, I.C.; Moreno, M.L. Use of cepstral analyses for differentiating normal from dysphonic voices: A comparative study of connected speech versus sustained vowel in European Portuguese female speakers. J. Voice 2014, 28, 282–286. [Google Scholar] [CrossRef] [PubMed]
- García, M.J.V.; Cobeta, I.; Martin, G.; Alonso-Navarro, H.; Jiménez-Jiménez, F.J. Acoustic analysis of voice in huntington’s disease patients. J. Voice 2011, 25, 208–217. [Google Scholar] [CrossRef]
- Olszewski, A.E.; Shen, L.; Jiang, J. Objective methods of sample selection in acoustic analysis of voice. Ann. Otol. Rhinol. Laryngol. 2011, 120, 155–161. [Google Scholar] [CrossRef]
- Karnell, M.P.; Scherer, R.S.; Fischer, L.B. Comparison of acoustic voice perturbation measures among three independent voice laboratories. J. Speech Lang. Hear. Res. 1991, 34, 781–790. [Google Scholar] [CrossRef]
- Bielamowicz, S.; Kreiman, J.; Gerratt, B.R.; Dauer, M.S.; Berke, G.S. Comparison of voice analysis systems for perturbation measurement. J. Speech Lang. Hear. Res. 1996, 39, 126–134. [Google Scholar] [CrossRef]
- Gaskill, C.S.; Awan, J.A.; Watts, C.R.; Awan, S.N. Acoustic and perceptual classification of within-sample normal, intermittently dysphonic, and consistently dysphonic voice types. J. Voice 2017, 31, 218–228. [Google Scholar] [CrossRef]
- Maryn, Y.; Roy, N.; De Bodt, M.; Van Cauwenberge, P.; Corthals, P. Acoustic measurement of overall voice quality: A meta-analysis. J. Acoust. Soc. Am. 2009, 126, 2619–2634. [Google Scholar] [CrossRef]
- Hillenbrand, J.; Cleveland, R.A.; Erickson, R.L. Acoustic correlates of breathy vocal quality. J. Speech Lang. Hear. Res. 1994, 37, 769–778. [Google Scholar] [CrossRef] [PubMed]
- Kumar, B.R.; Bhat, J.S.; Prasad, N. Cepstral analysis of voice in persons with vocal nodules. J. Voice 2010, 24, 651–653. [Google Scholar] [CrossRef] [PubMed]
- Hunter, E.J.; Titze, I.R. The voice use profile; illustrating actual voice use from long term monitoring from the National Center for Voice and Speech voice dosimeter. J. Acoust. Soc. Am. 2007, 121, 3201. [Google Scholar] [CrossRef]
- Hillenbrand, J.M.; Houde, R.A. Acoustic correlates of breathy vocal quality: Dysphonic voices and continuous speech. J. Speech Lang. Hear. Res. 1996, 39, 311–321. [Google Scholar] [CrossRef] [PubMed]
- Sujitha, S.P.; Pebbili, G.K. Cepstral analysis of voice in young adults. J. Voice 2020. [Google Scholar] [CrossRef]
- Hasanvand, A.; Salehi, A.; Ebrahimipour, M. A cepstral analysis of normal and pathologic voice qualities in Iranian adults: A comparative study. J. Voice 2017, 31, 508.e17–508.e23. [Google Scholar] [CrossRef]
- Heman-Ackah, Y.D.; Michael, D.D.; Goding, G.S. The relationship between cepstral peak prominence and selected parameters of dysphonia. J. Voice 2002, 16, 20–27. [Google Scholar] [CrossRef]
- Lopes, L.W.; Sousa, E.S.D.S.; Da Silva, A.C.F.; Da Silva, I.M.; De Paiva, M.A.A.; Vieira, V.J.D.; De Almeida, A.A. Medidas cepstrais na avaliação da intensidade do desvio vocal. CoDAS 2019, 31, e20180175. [Google Scholar] [CrossRef]
- Tanner, K.; Roy, N.; Ash, A.; Buder, E.H. Spectral moments of the long-term average spectrum: Sensitive indices of voice change after therapy? J. Voice 2005, 19, 211–222. [Google Scholar] [CrossRef]
- Master, S.; De Biase, N.; Pedrosa, V.; Chiari, B.M. O espectro médio de longo termo na pesquisa e na clínica fonoaudiológica. Pró-Fono Revista Atualização Científica 2006, 18, 111–120. [Google Scholar] [CrossRef][Green Version]
- Linville, S.E.; Rens, J. Vocal tract resonance analysis of aging voice using long-term average spectra. J. Voice 2001, 15, 323–330. [Google Scholar] [CrossRef]
- Kitzing, P. LTAS criteria pertinent to the measurement of voice quality. J. Phon. 1986, 14, 477–482. [Google Scholar] [CrossRef]
- Guzmán, M.; Correa, S.; Muñoz, D.; Mayerhoff, R. Influence on spectral energy distribution of emotional expression. J. Voice 2013, 27, 129.e1–129.e10. [Google Scholar] [CrossRef]
- Guzmán, M.; Higueras, D.; Fincheira, C.; Muñoz, D.; Aud, C.G.; Dowdall, J. Immediate acoustic effects of straw phonation exercises in subjects with dysphonic voices. Logop. Phoniatr. Vocology 2013, 38, 35–45. [Google Scholar] [CrossRef]
- Da Silva, P.T.; Master, S.; Andreoni, S.; Pontes, P.A.D.L.; Ramos, L.R. Acoustic and long-term average spectrum measures to detect vocal aging in women. J. Voice 2011, 25, 411–419. [Google Scholar] [CrossRef] [PubMed]
- Master, S.; De Biase, N.; Chiari, B.M.; Laukkanen, A.-M. Acoustic and perceptual analyses of brazilian male actors’ and nonactors’ voices: Long-term average spectrum and the “Actor’s Formant”. J. Voice 2008, 22, 146–154. [Google Scholar] [CrossRef]
- Frokjaer-Jensen, B.; Prytz, S. Registration of voice quality. Bruel Kjaer Tech. Rev. 1976, 3, 3–17. [Google Scholar]
- Gauffin, J.; Sundberg, J. Spectral correlates of glottal voice source waveform characteristics. J. Speech Lang. Hear. Res. 1989, 32, 556–565. [Google Scholar] [CrossRef]
- Laukkanen, A.-M.; Kankare, E. Vocal loading-related changes in male teachers’ voices investigated before and after a working day. Folia Phoniatr. Logop. 2006, 58, 229–239. [Google Scholar] [CrossRef]
- Nordenberg, M.; Sundberg, J. Effect on LTAS of vocal loudness variation. Logop. Phoniatr. Vocology 2004, 29, 183–191. [Google Scholar] [CrossRef]
- Löfqvist, A. The long-time-average spectrum as a tool in voice research. J. Phon. 1986, 14, 471–475. [Google Scholar] [CrossRef]
- Andrade, P.A.; Wood, G.; Ratcliffe, P.; Epstein, R.; Pijper, A.; Švec, J.G. Electroglottographic study of seven semi-occluded exercises: Laxvox, straw, lip-trill, tongue-trill, humming, hand-over-mouth, and tongue-trill combined with hand-over-mouth. J. Voice 2014, 28, 589–595. [Google Scholar] [CrossRef] [PubMed]
- Titze, I.R.; Laukkanen, A.-M. Can vocal economy in phonation be increased with an artificially lengthened vocal tract? A computer modeling study. Logop. Phoniatr. Vocology 2007, 32, 147–156. [Google Scholar] [CrossRef]
- Behlau, M.; Zambon, F.; Moreti, F.; Oliveira, G.; Couto, E.D.B. Voice self-assessment protocols: Different trends among organic and behavioral dysphonias. J. Voice 2017, 31, 112.e13–112.e27. [Google Scholar] [CrossRef] [PubMed]
- Watts, C.R.; Awan, S.N.; Maryn, Y. A comparison of cepstral peak prominence measures from two acoustic analysis programs. J. Voice 2017, 31, 387.e1–387.e10. [Google Scholar] [CrossRef]
- Phadke, K.V.; Laukkanen, A.-M.; Ilomäki, I.; Kankare, E.; Geneid, A.; Švec, J.G. Cepstral and perceptual investigations in female teachers with functionally healthy voice. J. Voice 2020, 34, 485.e33–485.e43. [Google Scholar] [CrossRef]
- Fleiss, J.L.; Levin, B.; Paike, M.C. Statistical Methods for Rates and Proportionsi, 3rd ed.; Wiley-Interscience: Hoboken, NJ, USA, 2003; pp. 598–626. [Google Scholar]
- Witz, K.; Hinkle, D.E.; Wiersma, W.; Jurs, S.G. Applied statistics for the behavioral sciences. J. Educ. Stat. 1990, 15, 84. [Google Scholar] [CrossRef]
- Titze, I.R. Acoustic interpretation of resonant voice. J. Voice 2001, 15, 519–528. [Google Scholar] [CrossRef]
- Doval, B.; D’Alessandro, C.; Henrich, N. The spectrum of glottal flow models. Acta Acust. United Acust. 2006, 92, 1026–1046. [Google Scholar]
- Awan, S.N.; Krauss, A.R.; Herbst, C.T. An examination of the relationship between electroglottographic contact quotient, electroglottographic decontacting phase profile, and acoustical spectral moments. J. Voice 2015, 29, 519–529. [Google Scholar] [CrossRef]
- Watts, C.R.; Awan, S.N. Use of spectral/cepstral analyses for differentiating normal from hypofunctional voices in sustained vowel and continuous speech contexts. J. Speech Lang. Hear. Res. 2011, 54, 1525–1537. [Google Scholar] [CrossRef]
- American Speech-Language-Hearing Association. Available online: https://www.asha.org/PRPSpecificTopic.aspx?folderid=8589942600§ion=Assessment (accessed on 15 March 2020).
- Yamasaki, R.; Madazio, G.; Leão, S.H.; Padovani, M.; Azevedo, R.; Behlau, M. Auditory-perceptual evaluation of normal and dysphonic voices using the voice deviation scale. J. Voice 2017, 31, 67–71. [Google Scholar] [CrossRef] [PubMed]
- Leino, T. Long-term average spectrum in screening of voice quality in speech: Untrained male university students. J. Voice 2009, 23, 671–676. [Google Scholar] [CrossRef] [PubMed]
- Burk, B.R.; Watts, C.R. The effect of parkinson disease tremor phenotype on cepstral peak prominence and transglottal airflow in vowels and speech. J. Voice 2019, 33, 580.e11–580.e19. [Google Scholar] [CrossRef] [PubMed]
- Antonetti, A.E.D.S.; Ribeiro, V.V.; Brasolotto, A.G.; Silvério, K.C.A. Effects of performance time of the voiced high-frequency oscillation and lax vox technique in vocally healthy subjects. J. Voice 2020. [Google Scholar] [CrossRef] [PubMed]
- Titze, I.R. Theoretical analysis of maximum flow declination rate versus maximum area declination rate in phonation. J. Speech Lang. Hear. Res. 2006, 49, 439–447. [Google Scholar] [CrossRef]
- Sundberg, J.; Salomão, G.L.; Scherer, K.R. Analyzing emotion expression in singing via flow glottograms, long-term-average spectra, and expert listener evaluation. J. Voice 2019. [Google Scholar] [CrossRef]
- Titze, I.R. Nonlinear source–filter coupling in phonation: Theory. J. Acoust. Soc. Am. 2008, 123, 2733–2749. [Google Scholar] [CrossRef]
- Sundberg, J. Ciência da Voz: Fatos Sobre a Voz na Fala e no Canto, 1st ed.; EdUSP: São Paulo, Brazil, 2018; pp. 41–47. [Google Scholar]
- Story, B.H.; Laukkanen, A.-M.; Titze, I.R. Acoustic impedance of an artificially lengthened and constricted vocal tract. J. Voice 2000, 14, 455–469. [Google Scholar] [CrossRef]
- Titze, I.R. The physics of small-amplitude oscillation of the vocal folds. J. Acoust. Soc. Am. 1988, 83, 1536–1552. [Google Scholar] [CrossRef]
- Maryn, Y.; Weenink, D. Objective dysphonia measures in the program praat: Smoothed cepstral peak prominence and acoustic voice quality index. J. Voice 2015, 29, 35–43. [Google Scholar] [CrossRef] [PubMed]
- Maryn, Y.; Corthals, P.; Van Cauwenberge, P.; Roy, N.; De Bodt, M. Toward improved ecological validity in the acoustic measurement of overall voice quality: Combining continuous speech and sustained vowels. J. Voice 2010, 24, 540–555. [Google Scholar] [CrossRef] [PubMed]


| Acoustic Measures | Vowel | Connected Speech | ||||
|---|---|---|---|---|---|---|
| VHG | DG | p Value | VHG | DG | p Value | |
| Mean ± SD | Mean ± SD | Mean ± SD | Mean ± SD | |||
| CPPs | 16.447 ± 2.92 | 14.991 ± 2.65 | 0.001 * | 7.769 ± 1.68 | 7.448 ± 1.38 | 0.297 |
| Alpha ratio | −18.225 ± 5.26 | −18.181 ± 4.64 | 0.965 | −23.687 ± 4.10 | −24.136 ± 3.74 | 0.565 |
| L1–L0 | −6.691 ± 4.50 | −5.245 ± 4.36 | 0.103 | −6.149 ± 3.31 | −5.612 ± 3.19 | 0.407 |
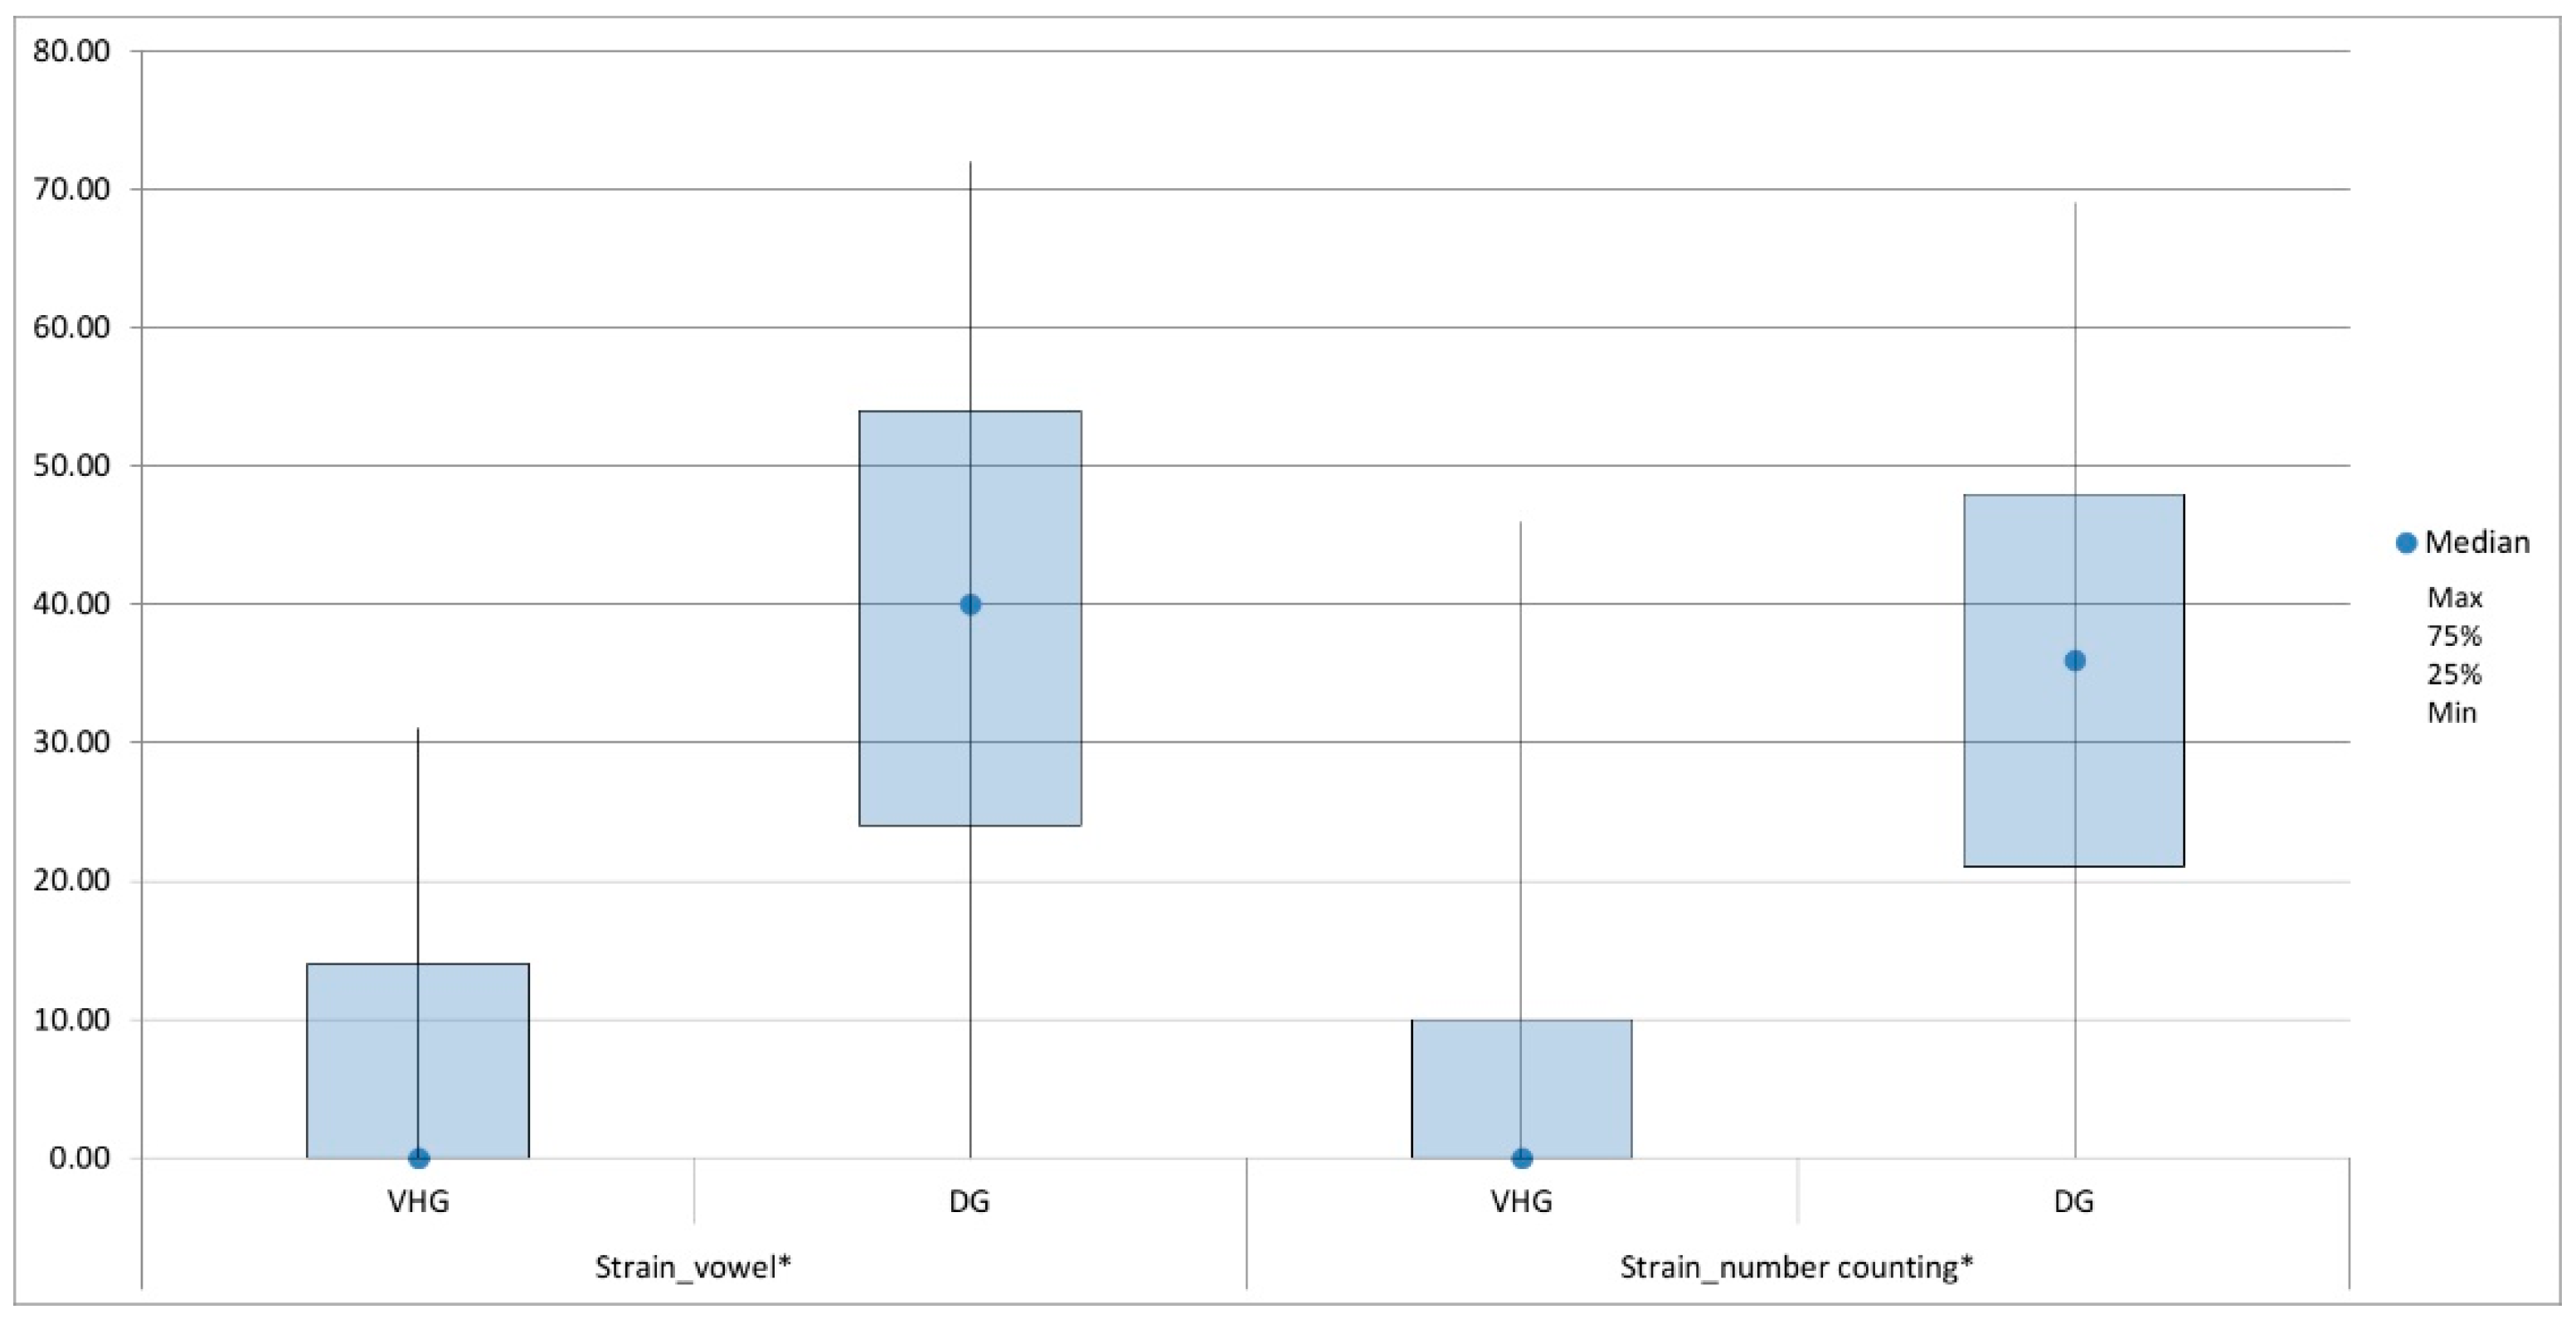
| Auditory–Perceptual Parameters | Vowel | Connected Speech | ||||
|---|---|---|---|---|---|---|
| VHG | DG | p Value | VHG | DG | p Value | |
| Mean ± SD | Mean ± SD | Mean ± SD | Mean ± SD | |||
| General degree | 32.881 ± 8.03 | 50.510 ± 10.54 | <0.001 * | 22.925 ± 6.08 | 50.510 ± 10.54 | <0.001 * |
| Roughness | 21.308 ± 10.44 | 42.939 ± 14.23 | <0.001 * | 15.969 ± 8.83 | 42.939 ± 14.23 | <0.001 * |
| Breathiness | 23.648 ± 11.92 | 37.803 ± 12.19 | <0.001 * | 12.994 ± 7.67 | 37.803 ± 12.19 | <0.001 * |
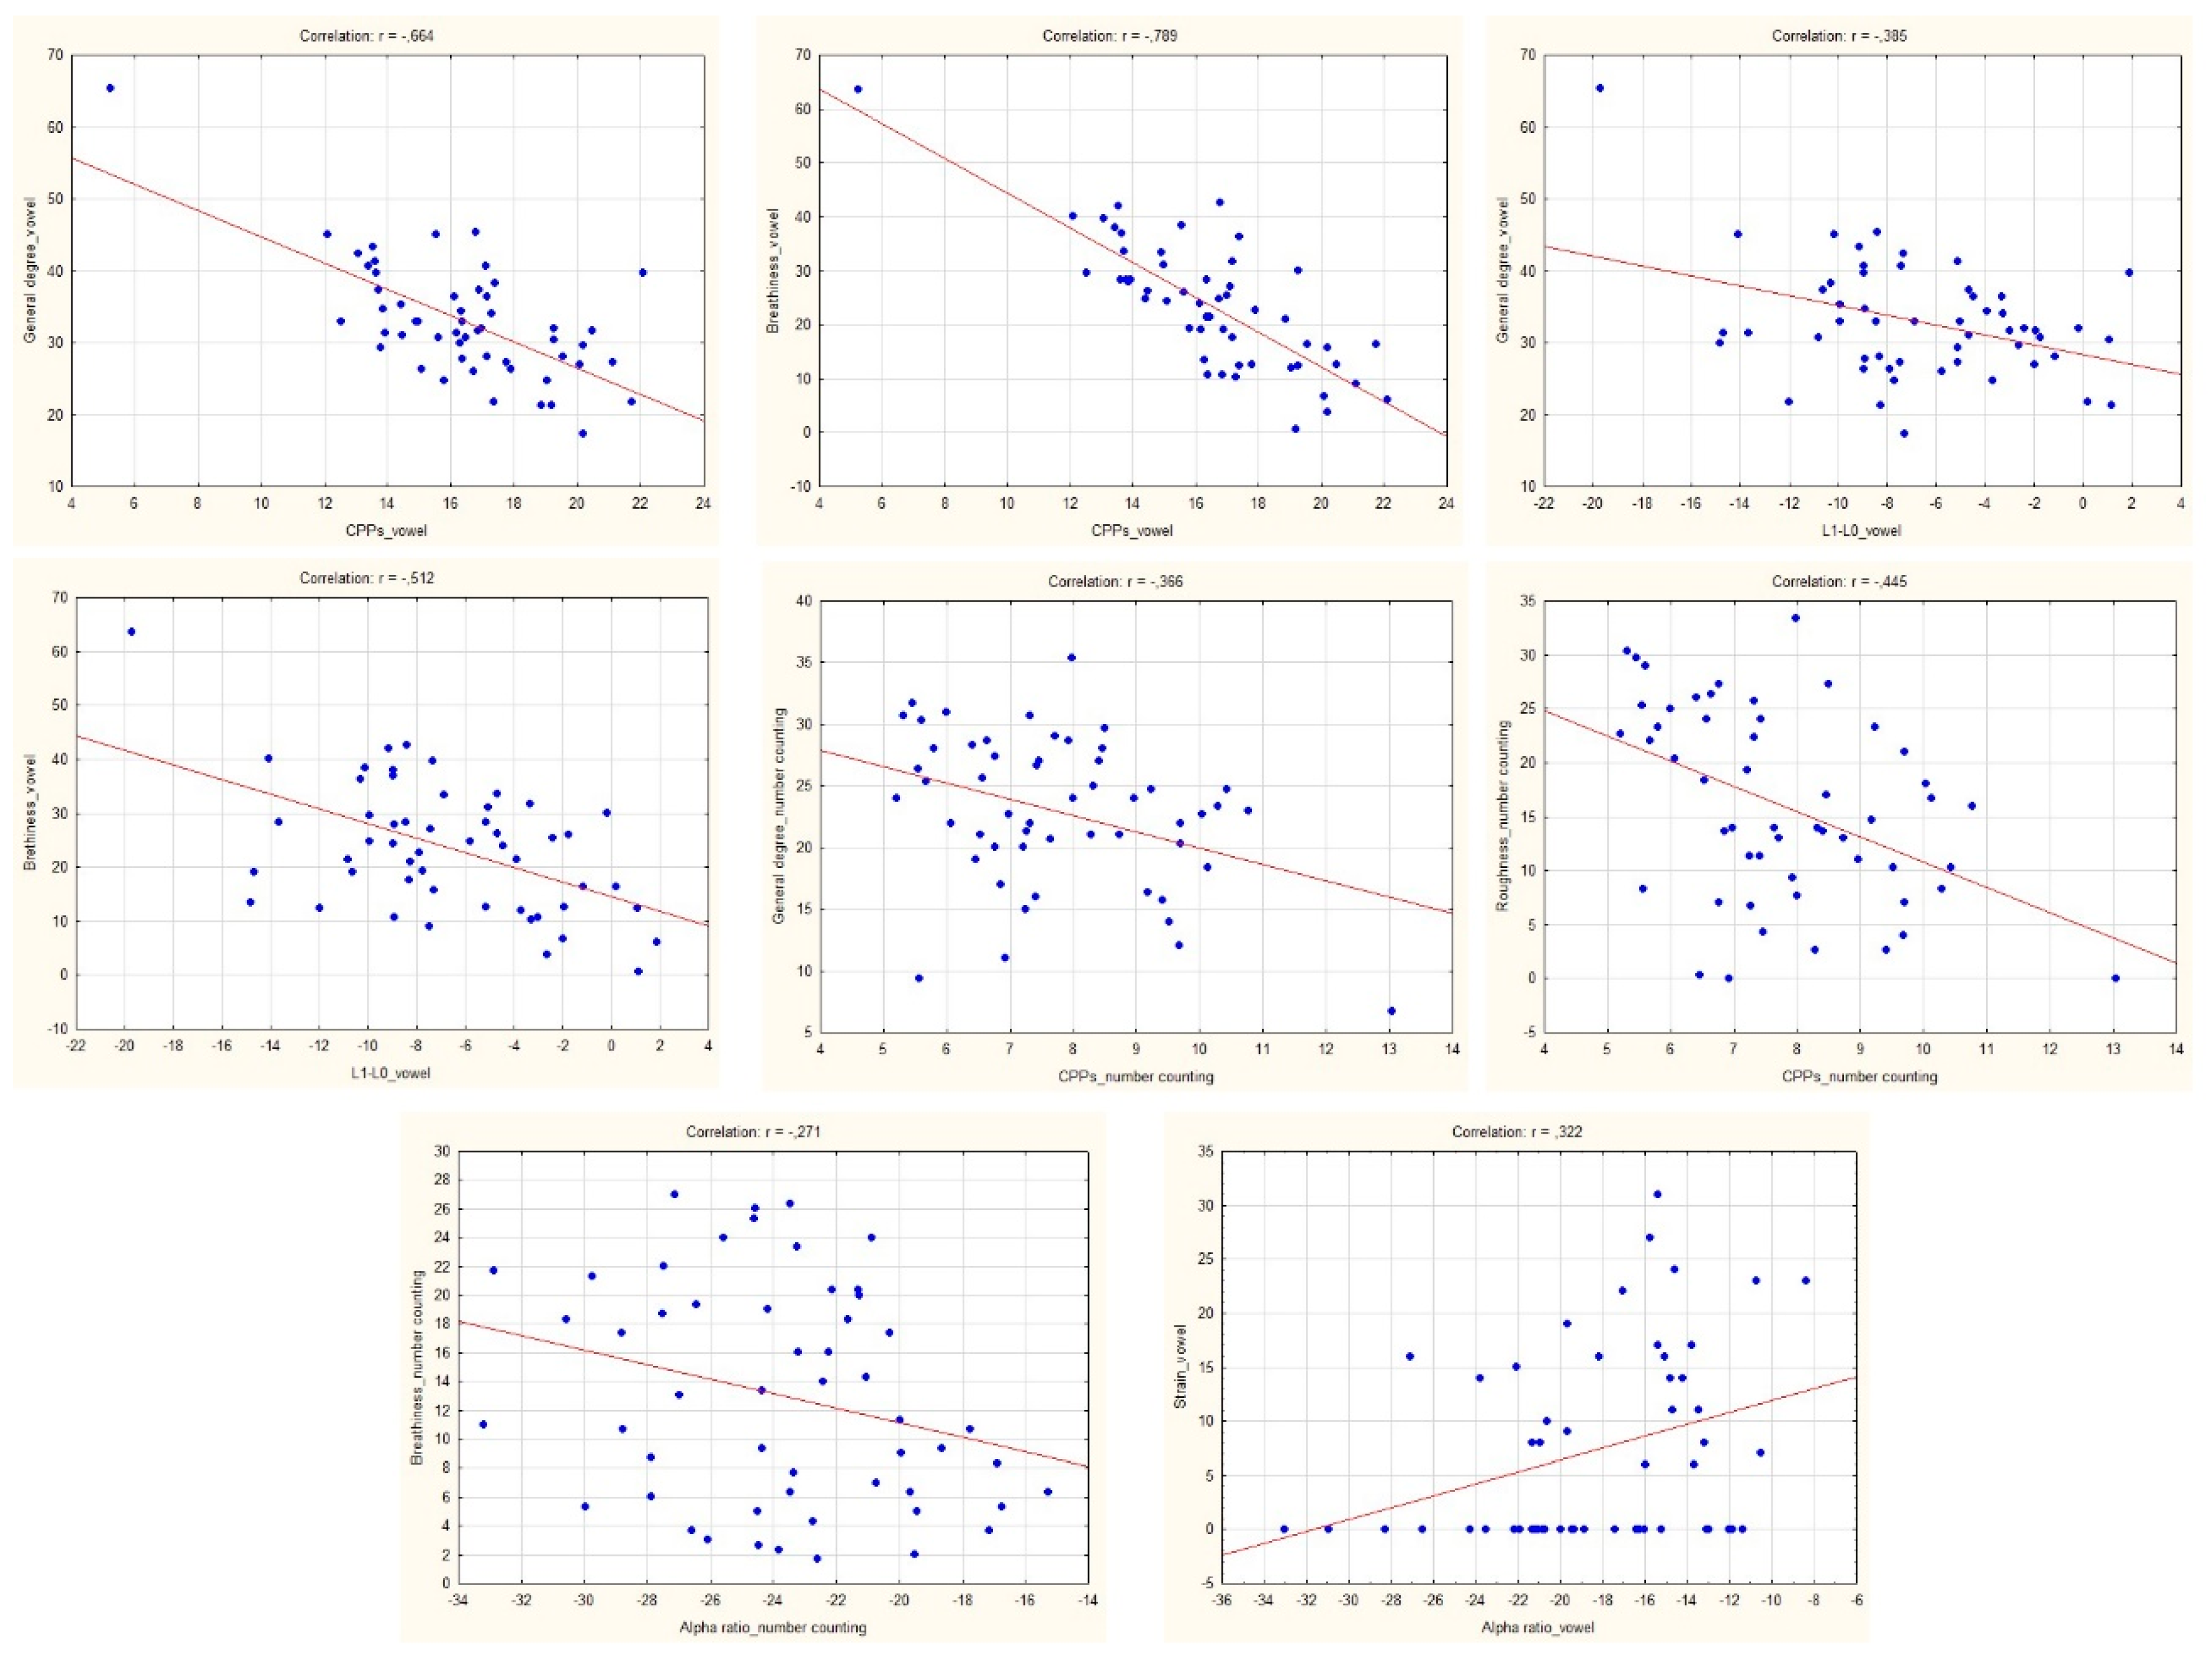
| Auditory–Perceptual Parameters | VHG | DG | ||||
|---|---|---|---|---|---|---|
| CPPs | Alpha Ratio | L1–L0 | CPPs | Alpha Ratio | L1–L0 | |
| r-Value | r-Value | r-Value | r-Value | r-Value | r-Value | |
| General degree | −0.664 * | −0.100 | −0.385 * | −0.570 * | −0.088 | −0.218 |
| Roughness | −0.065 | −0.010 | −0.019 | −0.231 | −0.113 | −0.110 |
| Breathiness | −0.789 * | −0.230 | −0.512 * | −0.846 * | −0.107 | −0.554 * |
| Strain ** | −0.149 | 0.322 * | −0.163 | −0.416 * | 0.134 | −0.120 |
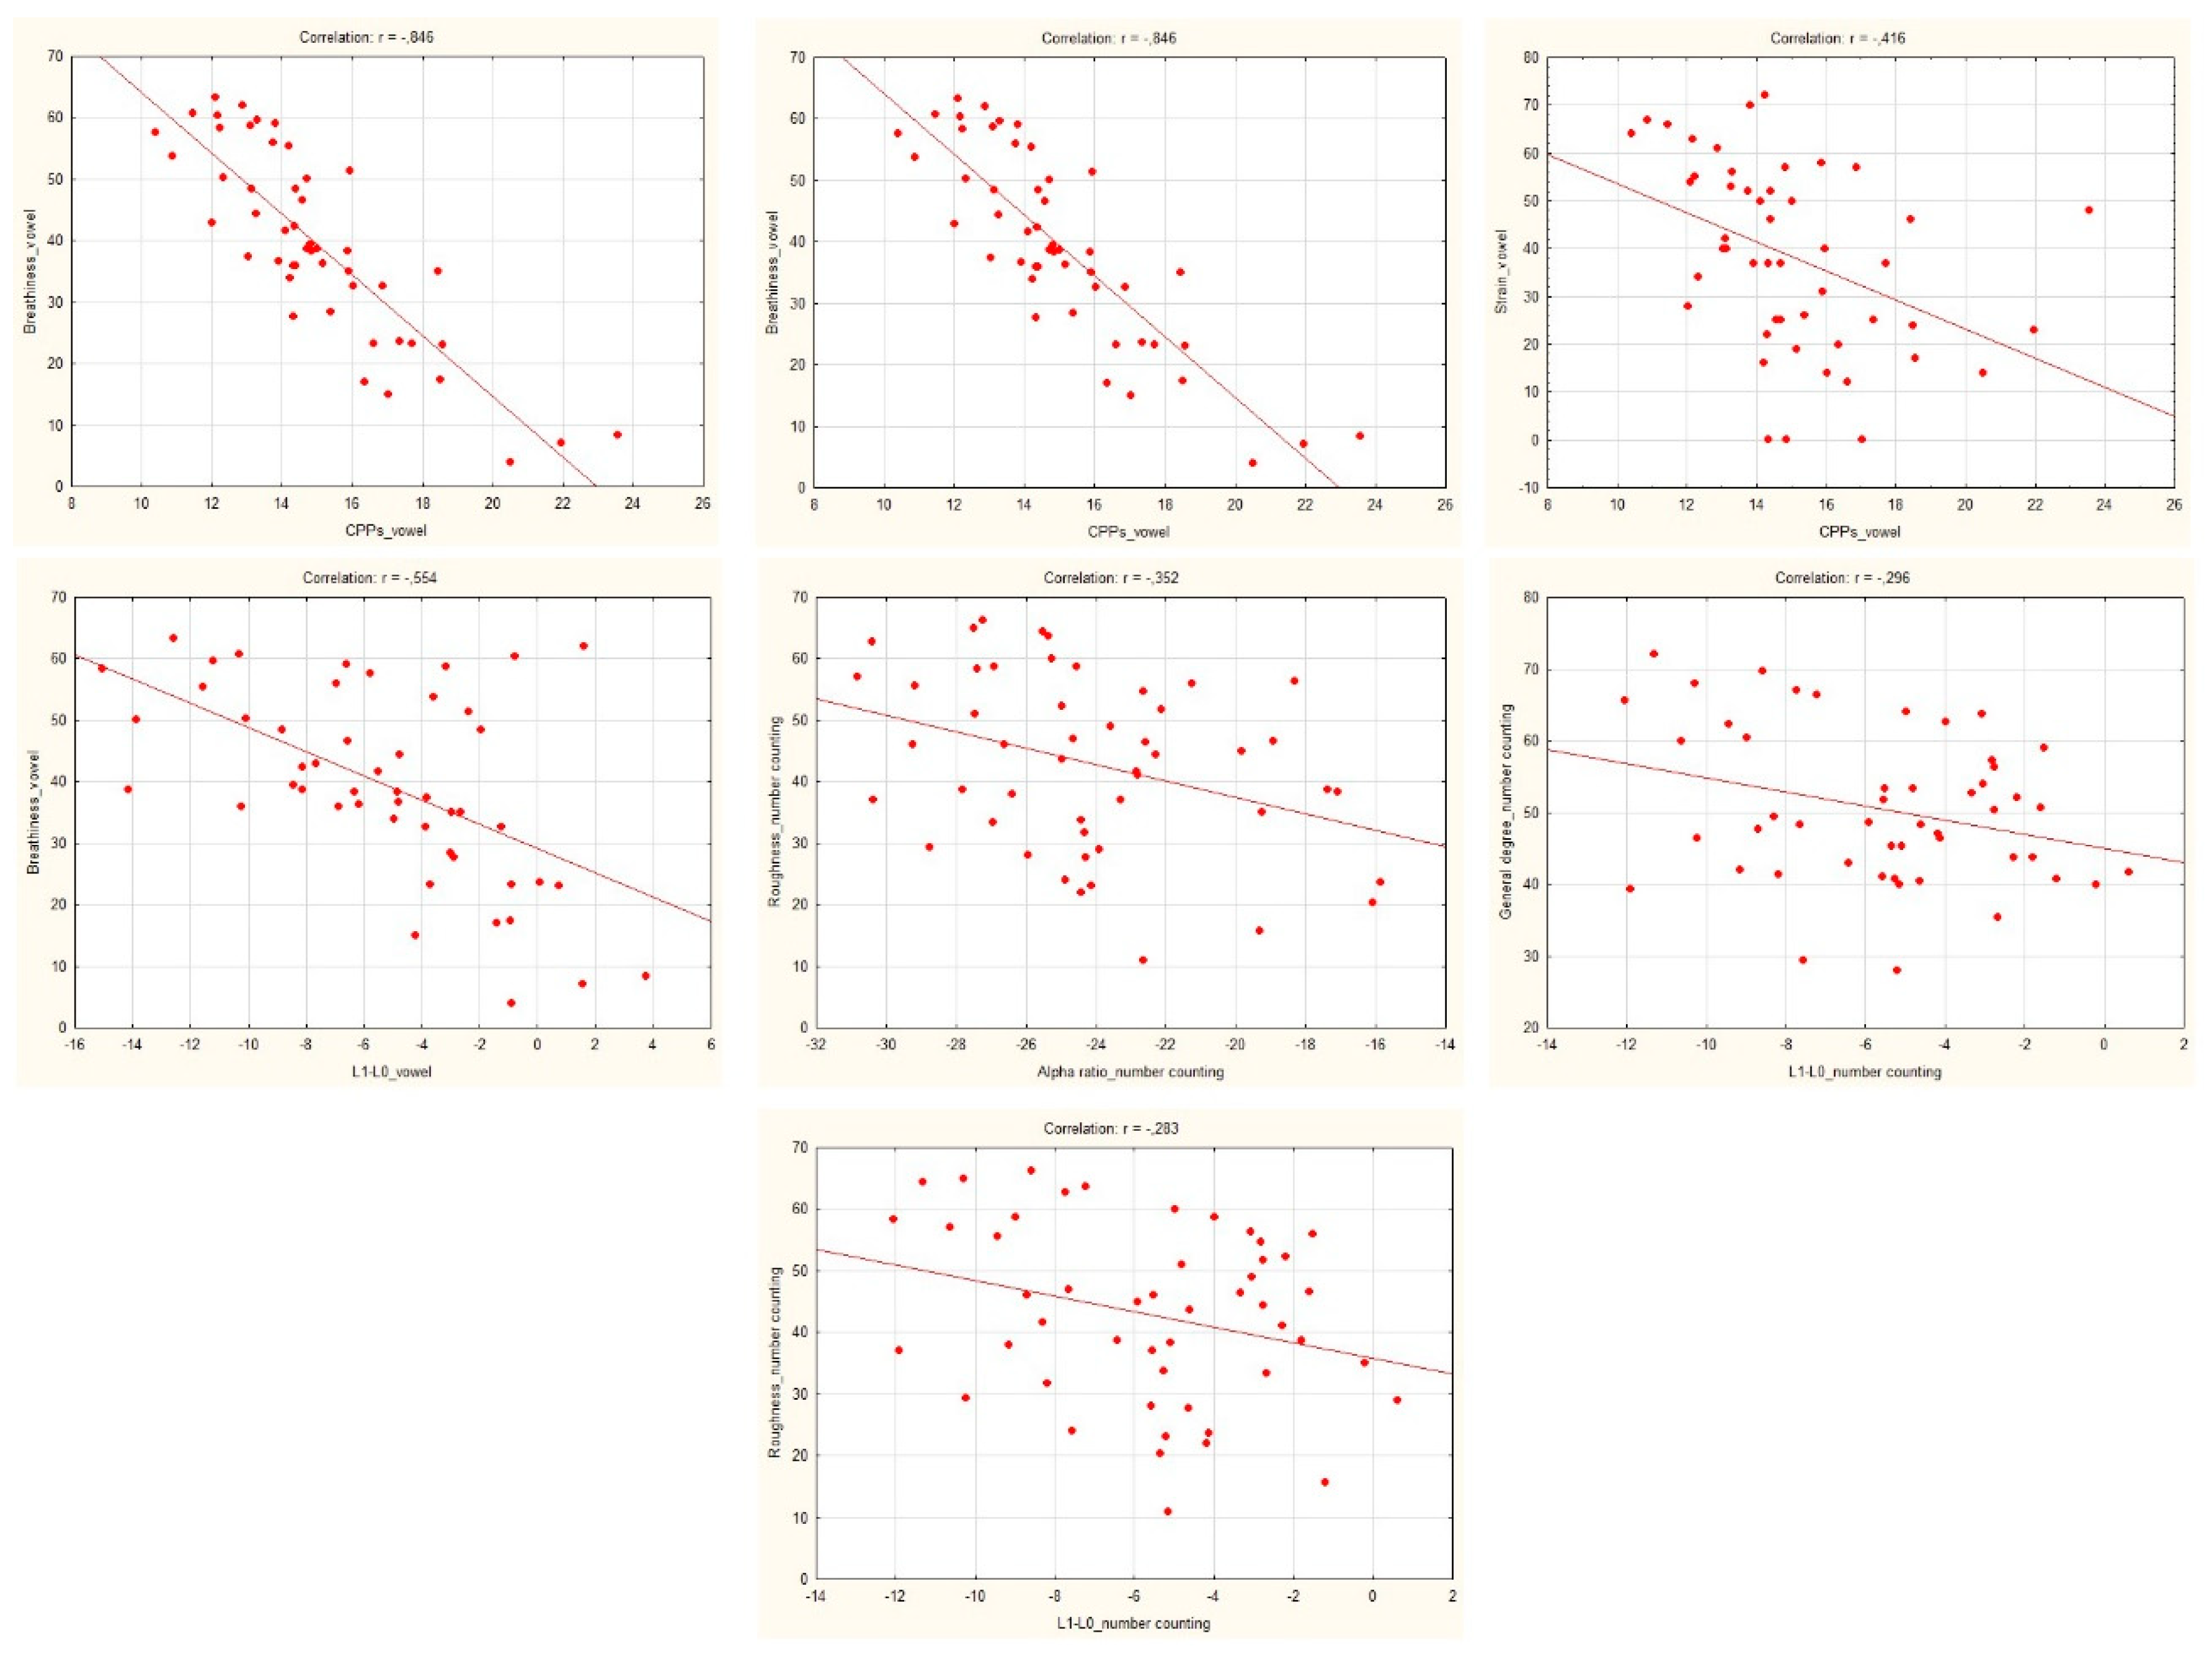
| Auditory–Perceptual Parameters | VHG | DG | ||||
|---|---|---|---|---|---|---|
| CPPs | Alpha Ratio | L1–L0 | CPPs | Alpha Ratio | L1–L0 | |
| r-Value | r-Value | r-Value | r-Value | r-Value | r-Value | |
| General degree | −0.366 * | −0.059 | 0.109 | −0.108 | −0.242 | −0.296 * |
| Roughness | −0.444 * | −0.242 | 0.206 | −0.134 | −0.352 * | −0.283 * |
| Breathiness | −0.161 | −0.271 * | −0.241 | 0.053 | −0.079 | −0.143 |
| Strain ** | −0.107 | 0.220 | −0.121 | −0.001 | 0.118 | −0.129 |
© 2020 by the authors. Licensee MDPI, Basel, Switzerland. This article is an open access article distributed under the terms and conditions of the Creative Commons Attribution (CC BY) license (http://creativecommons.org/licenses/by/4.0/).
Share and Cite
Antonetti, A.E.d.S.; Siqueira, L.T.D.; Gobbo, M.P.d.A.; Brasolotto, A.G.; Silverio, K.C.A. Relationship of Cepstral Peak Prominence-Smoothed and Long-Term Average Spectrum with Auditory–Perceptual Analysis. Appl. Sci. 2020, 10, 8598. https://doi.org/10.3390/app10238598
Antonetti AEdS, Siqueira LTD, Gobbo MPdA, Brasolotto AG, Silverio KCA. Relationship of Cepstral Peak Prominence-Smoothed and Long-Term Average Spectrum with Auditory–Perceptual Analysis. Applied Sciences. 2020; 10(23):8598. https://doi.org/10.3390/app10238598
Chicago/Turabian StyleAntonetti, Angélica Emygdio da Silva, Larissa Thais Donalonso Siqueira, Maria Paula de Almeida Gobbo, Alcione Ghedini Brasolotto, and Kelly Cristina Alves Silverio. 2020. "Relationship of Cepstral Peak Prominence-Smoothed and Long-Term Average Spectrum with Auditory–Perceptual Analysis" Applied Sciences 10, no. 23: 8598. https://doi.org/10.3390/app10238598
APA StyleAntonetti, A. E. d. S., Siqueira, L. T. D., Gobbo, M. P. d. A., Brasolotto, A. G., & Silverio, K. C. A. (2020). Relationship of Cepstral Peak Prominence-Smoothed and Long-Term Average Spectrum with Auditory–Perceptual Analysis. Applied Sciences, 10(23), 8598. https://doi.org/10.3390/app10238598