Article

Wingate Test, When Time and Overdue Fatigue Matter: Validity and Sensitivity of Two Time-Shortened Versions

by
Alejandro Hernández-Belmonte
1,*,
Ángel Buendía-Romero
1,
Alejandro Martínez-Cava
1,
Javier Courel-Ibáñez
1,
Ricardo Mora-Rodríguez
2 and
Jesús G. Pallarés
1
1
Human Performance and Sports Science Laboratory, Faculty of Sport Sciences, University of Murcia, 30100 Murcia, Spain
2
Exercise Physiology Laboratory, University of Castilla-La Mancha, 30720 San Javier, Spain
*
Author to whom correspondence should be addressed.
Appl. Sci. 2020, 10(22), 8002; https://doi.org/10.3390/app10228002
Submission received: 22 October 2020 / Revised: 10 November 2020 / Accepted: 10 November 2020 / Published: 11 November 2020
(This article belongs to the Special Issue Progresses in Resistance Training)

Abstract

:
This study aimed to analyze the validity and sensitivity of two time-shortened Wingate anaerobic tests (WAnTs), by means of three phases. In Phase A, 40 participants performed a traditional 30 s WAnT, whereas the first 15 s (WAnT15) and 20 s (WAnT20) were used to elaborate two predictive models. In Phase B, another 30 s WAnT was performed by 15 different volunteers to examine the error of these models (cross-validation). Finally, in Phase C, a 30 s WAnT was registered before and after a 10-week velocity-based training conducted by 22 different participants (training group, TRAIN = 11; control group that fully refrained from any type of training, CONTROL = 11). Power changes (in Watts, W) after this training intervention were used to interpret the sensitivity of the time-shortened WAnT. Adjusted coefficient of determination (R2) was reported for each regression model, whereas the cross-validation analysis included the smallest detectable change (SDC) and bias. Close relationships were found between the traditional 30 s WAnT and both the WAnT15 (R2 = 0.98) and WAnT20 (R2 = 0.99). Cross-validation analysis showed a lower error and bias for WAnT20 (SDC = 9.3 W, bias = −0.1 W) compared to WAnT15 (SDC = 22.2 W, bias = 1.8 W). Lastly, sensitivity to identify individual changes was higher for WAnT20 (TRAIN = 11/11 subjects, CONTROL = 9/11 subjects) than for WAnT15 (TRAIN = 4/11 subjects, CONTROL = 2/11 subjects). These findings suggest that the WAnT20 could become a valid and sensitive protocol to replace the traditional 30 s WAnT.

1. Introduction

Since it was developed in 1970, the Wingate anaerobic test (WAnT) has become one of the main assessments to evaluate anaerobic power independently of the individual’s body weight [1]. During the traditional WAnT, the subject is required to pedal as fast as possible without an effort distribution (i.e., all-out) for 30 s [2]. Although this traditional 30 s WAnT has been proved to be a useful and reliable test [2,3], it commonly induces several detrimental effects, including nausea, dizziness, headaches, and vomiting [4]. In addition, this test to exhaustion produces excessive neuromuscular fatigue, limiting the assessment of other physical evaluations or high-quality training sessions within the following 48–72 h [5]. These aspects together have led to the development of several proposals based on time reductions, including 6, 10, 15, and 20 s WAnTs [6,7,8,9,10,11,12]. These time-shortened protocols measure the power output produced in the first seconds of the test, such as the peak power output (PPO) or power value generated at specific time points (e.g., at the second 10 or 15), to predict other performance parameters like the mean power (MPO) by means of regression analyses [6,9,11]. MPO is considered a variable of interest in many investigations [13,14], since it could be predictive of the anaerobic capacity (i.e., ability to sustain extremely high power) [1,2,15]. Another key variable derived from a WAnT is the fatigue index (FI). Including the FI in a regression model could help to adjust the power estimation, since this parameter relates with how the power declines along the test [2]. However, to date, no previous investigation has included the FI as a covariable to predict the MPO by means of a time-abbreviated WAnT.
Most of these time-shortened WAnT versions estimating MPO have shown high relationships with the MPO measured by the traditional 30 s WAnT, however, only two studies have analyzed the accuracy (i.e., magnitude of error) of these regression models by means of a cross-validation analysis [6,16]. Since one of the main goals of the use of the WAnT is to examine the power changes after short- and long-term training/detraining periods, it is necessary to identify whether the changes observed in power are due to the actual modifications in athletes’ anaerobic performance or due to an estimation error of the time-abbreviated test (i.e., sensitivity). Thus, practically interpreting the magnitude of error derived from this cross-validation analysis would be essential to examine the suitability of these shortened proposals for daily use. Nevertheless, in addition to the few studies including a cross-validation analysis, no study to date has interpreted the validity of a time-shortened WAnT considering its sensitivity.
On the other hand, all time-shortened WAnT models proposed to date have obtained the main variable (power output) and its derivates (i.e., PPO or MPO) in an indirect way [6,7,8,9,10,11,12]. Thus, the power output has been traditionally calculated by multiplying the revolution per second of the Monark® cycle ergometer (velocity) by a fixed resistance, commonly corresponding to 7.5% of the subject’s body mass (force) [11]. However, since the load placed in the basket of the cycle ergometer remains constant while the moment of inertia changes during the initial acceleration, the actual resistance to overcome is not constant throughout the entire trial [17,18]. Therefore, this traditional method does not allow for the registration of instantaneous force that the subject is applying to overcome the resistance. This fact could introduce a source of error in the power measurement, since in some cases the accuracy of this variable (resistance × velocity) decreases as a consequence of an overestimation of the resistance parameter [19]. Advances in technology have led to the development of power meters that directly measure the instantaneous force applied to the pedals, plate, or rear-wheel axle [20,21]. Thus, instantaneous power output could be obtained by means of the simultaneous measure of the angular velocity. This methodology has been previously used to measure power output changes after different training programs [13,14] and evaluate the force–velocity profile in cycling [22]. However, no study to date has analyzed a time-shortened WAnT using this technology.
Therefore, this study aimed to analyze the validity and sensitivity of two time-shortened WAnT modifications by measuring the main variable (power output) using a power meter device.

2. Materials and Methods

2.1. Experimental Design

Three phases can be differentiated in the current study. In Phase A (cross-sectional), 40 participants conducted a single 30 s WAnT on a cycle ergometer. The first 15 s and 20 s of these trials were used to elaborate two predictive regression models of the traditional 30 s test. In Phase B (cross-sectional), another 30 s WAnT was performed by 15 participants (not including any subject who participated in Phase A), in order to examine the accuracy of the aforementioned regression models (i.e., cross-validation analysis). Finally, in Phase C (longitudinal), 22 volunteers completed a 10-week resistance training program using the full back squat exercise. Before (T0) and after (T10) this training intervention, participants completed a 30 s WAnT, and changes in MPO were registered to evaluate the sensitivity of the two time-shortened WAnT protocols to detect increases or decreases in anaerobic capacity.

2.2. Subjects

Seventy-seven subjects (age 22.1 ± 2.7 year, body mass 76.7 ± 11.1 kg, height 178.2 ± 7.9 cm) volunteered to take part in this study. Three inclusion criteria were pre-established: (i) previous completion of at least three traditional 30 s WAnTs, (ii) absence of medical conditions incompatible with preforming high-intensity exercise, physical limitations, or musculoskeletal injuries that could affect pedaling, (iii) involved in a resistance training program, including the full squat exercise, during the 6 months preceding the research. The study was conducted according to the Declaration of Helsinki and approved by the Ethics Commission of the University of Murcia (ID: 2504/2019). All subjects signed a written consent form after being informed of the purpose and experimental procedures.

2.3. Procedures

Participants included in phases A, B, and C followed the same testing procedures. Each participant visited the laboratory on 3 occasions, separated by 72 h (session 1 and 2) and 7 days (session 2 and 3). Although all participants had experience in the execution of the traditional 30 s WAnT, they completed two familiarization sessions (sessions 1 and 2) to strengthen the technical execution of the test. Furthermore, session 1 was used to register personal data, administer a health history questionnaire, and conduct a medical examination of each subject. Finally, in session 3, participants performed a 30 s WAnT to elaborate the predictive regression models (Phase A), cross-validation analysis (Phase B), and pre-training evaluation (Phase C). After 10 weeks of a resistance training intervention or a detraining period (described later in detail), participants included in Phase C returned to the laboratory to perform again the 30 s WAnT. Power changes after this training or detraining period were used to practically interpret the sensitivity of the time-shortened WAnT.

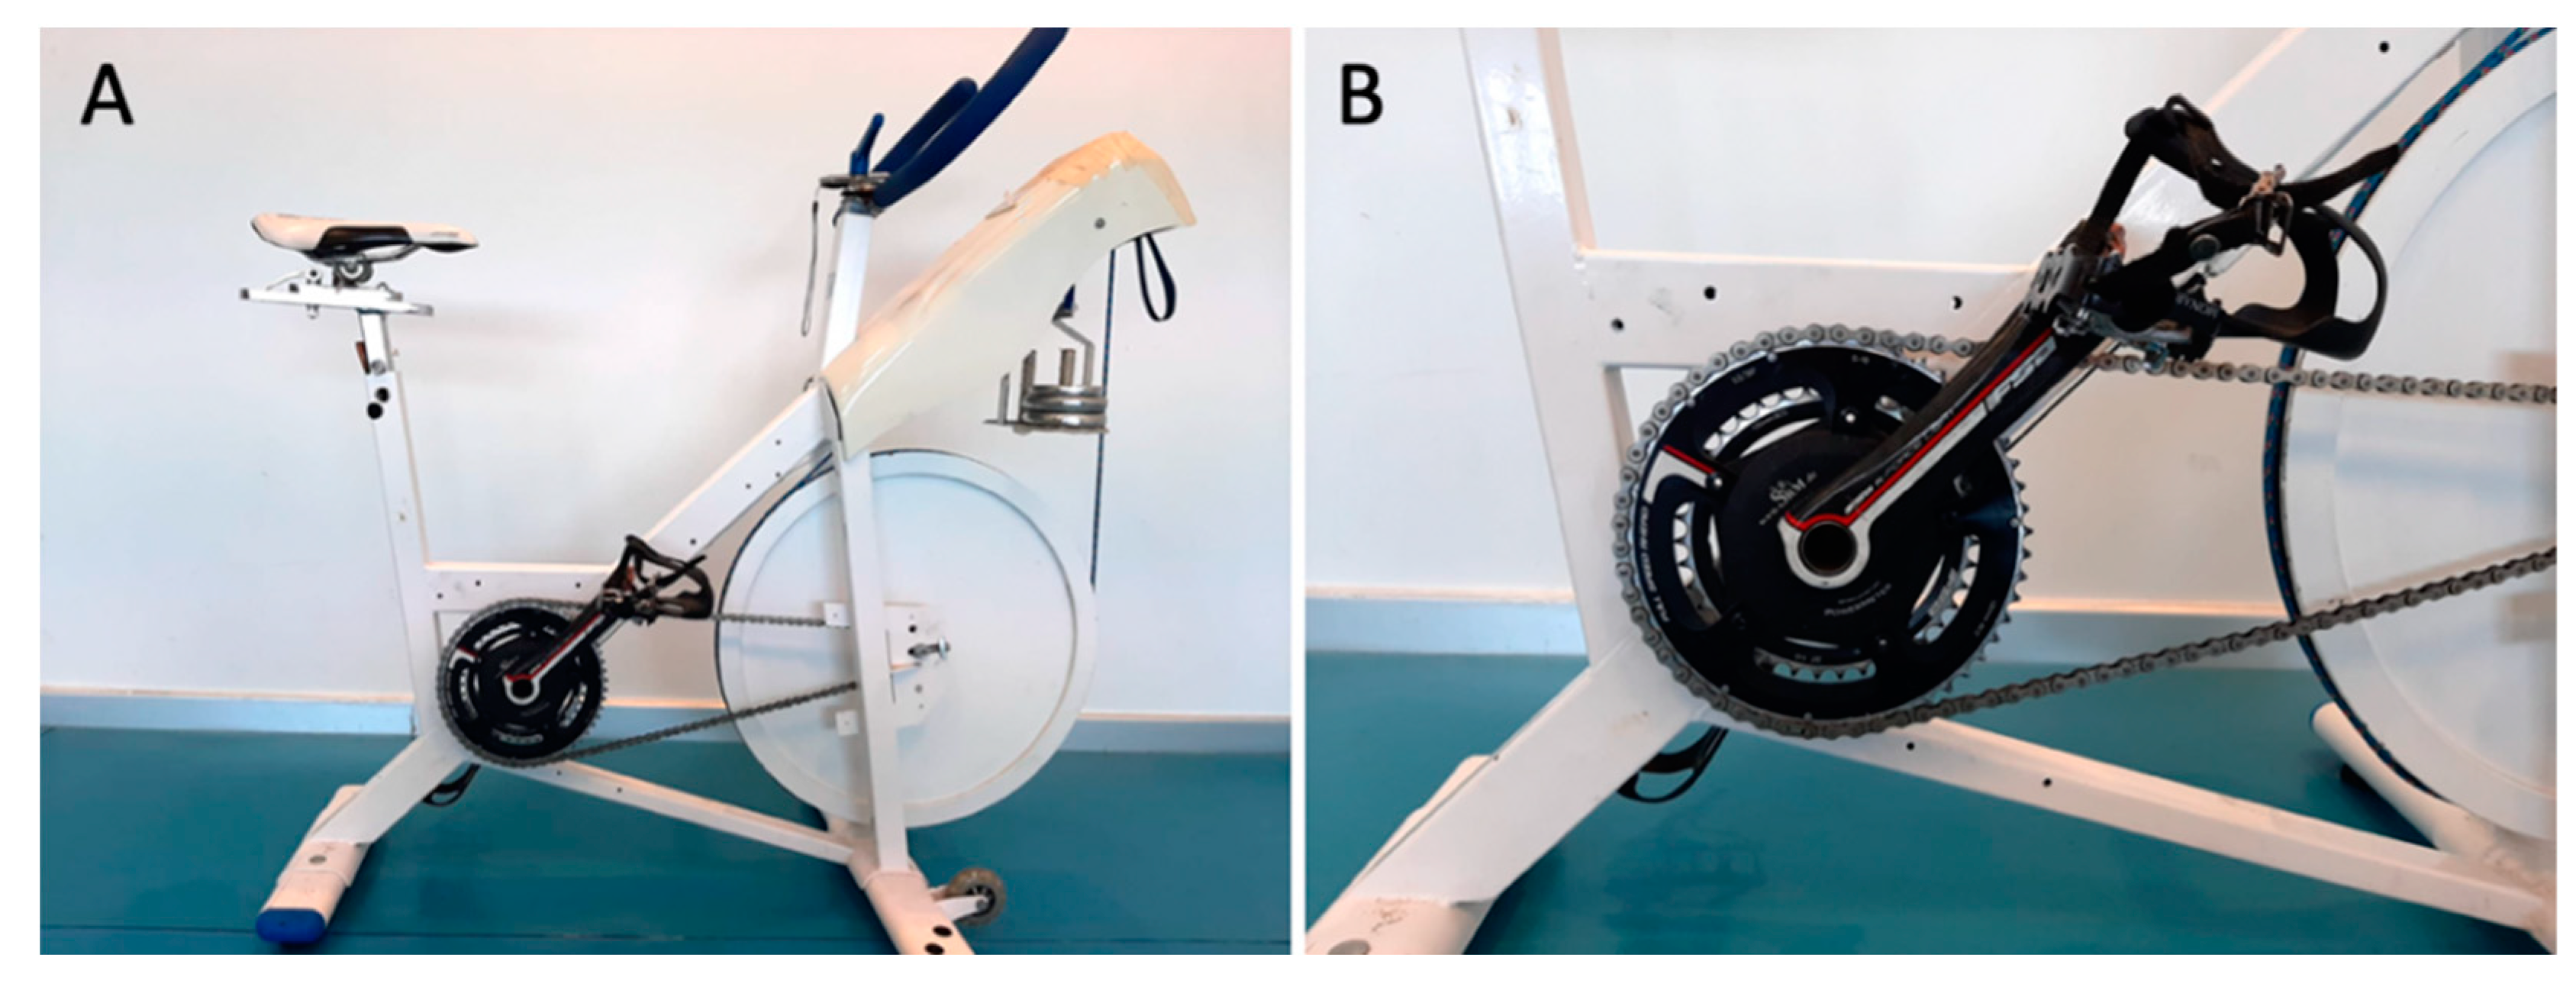
2.3.1. Wingate Anaerobic Test (WAnT)

All WAnTs were conducted in a friction belt cycle ergometer (Monark© 874E, Varberg, Sweden). This cycle ergometer has a basket located ~63 cm from the floor to place the extra resistance, which was set as 7.5% of the subject’s body mass (body mass × 0.075 kg) [2,6,11]. In order to directly measure the force applied by the participant during the trial, the SRM® power meter (SRM, Julich, Germany, 1 Hz, ±1% accuracy) was adapted to the bottom bracket of the cycle ergometer (Figure 1). This technology is based on a strain gauge instrumented crank set that measures the deformation on the shafts of both cranks resulting from the force applied when pedaling. In addition, the power meter provides the revolution per second (i.e., angular velocity) by means of reed switch triggers. The power meter was calibrated at the beginning of each testing session following the manufacturer’s instructions. The saddle and handlebar positions of the cycle ergometer were individually adjusted to fit with participants’ body size. A standardized warm-up consisted of alternating 30 s periods of active rest (no extra load in the basket, pedaling at 60 rpm) and three 30 s bouts of pedaling at increasing resistance (25, 50, 75% of the definitive load) were performed before each test [9]. The WAnT began from a complete stop with the pedal of the dominant leg placed at 45° from the vertical. When the researcher finished the countdown “3, 2, 1” and shouted “Go”, the participants performed a 30 s all-out effort. Participants were verbally encouraged during the test by the researchers to perform a true all-out effort. After finishing the trial, participants completed an active cool-down 5 min period without resistance.

2.3.2. Variables Analyzed

The accuracy of the WAnT15 and WAnT20 to estimate the MPO of the traditional 30 s WAnT was calculated through predictive models that included the following variables (Figure 2) [6,11]:
-
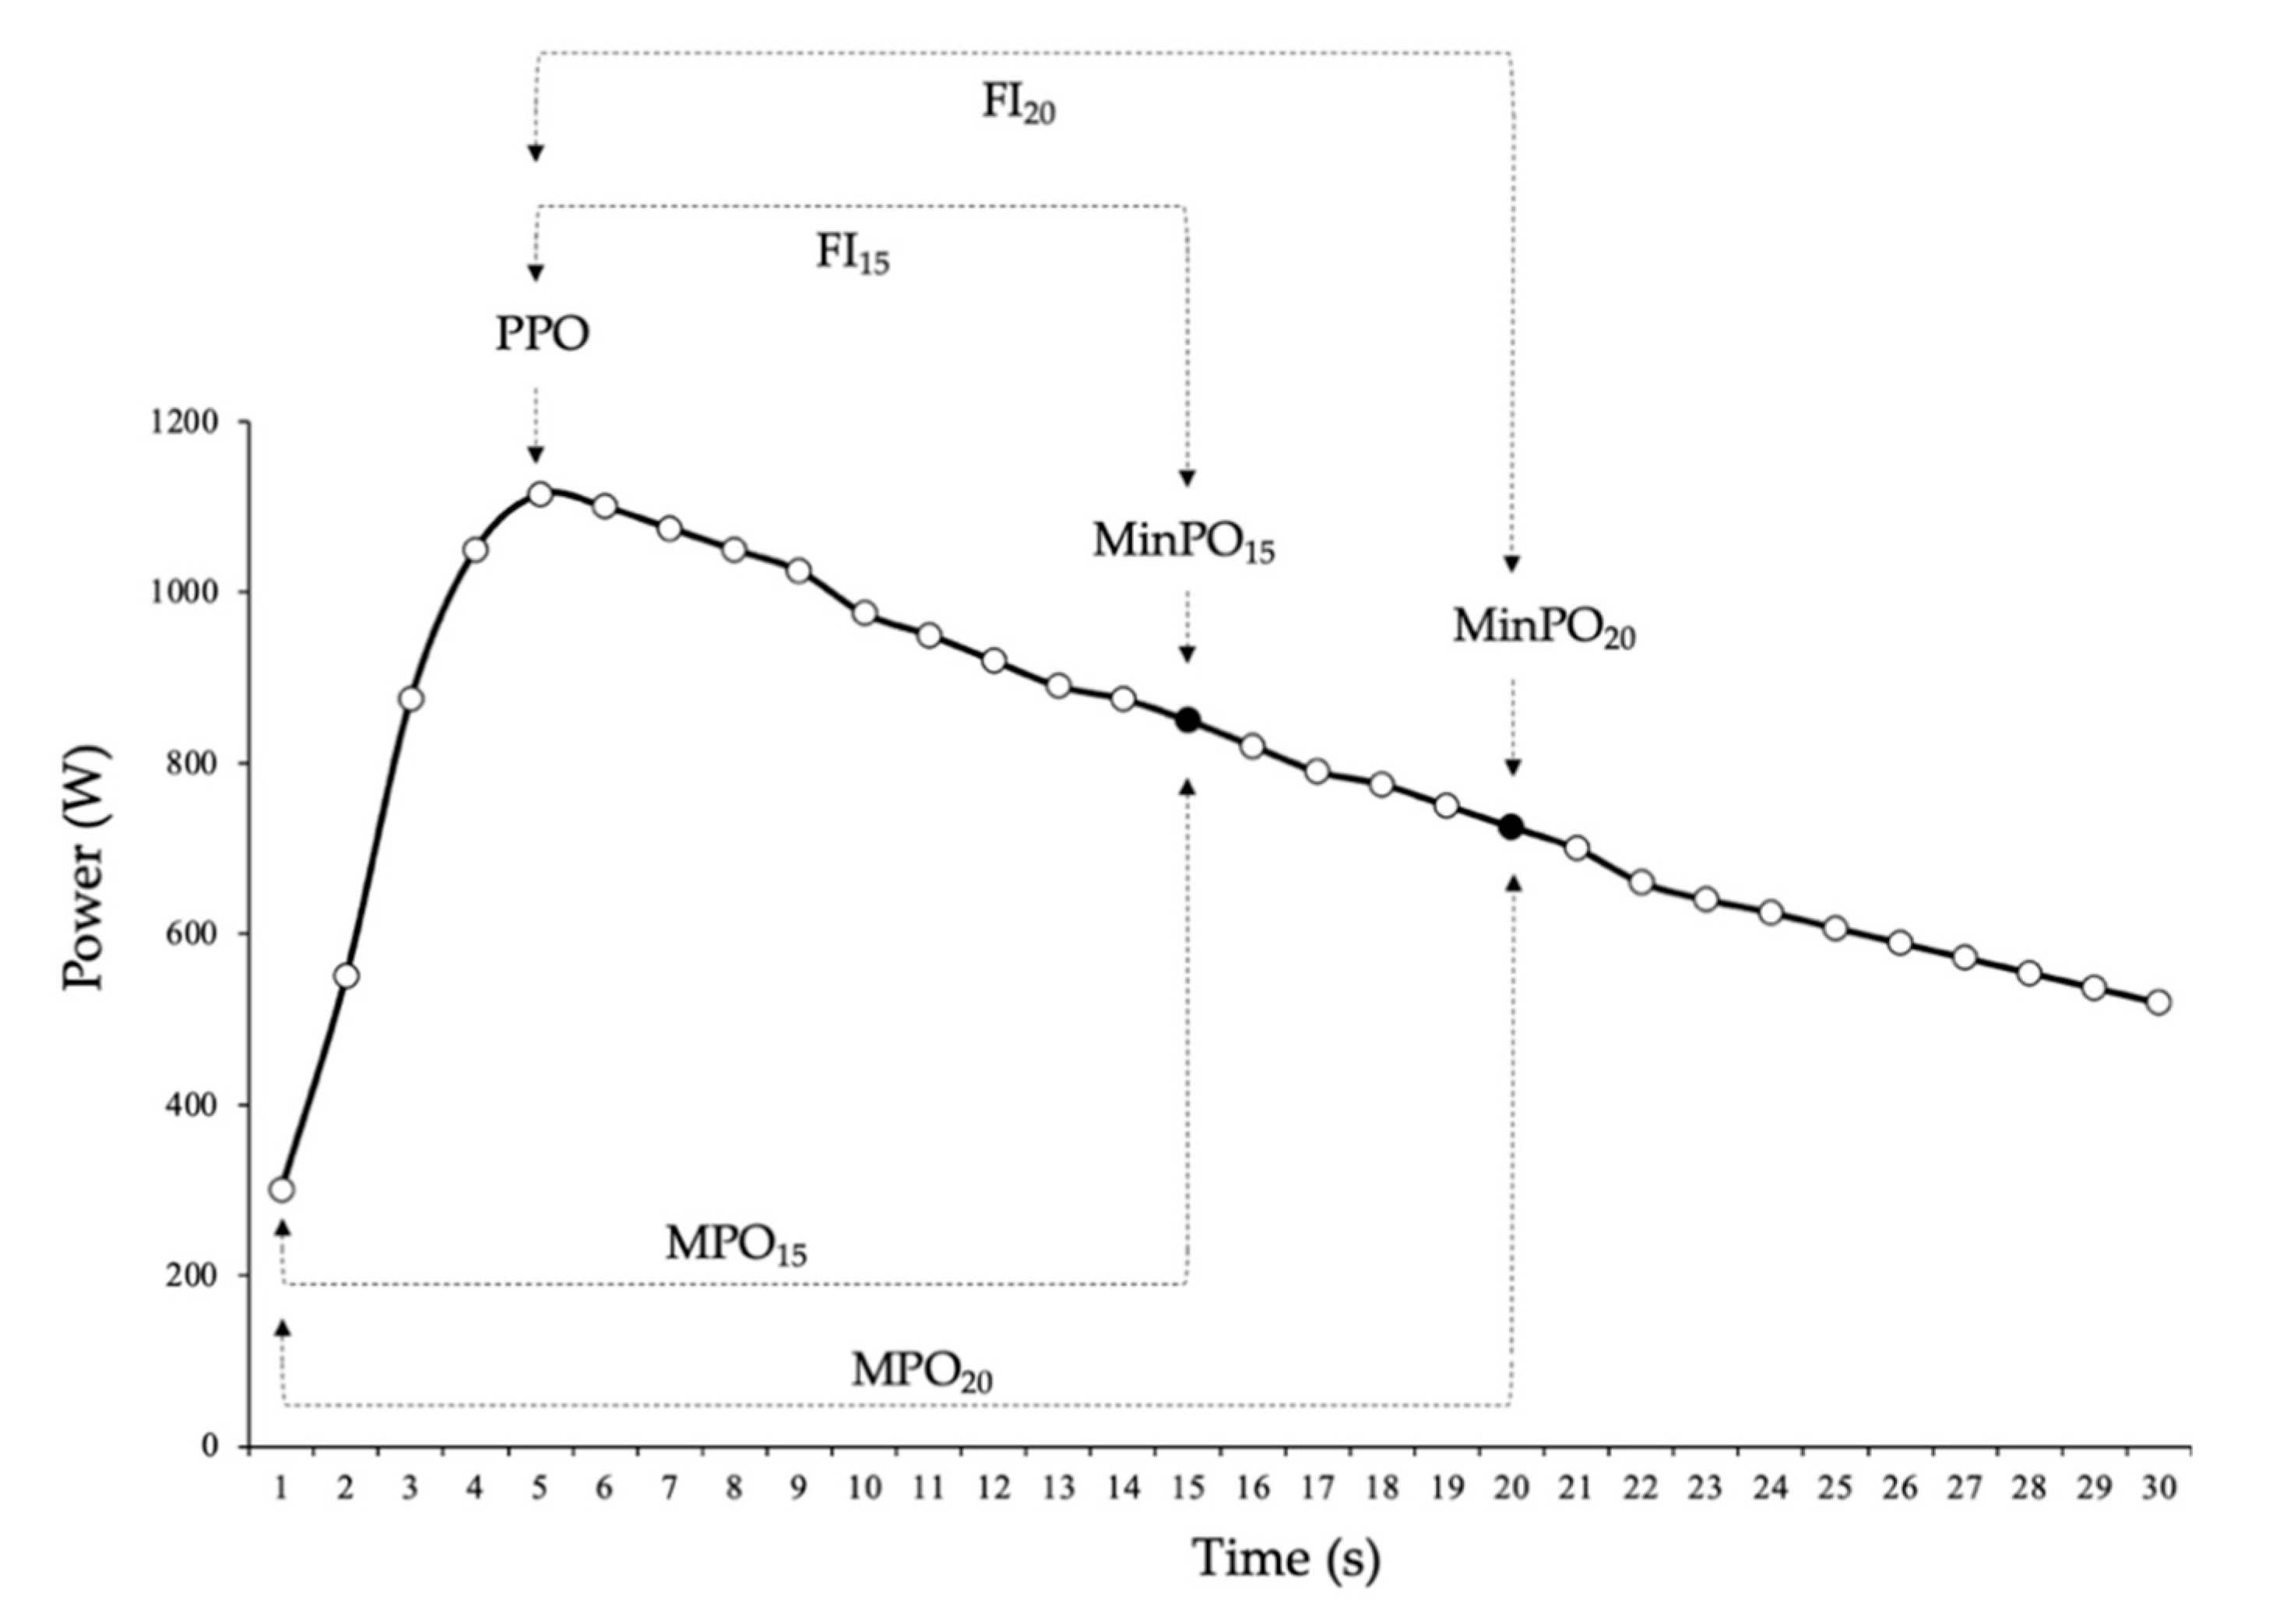
Mean Power Output (MPO): Average power output achieved throughout the trial duration.
-
Fatigue Index (FI): Percentage of power decline during the trial duration calculated as (PPO-MinPO)/PPO, where PPO and MinPO represent the peak (i.e., maximal) and minimal power outputs achieved in the test, respectively.
In Phase A, these variables were acquired for the first 15 s (WAnT15) and 20 s (WAnT20) of the same 30 s trial and used to elaborate the predictive regression models. In phase B, MPO and FI for the first 15 s and 20 s were included in the models elaborated in Phase A to obtain an estimated MPO, which was compared against the MPO of the 30 s WAnT, used as reference criterion (cross-validation).

2.3.3. Resistance Training Program

Following an initial evaluation (T0), 22 participants were randomly assigned in a counterbalanced fashion according to their initial MPO performance to the resistance training (TRAIN, n = 11) or the control (CONTROL, n = 11) group. The TRAIN group underwent a 10-week velocity-based resistance training program using the full back squat exercise. All training variables including relative intensity (60–80% 1RM), number of sets (4–5 sets), number of repetitions (8–4 repetitions), between-set recovery (4 min), and between-session recovery (72 h) were identical for all participants of the TRAIN group. In this group, relative loads were determined from the load–velocity relationship of the full squat exercise [23]. Thus, a target mean propulsive velocity to be attained in the first (usually the fastest) repetition of each training session was used as an accurate estimation of load magnitude [24]. After a standardized warm-up (5 min of running at a self-selected intensity, 5 min of joint mobilization exercises, and 3 sets of progressively faster 30 m running accelerations), adjustments in the proposed load (kg) were made when needed so that the velocity of the first repetition matched that programmed velocity (±0.03 m·s−1). Once the load (kg) was adjusted, it was maintained for the rest of the training sets during the session. Furthermore, participants were instructed to conduct each repetition as fast as possible. Repetitions during the training sessions were recorded by using a linear velocity transducer with a sampling frequency of 1000 Hz (T-Force System, Ergotech, Murcia, Spain). This technology has been tested for barbell velocity measurement with excellent results of reproducibility and repeatability, as detailed elsewhere [25,26]. On the other hand, the CONTROL group was required to fully discontinue any kind of programmed resistance or endurance stimuli other than the normal physical activity of the active life of these young adults during the 10-week period.

2.4. Statistical Analysis

Means and standard deviations (SD) were calculated for each variable. Normal distribution for all parameters (Shapiro–Wilk test) and the homogeneity of variances (Levene’s test) were analyzed and confirmed (p > 0.05). In Phase A, a multiple linear regression model (stepwise method) was conducted to examine the relationship between each time-shortened WAnT (including MPO and FI as predictor variables) and the 30 s WAnT. The following statistics were reported for each general model: adjusted coefficient of determination (R2), standard error of the estimation (SEE), and F-value (ANOVA). Furthermore, the raw (B) and standardized (ß) coefficients, and t-value (t) were used to describe each predictor variable within the model. The variance inflation factor (VIF) was included to inspect multicollinearity. If the VIF value exceeded 4.0, a high correlation between predictor variables was considered [27]. Residuals from each regression model were examined in terms of normality (Shapiro–Wilk’s test and P-P plot), independence (Durbin Watson’s test), linearity, and homoscedasticity (Q-Q plot). In Phase B, besides the Pearson’s correlation coefficient (r), intraclass correlation coefficient (ICC), and paired samples t-test, the cross-validation analysis included calculations about the magnitude of error:
-
Standard error of measurement (SEM) calculated from the square root of the mean square error term in repeated-measurements ANOVA [28]. Results were presented both in absolute (W) and relative terms as a coefficient of variation (CV = 100 SEM/mean).
-
Smallest detectable change (SDC) derived from the SEM (√2 × SEM × 1.96) as an indicator of sensitivity [29].
-
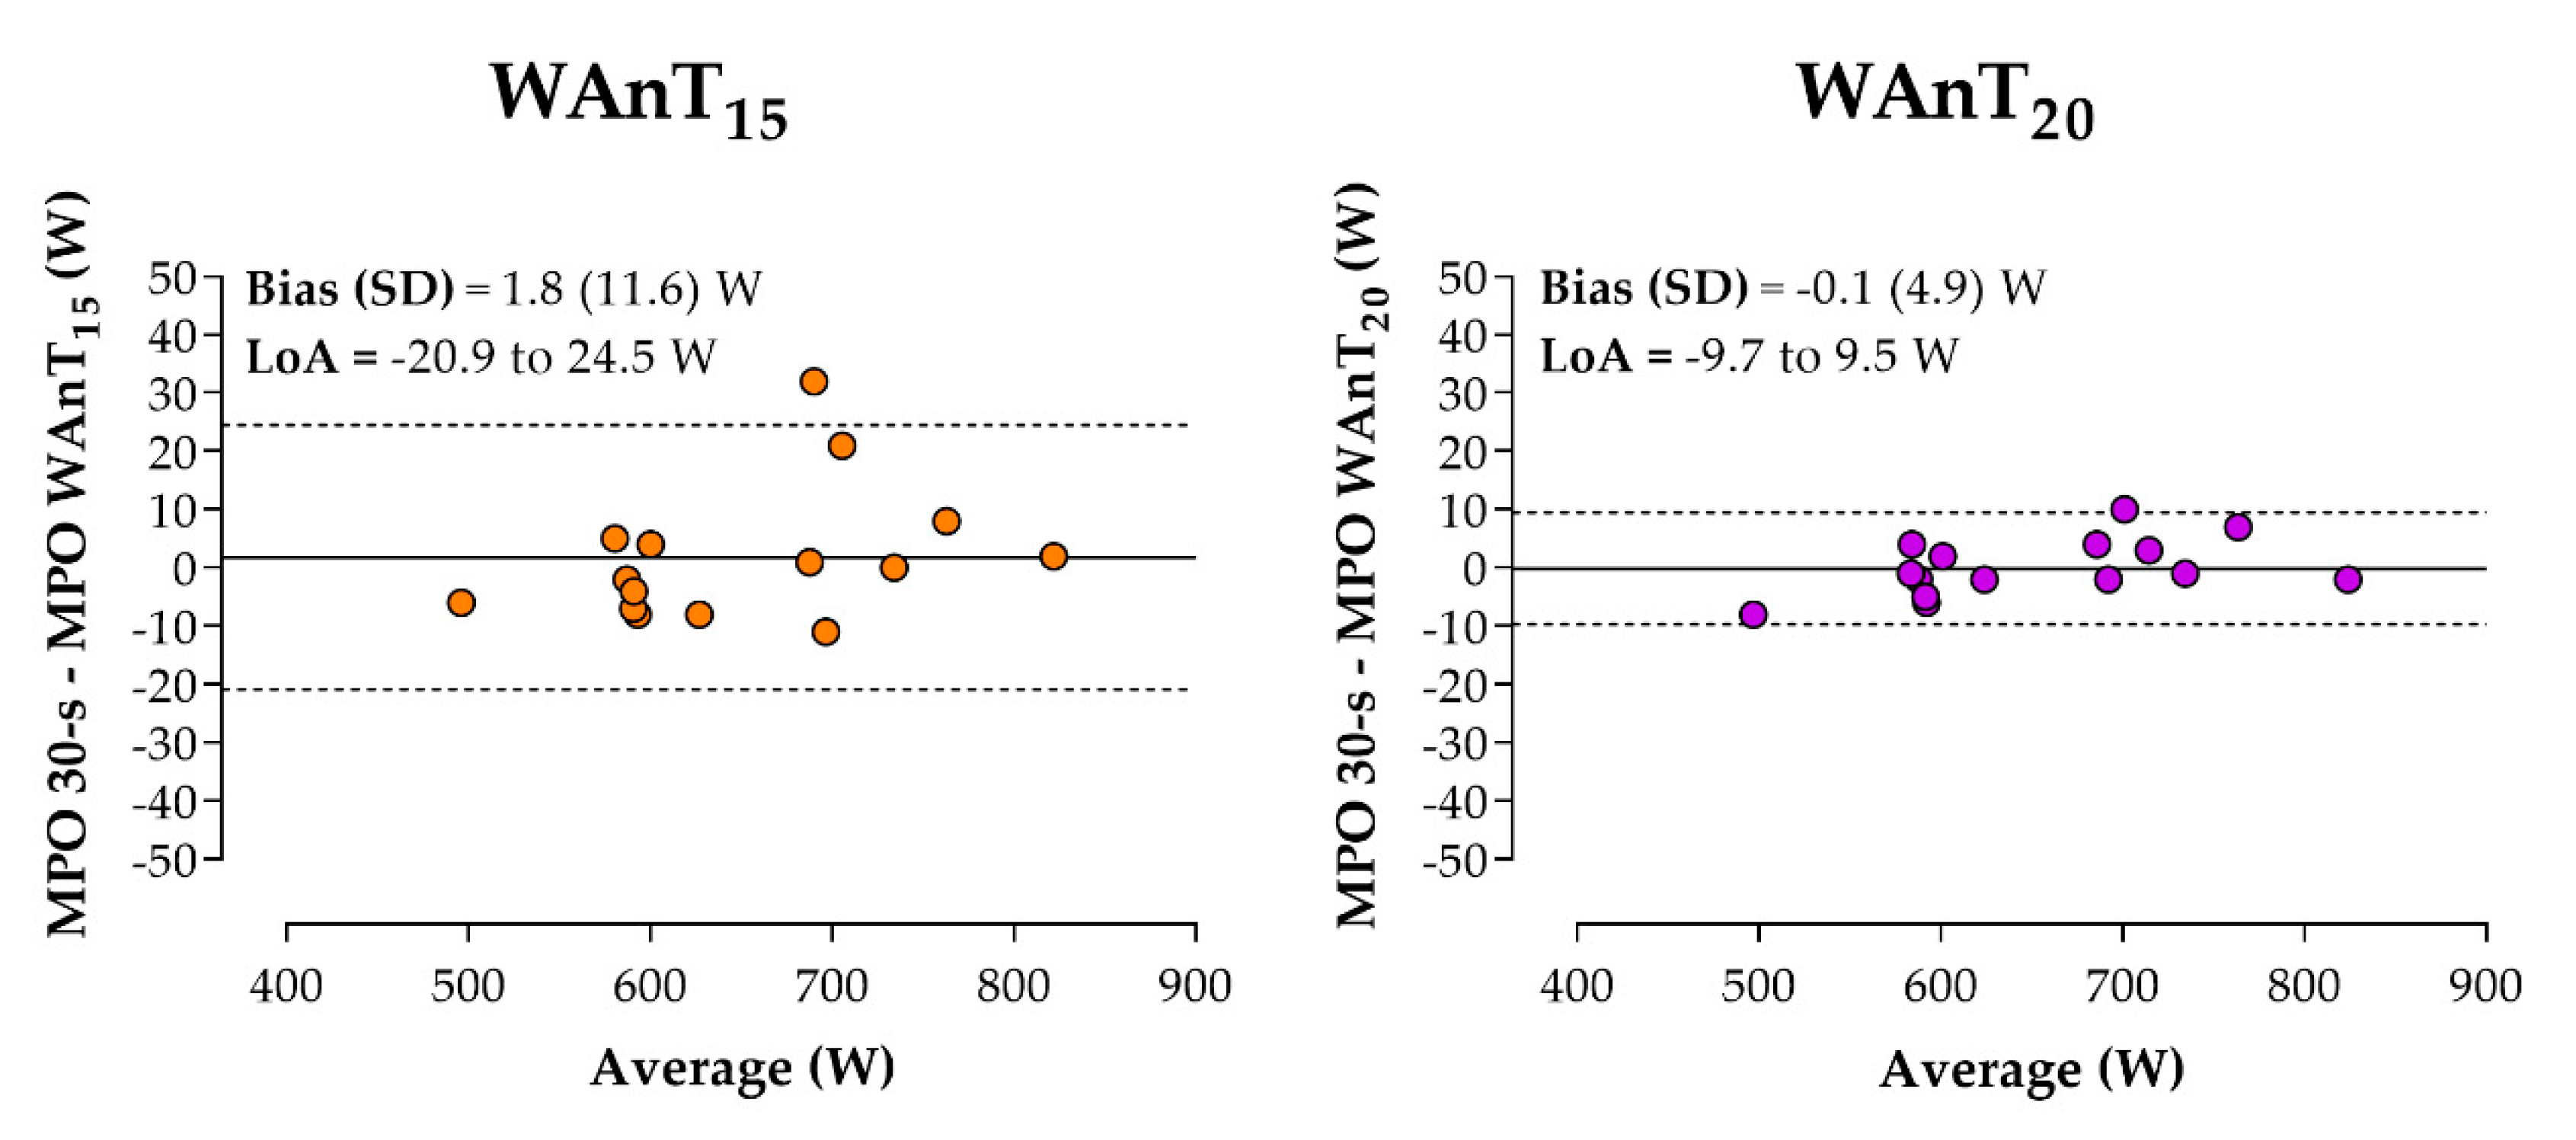
Bland–Altman plots and the calculation of systematic bias and its 95% limits of agreement (LoA = bias ± 1.96 SD) were also used to analyze the level of agreement between paired (estimated vs. criterion) MPO measurements [30].
In Phase C, training effects were analyzed by means of a 2 × 2 repeated measures ANOVA with Bonferroni post-hoc adjustments using one inter-factor (group: TRAIN vs. CONTROL) and one intra-factor (time: Pre (T0) vs. Post (T10)). Sensitivity of each time-shortened WAnT model was examined by comparing the SDC result in the cross-validation analysis (Phase B) against each subject’s change in MPO after the training intervention. Statistical significance was accepted at p < 0.05. The required sample size for the intervention was determined by statistical power calculation [31] on the basis of previous studies that described the variability on the WAnT MPO in a similar sample [6] and determined the changes after a training intervention [13]. Ten subjects would be required to detect changes of 30 ± 25 W in the WAnT MPO, with a power of 0.90 and two-tailed α level set at 0.05. For the validity analysis, 12 pairs of data would be enough to identify differences below 30 W with an expected mean difference of 10 ± 5 W [32]. Calculations were performed using SPSS software version 17.0 (SPSS, Chicago, IL, USA), MedCalc Statistical Software version 18.2.1 (MedCalc Software bvba, Ostend, Belgium; http://www.medcalc.org; 2018), and GraphPad Prism 6.0 (GraphPad Software Inc., CA, USA).

3. Results

3.1. Regression Models (Phase A)

Residuals from the two models were found to be normal (p > 0.05), independent (Durbin Watson = 1.47–1.73), and fulfilled the assumption of homoscedasticity and linearity. Furthermore, the two predictor variables (MPO and FI) significantly contributed to the goodness of the models (p < 0.001), specifically MPO (ß ≥ 0.94), and no multicollinearity was found (VIF < 1.07). Both the WAnT15 (R2 = 0.98, SEE = 12.9 W, F-value = 1042.5, p < 0.001) and WAnT20 (R2 = 0.99, SEE = 9.4 W, F-value = 1963.2, p < 0.001) regression models were a good fit to the 30 s MPO (Table 1).

3.2. Cross-Validation Analysis (Phase B)

Results for the cross-validation analysis are presented in Table 2.
MPO estimated by the two models showed a high agreement (r ≥ 0.99, ICC ≥ 0.99) and no significant differences (p > 0.05) with the 30 s MPO (reference criterion). Nevertheless, the magnitude of error both in absolute and relative terms was lower for the WAnT20 (SDC = 9.3 W, CV = 0.5%) than for the WAnT15 (SDC = 22.2 W, CV = 1.2%). Similarly, Bland–Altman plots (Figure 3) exhibited lower bias for MPO estimated by the WAnT20 (bias = −0.1 W) compared to that estimated by the WAnT15 (bias = 1.8 W).

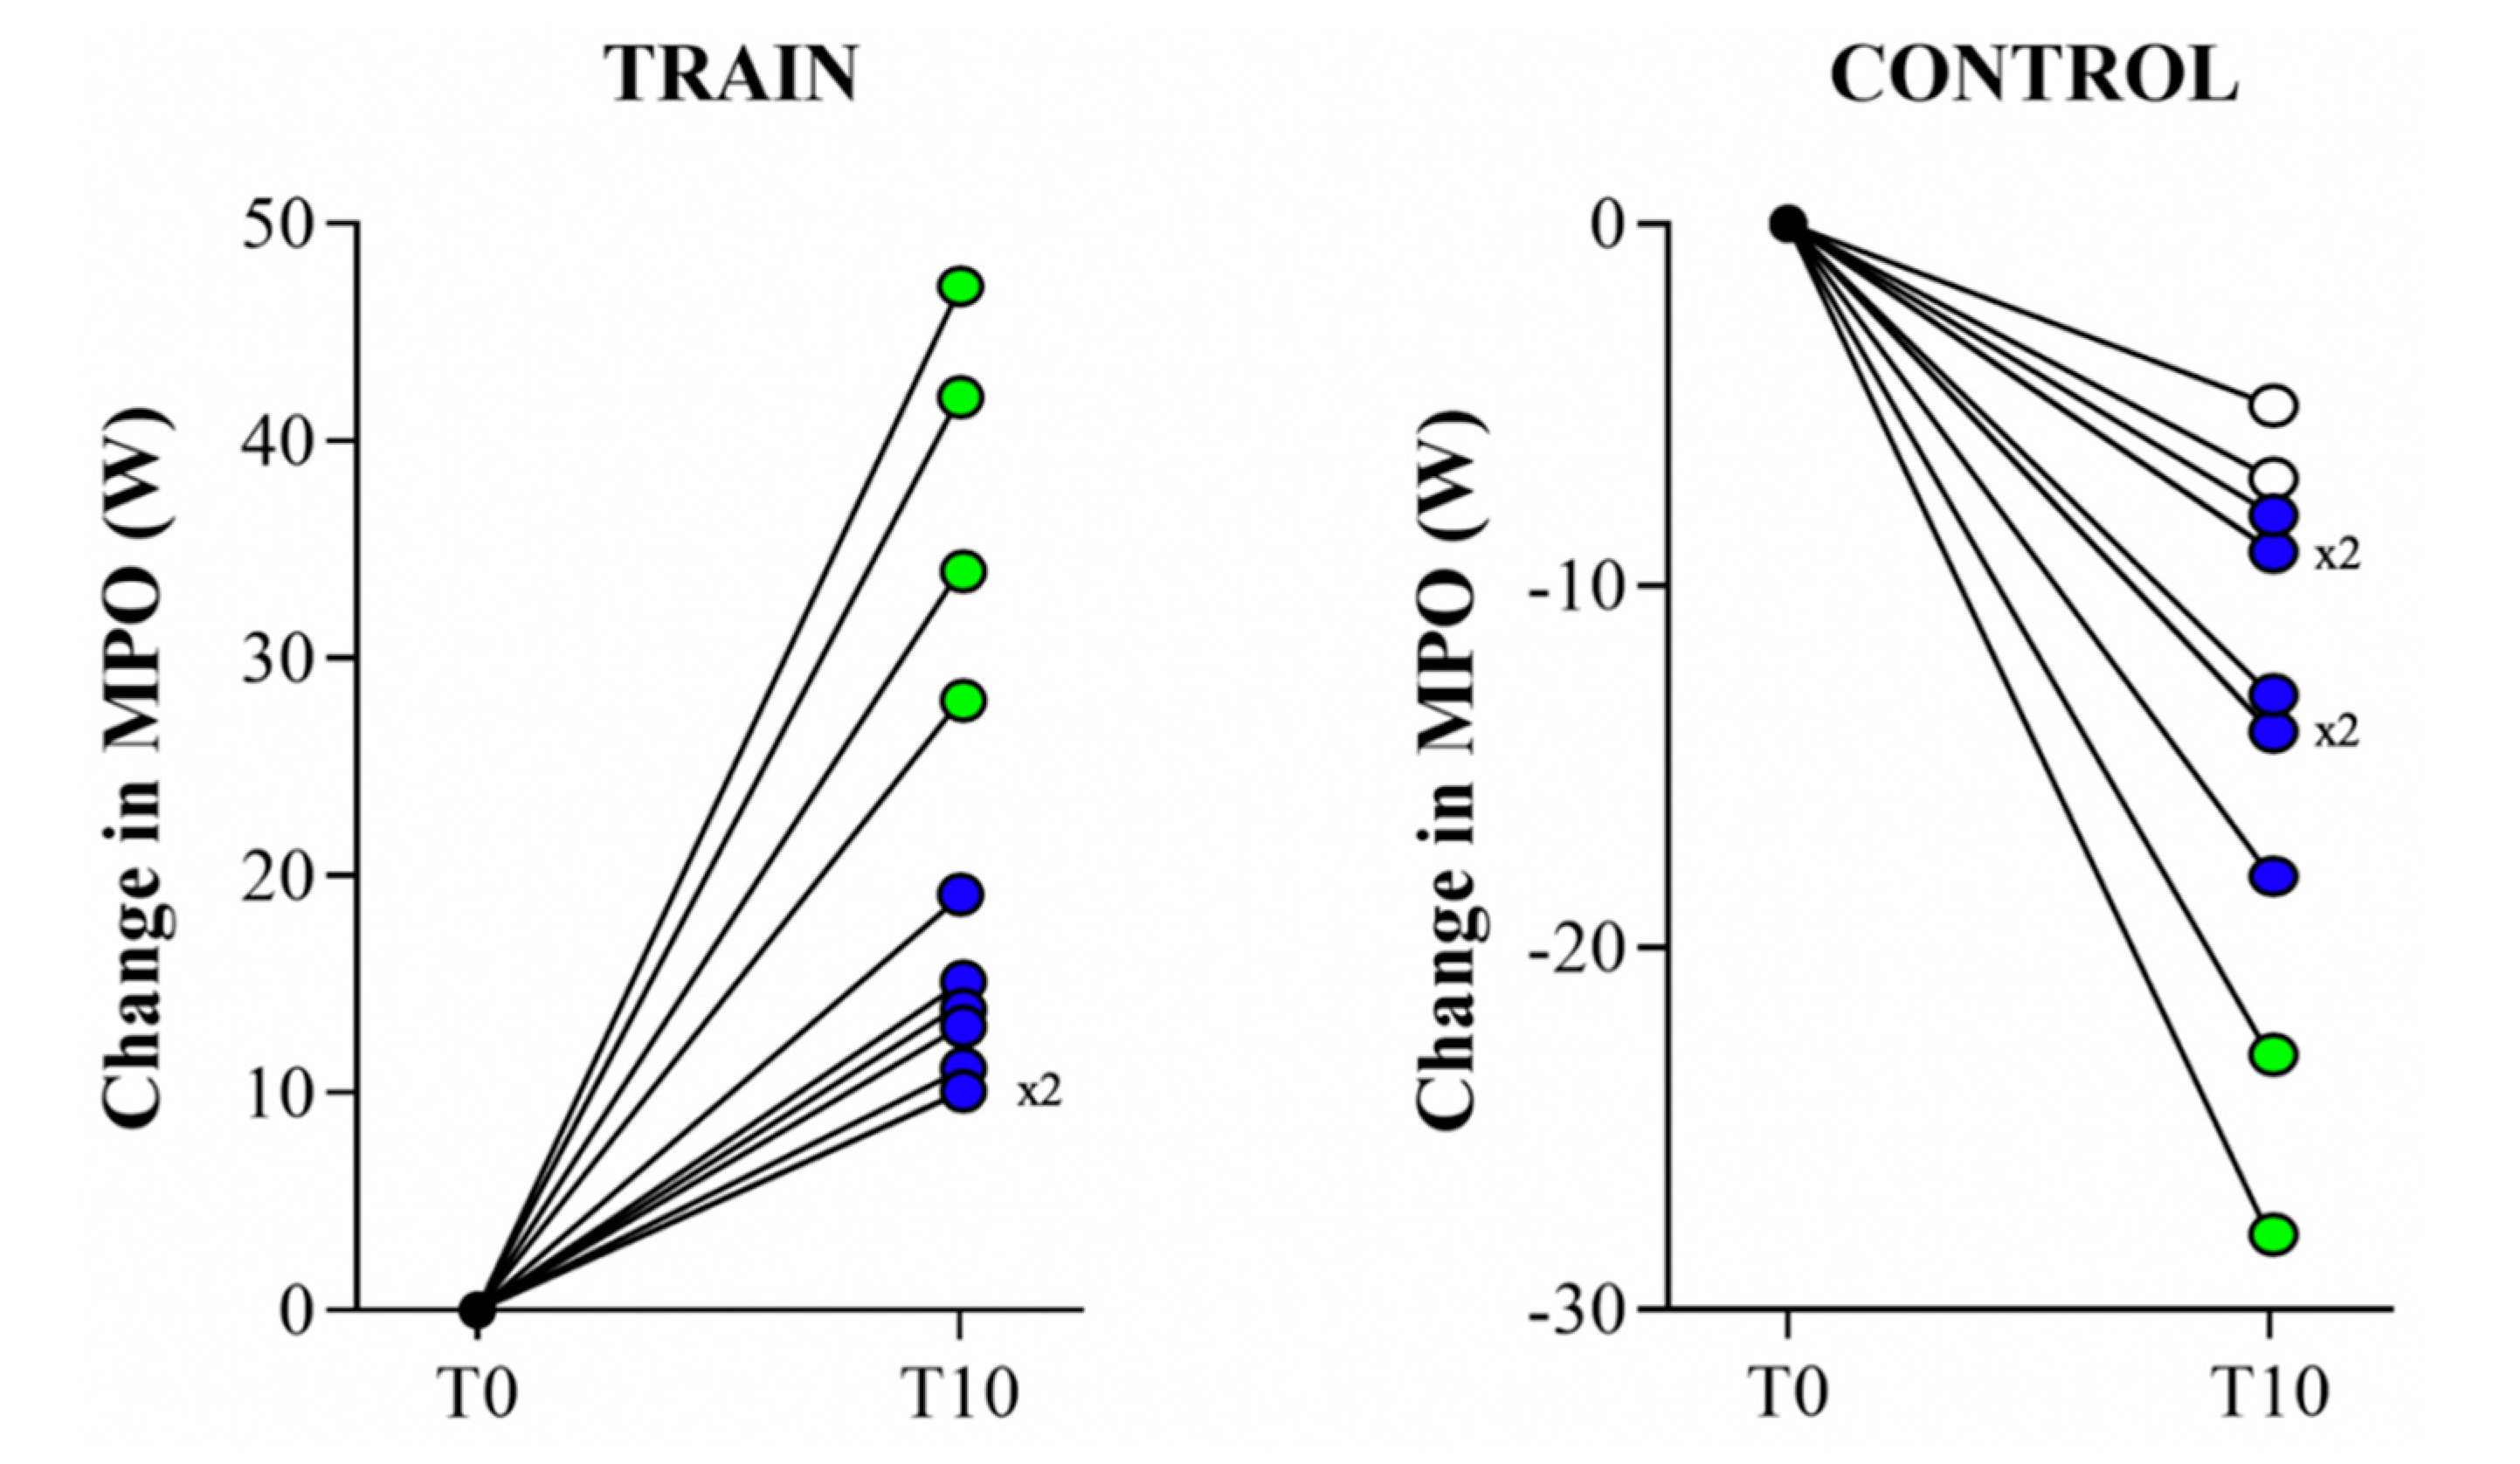
3.3. Sensitivity to Detect Power Changes (Phase C)

There were no dropouts during the study, and compliance with the resistance training program was 100% of all sessions scheduled. All participants in the TRAIN group increased performance in MPO (mean = 22 W), whereas it decreased for all subjects in the CONTROL group (mean = −13 W). Significant “time × group” interaction was observed in favor of the TRAIN group (F-value = 58.813, p < 0.001).
Individual change in MPO for subjects of each group is illustrated in Figure 4. As it can be observed, the WAnT20 was able to identify pre–post MPO changes in 11/11 (100%) and 9/11 (81.8%) participants in the TRAIN and CONTROL groups, respectively. On the other hand, the WAnT15 detected MPO changes in 4/11 (36.4%) subjects in the TRAIN group and 2/11 (18.2%) subjects in the CONTROL group.

4. Discussion

This study examined the validity and sensitivity of two time-shortened versions (15 s and 20 s) of the original 30 s WAnT by directly measuring the main variable (power output) using a power meter device. The main finding is that both WAnT15 and WAnT20 are useful strategies to replace the traditional 30 s WAnT. In particular, the WAnT20 showed the highest fit and lowest magnitude of error when compared with the criterion (30 s MPO). Furthermore, the WAnT20 model was found to be more sensitive than the WAnT15 in identifying changes in MPO after a training or detraining period.
The high agreement found by the current study for both time-shortened WAnT models is in line with previous investigations examining the capability of the 15 s and 20 s WAnT to predict 30 s MPO. In this regard, Attia et al. [6] found a close relationship (R2 = 0.98) between a time-reduced 20 s WAnT and the traditional 30 s WAnT. Similarly, Stickley et al. [16] reported a high agreement between MPO estimated by a 20 s WAnT model and the 30 s MPO (R2 = 0.99). Moreover, in accordance with our findings, Stickley et al. [16] found the 20 s model closer to the traditional WAnT than the 15 s model (R2 = 0.97). For the first time, our prediction models include the FI as a predictor variable to estimate MPO. The FI relates to the time-course power decline during the test [2], so it seems a useful parameter to reduce the possible overestimation bias and increase the accuracy of the prediction (Figure 3).
When the cross-validation of the two regression models was examined (Phase B), estimated MPO by both time-shortened proposals, especially the WAnT20, showed a high agreement and reduced magnitude of error compared to the 30 s MPO (Table 2). This superior predictive capability of the WAnT20 could be due to the additional 5 s included in this proposal. Regarding the error generated by each model, a time-shortened WAnT could be considered useful if it has sufficient sensitivity to detect changes in the variable of interest (i.e., SDC ≤ change in MPO) [25,26]. For the first time, in order to practically interpret this sensitivity, the current research compared the SDC obtained by each time-shortened model in the cross-validation analysis with the changes in MPO after a resistance training or detraining period. After the 10-week intervention, the TRAIN group increased the MPO by 22.1 W, whereas the CONTROL group decreased the MPO by 13.5 W. When the changes were interpreted individually, it was found that the WAnT20 model was able to detect MPO changes in 11/11 and 9/11 participants in the TRAIN and CONTROL groups, respectively; whereas this sensitivity substantially decreased for the WAnT15 (4/11 subjects in the TRAIN group and 2/11 subjects in the CONTROL group) (Figure 4). Extending this practical interpretation (based on SDC) to other long-term interventions, both models would be sensitive to detect changes in MPO after programs including low/moderate-level subjects [13,33]. On the contrary, the WAnT15 would fail to identify changes in high-level athletes, whose changes in MPO are commonly slighter [34,35]. Similarly, whereas both time-shortened WAnTs would be useful to identify the effects on performance of some ergogenic aids [36,37,38,39,40,41] or the circadian rhythms [42], the WAnT15 would lack the capability to accurately detect the acute effects of some pre-exercise strategies like the post-activation potentiation or the foam roller warm-up [43,44]. Thus, the higher sensitivity of the WAnT20 makes it the best candidate, among those analyzed, to replace the traditional 30 s WAnT. In addition, the WAnT20 decreases the negative side effects (e.g., discomfort) produced during the traditional WAnT in 93% of participants [45], so it would be possible that additional benefits from a further reduction in the duration of the test (i.e., WAnT15) would not outweigh the lower sensitivity of the test. Nevertheless, future studies are encouraged to complement the validity analysis of both abbreviated proposals by evaluating their physiological effects. Thus, it would be of great interest to know if performing 5 additional seconds (i.e., WAnT20) would generate an exponential increase of metabolic waste products that could compromise the athlete’s physical status in the coming training sessions.

5. Conclusions

Our results suggest that MPO values from the traditional 30 s WAnT can be accurately estimated by using the time-shortened 15 s and 20 s WAnT versions. Nevertheless, due to its higher sensitivity, physiologist, coaches, and athletes are encouraged to use the WAnT20 to replace the 30 s WAnT. By doing so, practitioners could reduce the acute negative side effects associated with the excessive fatigue produced by the original protocol. Furthermore, the WAnT20 requires less recovery, which is especially interesting when the WAnT is performed together with a battery of evaluations (e.g., sprint time, jump height, VO2max, etc.).

Author Contributions

Conceptualization, A.H.-B. and Á.B.-R.; methodology, J.G.P., R.M.-R., and J.C.-I.; investigation, A.M.-C. and Á.B.-R.; data curation, A.H.-B., J.C.-I., and A.M.-C.; writing—original draft preparation, A.H.-B., J.C.-I., and R.M.-R.; writing—review and editing, J.G.P. and A.H.-B., supervision, J.G.P., R.M.-R., and J.C.-I. All authors have read and agreed to the published version of the manuscript.

Funding

This research received no external funding.

Acknowledgments

The authors wish to thank the participants for their invaluable contribution to the study.

Conflicts of Interest

The authors declare no conflict of interest.

References

  1. Bar-Or, O.; Dotan, R.; Inbar, O.; Rothstein, A.; Karlsson, J.; Tesch, P. Anaerobic Capacity and Muscle Fiber Type Distribution in Man. Endoscopy 1980, 1, 82–85. [Google Scholar] [CrossRef]
  2. Bar-Or, O. The Wingate Anaerobic Test. Sports Med. 1987, 4, 381–394. [Google Scholar] [CrossRef]
  3. Jacobs, P.L.; Mahoney, E.T.; Johnson, B. Reliability of arm Wingate Anaerobic Testing in persons with complete paraplegia. J. Spinal Cord Med. 2003, 26, 141–144. [Google Scholar] [CrossRef]
  4. Maud, P.J.; Shultz, B.B. Norms for the Wingate Anaerobic Test with Comparison to Another Similar Test. Res. Q. Exerc. Sport 1989, 60, 144–151. [Google Scholar] [CrossRef]
  5. Morán-Navarro, R.; Pérez, C.E.; Mora-Rodriguez, R.; De La Cruz-Sánchez, E.; González-Badillo, J.J.; Sánchez-Medina, L.; Pallarés, J.G. Time course of recovery following resistance training leading or not to failure. Graefe Arch. Clin. Exp. Ophthalmol. 2017, 117, 2387–2399. [Google Scholar] [CrossRef] [PubMed]
  6. Attia, A.; Hachana, Y.; Chaabene, H.; Gaddour, A.; Neji, Z.; Shephard, R.J.; Chelly, M.S. Reliability and Validity of a 20-s Alternative to the Wingate Anaerobic Test in Team Sport Male Athletes. PLoS ONE 2014, 9, e114444. [Google Scholar] [CrossRef] [PubMed]
  7. Dallmeijer, A.J.; Scholtes, V.A.; Brehm, M.-A.; Becher, J.G. Test-Retest Reliability of the 20-sec Wingate Test to Assess Anaerobic Power in Children with Cerebral Palsy. Am. J. Phys. Med. Rehabil. 2013, 92, 762–767. [Google Scholar] [CrossRef] [PubMed]
  8. Hachana, Y.; Attia, A.; Chaabène, H.; Gallas, S.; Sassi, R.H.; Dotan, R. Test-retest reliability and circadian performance variability of a 15-s Wingate Anaerobic Test. Biol. Rhythm. Res. 2012, 43, 413–421. [Google Scholar] [CrossRef]
  9. Hachana, Y.; Attia, A.; Nassib, S.; Shephard, R.J.; Chelly, M.S. Test-Retest Reliability, Criterion-Related Validity, and Minimal Detectable Change of Score on an Abbreviated Wingate Test for Field Sport Participants. J. Strength Cond. Res. 2012, 26, 1324–1330. [Google Scholar] [CrossRef]
  10. Kavaliauskas, M.; Phillips, S.M. Reliability and sensitivity of the 6 and 30 second Wingate tests in physically active males and females. Isokinet. Exerc. Sci. 2016, 24, 277–284. [Google Scholar] [CrossRef] [Green Version]
  11. Laurent, C.M.; Meyers, M.C.; Robinson, C.A.; Green, J.M. Cross-validation of the 20- versus 30-s Wingate anaerobic test. Graefe Arch. Clin. Exp. Ophthalmol. 2007, 100, 645–651. [Google Scholar] [CrossRef]
  12. Zajac, A.; Jarzabek, R.; Waskiewicz, Z. The diagnostic value of the 10− and 30-second Wingate test for competitive athletes. J. Strength Cond. Res. 1999, 13, 16–19. [Google Scholar] [CrossRef]
  13. Pallarés, J.G.; Cava, A.M.; Courel-Ibáñez, J.; González-Badillo, J.J.; Morán-Navarro, R. Full squat produces greater neuromuscular and functional adaptations and lower pain than partial squats after prolonged resistance training. Eur. J. Sport Sci. 2019, 20, 115–124. [Google Scholar] [CrossRef] [PubMed]
  14. Pallarés, J.G.; Lillo-Bevia, J.R.; Morán-Navarro, R.; Cerezuela-Espejo, V.; Mora-Rodriguez, R. Time to exhaustion during cycling is not well predicted by critical power calculations. Appl. Physiol. Nutr. Metab. 2020, 45, 753–760. [Google Scholar] [CrossRef] [PubMed]
  15. Pallarés, J.G.; Morán-Navarro, R. Methodological approach to the cardiorespiratory endurance training. J. Sport Heal. Res. 2012, 4, 119–136. [Google Scholar]
  16. Stickley, C.D.; Hetzler, R.K.; Kimura, I.F. Prediction of Anaerobic Power Values from an Abbreviated WAnT Protocol. J. Strength Cond. Res. 2008, 22, 958–965. [Google Scholar] [CrossRef]
  17. Lakomy, H.K.A. Measurement of work and power output using friction-loaded cycle ergometers. Ergonomics 1986, 29, 509–517. [Google Scholar] [CrossRef]
  18. Reiser, R.F.; Broker, J.P.; Peterson, M.L. Inertial effects on mechanically braked Wingate power calculations. Med. Sci. Sports Exerc. 2000, 32, 1660–1664. [Google Scholar] [CrossRef]
  19. MacIntosh, B.R.; Bryan, S.N.; Rishaug, P.; Norris, S.R. Evaluation of the Monark Wingate Ergometer by Direct Measurement of Resistance and Velocity. Can. J. Appl. Physiol. 2001, 26, 543–558. [Google Scholar] [CrossRef]
  20. Pallarés, J.G.; Lillo-Bevia, J.R. Validity and Reliability of the PowerTap P1 Pedals Power Meter. J. Sports Sci. Med. 2018, 17, 305–311. [Google Scholar]
  21. Lillo-Bevia, J.R.; Pallarés, J.G. Validity and Reliability of the Cycleops Hammer Cycle Ergometer. Int. J. Sports Physiol. Perform. 2018, 13, 853–859. [Google Scholar] [CrossRef] [PubMed]
  22. Rudsits, B.L.; Hopkins, W.G.; Hautier, C.A.; Rouffet, D. Force-velocity test on a stationary cycle ergometer: Methodological recommendations. J. Appl. Physiol. 2018, 124, 831–839. [Google Scholar] [CrossRef] [PubMed]
  23. Martínez-Cava, A.; Morán-Navarro, R.; Sánchez-Medina, L.; González-Badillo, J.J.; Pallarés, J.G. Velocity- and power-load relationships in the half, parallel and full back squat. J. Sports Sci. 2018, 37, 1088–1096. [Google Scholar] [CrossRef]
  24. Morán-Navarro, R.; Martínez-Cava, A.; Sánchez-Medina, L.; Mora-Rodriguez, R.; González-Badillo, J.J.; Pallarés, J.G. Movement Velocity as a Measure of Level of Effort During Resistance Exercise. J. Strength Cond. Res. 2019, 33, 1496–1504. [Google Scholar] [CrossRef] [PubMed]
  25. Martínez-Cava, A.; Hernández-Belmonte, A.; Courel-Ibáñez, J.; Morán-Navarro, R.; González-Badillo, J.J.; Pallarés, J.G. Reliability of technologies to measure the barbell velocity: Implications for monitoring resistance training. PLoS ONE 2020, 15, e0232465. [Google Scholar]
  26. Courel-Ibáñez, J.; Martínez-Cava, A.; Morán-Navarro, R.; Escribano-Peñas, P.; Chavarren-Cabrero, J.; González-Badillo, J.J.; Pallarés, J.G. Reproducibility and Repeatability of Five Different Technologies for Bar Velocity Measurement in Resistance Training. Ann. Biomed. Eng. 2019, 47, 1523–1538. [Google Scholar] [CrossRef]
  27. Hair, J.; Black, W.; Babin, B.; Anderson, R. Multivariate Data Analysis: A Global Perspective.; Pearson Education: London, UK, 2010. [Google Scholar]
  28. Atkinson, G.; Nevill, A.M. Statistical Methods for Assessing Measurement Error (Reliability) in Variables Relevant to Sports Medicine. Sports Med. 1998, 26, 217–238. [Google Scholar] [CrossRef]
  29. Beckerman, H.; Roebroeck, M.; Lankhorst, G.; Becher, J.; Bezemer, P.; Verbeek, A. Smallest real difference, a link between reproducibility and responsiveness. Qual. Life Res. 2001, 10, 571–578. [Google Scholar] [CrossRef]
  30. Bland, J.M.; Altman, D. Statistical methods for assessing agreement between two methods of clinical measurement. Lancet 1986, 327, 307–310. [Google Scholar] [CrossRef]
  31. Machin, D.; Campbell, M.J.; Tan, S.B.; Tan, S.H. Sample Size Tables for Clinical Studies; John Wiley and Sons: Hoboken, NJ, USA, 2008. [Google Scholar]
  32. Lu, M.-J.; Zhong, W.-H.; Liu, Y.-X.; Miao, H.; Li, Y.-C.; Ji, M.-H. Sample Size for Assessing Agreement between Two Methods of Measurement by Bland−Altman Method. Int. J. Biostat. 2016, 12, 12. [Google Scholar] [CrossRef] [Green Version]
  33. Siahkouhian, M.; Khodadadi, D.; Shahmoradi, K. Effects of high-intensity interval training on aerobic and anaerobic indices: Comparison of physically active and inactive men. Sci. Sports 2013, 28, e119–e125. [Google Scholar] [CrossRef]
  34. Rønnestad, B.R.; Hansen, E.A.; Raastad, T. Effect of heavy strength training on thigh muscle cross-sectional area, performance determinants, and performance in well-trained cyclists. Graefe’s Arch. Clin. Exp. Ophthalmol. 2009, 108, 965–975. [Google Scholar] [CrossRef] [Green Version]
  35. Rønnestad, B.R.; Hansen, J.; Nygaard, H. 10 weeks of heavy strength training improves performance-related measurements in elite cyclists. J. Sports Sci. 2016, 35, 1435–1441. [Google Scholar] [CrossRef] [PubMed]
  36. Barros, M.P.; Ganini, D.; De Lorenço-Lima, L.; Soares, C.O.; Pereira, B.; Bechara, E.J.H.; Silveira, L.R.; Curi, R.; Souza-Junior, T.P. Effects of acute creatine supplementation on iron homeostasis and uric acid-based antioxidant capacity of plasma after wingate test. J. Int. Soc. Sports Nutr. 2012, 9, 25. [Google Scholar] [CrossRef] [PubMed] [Green Version]
  37. Domínguez, R.; García-Fernández, P.; Cuenca, E.; Muñoz-González, A.; Muñoz-González, A.; De Jesús, F.; Veiga-Herreros, P.; Da Silva, S.F.; Maté-Muñoz, J.L.; Maté-Muñoz, J.L. Effects of Beetroot Juice Supplementation on a 30-s High-Intensity Inertial Cycle Ergometer Test. Nutrients 2017, 9, 1360. [Google Scholar] [CrossRef] [PubMed] [Green Version]
  38. Martinez, N.; Campbell, B.; Franek, M.; Buchanan, L.; Colquhoun, R. The effect of acute pre-workout supplementation on power and strength performance. J. Int. Soc. Sports Nutr. 2016, 13, 29. [Google Scholar] [CrossRef] [Green Version]
  39. Durkalec-Michalski, K.; Zawieja, E.E.; Zawieja, B.E.; Michałowska, P.; Podgórski, T. The gender dependent influence of sodium bicarbonate supplementation on anaerobic power and specific performance in female and male wrestlers. Sci. Rep. 2020, 10, 1–12. [Google Scholar] [CrossRef]
  40. Durkalec-Michalski, K.; Nowaczyk, P.M.; Adrian, J.; Kamińska, J.; Podgórski, T. The influence of progressive-chronic and acute sodium bicarbonate supplementation on anaerobic power and specific performance in team sports: A randomized, double-blind, placebo-controlled crossover study. Nutr. Metab. 2020, 17, 1–15. [Google Scholar] [CrossRef]
  41. Durkalec-Michalski, K.; Zawieja, E.E.; Podgórski, T.; Zawieja, B.; Michałowska, P.; Łoniewski, I.; Jeszka, J. The Effect of a New Sodium Bicarbonate Loading Regimen on Anaerobic Capacity and Wrestling Performance. Nutrients 2018, 10, 697. [Google Scholar] [CrossRef] [Green Version]
  42. Souissi, N.; Bessot, N.; Chamari, K.; Gauthier, A.; Sesboüé, B.; Davenne, D. Effect of Time of Day on Aerobic Contribution to the 30-s Wingate Test Performance. Chrono. Int. 2007, 24, 739–748. [Google Scholar] [CrossRef]
  43. Yildiz, M.; Bozdemir, M.; Akyıldız, Z. Acute effects of pre-exercise foam rolling in addition to dynamic stretching on anaerobic power. J. Phys. Educ. Sport. 2011, 12, 73–80. [Google Scholar]
  44. Doma, K.; Leicht, A.S.; Schumann, M.; Nagata, A.; Senzaki, K.; Woods, C.E. Postactivation potentiation effect of overloaded cycling on subsequent cycling Wingate performance. J. Sports Med. Phys. Fit. 2019, 59, 217–222. [Google Scholar] [CrossRef]
  45. Marquardt, J.A.; Bacharach, D.W.; Kotly, J.M. 608 PREDICTING 30 SECOND MINIMUM POWER FROM A 20 SECOND WINGATE TEST. Med. Sci. Sports Exerc. 1993, 25, S108. [Google Scholar] [CrossRef]
Figure 1. SRM® power meter (Panel B) adapted to the Monark® friction belt cycle ergometer (Panel A). This technology obtained the power variable (force × velocity) multiplying the strain gauge deformation on the shafts of both cranks (force) by the revolution per second registered through reed switch triggers (velocity).
Applsci 10 08002 g001
Figure 2. A representative example of the instantaneous power output during the traditional 30 s Wingate Anaerobic Test (WAnT) and specific values used to calculate the predictor variables included in the regression models. PPO: Peak power output, MinPO: Minimal power output, MPO: Mean power output, FI: Fatigue index.
Applsci 10 08002 g002
Figure 3. Cross-validation analysis. Bland–Altman plots comparing the MPO estimated by the 15 s (WAnT15) and 20 s (WAnT20) models, and the 30 s MPO (reference criterion). LoA: limits of agreement (LoA = bias ± 1.96 SD).
Applsci 10 08002 g003
Figure 4. Power changes (W) in the standard 30 s WAnT performed before (T0) and after (T10) the 10-week velocity-based resistance training program (TRAIN) or a detraining period (CONTROL). Based on the SDC obtained in the cross-validation analysis (WAnT15 = 22.2 W; WAnT20 = 9.3 W), color at T10 indicates change detected by both the WAnT15 and WAnT20 (green circles), change detected only by the WAnT20 (blue circles), and changes not detected by either WAnT15 or WAnT20 (white circles). ×2: two individuals with the same change.
Applsci 10 08002 g004
Table 1. Regression models to estimate 30 s mean power output (MPO) using the MPO and the fatigue index (FI) obtained in the first 15 (WAnT15) and 20 (WAnT20) seconds of the test.
ModelVariableBB 95% CIßtp
WAnT15
Y-Intercept114.33 (18.74)76.36 to 152.29 6.10<0.001
MPO0.81 (0.019)0.77 to 0.850.9442.27<0.001
FI−205.70 (23.94)−254.21 to −157.20−0.19−8.59<0.001
WAnT20
Y-Intercept70.43 (15.52)38.99 to 101.88 4.54<0.001
MPO0.88 (0.02)0.85 to 0.910.9758.71<0.001
FI−115.10 (19.16)−153.91 to −76.29−0.10−6.01<0.001
B: raw coefficient (standard error, in parenthesis); ß: standardized coefficient.
Table 2. Cross-validation analysis comparing the mean power (MPO) estimated by using the first 15 (WAnT15) and 20 (WAnT20) seconds of the test, and the 30 s MPO (reference criterion).
WAnT15WAnT20
Agreement
r0.990.99
ICC0.990.99
CI-95% lower0.980.99
CI-95% upper1.001.00
t-test (p-value)0.560.96
Magnitude of error
SEM (W)8.03.3
SDC (W)22.29.3
CV (%)1.20.5
ICC: Intraclass correlation coefficient; r: Pearson’s correlation coefficient; SEM: Standard error of measurement; SDC: Smallest detectable change (sensitivity); CV: SEM expressed as a coefficient of variation.
Publisher’s Note: MDPI stays neutral with regard to jurisdictional claims in published maps and institutional affiliations.

