Article

Investigation of Reverse Swing and Magnus Effect on a Cricket Ball Using Particle Image Velocimetry

Department of Mechanical Engineering, University of Bath, Bath BA2 7AY, UK
*
Author to whom correspondence should be addressed.
Appl. Sci. 2020, 10(22), 7990; https://doi.org/10.3390/app10227990
Submission received: 7 October 2020 / Revised: 6 November 2020 / Accepted: 8 November 2020 / Published: 11 November 2020
(This article belongs to the Special Issue Sports Fluid Mechanics)

Abstract

:
Lateral movement from the principal trajectory, or “swing”, can be generated on a cricket ball when its seam, which sits proud of the surface, is angled to the flow. The boundary layer on the two hemispheres divided by the seam is governed by the Reynolds number and the surface roughness; the swing is fundamentally caused by the pressure differences associated with asymmetric flow separation. Skillful bowlers impart a small backspin to create gyroscopic inertia and stabilize the seam position in flight. Under certain flow conditions, the resultant pressure asymmetry can reverse across the hemispheres and “reverse swing” will occur. In this paper, particle image velocimetry measurements of a scaled cricket ball are presented to interrogate the flow field and the physical mechanism for reverse swing. The results show that a laminar separation bubble forms on the non-seam side (hemisphere), causing the separation angle for the boundary layer to be increased relative to that on the seam side. For the first time, it is shown that the separation bubble is present even under large rates of backspin, suggesting that this flow feature is present under match conditions. The Magnus effect on a rotating ball is also demonstrated, with the position of flow separation on the upper (retreating) side delayed due to the reduced relative speed between the surface and the freestream.

1. Introduction

The unique design of a cricket ball allows a bowler to influence both its lateral and vertical movement through the air. Cricket balls are constructed from a cork center and four quadrants of leather tightly stitched around it, forming a primary seam—which sits proud of the surface by 0.5 to 0.8 mm—and two internally stitched quarter seams, resulting in a surface that is almost flush [1]. Figure 1a illustrates the bowler’s grip on a cricket ball, which is comprised of six rows of stitching about 20 mm wide in total. To extract lateral movement—known as swing—the bowler may angle the primary seam to the direction of its initial trajectory. This angle is typically around β = 15°. This creates asymmetry in the separation points of the viscous boundary layers on each hemisphere either side of the seam, resulting in a lateral aerodynamic force. This explanation for swing was first theorized by Lyttleton [2].
Although swing can be exploited by a skillful bowler, it is not guaranteed during a match and its presence is controlled by several external factors. Cricket is unique in that the same ball is used over a significant period of time (80+ overs), and the wear and deterioration of the surface will influence the fluid dynamics governing swing. There are several manufacturers of top-quality cricket balls (Dukes, Kookaburra, and Sanspareils Greenlands), each of which produce a ball with a different design of primary seam, resulting in unique swing characteristics. It is of no coincidence that Dukes balls are renowned for swing, as it is their design which has the proudest seam. There are different surface textures and rates of surface deterioration for balls produced in different colors: red, white and pink. There are also environmental factors: drier outfields create more abrasive surfaces and variable weather conditions can create microturbulence in the air, which can disrupt the boundary layer on the surface of the ball and influence swing.
Of the conditions which are under the control of the bowler and fielding side, swing is principally governed by the Reynolds number (Re—see nomenclature) and the non-dimensional surface roughness (k/d) of the ball. The former is limited by the maximum delivery speed of the bowler and aerodynamic drag over the trajectory; the latter is influenced by wear and deterioration as the match progresses, in addition to careful polishing and maintenance within the laws of the game.
The most successful exponents of swing typically bowl at speeds in excess of 80 mph (>36 m/s). They also impart a small backspin, which creates enough gyroscopic inertia to stabilize the seam in the moving frame of reference; there will be little or no swing if the seam wobbles in flight—a consistent pressure asymmetry will not be maintained. In the early overs at the start of a match, while the ball is new and has a smooth lacquered surface, the bowler will typically seek to extract conventional swing (CS) from the ball. To prolong CS, the bowler and fielding side will seek to keep one side as smooth as possible by polishing the ball over the course of the innings. As the ball ages further and the surface deteriorates, reverse swing (RS) can occur. Here, the ball will swing in the opposite direction to CS.
CS is well understood, and several articles provide a detailed explanation [3,4]. An illustration of the boundary layer profiles for this case are shown in Figure 1b. Note that the boundary layer thickness (<1 mm under match conditions) is greatly exaggerated for illustration. The bowler angles the seam to its principal trajectory by approximately β = 15°, providing the asymmetric conditions necessary for swing. The flow stagnates on the non-seam side (NSS) of the ball, before bifurcating and traversing the seam side (SS), and NSS. The flow remains laminar on the smooth and polished NSS, and subsequently separates from the surface at θL~80°. This angle, and those below are quantified from experimental measurements on balls used in first-class match conditions by Scobie et al. [5] at Re = 1.5 × 10⁵ (equivalent to 67 mph). On the SS, the seam trips the flow into turbulence, ensuring that it remains attached until a separation angle of θT~120°, by virtue of the increased momentum in the boundary layer near to the surface. The unequal separation angles create an asymmetric distribution of pressure, and hence a net lateral aerodynamic force on the ball, causing it to swing.
CS is lost if the fielding side can no longer maintain a smooth surface on the NSS, as the ball naturally roughens due to wear as the match progresses. However, RS may occur under conditions with an appropriate roughness on the NSS; here the turbulent separation angle has increased to θT~135°, and the separation angle of the SS remains similar to the CS case at θT~110° (Figure 1c). This results in a reversal of the pressure asymmetry, and so RS is in the opposite direction to CS. RS is not as well understood as CS and different theories have been proposed to explain the fluid dynamics. Experiments performed by Scobie et al. [5], using a novel heated flow visualization method, show that a laminar separation bubble (LSB) forms on the aged and roughened NSS. The laminar boundary layer separates at θL~95°, reattaches as a turbulent layer at θR~110°, and eventually detaches further downstream as a turbulent layer at θT~135°—see Figure 1c. Although the SS will also roughen, and consequently the angle of turbulent separation advances, it is the condition of the NSS that principally governs the onset of RS.
This paper presents an investigation into the flow field surrounding a cricket ball using particle image velocimetry (PIV) in a low speed wind tunnel. The experiments used a scaled cricket ball at Re and k/d values typical of match conditions, exploring the role of the boundary layer and flow separation during reverse swing. Experimental evidence is presented in this paper, for the first time on a ball with backspin, to demonstrate the formation and stability of a laminar separation bubble. PIV measurements were also collected to demonstrate how the Magnus effect is influenced by the rate of backspin. The results are discussed in the practical context of a cricket match.

2. Literature Review

2.1. Flow Separation on Spheres and Cricket Balls

Achenbach published the results from a definitive set of experiments showing how the Reynolds number affects the location of boundary layer separation on hydraulically-smooth spheres [6]. These locations were derived from skin-friction measurements; the results are presented in Figure 2, denoted by the open circles. Below a critical Reynolds number of Re = 2 × 10⁵ (i.e., sub-critical flow), Achenbach showed that the boundary layer is laminar and the adverse pressure gradient on the sphere causes it to separate at around θL~80°. Within the critical flow regime (2 × 10⁵ < Re < 4 × 10⁵), the boundary layer transitions to turbulence and the separation angle is delayed to θT~120°. As the Reynolds number increases beyond critical flow to a supercritical flow regime, the point of boundary layer separation gradually retreats upstream. It was later shown by Taneda, using oil flow visualization on a smooth sphere, that the increase in separation angle at the critical Reynolds number is associated with an LSB—see inset in Figure 2 [
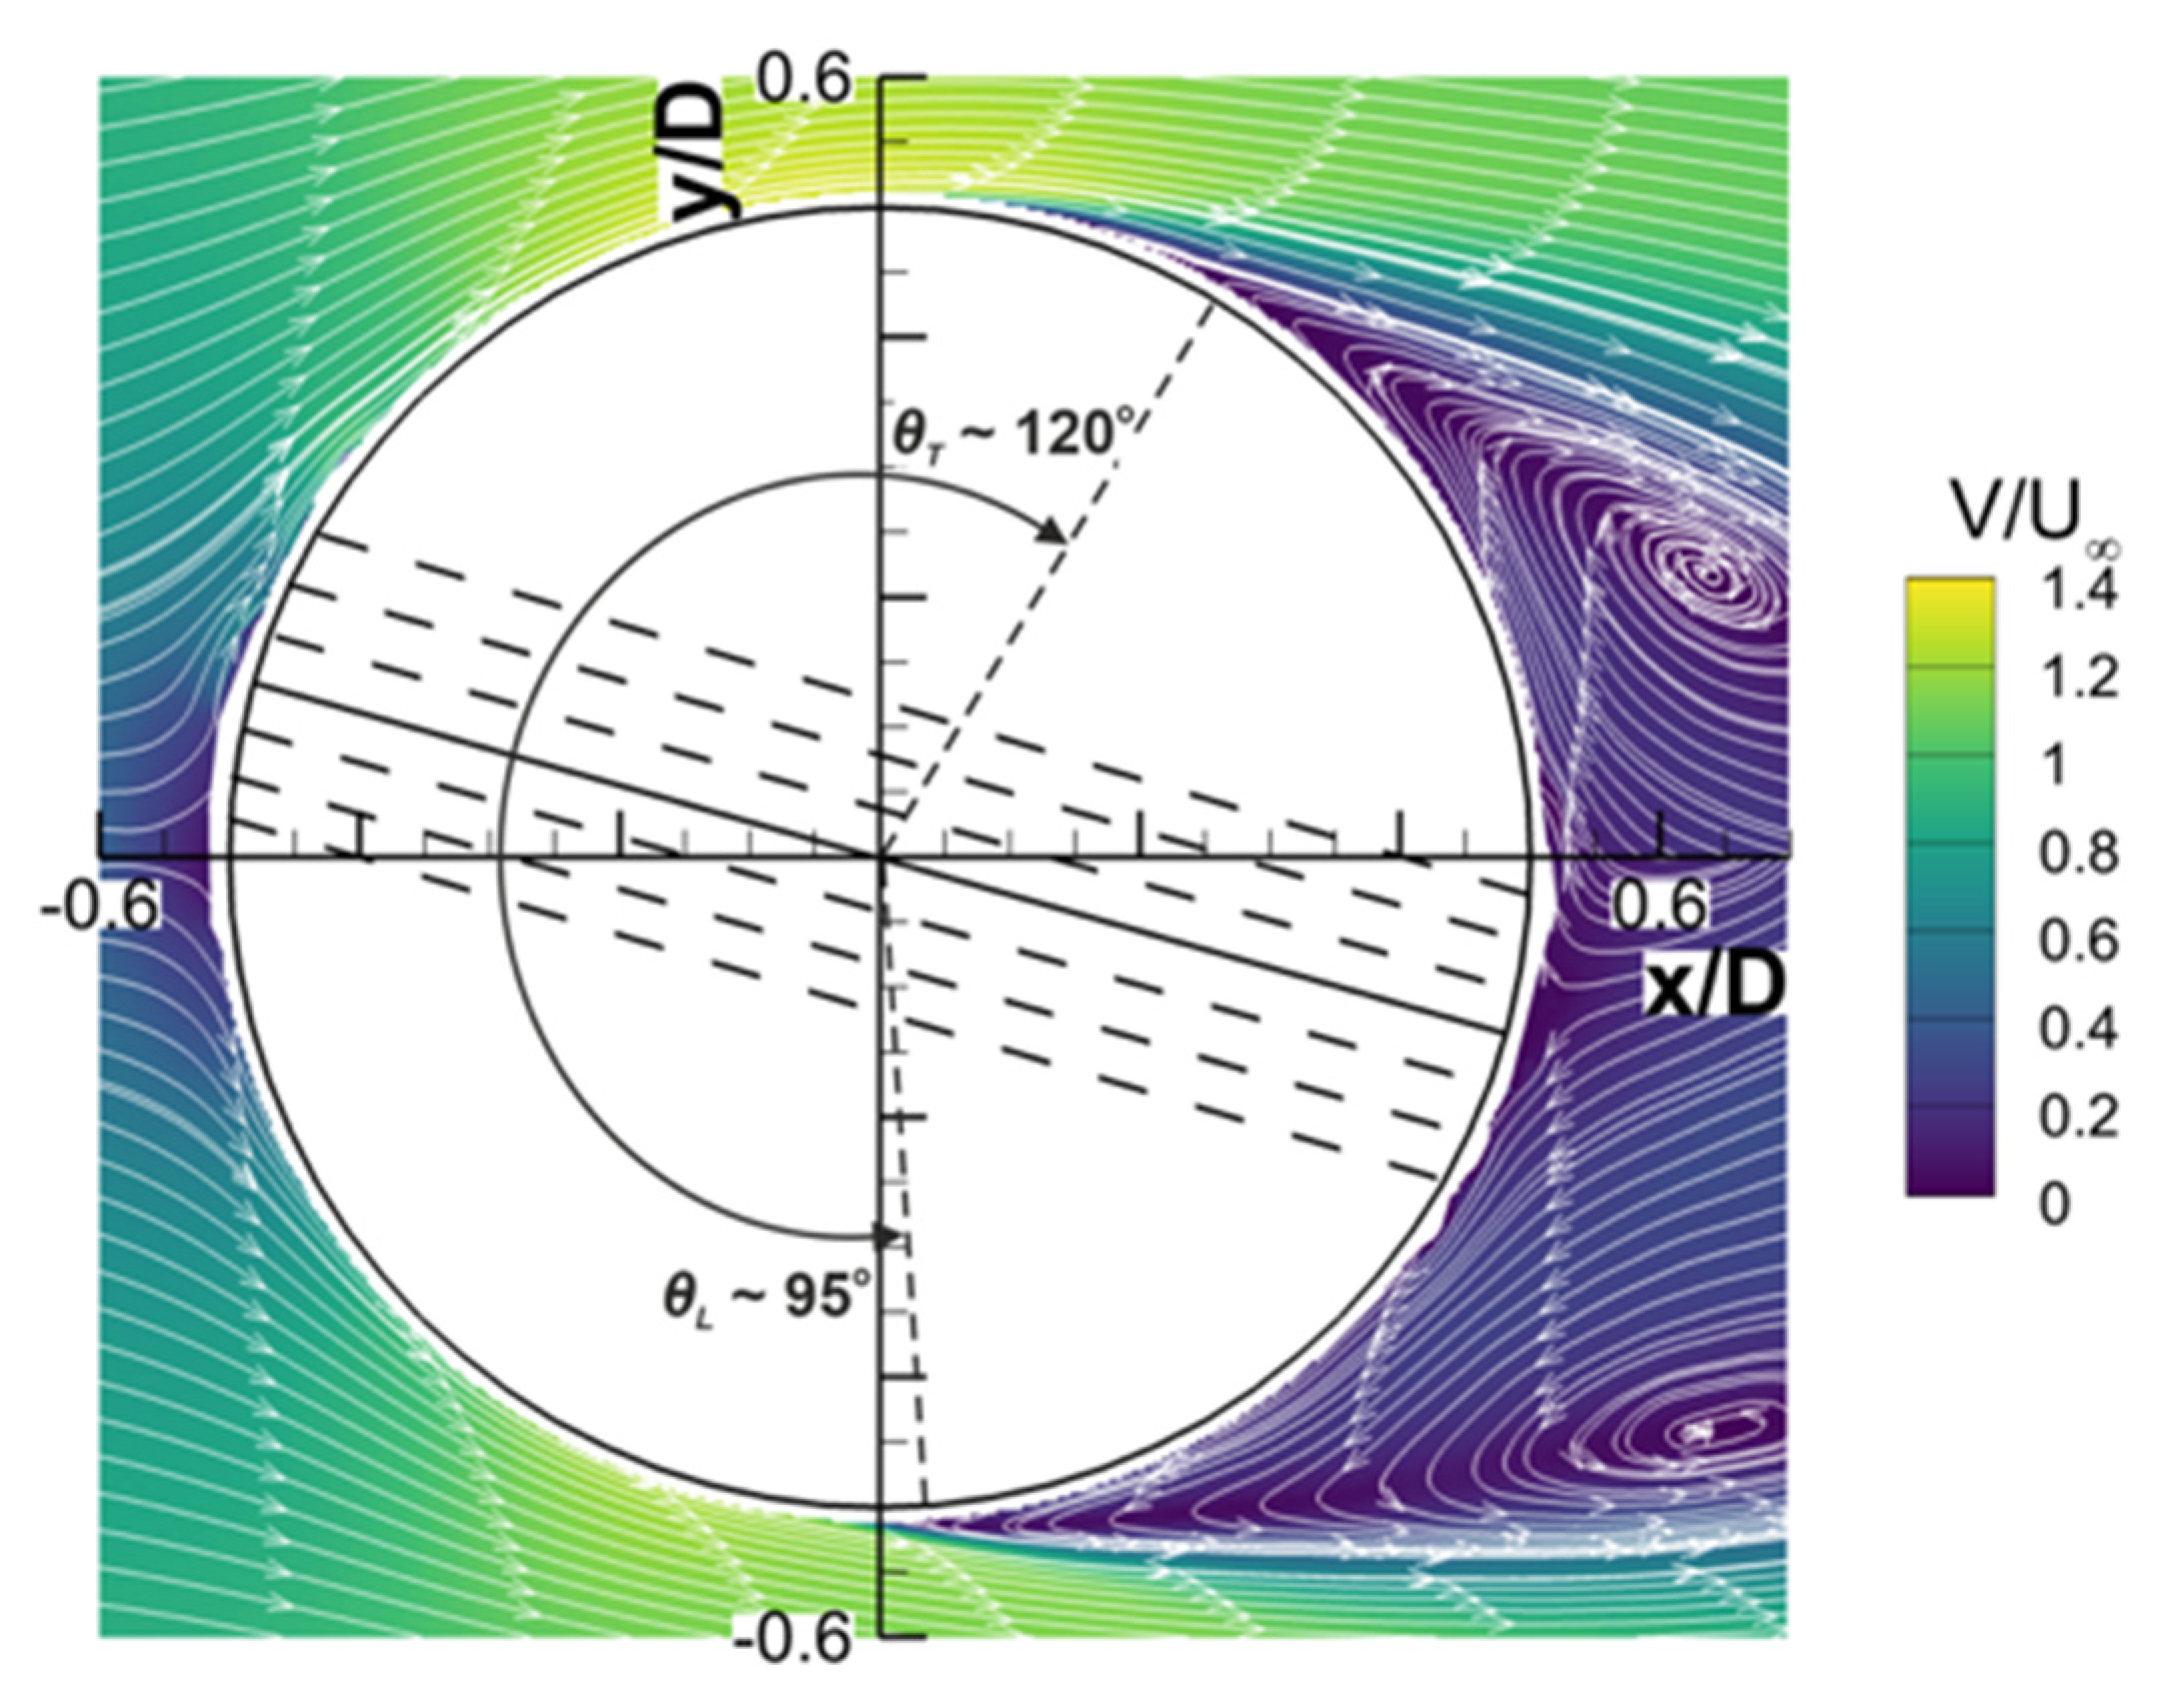
7]. An LSB forms as the laminar boundary layer separates from the sphere (θL) before transitioning to turbulence and reattaching downstream (θR); the turbulent boundary layer separates yet further downstream (θT). Taneda measured 92° < θL < 110°, 107° < θR < 127°, and 123° < θT < 147° (depending on Re). Importantly, θT is larger in the presence of an LSB during the critical flow regime, than in the absence of the LSB during the supercritical flow regime.
Achenbach later investigated the effect of surface roughness on the separation angles of spheres [8]. He found that the value of Re in the critical regime reduces with increasing roughness, as the roughness destabilizes the boundary layer and causes it to transition to turbulence earlier. The size of the critical region also increases, described by the range of Re across which the flow regime changes. These results are also shown in Figure 2 by the open triangle and square symbols. In the scenario of a cricket ball with an angled seam, the two hemispheres will feature a different roughness, the separation angles will be different, and a lateral aerodynamic force will be caused by the asymmetric distribution of pressure.
Figure 2 demonstrates this asymmetry for CS and RS in the context of a cricket match. Consider a swing bowler delivering a new ball at 90 mph (Re~2 × 10⁵). The relative size of the primary seam (hence primary, dominating roughness) on the SS is approximately equivalent to k/d = 1250 × 10−5 (denoted by the squares). For the sake of demonstration, it is assumed that the surface of the NSS for a new ball is hydraulically-smooth. At these conditions, θL = 82° on the NSS (in the sub-critical regime) and θT = 100° on the SS (in the super-critical regime), resulting in CS. As the ball ages during the course of play, the NSS roughens slightly to k/d = 250 × 10−5 (despite careful polishing of the ball by the fielding side). Assuming the bowler delivers the ball at the same speed (and therefore, same Re), now θT = 120° on the NSS (in the critical regime) and θT = 100° on the SS (in the super-critical regime), resulting in RS. The red region demonstrates where the separation angle on the NSS is less than the SS, corresponding to CS, and the solid blue region corresponds to RS for an aged ball. At larger Re, the hatched blue region corresponds to RS for a new ball.
Achenbach’s results show that RS for a new cricket ball would occur if it were bowled at an impossible speed of >75 m/s (Re > 3 × 10⁵); here the surface on the NSS is assumed to be hydraulically-smooth and the ball to be a perfect sphere. In practice, cricket balls are imperfect spheres with manufacturing irregularities and an inherent surface roughness, which are exacerbated as the ball ages and wears. Direct side force measurements on new and aged stationary Dukes cricket balls in a wind tunnel by Scobie et al. [4] are presented in Figure 3 as a function of Re. Note that Scobie et al. [4,5] investigated an extensive series of balls aged under first-class match conditions and provided by professional cricketers. For the results presented in Figure 3, the seam angle was set at β = 15°. The critical Re reduces as the ball ages, due to the increasing surface roughness. Interestingly, it shows that RS on a new Dukes ball can be achieved if bowled at 100 mph (Re~2.2 × 10⁵), suggesting that the surface roughness of a new ball is in the range 0 < k/d < 250 × 10−5. Scobie et al. [5] collected side force measurements on a double-sized scaled model (of the same dimensions and surface roughness as that used in this study) and showed that this 3D printed double-sized model had a similar aerodynamic behavior to a real Dukes ball that is approximately 25 overs old. The critical region (1.65 × 10⁵ < Re < 1.75 × 10⁵) is marked in Figure 3. The non-dimensional side force coefficients for CS (CZ~0.3) are comparable with the results of other studies on stationary balls [9,10]. Note that the magnitude of CZ for RS is less than that for CS either side of the critical Re (Recrit). Sustained swing over the full trajectory of flight is further complicated by aerodynamic drag, which will continually decrease Re; the net lateral movement will be reduced if the ball experiences a combination of both CS and RS. Swing can be elusive and the appropriate conditions for its manifestation, even with experience, may be elusive.
In practice, the bowler will impart a small backspin on the ball. Bentley et al. [11] found that the optimum spin rate to achieve maximum swing is around 10 rev/s. However, it has been shown that a high backspin can reduce the lateral force [12]. It is argued that the rotation exaggerates the surface roughness and any other protrusions or irregularities, including the quarter seams and logo embossments, disrupting the boundary layer. This rotation effect has been put forth as a skeptical argument against the existence of an LSB on the NSS of a rotating cricket ball in the context of a match [13].
The presence of the LSB on a non-rotating cricket ball was first demonstrated by Scobie et al. [5] and later validated by Deshpande et al. [14]. Scobie et al. demonstrated this phenomenon using heated flow visualization and pressure measurements on both a double-scaled ball and on actual cricket balls aged under first-class match conditions. Deshpande et al. modelled a cricket ball as a sphere with a trip to act as the seam, showing the formation of the LSB using oil flow visualization experiments in a wind tunnel. Images from the above papers are shown in Figure 4. Deshpande et al. also showed that an LSB forms over the SS at low Re during the CS regime. Earlier experiments by Deshpande et al. [15] demonstrated the instability and intermittency of an LSB over a smooth sphere, by means of unsteady force and pressure measurements. They found that the critical flow regime can be further categorized into three sub-regimes based on the nature of the LSB.
The method of PIV has not been used to identify the LSB on a cricket ball (rotating or non-rotating), but it has been used to show the boundary layer separation angles on a stationary sphere with a trip at the sub-critical and critical flow regimes, demonstrating CS and RS [10]. The image resolution of their system was too low to be able to resolve an LSB. This paper aims to show that an LSB is present on a cricket ball subject to backspin.

2.2. Magnus Effect

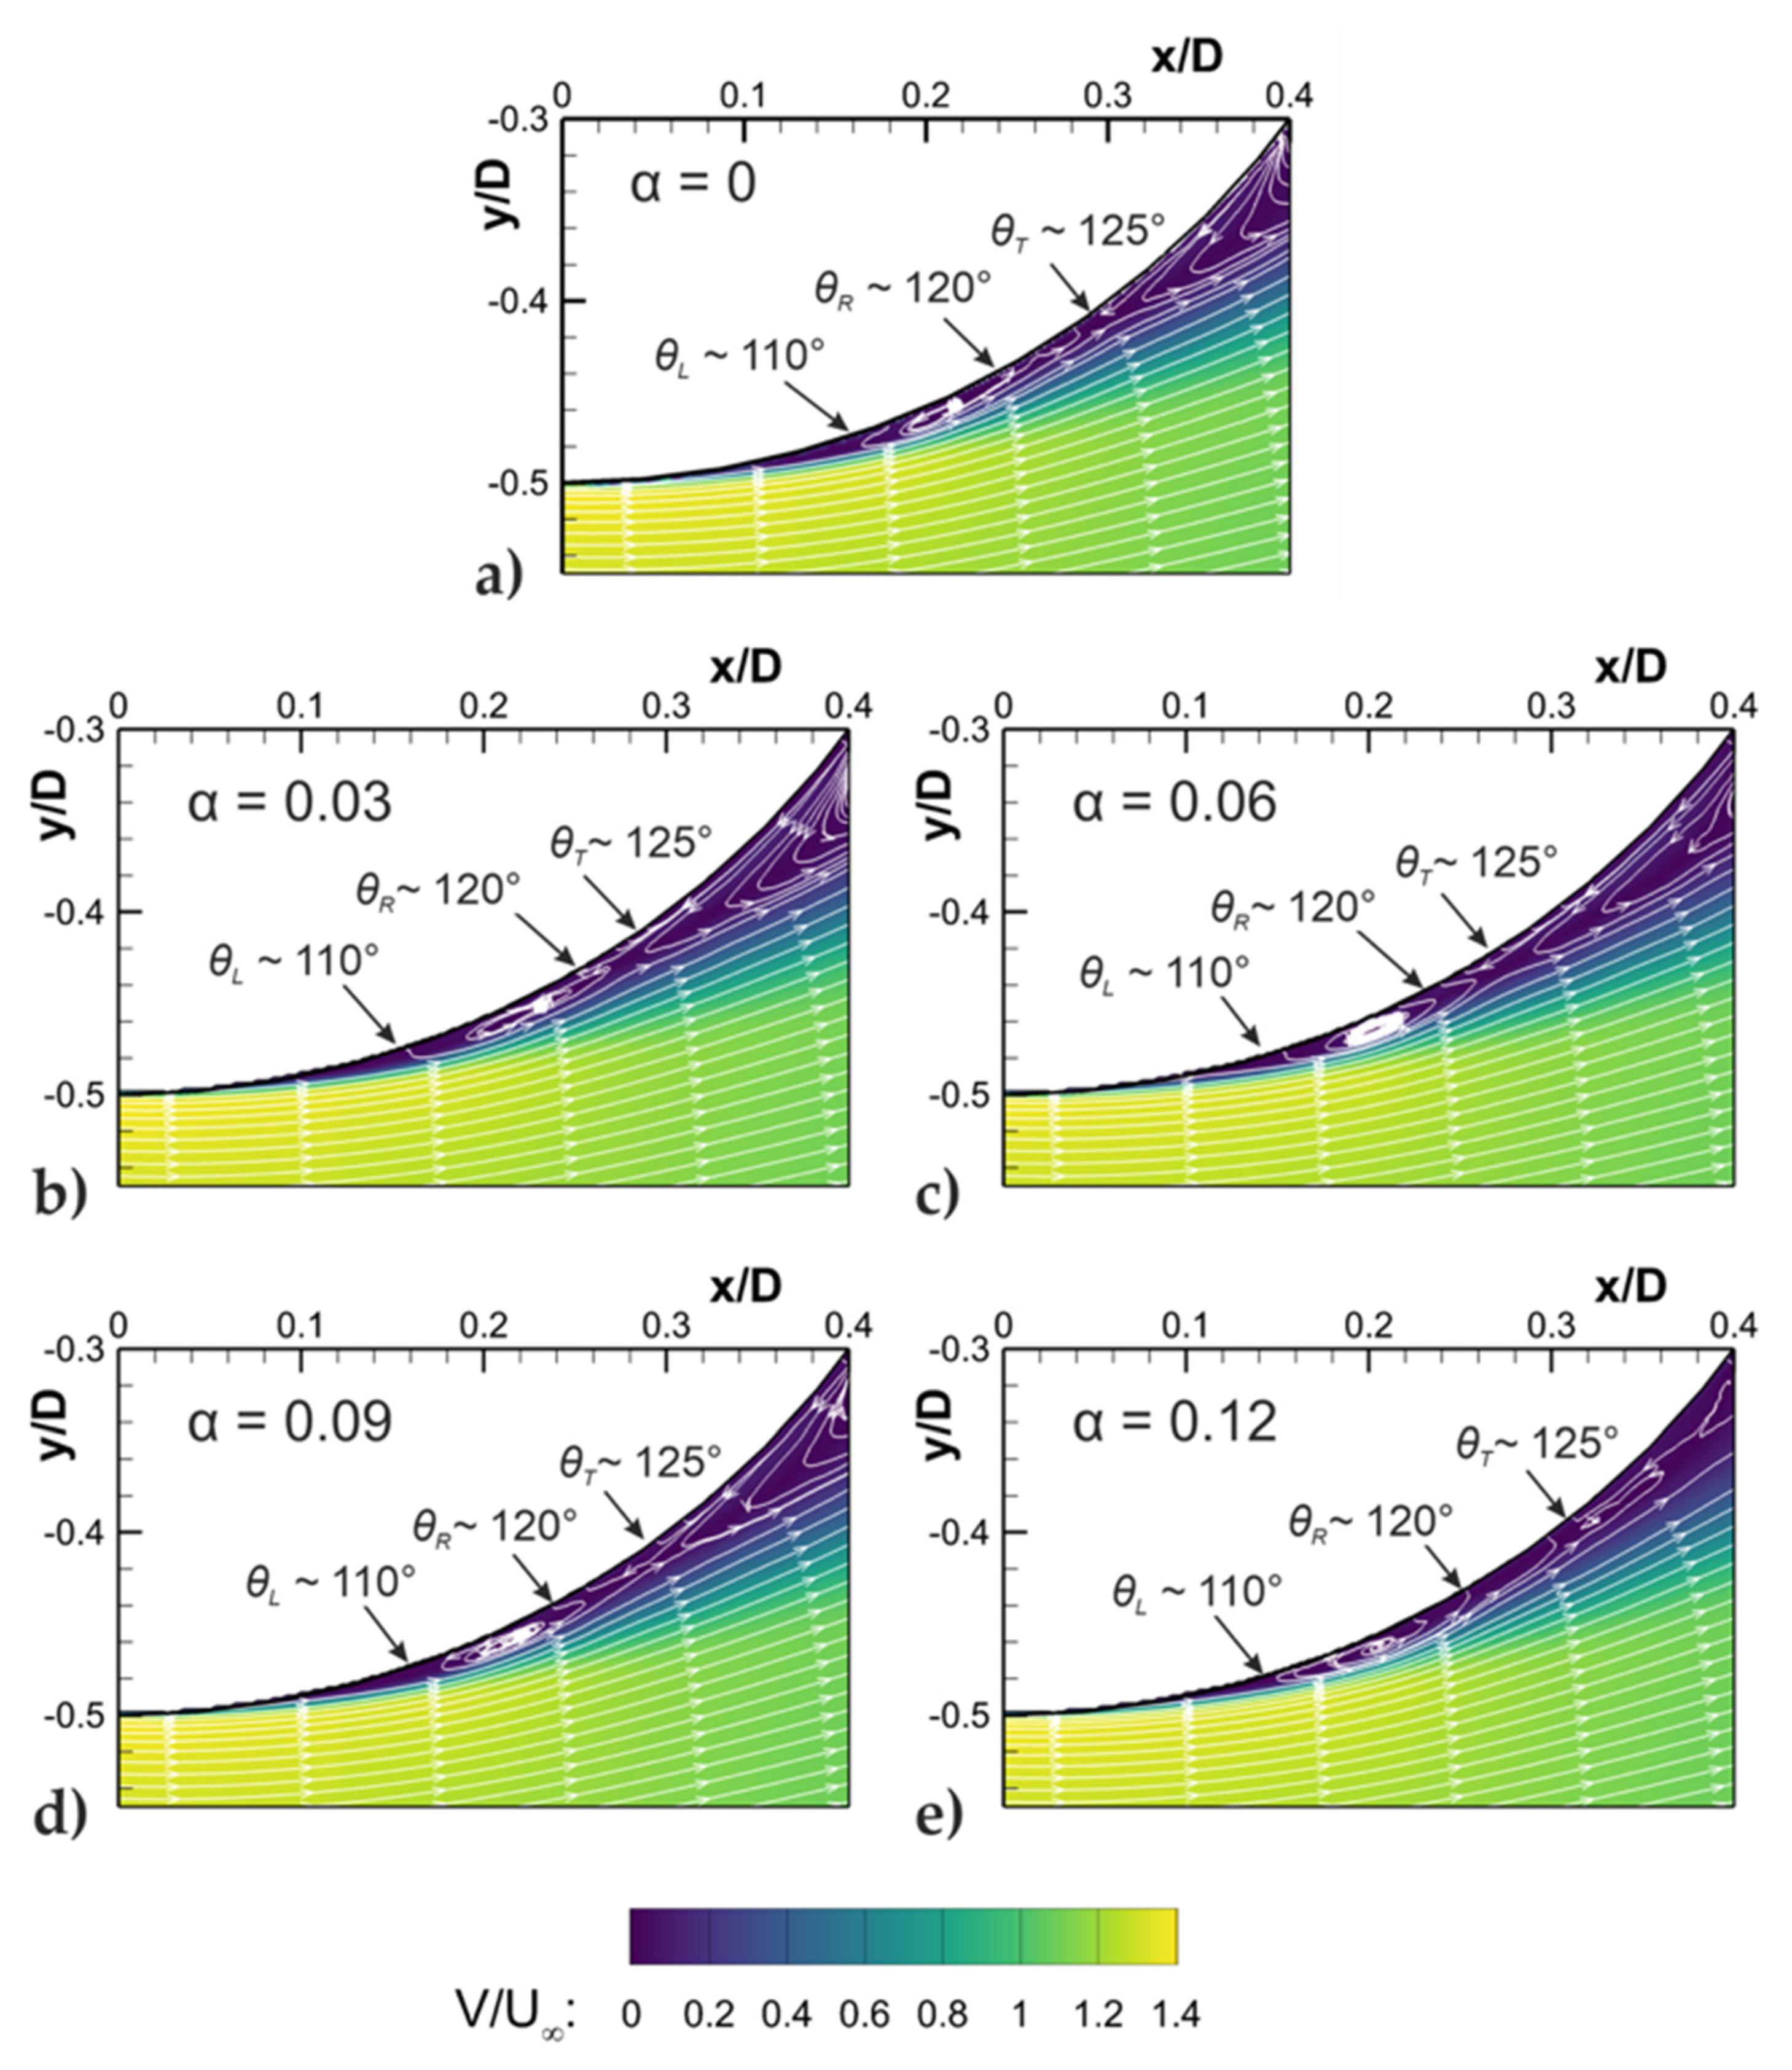
Video analysis reveals that swing bowlers apply a typical backspin of around 10 rev/s when they release the ball. In addition to stabilizing the seam, the rotation of the ball induces a Magnus force in the vertical axis (orthogonal to the direction of any swing). This deviation from the main trajectory influences the location of where the ball pitches and is also important to spin bowling. The bowler’s hand position to apply backspin is illustrated in Figure 5a. The Magnus force is governed by Re and the spin ratio, α (see nomenclature), which describes the ratio of the tangential velocity on the surface of a rotating body to the velocity of the freestream. A typical swing bowler, operating at 40 m/s (~90 mph) with a backspin of 10 rev/s, will therefore create a spin ratio of α~0.06.
Mehta [13] has demonstrated the Magnus effect on a cricket ball in a water channel using dye flow visualization. Sayers and Lelimo [9] collected lift force measurements on a cricket ball rotating about its axis (i.e., β = 0°) up to spin ratios of α = 0.3, showing that the lift coefficient can reach CL = 0.3.
For a rotating sphere in the conventional Magnus regime (Figure 5b), the upper (retreating) side of the ball provides extra momentum to the boundary layer, and so separation is delayed. In addition, if Re is in the super-critical or trans-critical flow regime, the increased relative speed between the surface and the freestream will cause earlier boundary layer separation on the lower (advancing) side. For θret > θadv, the Magnus force provides lift, and this is classified as conventional Magnus. The boundary layers can be laminar or turbulent, as long as they are operating in the same flow regime.
It has been theorized that if bowlers impart a large enough backspin on the ball, then the Magnus effect is inversed and the pressure asymmetry and wake switch direction, as illustrated in Figure 5c. (Mittal has speculated in sports journalist articles that this is exploited in a singular fashion, such that the ball pitches further from the batsman than expected.) This inversion effect has been demonstrated computationally and experimentally on smooth rotating spheres [16,17,18] and dimpled golf balls [19]. It is often explained by an effective Re on the advancing and retreating sides based on the velocity difference, which is the combination of Re and α. Sakib and Smith [19] identified that the inverse Magnus effect on a golf ball only occurs when Re is close to the critical regime. For a dimpled golf ball, which has a roughness that is comparable to the seam of a cricket ball, they found that a sufficient backspin causes the effective Re on the retreating side to reduce to the sub-critical regime, where laminar separation occurs. At this point θret < θadv and an inverse Magnus force is generated. It is expected that a similar behavior would occur for a cricket ball, under appropriate conditions.

3. Experimental Methods

The experiments were conducted in the open-jet wind tunnel in the Department of Mechanical Engineering at the University of Bath. The working section of the tunnel had a circular nozzle of diameter 0.76 m, a collector with a diameter of 1.1 m, and a working length of 1.5 m. The free-stream turbulence intensity of the tunnel was less than 1%.
To assess the boundary layer in a greater level of detail, a hollow, scaled model with twice the diameter (d = 142 mm) of a standard cricket ball was manufactured from rapid prototype nylon in two hemispheres that were bonded together. This model featured an accurate, scaled representation of the seam and was a replica of that used by Scobie et al. [5], who assessed the surface roughness equivalent to a ball aged 25 overs—see data in Figure 3. The scaled model did not have a logo embossment, or a secondary seam, features which may affect boundary layer separation. A real cricket ball is worn under match conditions (consequently increasing the surface roughness during the course of a match), whereas the surface roughness of the model was an artefact of the rapid prototyping method. However, the scaled model was appropriate for the experiments, due to the required resolution of the PIV measurements, and the maximum free stream velocity that the wind tunnel could achieve. The surface of the scaled cricket ball had a black, matt finish to minimize any reflections from the PIV laser light. (Minimizing the laser reflections would be very difficult to achieve with a real cricket ball, without compromising the surface features.) The arrangement for the ball in the wind tunnel is shown in Figure 6. The ball was mounted to a rotating shaft, which was spun by a direct current motor up to speeds of 300 rpm to simulate the backspin imparted on the ball by the bowler. The tunnel blockage was approximately 5%. For all measurements which investigated swing, the angle between the seam and the freestream was fixed at β = 15°.
PIV images were captured by an 8 MP digital CCD (Charged Coupled Device) camera. The free-stream was seeded with oil particles by a TSI Incorporated six-jet droplet generator, which produced a typical droplet diameter of 1 μm. The droplets were illuminated using a 120 mJ dual-head Nd:YAG laser that generated a sheet of light approximately 1 mm thick. The time between consecutive laser pulses was set to Δ t = 4 μs. The operation of the laser and camera was controlled using a TSI Model 610034 synchronizer. PIV measurements for the reverse swing experiments were taken in the lateral x-y plane passing through the centroid of the ball (z = 0) with the camera mounted above the working section, directed downwards—see Figure 6a. For experiments in which the ball was not rotating, 500 image pairs were collected at a capture rate of 7.5 Hz, from which a time-average was taken. When backspin was applied, images were phase-locked with the rotational frequency of the ball to ensure that any eccentricity did not affect the time-averaged results. To capture the flow field around both the SS and NSS, the ball could be rotated in both directions about the z-axis (as demonstrated in Figure 7a for the NSS and Figure 7b for the SS). Thus, the camera and laser set-up remained in situ. A wide-angled lens with a 50 mm focal length was used to capture the entire NSS or SS, and a lens with a 100 mm focal length was used to interrogate the area around the point of boundary layer separation on the NSS. The pixel size was approximately 0.06 mm with the 50 mm lens and 0.03 mm with the 100 mm lens. The 50 mm lens was also used for the experiments investigating the Magnus effect, resulting in a pixel size of 0.09 mm. The f-number was set to between f/5.6 and f/8.
The yaw angle was set to β = 0° for the experiments investigating the Magnus effect. A mirror redirected the laser sheet to the x-z plane (passing through y = 0), with the camera positioned from the side (shown in Figure 6b). The ball was rotated in the − Ω direction followed by the + Ω direction to capture the flow field around the upper and lower surfaces, respectively, with the camera and laser remaining fixed. The direction of + Ω is shown in Figure 6. Time-averaged results were processed from 500 pairs of images collected at each station. All PIV measurements were processed on TSI Insight 4G, using the fast Fourier transform (FFT) correlation algorithm and a recursive Nyquist grid, which had a starting interrogation window of 32 × 32 pixels and 50% overlap, and a final window of 16 × 16 pixels (also with 50% overlap). For the swing experiments, the spatial resolution (the length scale corresponding to the size of the interrogation window) was less than 0.4% of the model diameter (<0.5 mm), and the resolution for the Magnus effect experiments was around 0.5% of diameter (~0.7 mm).

4. Swing and the Separation Bubble

For the initial set of experiments, the ball was not subject to rotation (α = 0) and CS was first studied. Figure 8 shows the time-averaged velocity magnitude as a fraction of the freestream (V/U) and streamlines around the ball at a flow condition of Re = 1.1 × 10⁵ (equivalent to a bowling speed of 54 mph). The image is formed by superposing two sets of data from separate investigations of the SS and NSS. The flow field clearly shows conventional swing. On the NSS, where the flow stagnates, the smoother surface encourages a laminar boundary layer; flow separation occurs in an adverse pressure gradient at an angle θL~95°. On the other hemisphere, the seam trips the boundary layer to turbulence and separation is delayed to θT~120°. Note that the separation angle on the NSS is slightly higher than the data for the hydraulically smooth sphere shown in Figure 2; as discussed above, the rapid prototype surface finish is rougher than that of a manufactured new ball (equivalent to approximately 25 overs old or k/d = 250 × 10−5).
Figure 9 shows a magnified view of the flow field at higher Re, revealing the region of separation on the NSS of a stationary ball. The data is collected over a range of Re specifically near, within, and either side of the critical regime—see Figure 3. At Re = 1.35 × 10⁵ (Figure 9a), laminar separation still occurs at an angle of θL~100°. As Re increases to 1.65 × 10⁵ (Figure 9b–d), there is evidence that a separation bubble forms near the surface, shown by a localized region of recirculation. In addition, the separation point translates downstream. At higher Reynolds numbers (Re = 1.69 × 10⁵ and 1.74 × 10⁵ in Figure 9e,f), the laminar separation bubble reattaches downstream, and a turbulent separation angle can be identified around θT~130°. The Reynolds number at which the separation bubble forms (and the flow enters the critical regime) is similar to that measured by Scobie et al. (2013), identified at the point where the direction of swing switched from CS to RS (see Figure 3). The range of Reynolds numbers shown here corroborates with the critical regime for a sphere with a surface roughness of k/d = 250 × 10−5.
The laminar separation bubble can be highly unsteady around the critical Reynolds number, as demonstrated by Deshpande et al. [15]. Figure 10 shows two velocity “snapshots” at the same Re. Figure 10a clearly shows the formation of the bubble, and a corresponding smaller wake, whereas Figure 10b shows that the flow has separated earlier, with a corresponding larger wake. This illustrates the unsteadiness of the LSB, when operating close to the interface of the subcritical and critical flow regimes.
As discussed above, the swinging ball will feature backspin in a cricket match. The separation bubble is potentially destabilized by the rotation, which may exaggerate the surface roughness and any other protrusions or irregularities (i.e., the quarter seam and logo embossment). This issue is addressed experimentally for the first time. Figure 11 shows the flow field around the separation point for a range of spin rates, 0 < α < 0.12, at a fixed Reynolds number (Re = 1.69 × 10⁵), which corresponds to a bowling speed of 78 mph. The typical spin rate for a bowler is α~0.06 (assuming a backspin of 10 rev/s). It can be seen that the separation bubble exists with rotation, even at the maximum spin rate of α = 0.12. The laminar and turbulent separation points are broadly unaffected by α.
In the context of a cricket match, Figure 3 (supported by the velocity and streamline plots presented in Figure 9 and Figure 10) can be used to explain the bowling tactics used by the fielding side. Consider a bowler releasing a ball at a speed of between 80 mph (Re = 1.7 × 10⁵) and 90 mph (Re = 2.0 × 10⁵). The ball will decelerate during flight due to the drag force acting against it. If the ball is new, then it will experience CS throughout its trajectory, from the release point to the batsman. RS does not occur because of a high critical Re, owing to the low surface roughness on the NSS. Hypothetically, RS would occur if the bowler could achieve release speeds in excess of 100 mph (Re > 2.2 × 10⁵)—this is exceptionally rare in cricket. Consider now a ball which has aged 25 overs, again bowled at a speed between 80 mph and 90 mph. Figure 3 shows that RS will occur from the release point, by virtue of the increased surface roughness of the NSS. Figure 9 reveals that this is because of the formation of an LSB forming on the NSS. The sideways deviation caused by RS will be less than that in the CS regime because the non-dimensional side force (Cy) is smaller in magnitude. As the ball decelerates to around 78 mph (Recrit~1.7 × 10⁵), the LSB will become intermittent (Figure 10) before CS occurs. The combination of CS and RS may suppress any lateral deviation in the trajectory of the ball. Faster bowlers (those near 90 mph) will avoid this nulling effect, as the ball will experience more RS before it decelerates to below Recrit, where it switches to CS.
The experimental data (including that associated with the Magnus effect, which is explained in more detail below), can be incorporated into a computational model. This may be a useful tool to professional cricketers and coaches (to understand the implications of different bowling scenarios), and to sports technologists who predict cricket ball trajectories (e.g., Hawkeye).

5. Magnus Effect

In addition to providing gyroscopic stability to the position of the seam, backspin on the ball may alter its vertical displacement during its trajectory due to an induced Magnus force. The flow field in the xz plane is shown in Figure 12 for a non-rotating ball and also for two different spin rates. For these experiments, the seam angle was set to β = 0°. With α = 0, the flow field is symmetric because the speed of the air relative to the upper and lower hemispheres is equal (Figure 12a). The Reynolds number is Re = 1.94 × 10⁵, equivalent to a bowling speed of 88 mph, which is typical for a fast bowler. Flow separation occurs at an angle of around θT~120°, indicative of turbulent separation, owing to the roughness of the seam. As the rotation increases to α = 0.06 (Figure 12b), the upper hemisphere is retreating. Here, the surface is rotating with the direction of the flow, so separation is delayed as the rotating surface provides extra momentum to the boundary layer. On the lower, advancing hemisphere, the relative speed of the surface relative to the air is increased with an earlier separation; here the effective Re of the advancing surface may be sufficient to be approaching the super-critical/trans-critical regimes where the separation angle gradually reduces with Re. The effective Re on the advancing side is Readv~2.0 × 10⁵, which is beyond the critical regime for a sphere with a surface roughness of k/d = 1250 × 10−5 (assumed to be comparable to the seam roughness), according to Figure 2. The different separation angles create an asymmetric distribution of pressure, resulting in a net vertical aerodynamic force corresponding to the conventional Magnus effect. The effects are exaggerated further at α = 0.12 (Figure 12c).
Even at the high spin rates in these experiments, the inverse Magnus effect was not experienced. Considering Achenbach’s results in Figure 2, it may be that Re was too far beyond the critical Re number, such that any reduction in the effective Re on the retreating surface was not sufficient to return to laminar separation, and hence a lower separation angle.

6. Conclusions

The fluid dynamics around a double-sized scale model of a cricket ball, with and without backspin, were captured using particle image velocimetry measurements in an open-jet wind tunnel. Experiments were conducted at Reynolds numbers, degrees of surface roughness, and spin rates representative of match conditions. A laminar separation bubble was captured on the non-seam side of the ball over a range of Reynolds numbers corresponding to the critical flow regime. The laminar separation bubble was also present when the ball was subjected to backspin. This evidence reinforces an existing theory that a laminar separation bubble on the non-seam side is fundamental to the phenomenon of reverse swing. The conventional Magnus effect was also demonstrated, with the separation point on the upper (or retreating) side being delayed relative to the lower surface due to the reduced relative Reynolds number. The inverse Magnus effect was not observed at spin rates of up to α = 0.12.

Author Contributions

Conceptualization, J.A.S.; Data curation, E.H.; Formal analysis, R.W.J.; Investigation, E.H.; Methodology, R.W.J.; Project administration, G.D.L. and J.A.S.; Resources, J.A.S.; Supervision, J.A.S.; Writing-original draft, R.W.J.; Writing-review & editing, G.D.L. All authors have read and agreed to the published version of the manuscript.

Funding

This research received no external funding

Conflicts of Interest

The authors declare no conflict of interest.

Nomenclature

Cynon-dimensional side force
ddiameter [m]
ksize of roughness element [m]
ReReynolds number, Re = ρUd/μ
Ufreestream velocity [m/s]
Vvelocity magnitude [m/s]
x,y,zstreamwise, spanwise and vertical axes
αspin rate, α = Ωd/2U
βangle between seam and freestream
θangle from the stagnation point
θadvseparation angle on advancing surface
θLlaminar separation angle
θRturbulent reattachment angle
θretseparation angle on retreating surface
θTturbulent separation angle
Ωrotational speed [rad/s]

References

  1. British Standards Institution. BS 5993:1994 Specification for Cricket Balls; BSI Shop: London, UK, 1994. [Google Scholar]
  2. Lyttleton, R.A. The swing of a cricket ball. Discovery 1957, 18, 186–191. [Google Scholar]
  3. Mehta, R.D. An overview of cricket ball swing. Sports Eng. 2005, 8, 181–192. [Google Scholar] [CrossRef]
  4. Scobie, J.A.; Shelley, W.P.; Jackson, R.W.; Hughes, S.P.; Lock, G.D. Practical perspective of cricket ball swing. J. Sport Eng. Technol. 2020, 234, 59–71. [Google Scholar] [CrossRef]
  5. Scobie, J.A.; Pickering, S.G.; Almond, D.P.; Lock, G.D. Fluid dynamics of cricket ball swing. J. Sport Eng. Technol. 2013, 227, 196–208. [Google Scholar] [CrossRef]
  6. Achenbach, E. Experiments on the flow past spheres at high Reynolds numbers. J. Fluid Mech. 1972, 54, 565–575. [Google Scholar] [CrossRef]
  7. Taneda, S. Visual observations of the flow past a sphere at Reynolds numbers between 104 and 106. J. Fluid Mech. 1977, 85, 187–192. [Google Scholar] [CrossRef]
  8. Achenbach, E. The effects of surface roughness and tunnel blockage on the flow past spheres. J. Fluid Mech. 1974, 65, 113–125. [Google Scholar] [CrossRef]
  9. Sayers, A.T.; Lelimo, N.J. Aerodynamic coefficients of stationary and spinning cricket balls. R D J. S. Afr. Inst. Mech. Eng. 2007, 23, 25–31. [Google Scholar]
  10. Shah, K.; Shakya, R.; Mittal, S. Aerodynamic forces on projectiles used in various sports. Phys. Fluids 2019, 31, 015106. [Google Scholar] [CrossRef]
  11. Bentley, K.; Varty, P.; Proudlove, M.; Mehta, R.D. An experimental study of cricket ball swing. Aero Tech. Note 1982, 82–106. [Google Scholar]
  12. Barton, N.G. On the swing of a cricket ball in flight. Proc. R. Soc. Lond. Ser. A 1982, 379, 109–131. [Google Scholar] [CrossRef]
  13. Mehta, R.D. Fluid mechanics of cricket ball swing. In Proceedings of the 19th Australasian Fluid Mechanics Conference, Melbourne, Australia, 8–11 December 2014. [Google Scholar]
  14. Deshpande, R.; Shakya, R.; Mittal, S. The role of the seam in the swing of a cricket ball. J. Fluid Mech. 2018, 851, 50–82. [Google Scholar] [CrossRef]
  15. Deshpande, R.; Kanti, V.; Desai, A.; Mittal, S. Intermittency of laminar separation bubble on a sphere during drag crisis. J. Fluid Mech. 2017, 812, 815–840. [Google Scholar] [CrossRef]
  16. Muto, M.; Tsubokura, M.; Oshima, N. Negative Magnus lift on a rotating sphere at around the critical Reynolds number. Phys. Fluids 2012, 24, 014102. [Google Scholar] [CrossRef] [Green Version]
  17. Kim, J.; Choi, H.; Park, H.; Yoo, J.Y. Inverse Magnus effect on a rotating sphere: When and why. J. Fluid Mech. 2014, 754, 1–11. [Google Scholar] [CrossRef]
  18. Nguyen, S.; Corey, M.; Chan, W.; Greenhalgh, E.S.; Graham, J.M.R. Experimental determination of the aerodynamic coefficients of spinning bodies. Aeronaut. J. 2019, 123, 678–705. [Google Scholar] [CrossRef]
  19. Sakib, N.; Smith, B.L. Study of the reverse Magnus effect and a smooth ball moving through still air. Exp. Fluids 2020, 61, 1–9. [Google Scholar] [CrossRef]
Figure 1. (a) Illustration of a right-handed bowler’s grip on a cricket ball for swing; (b) conventional swing, i.e., away-swing to right-handed batsman (RHB) and (c) reverse swing, i.e., in-swing to RHB. The laminar separation bubble is highlighted by the grey in-fill.
Applsci 10 07990 g001
Figure 2. Variation of separation angles (with respect to the stagnation point) for smoothed and roughened spheres. Red represents the difference in separation angle either side of the ball during conventional swing (CS); solid blue shows reverse swing (RS) on an old ball and hatched blue denotes RS on a new ball. Triangles represent roughened non-seam side (NSS) and squares represent seam roughness.
Applsci 10 07990 g002
Figure 3. Variation of non-dimensional side force (Cy) with Reynolds number (Re) for Dukes balls at different stages of wear, showing the transition from CS to RS. The double-sized ball used in this paper is comparable in surface roughness to the 25-over-old ball. The critical region for the 25-over-ball is highlighted (1.65 × 10⁵ < Recrit < 1.75 × 10⁵). Adapted from [4].
Applsci 10 07990 g003
Figure 4. Evidence of a laminar separation bubble on the NSS using two different methods: (a) heat flow method on a double-sized cricket ball model [5] and (b) oil flow visualization on a sphere with a trip [14].
Applsci 10 07990 g004
Figure 5. (a) Side-on illustration of a bowler’s grip on a cricket ball showing direction of spin; (b) conventional Magnus force; and (c) inverse Magnus force.
Applsci 10 07990 g005
Figure 6. Experimental configuration of (a) the horizontal plane to investigate swing, and (b) the vertical plane to investigate the Magnus effect. Flow is from right to left.
Applsci 10 07990 g006
Figure 7. Position of the ball to investigate (a) the non-seam side (NSS) and (b) the seam side (SS).
Applsci 10 07990 g007
Figure 8. Time-averaged velocity magnitude and streamlines at U = 12 m/s, Re = 1.1 × 10⁵ (equivalent bowling speed of 54 mph), showing conventional swing, on the seam side θT~120° and on the non-seam side θL~95°. Separation angles shown to nearest 5°.
Applsci 10 07990 g008
Figure 9. Time-averaged velocity magnitude and streamlines with varying Re at a magnified region on the non-seam side, showing the formation of the separation bubble at α = 0 (equivalent bowling speeds between 62 and 81 mph). Separation and reattachment angles shown to nearest 5°.
Applsci 10 07990 g009
Figure 10. Instantaneous velocity magnitude and streamlines at Re = 1.69 × 10⁵, showing the intermittency of the separation bubble (equivalent bowling speed of 78 mph).
Applsci 10 07990 g010
Figure 11. Time-averaged velocity magnitude and streamlines at Re = 1.69 × 10⁵ on the NSS for different spin rates, α (equivalent bowling speed of 78 mph). Separation and reattachment angles shown to nearest 5°.
Applsci 10 07990 g011
Figure 12. Time-averaged velocity magnitude in the x-z plane at Re = 1.94 × 10⁵ (U = 20 m/s) showing (a) the symmetric flow field with no rotation and (b,c), the Magnus effect demonstrated at two different spin rates. Separation angles shown to nearest 5°.
Applsci 10 07990 g012
Publisher’s Note: MDPI stays neutral with regard to jurisdictional claims in published maps and institutional affiliations.

