Safety Concept for Textile-Reinforced Concrete Structures with Bending Load


Abstract
1. Introduction and Objective
2. Boundary Conditions
2.1. General
2.2. Static System and Geometric Dimensions
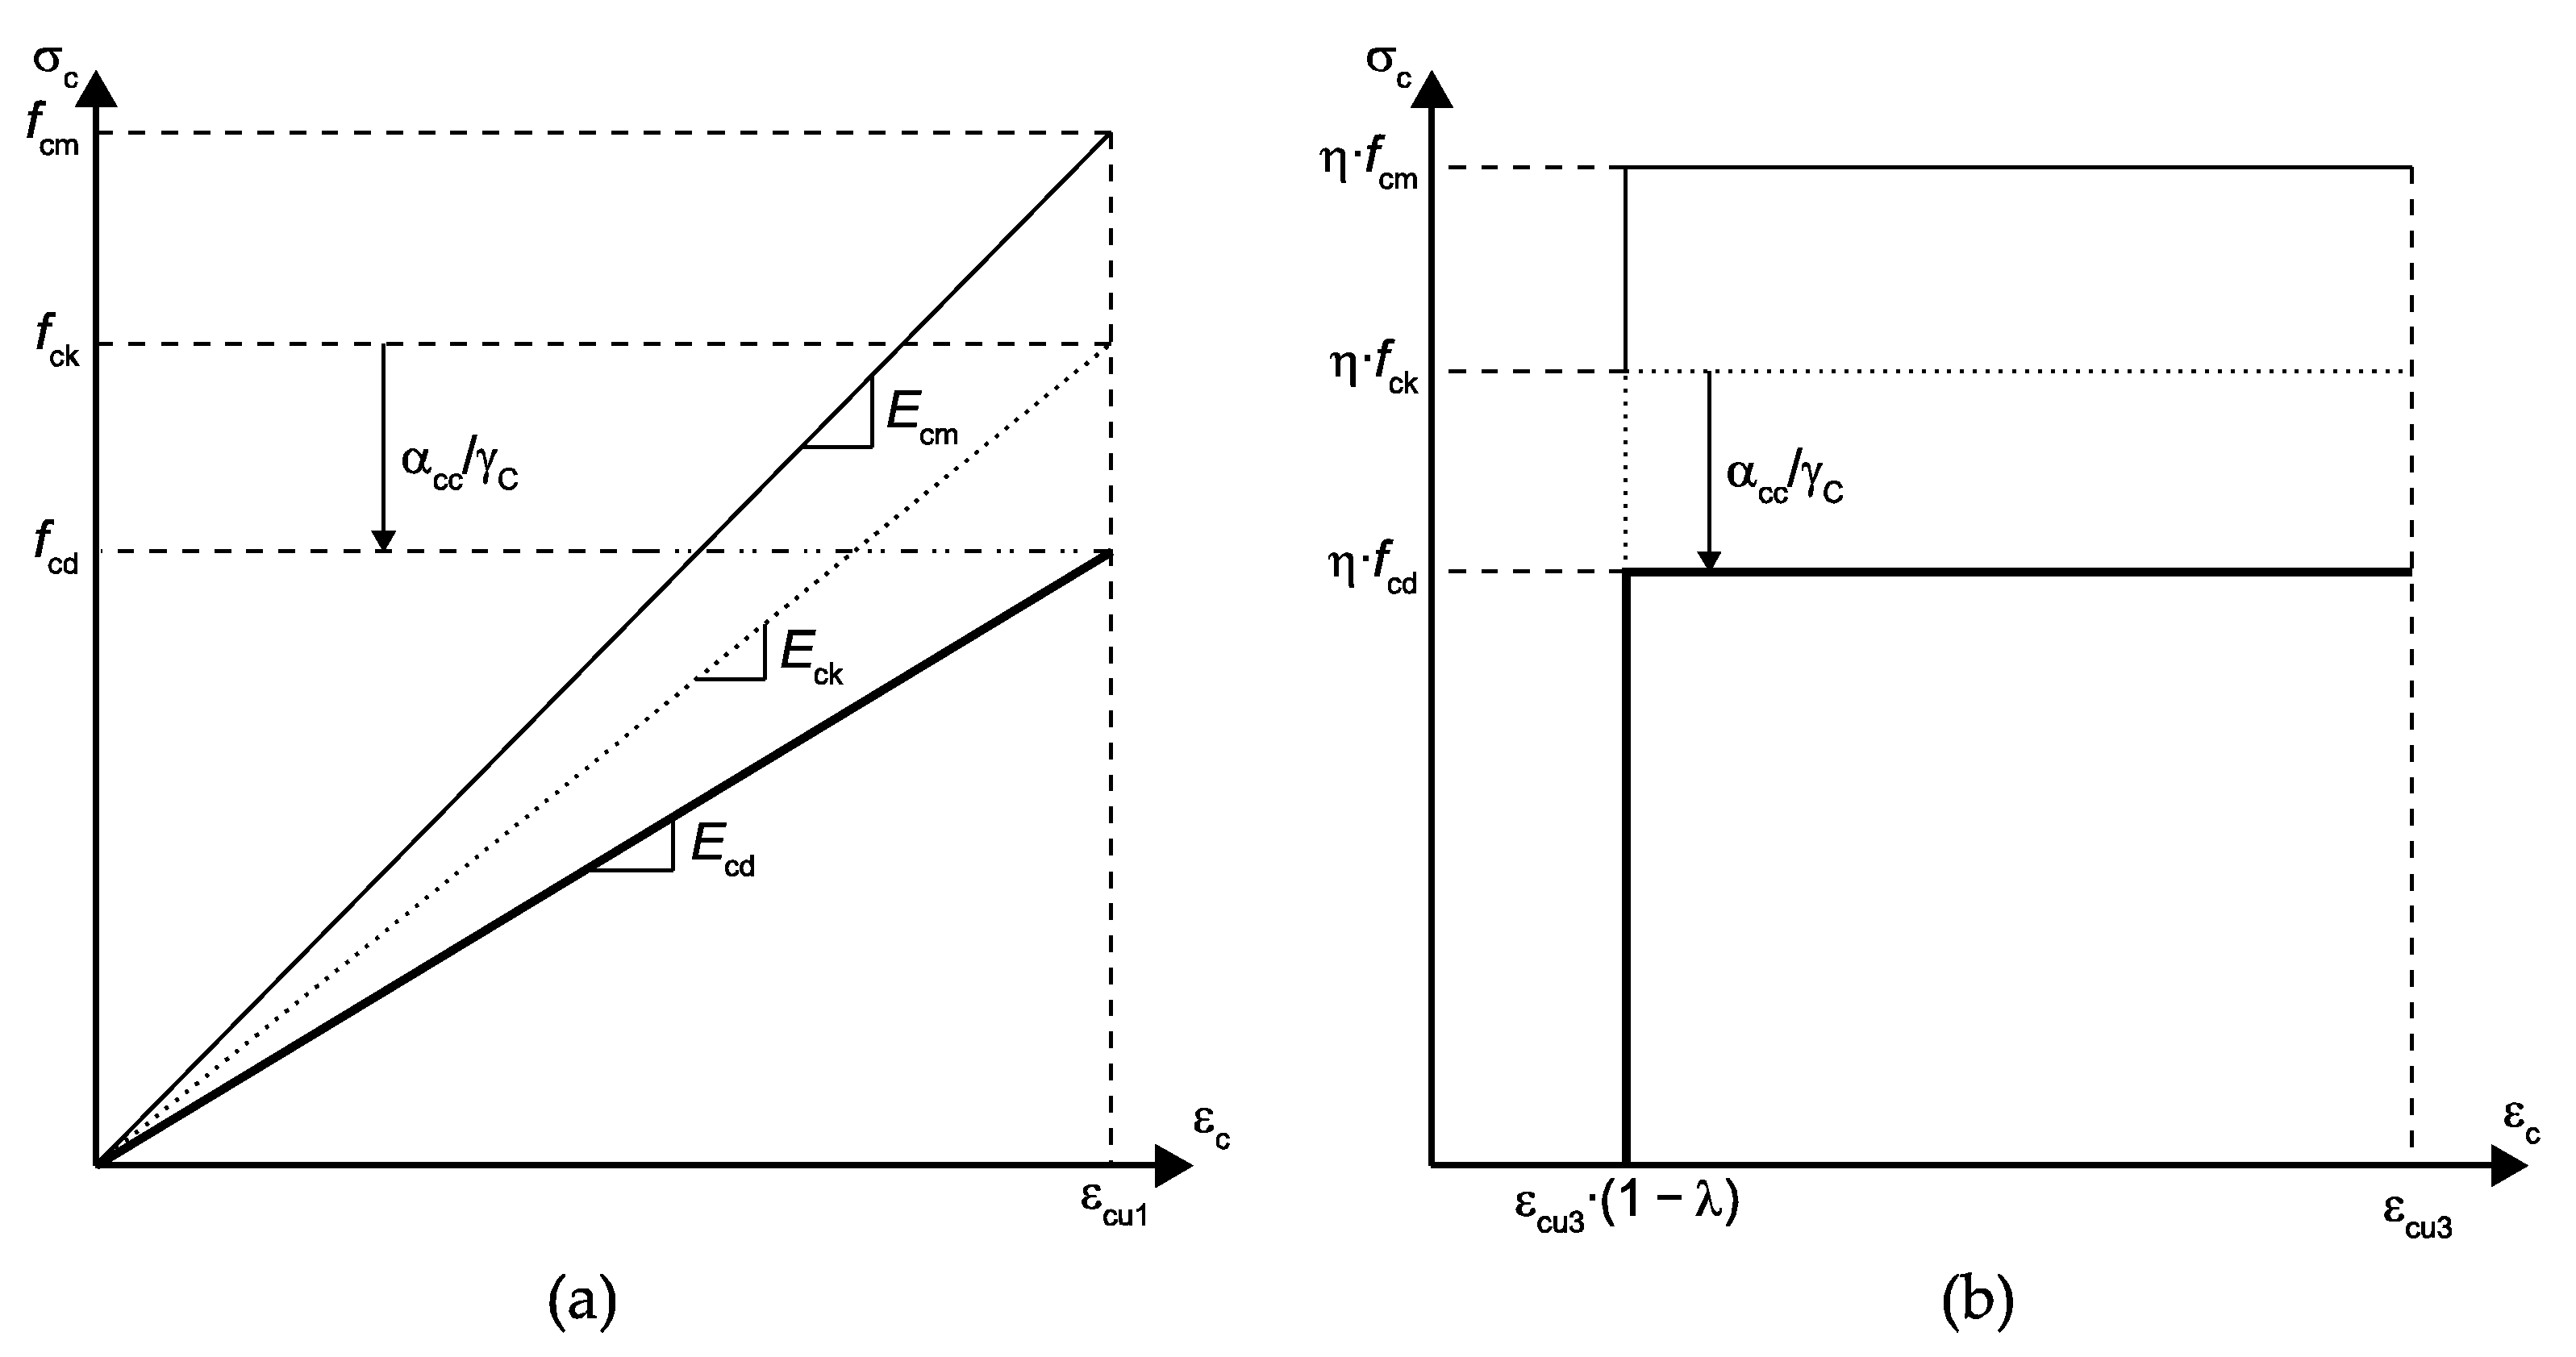
2.3. Design Model
2.4. Material Characteristics
3. Limit State Functions
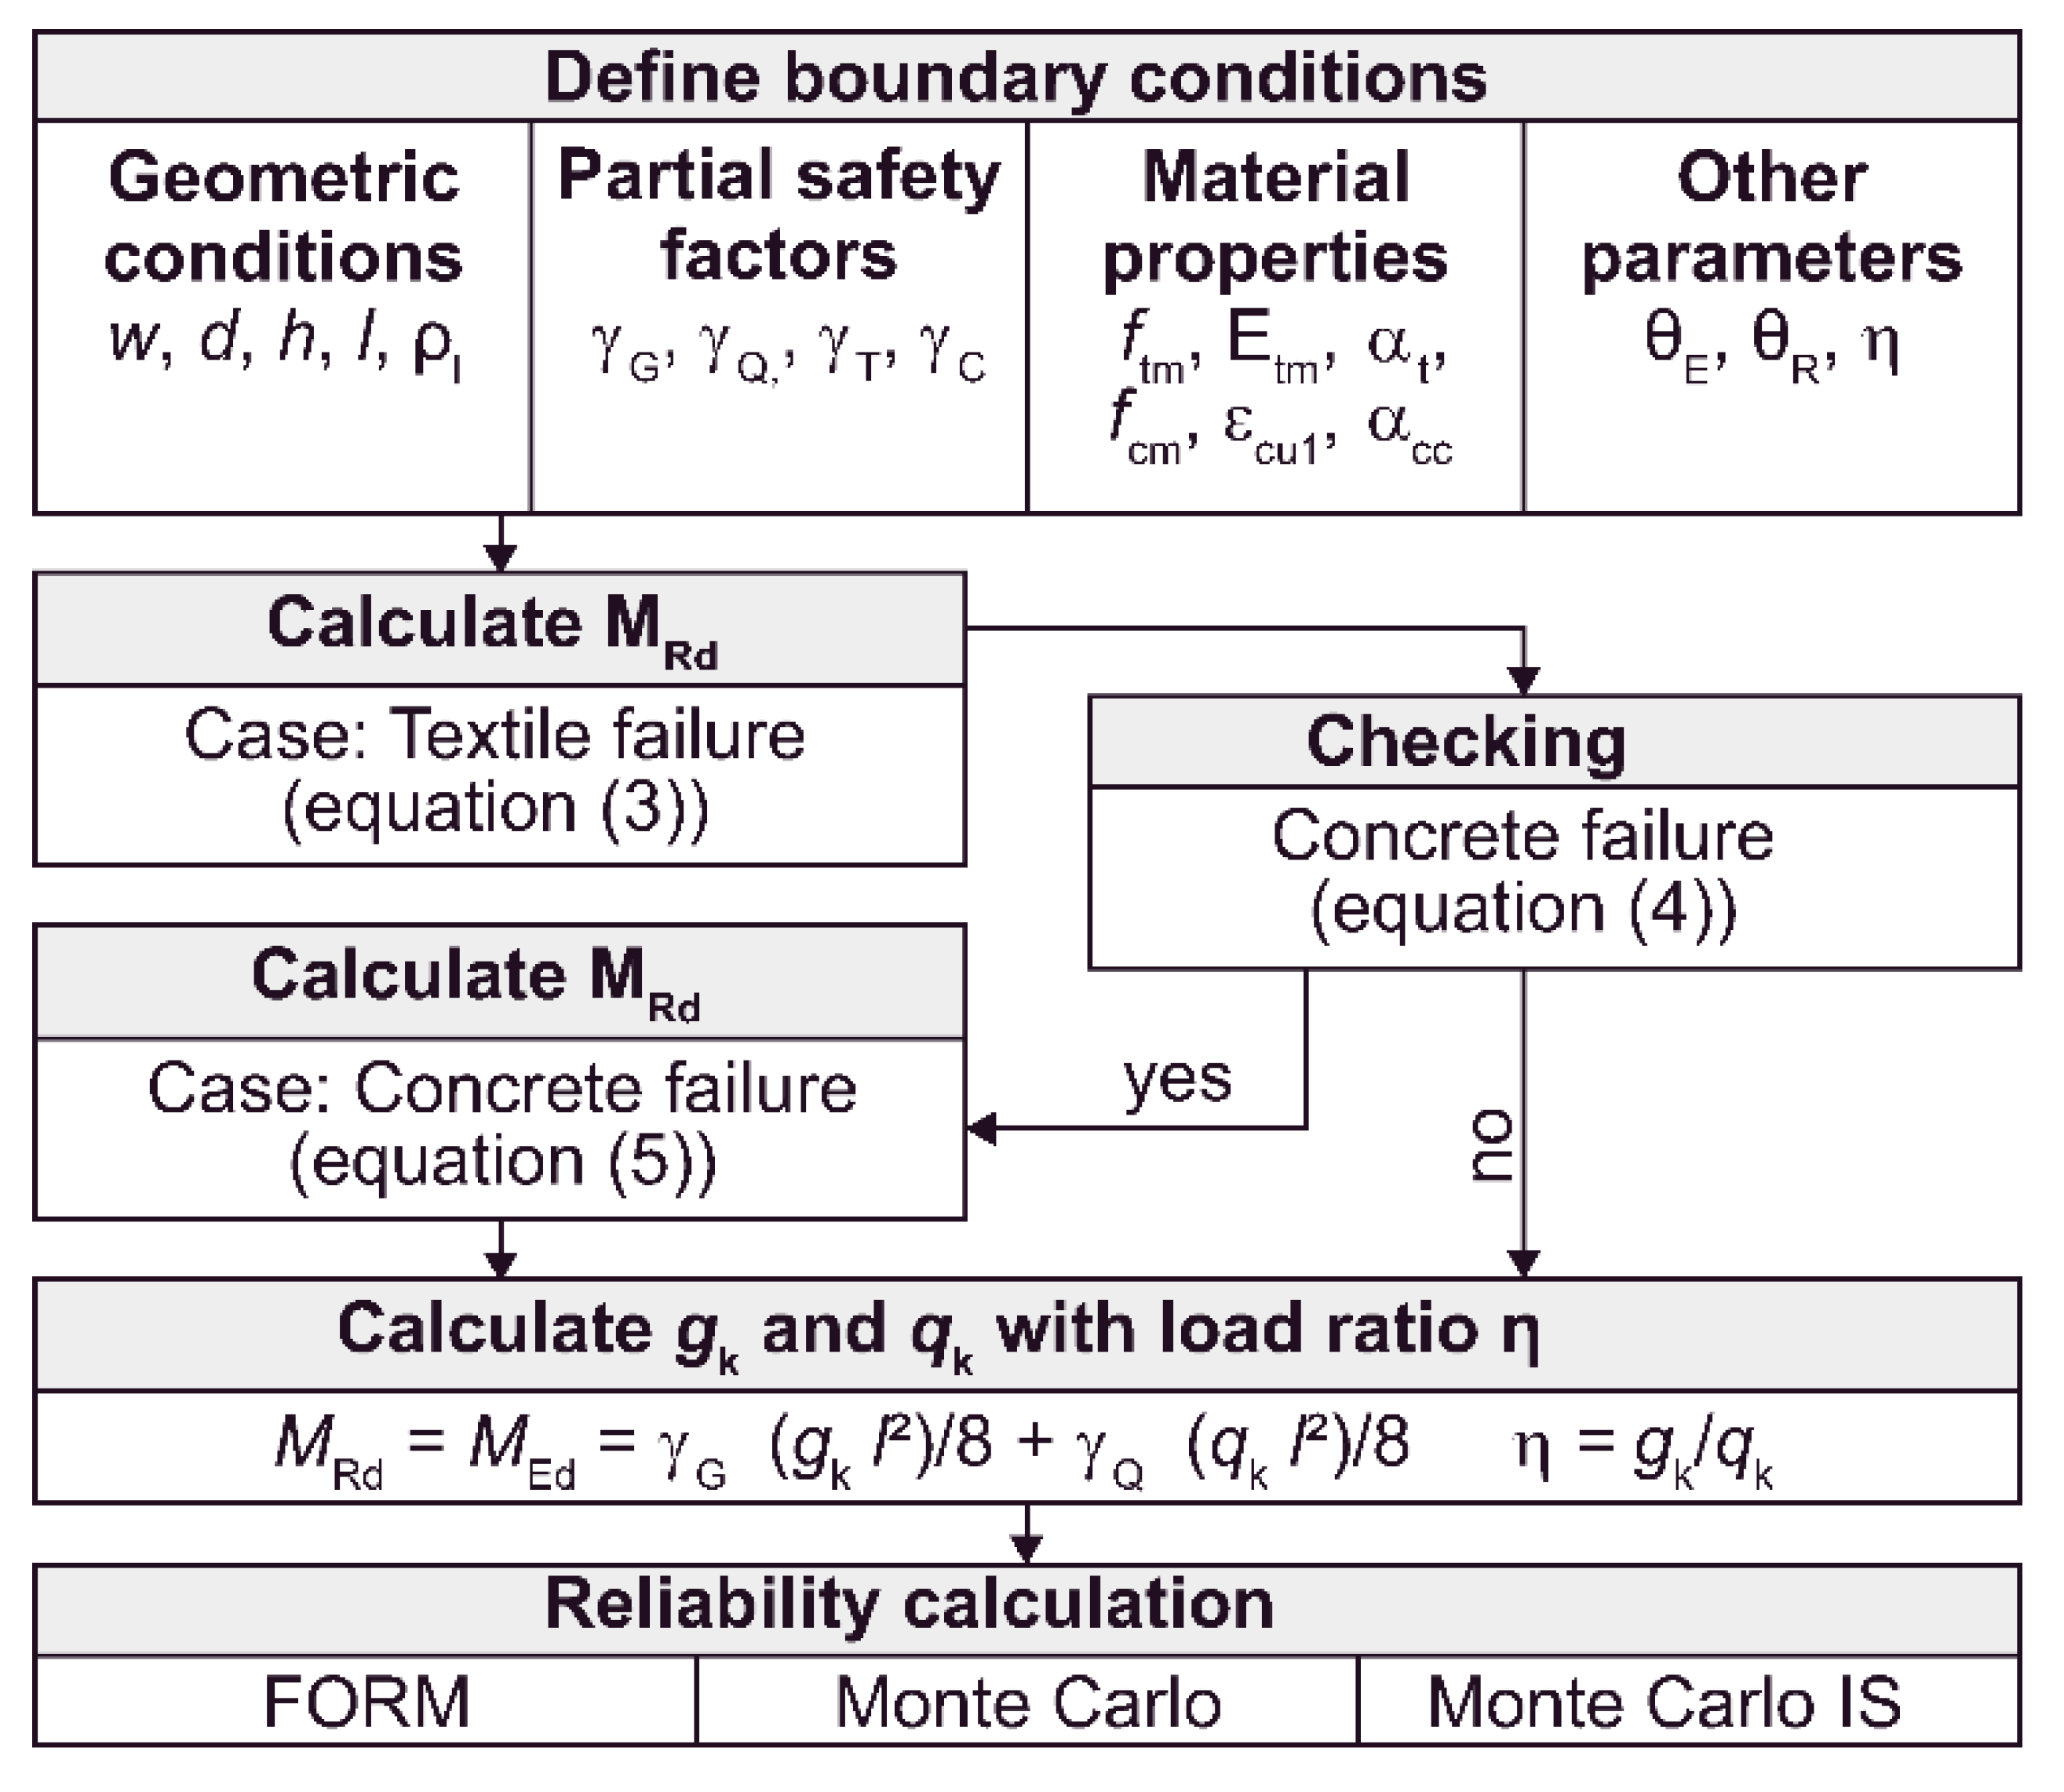
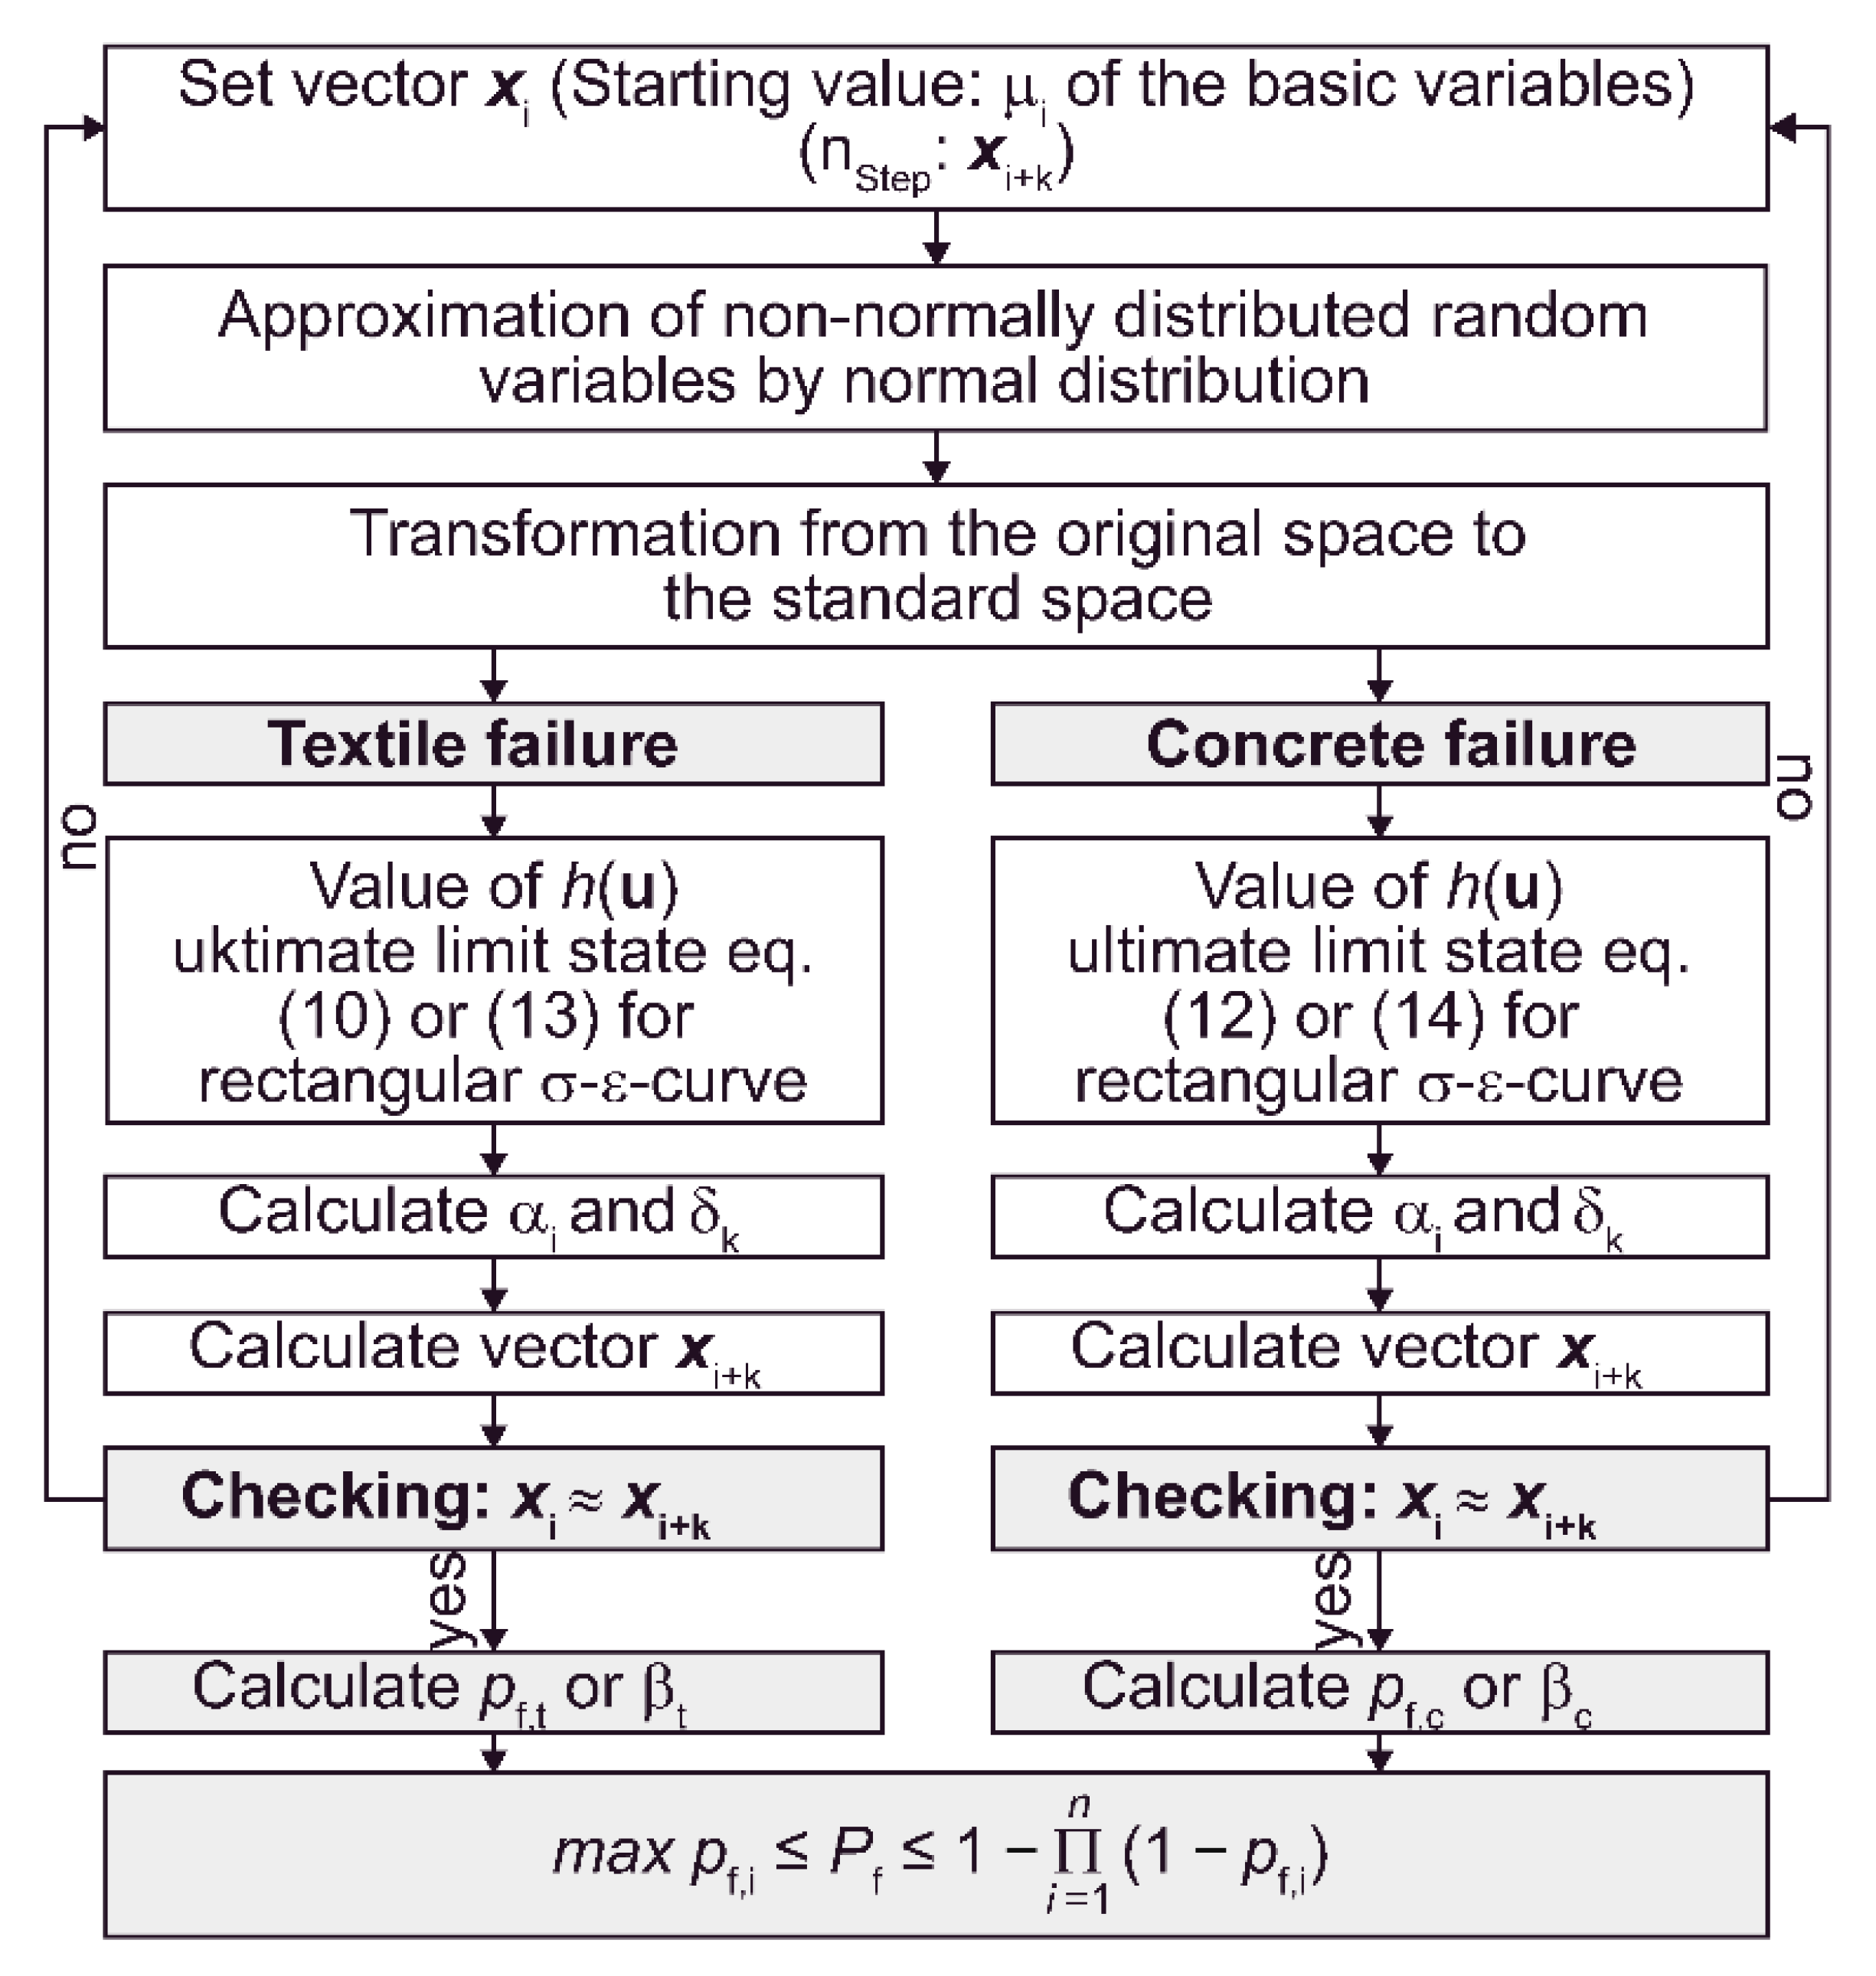
4. Procedure of Reliability Calculation
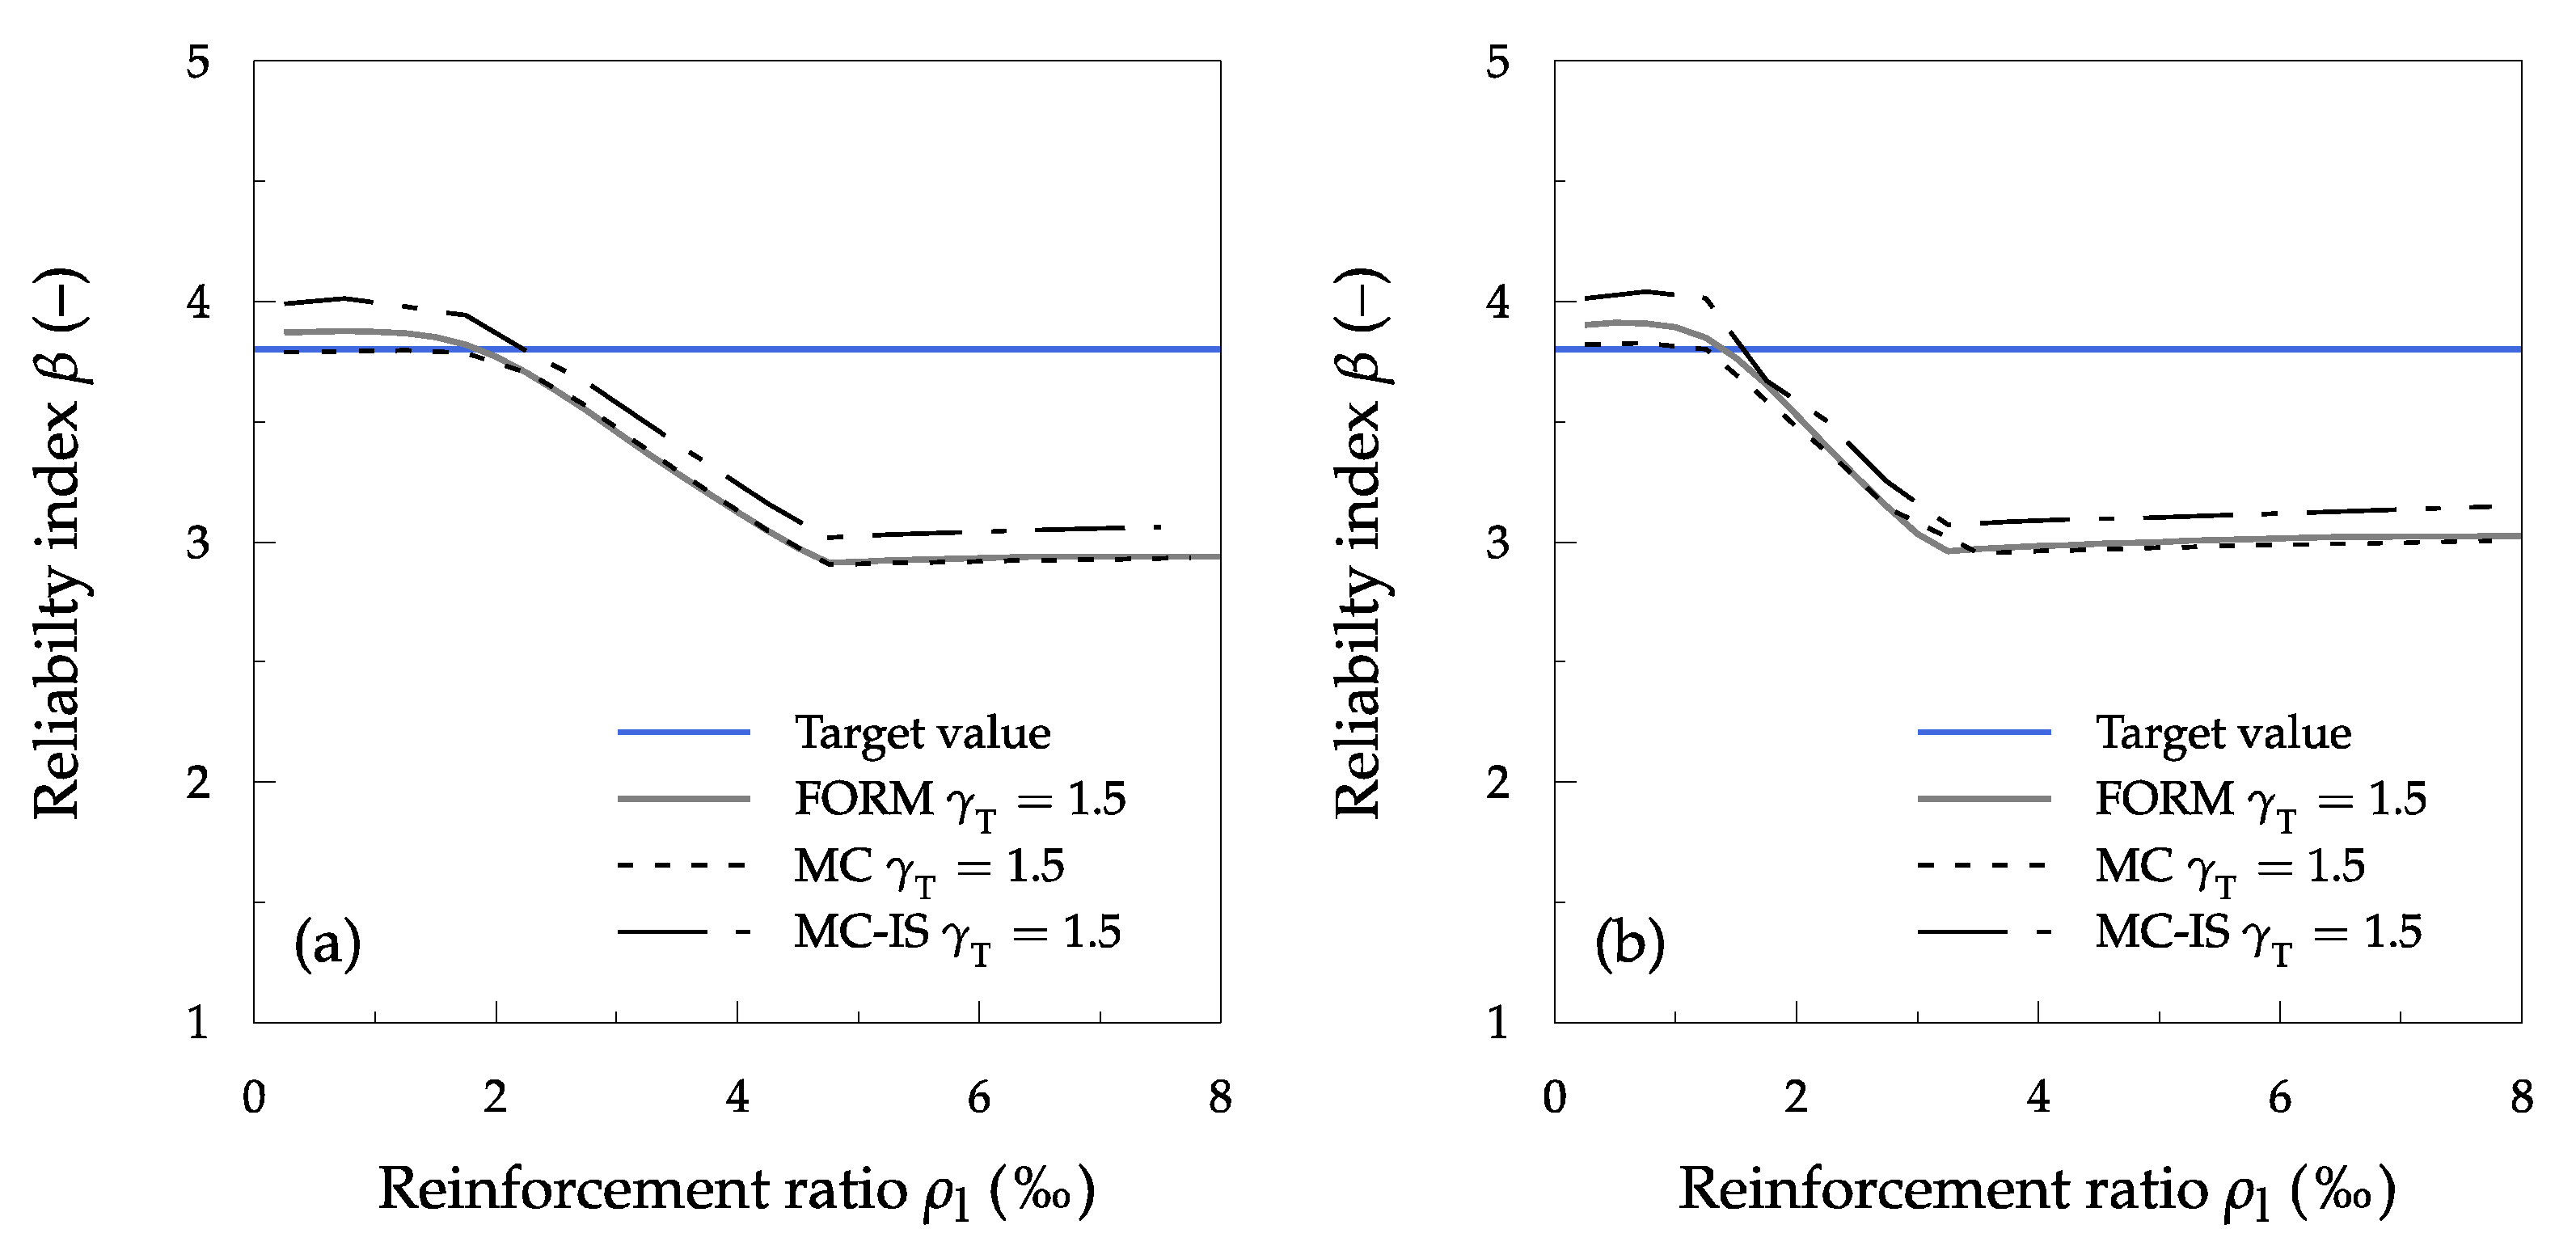
5. Reliability Calculation Results
5.1. General Observations
5.2. Comparison of the Methods for Determining Reliability
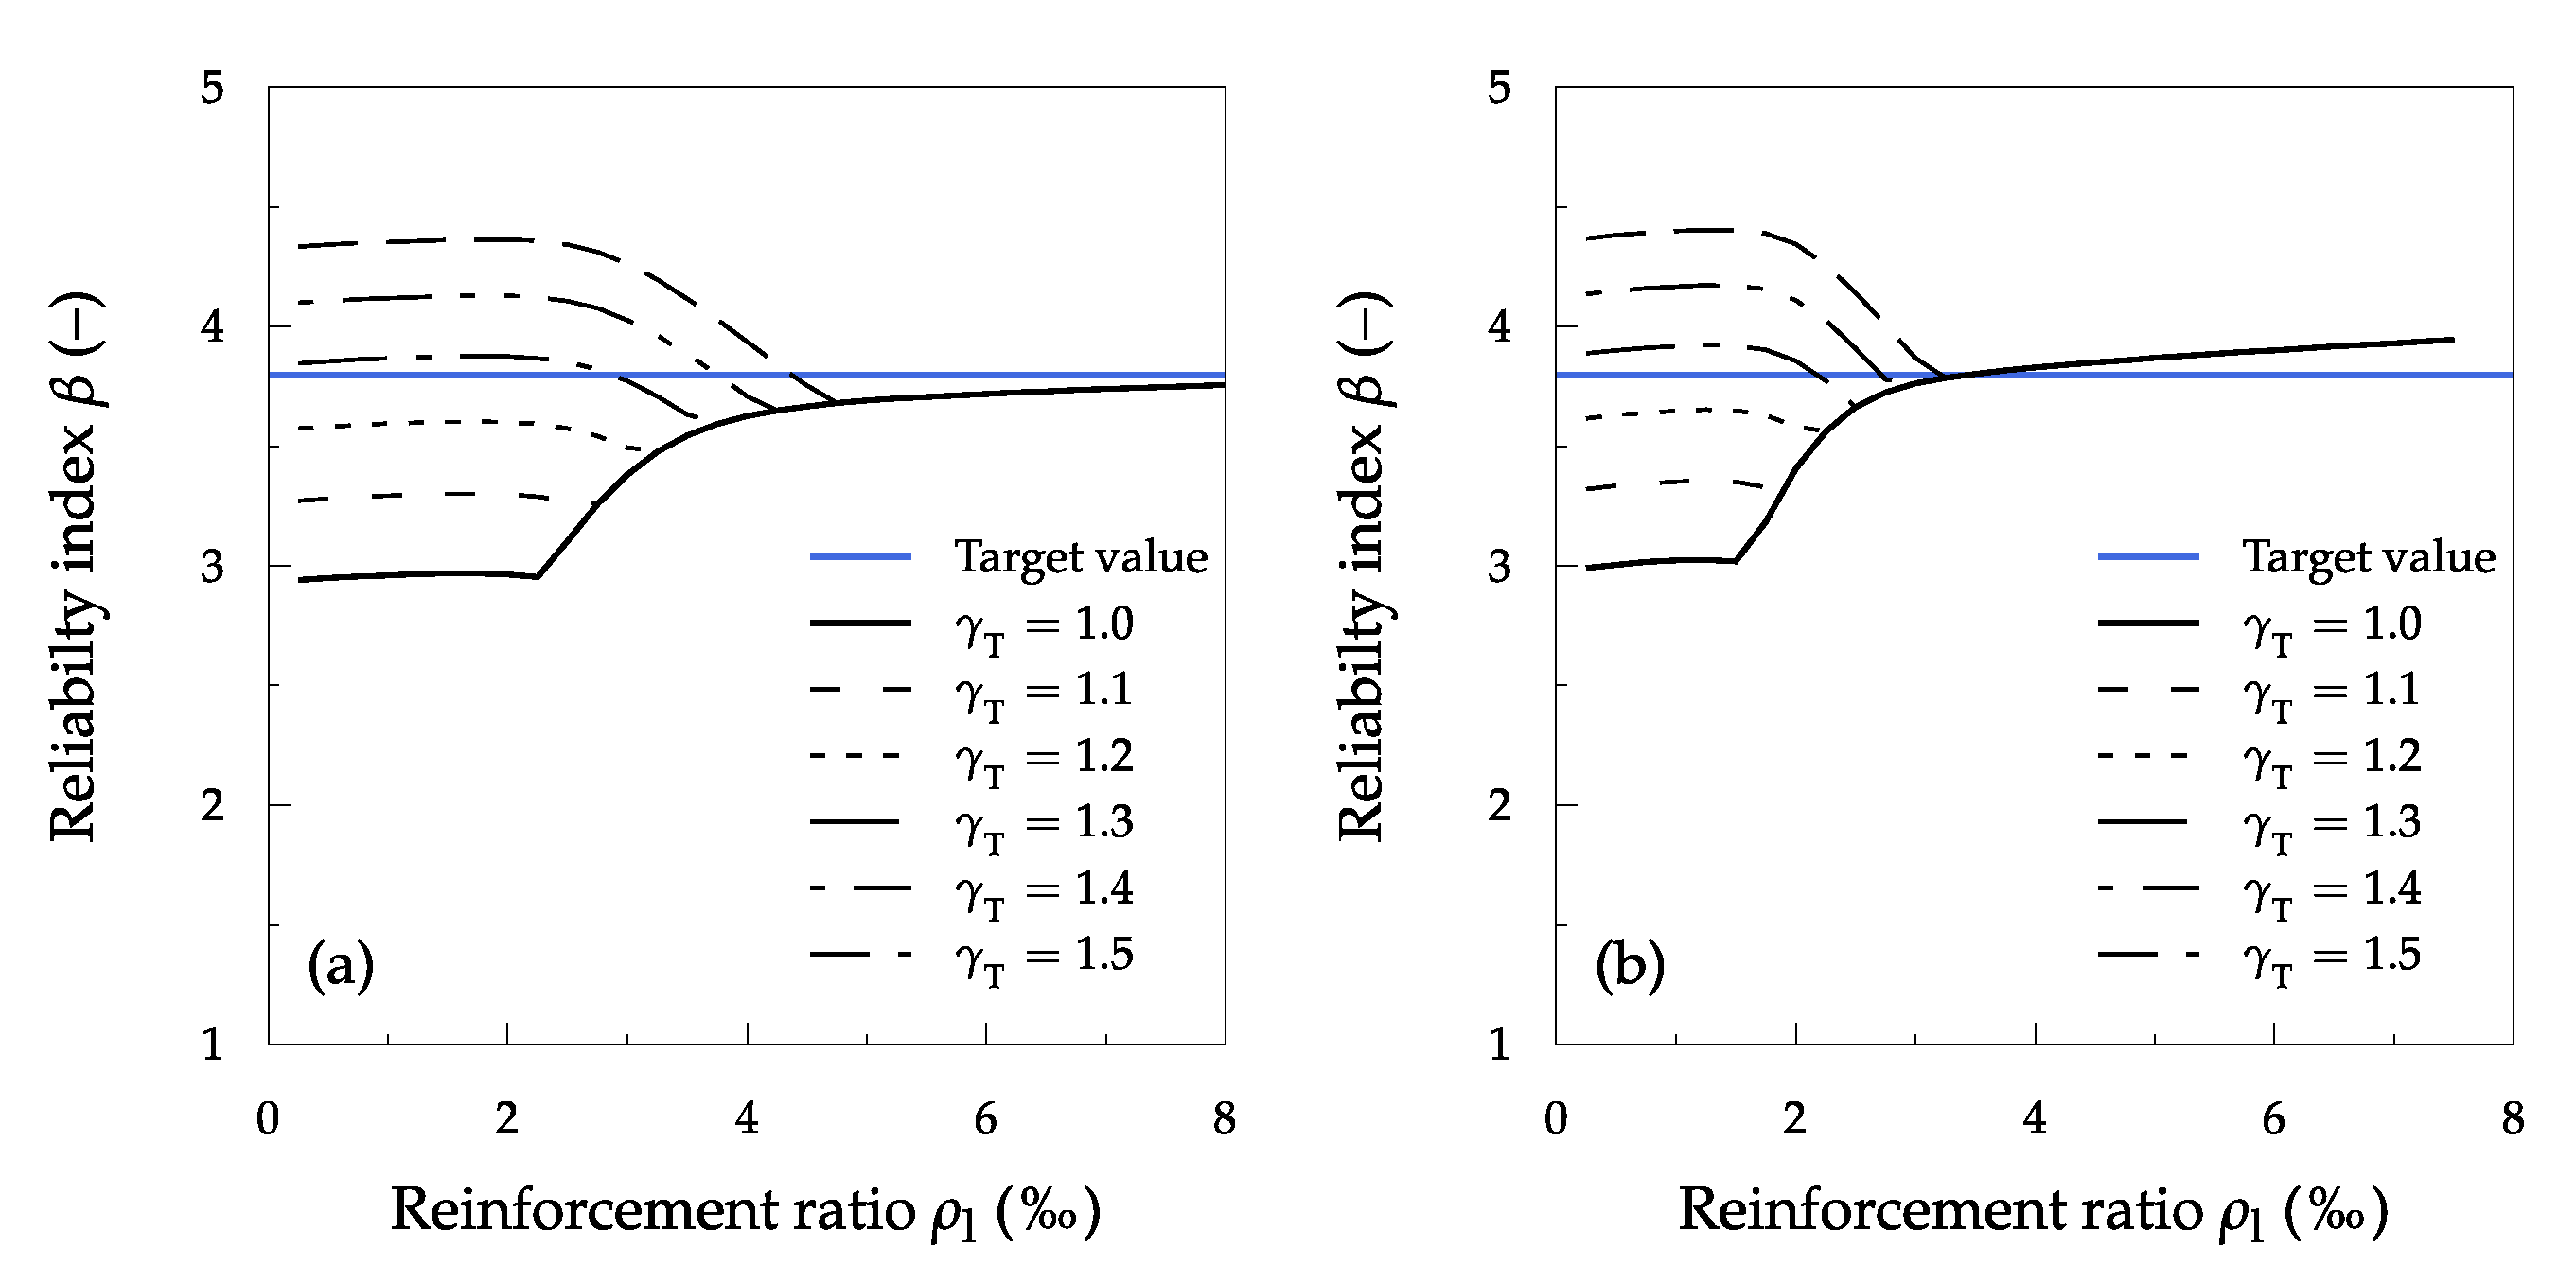
5.3. Influence of the Stress-Strain Curve of Concrete
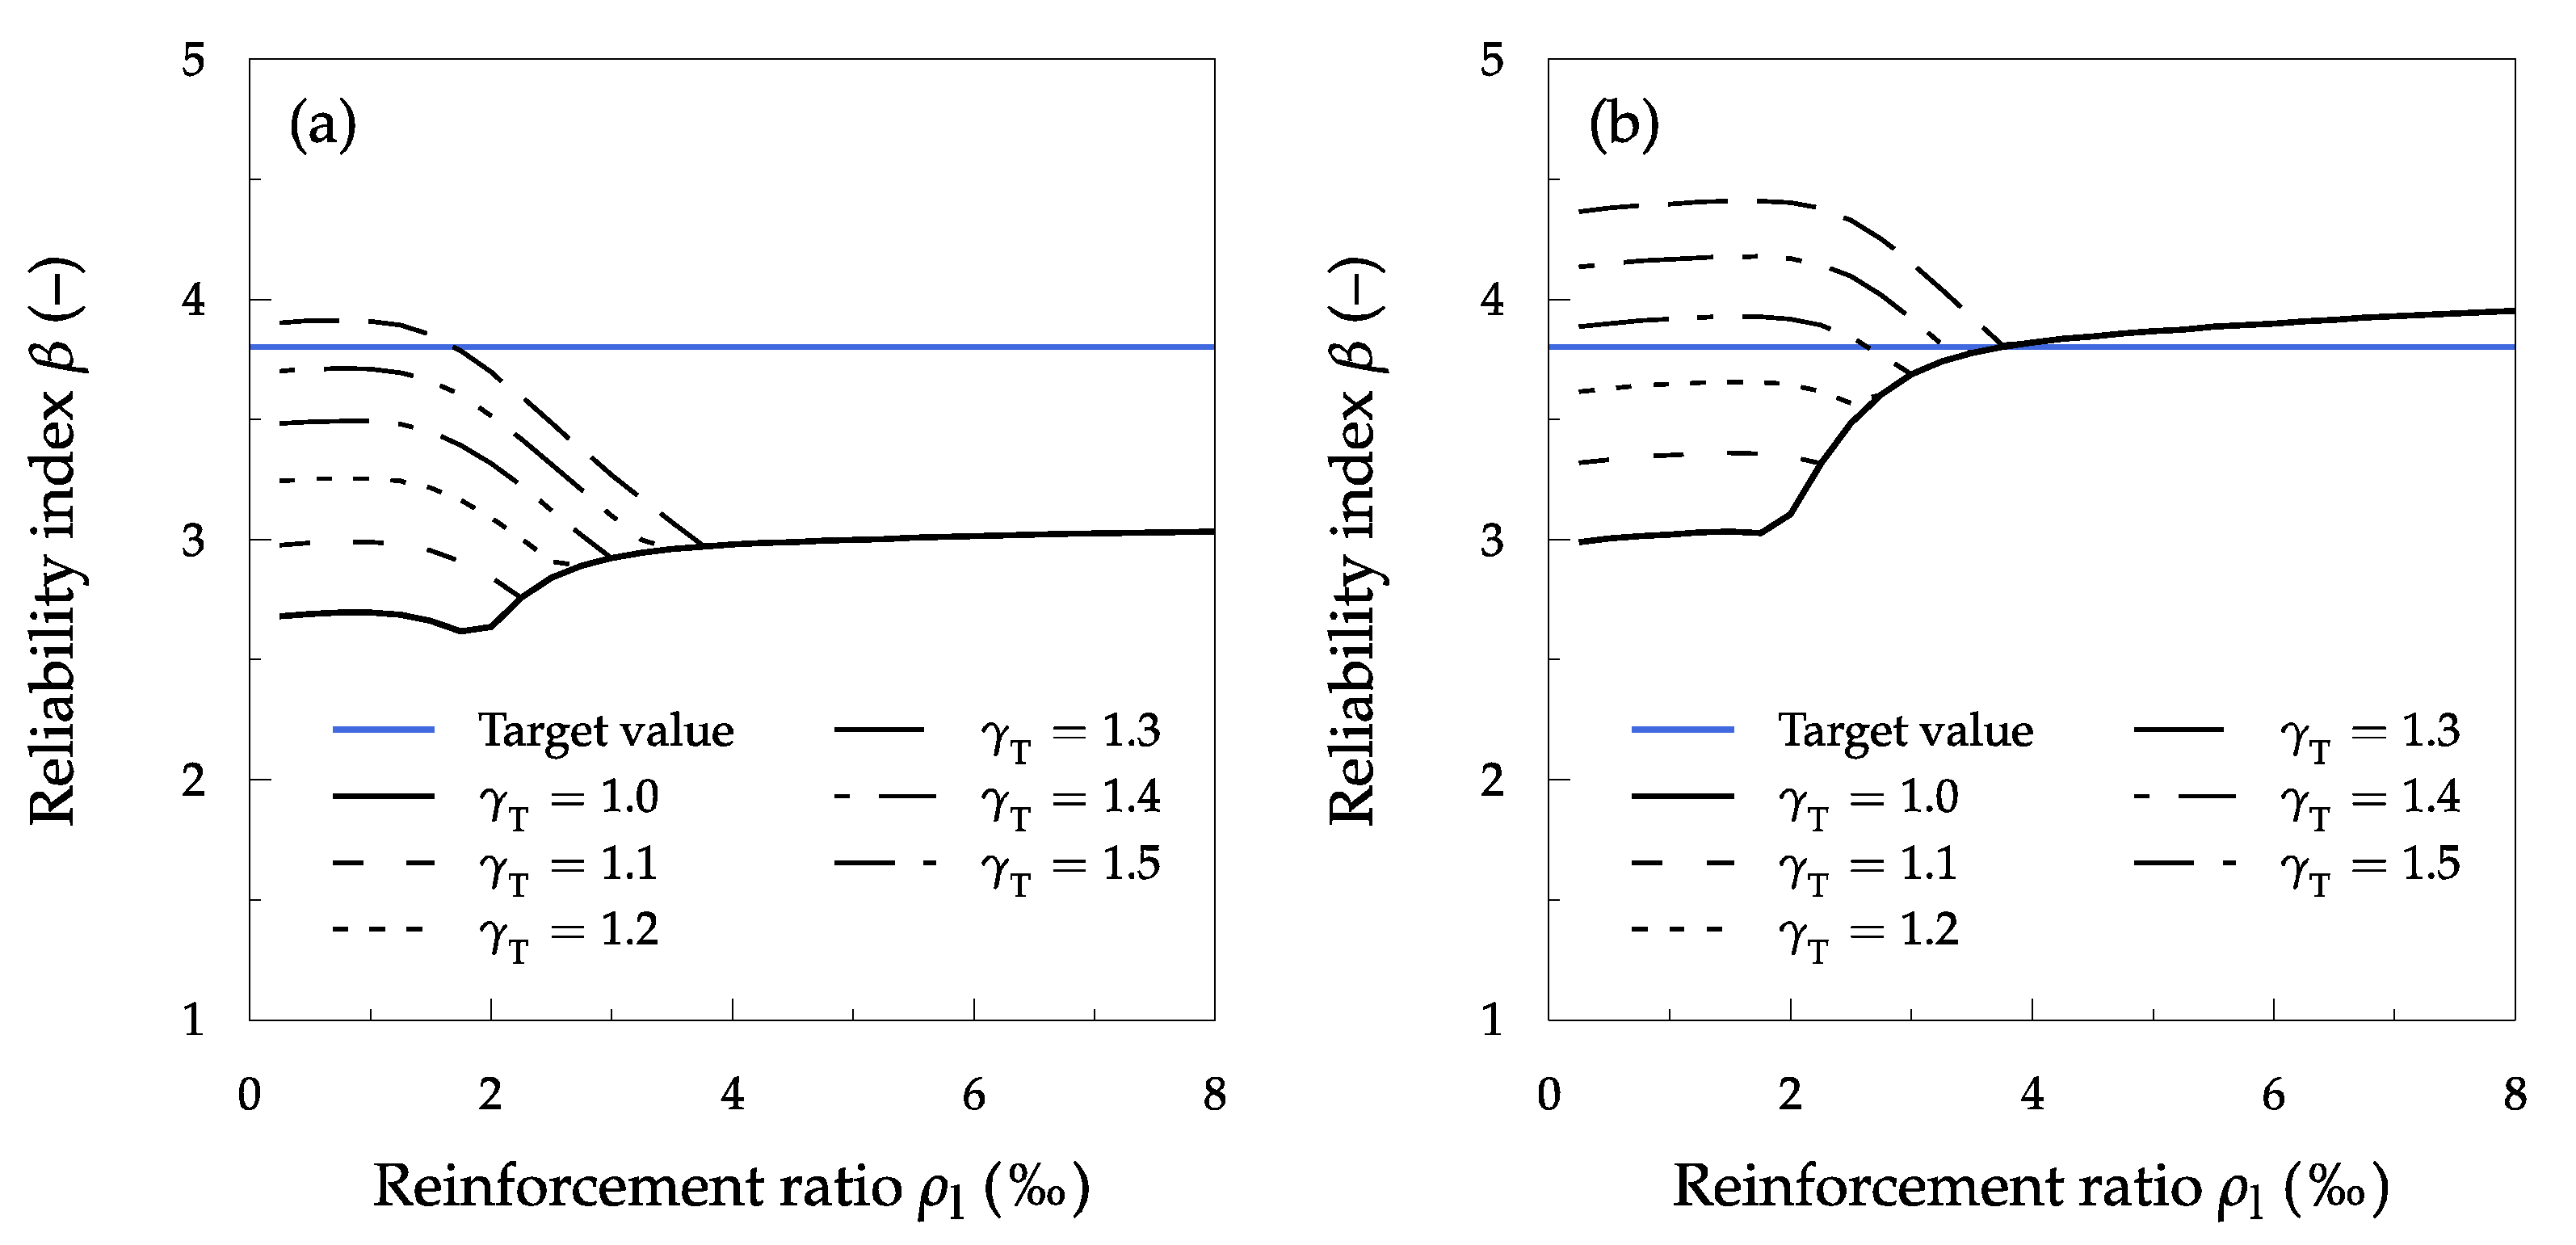
5.4. Influence of the Reinforcement Type
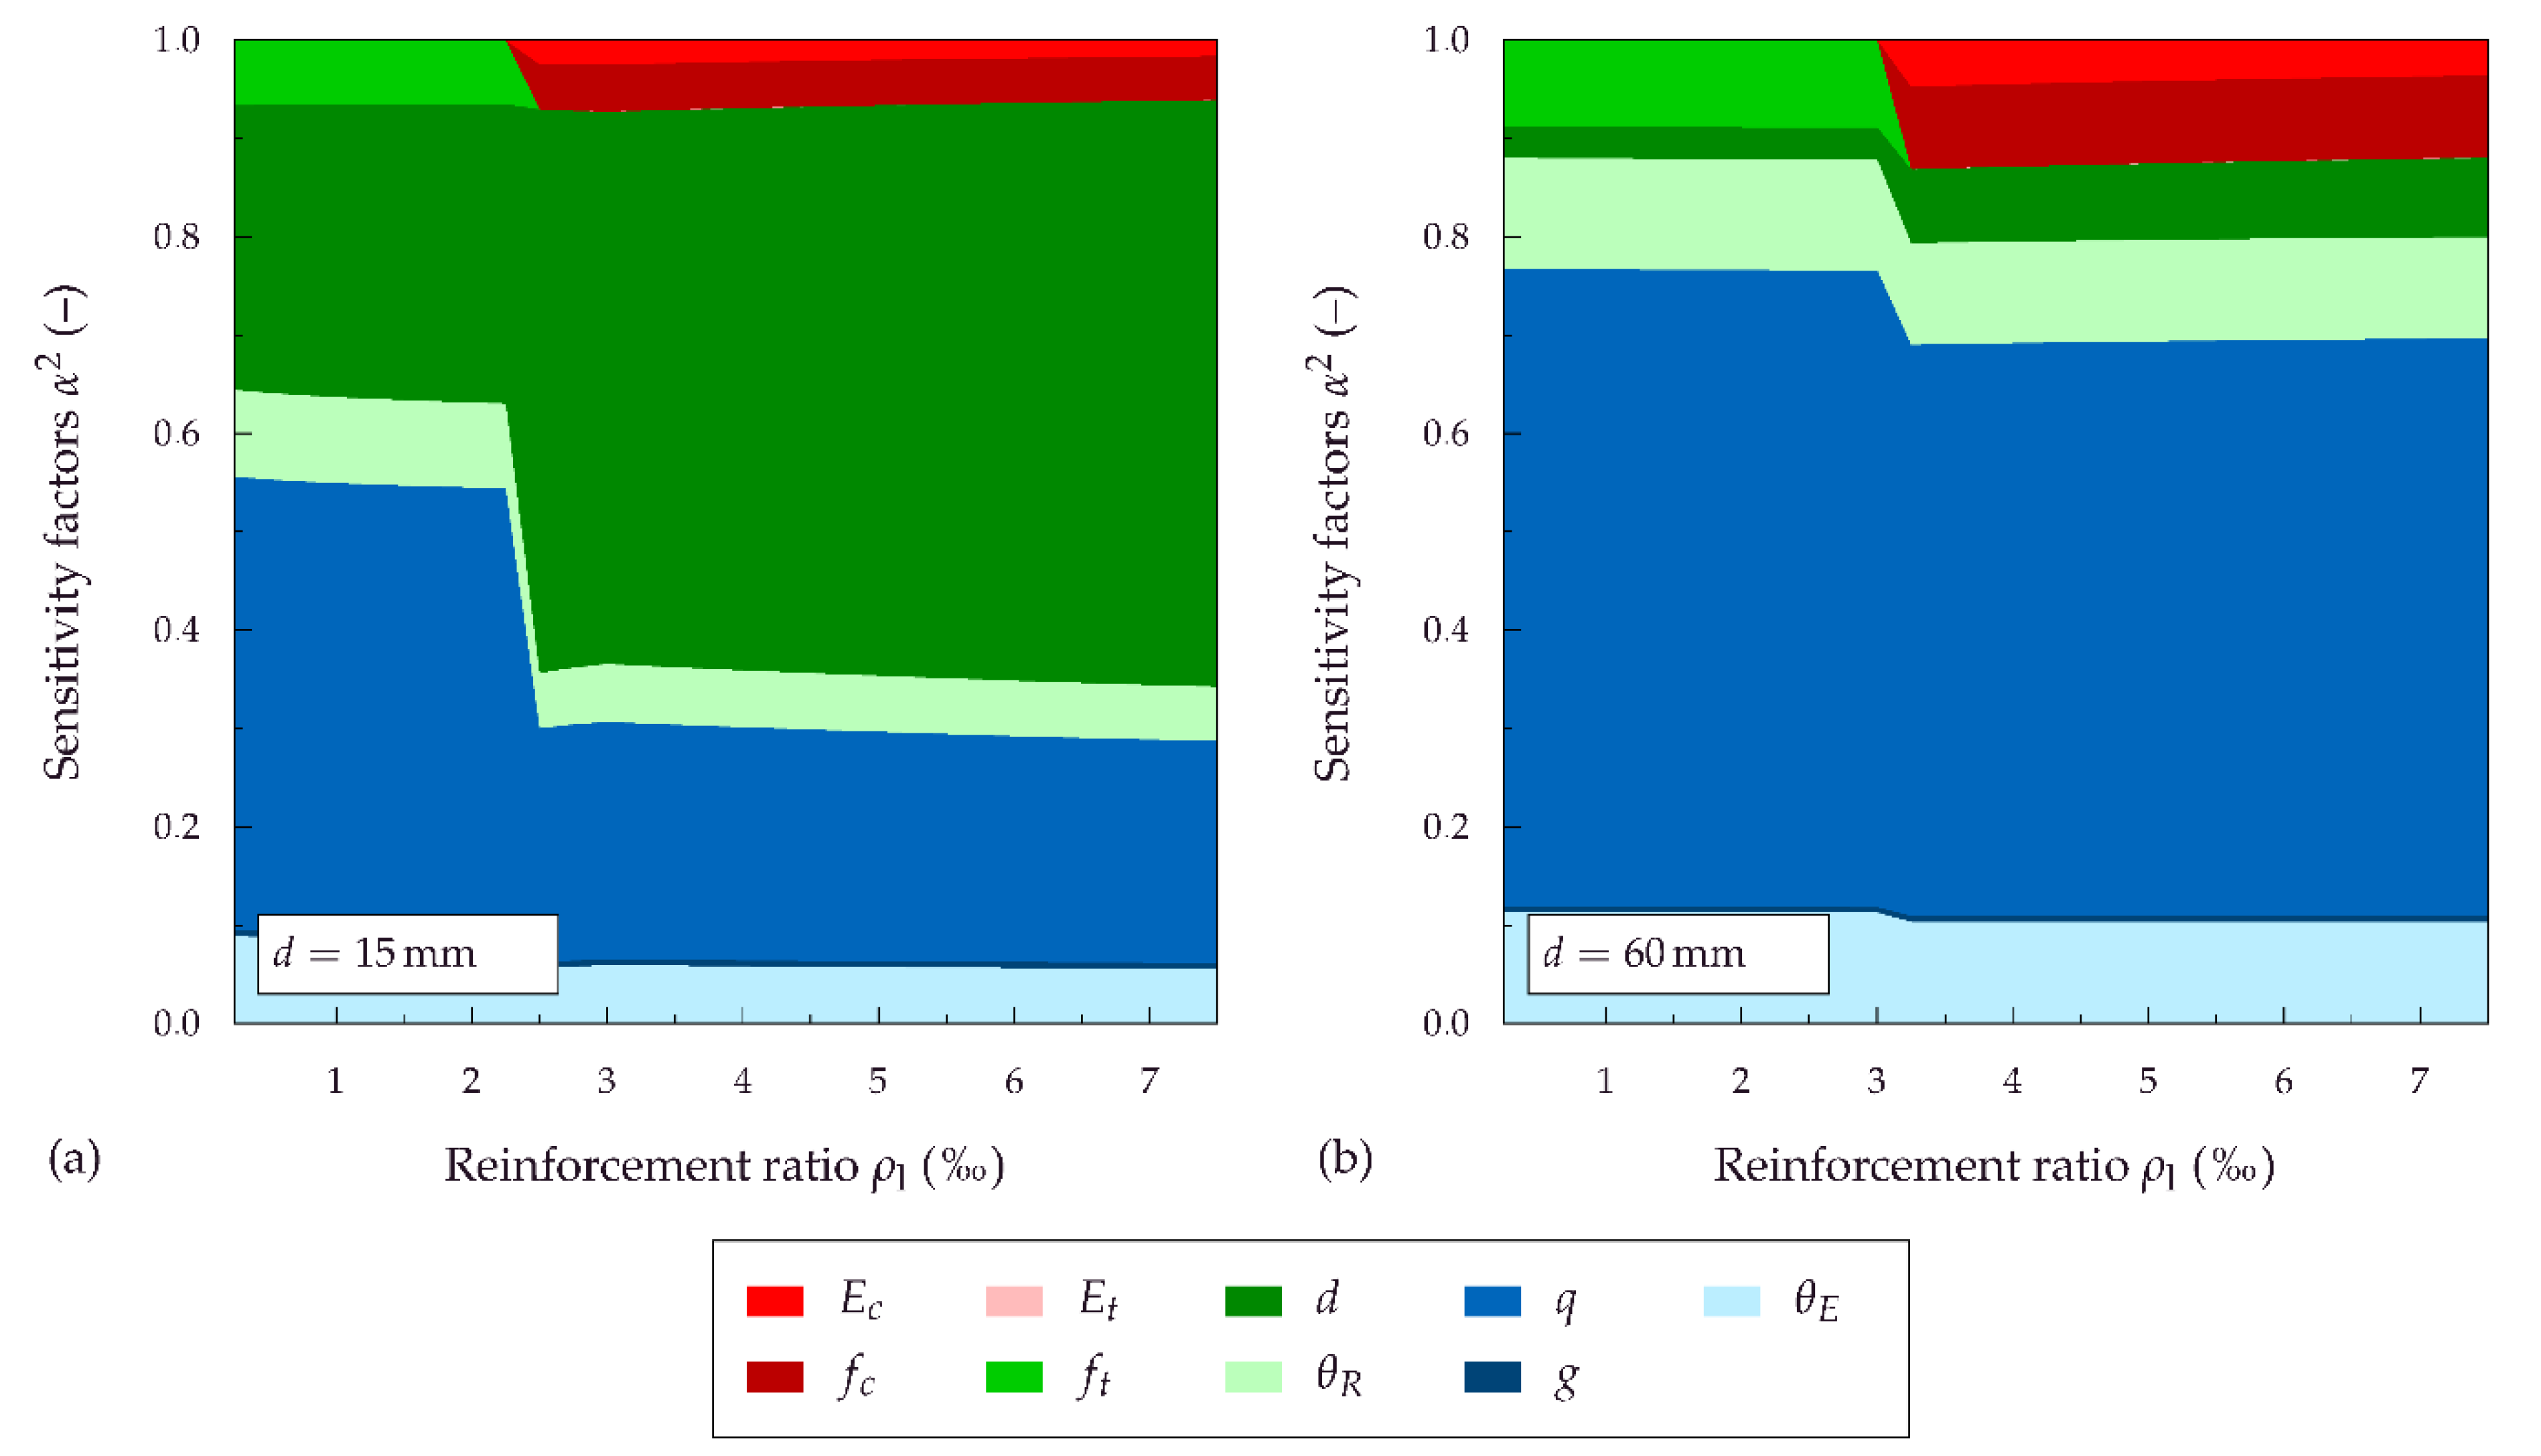
5.5. Influence of the Effective Depth d
6. Summary and Proposal for the Partial Safety Factor for Textile Reinforcement γT
Author Contributions
Funding
Acknowledgments
Conflicts of Interest
References
- Kromoser, B.; Preinstorfer, P.; Kollegger, J. Building lightweight structures with carbon-fiber-reinforced polymerreinforced ultra-high-performance concrete: Research approach, construction materials, and conceptual design of three building components. Struct. Concr. 2019, 20, 730–744. [Google Scholar] [CrossRef]
- Schumann, A.; Michler, H.; Schladitz, F.; Curbach, M. Parking slabs made of carbon reinforced concrete. Struct. Concr. 2018, 19, 647–655. [Google Scholar] [CrossRef]
- Scholzen, A.; Chudoba, R.; Hegger, J. Thin-walled shell structures made of textile-reinforced concrete: Part I. Struct. Concr. 2015, 16, 106–114. [Google Scholar] [CrossRef]
- Bielak, J.; Schmidt, M.; Hegger, J.; Jesse, F. Structural Behavior of Large-Scale I-Beams with Combined Textile and CFRP Reinforcement. Appl. Sci. 2020, 10, 4625. [Google Scholar] [CrossRef]
- Adam, V.; Bielak, J.; Dommes, C.; Will, N.; Hegger, J. Flexural and Shear Tests on Reinforced Concrete Bridge Deck Slab Segments with a Textile-Reinforced Concrete Strengthening Layer. Materials 2020, 13, 4210. [Google Scholar] [CrossRef]
- JCSS. Probabilistic Model Code. Joint Committee for Structural Safety. 2001. Available online: http://www.jcss.byg.dtu.dk (accessed on 1 June 2018).
- Voigt, J. Beitrag zur Bestimmung der Tragfähigkeit bestehender Stahlbetonkonstruktionen auf Grundlage der Systemzuverlässigkeit. Ph.D. Thesis, University of Siegen, Siegen, Germany, 28 February 2014. [Google Scholar]
- Maple. Maplesoft; A division of Waterloo Maple Inc.: Waterloo, ON, Canada, 2017. [Google Scholar]
- Rempel, S. Zur Zuverlässigkeit der Bemessung von biegebeanspruchten Betonbauteilen mit textiler Bewehrung. Ph.D. Thesis, RWTH-Aachen University, Aachen, Germany, 23 April 2018. [Google Scholar]
- Rempel, S.; Ricker, M.; Hegger, J. Zuverlässigkeitsanalyse für biegebeanspruchte Textilbetonbauteile. Beton Stahlbetonbau 2020, 115, 697–709. [Google Scholar] [CrossRef]
- Hegger, J.; Kulas, C.; Horstmann, M. Spatial Textile Reinforcement Structures for Ventilated and Sandwich Facade Elements. Adv. Struct. Eng. 2012, 15, 665–675. [Google Scholar] [CrossRef]
- Shams, A.; Horstmann, M.; Hegger, J. Experimental investigations on Textile-Reinforced Concrete (TRC) sandwich sections. Compos. Struct. 2014, 118, 643–653. [Google Scholar] [CrossRef]
- Stark, A.; Kueres, D.; Hegger, J. Sandwichelemente mit UHPC-Deckschichten und geschäumten PUR-Kernschichten. Beton Stahlbetonbau 2016, 111, 816–827. [Google Scholar] [CrossRef]
- Ehlig, D.; Schladitz, F.; Frenzel, M.; Curbach, M. Textilbeton –Ausgeführte Projekte im Überblick. Beton Stahlbetonbau 2012, 107, 777–785. [Google Scholar] [CrossRef]
- Hegger, J.; Kulas, C.; Raupach, M.; Büttner, T. Tragverhalten und Dauerhaftigkeit einer schlanken Textilbetonbrücke—Eine 97 m lange Fußgängerbrücke mit einer Bewehrung aus AR-Glasfilamenten. Beton Stahlbetonbau 2011, 106, 72–80. [Google Scholar] [CrossRef]
- Hegger, J.; Goralski, C.; Kulas, C. Schlanke Fußgängerbrücke aus Textilbeton—Sechsfeldrige Fußgängerbrücke mit einer Gesamtlänge von 97 m. Beton Stahlbetonbau 2011, 106, 64–71. [Google Scholar] [CrossRef]
- Helbig, T.; Rempel, S.; Unterer, K.; Kulas, C.; Hegger, J. Fuß- und Radwegbrücke aus Carbonbeton in Albstadt-Ebingen. Die weltweit erste ausschließlich carbonfaserbewehrte Betonbrücke. Beton Stahlbetonbau 2016, 111, 676–685. [Google Scholar] [CrossRef]
- Curbach, M.; Graf, W.; Jesse, D.; Sickert, J.-U.; Weiland, S. Segmentbrücke aus textilbewehrtem Beton—Konstruktion, Fertigung, numerische Berechnung. Beton Stahlbetonbau 2007, 102, 342–352. [Google Scholar] [CrossRef]
- Ricker, M. Zur Zuverlässigkeit der Bemessung gegen Durchstanzen bei Einzelfundamenten. Ph.D. Thesis, RWTH-Aachen University, Aachen, Germany, 23 November 2009. [Google Scholar]
- Fischer, A. Bestimmung modifizierter Teilsicherheitsbeiwerte zur semiprobabilistischen Bemessung von Stahlbetonkonstruktionen im Bestand. Ph.D. Thesis, University of Kaiserslautern, Kaiserslautern, Germany, 5 November 2010. [Google Scholar]
- DIN EN 1990:2002 + A1:2005 + A1:2005/AC:2010. Eurocode: Basis of Structural Design. CEN European Committee for Standardization. 2002. Available online: https://shop.standards.ie/preview/98706582598.pdf?sku=861303_SAIG_NSAI_NSAI_2049116 (accessed on 18 October 2020).
- Rempel, S.; Ricker, M. Ermittlung der Materialkennwerte der Bewehrung für die Bemessung von textilbewehrten Bauteilen. Bauingenieur 2017, 92, 280–288. [Google Scholar]
- Rempel, S.; Ricker, M.; Hegger, J. Biegebemessungsmodell mit einer geschlossenen und iterativen Lösung für Textilbetonbauteilen. Beton Stahlbeton 2019, 115, 218–230. [Google Scholar] [CrossRef]
- DIN EN 1992-1-1:2004 + AC:2010. In Eurocode 2: Design of Concrete Structures—Part 1–1: General Rules and Rules for Buildings; Beuth: Berlin, Germany, 2011.
- Spelter, A.; Bergmann, S.; Bielak, J.; Hegger, J. Long-Term Durability of Carbon-Reinforced Concrete: An Overview and Experimental Investigations. Appl. Sci. 2019, 9, 1651. [Google Scholar] [CrossRef]
- Ditlevsen, O.; Madsen, H. Structural Reliability Methods, 1st ed.; Wiley: New York, NY, USA, 1996. [Google Scholar]
- Six, M. Sicherheitskonzept für nichtlineare Traglastverfahren im Betonbau. In Heftreihe des Deutschen Ausschuss für Stahlbeton, 1st ed.; Beuth: Berlin, Germany, 2003; Volume 534. [Google Scholar]
- Melchers, R.E.; Beck, A.T. Structural Reliability Analysis and Prediction; John Wiley & Sons: Hoboken, NJ, USA, 2018. [Google Scholar]
- Rackwitz, R. Zuverlässigkeit von Tragwerken. In Handbuch für Bauingenieure; Zilch, K., Diederichs, C.J., Katzenbach, R., Eds.; Springer: Berlin, Germany, 2001. [Google Scholar]
- DIN 1045 Juli 1988. In Beton Stahlbeton; Bemessung und Ausführung: Berlin, Germany, 1988.
- Bielak, J.; Spelter, A.; Will, N.; Claßen, M. Verankerungsverhalten textiler Bewehrungen in dünnen Betonbauteilen. Beton Stahlbetonbau 2018, 113, 515–524. [Google Scholar] [CrossRef]
- Bielak, J.; Adam, V.; Hegger, J.; Classen, M. Shear capacity of textile-reinforced concrete slabs without shear reinforcement. Appl. Sci. 2019, 9, 1382. [Google Scholar] [CrossRef]
- Stark, A.; Classen, M.; Knorrek, C.; Camps, B.; Hegger, J. Sandwich panels with folded plate and doubly curved UHPFRC facings. Struct. Concr. 2018, 19, 1851–1861. [Google Scholar] [CrossRef]
- Stark, A.; Classen, M.; Hegger, J. Bond behaviour of CFRP tendons in UHPFRC. Eng. Struct. 2019, 178, 148–161. [Google Scholar] [CrossRef]
- Herbrand, M.; Adam, V.; Classen, M.; Kueres, D.; Hegger, J. Strengthening of existing bridge structures for shear and bending with carbon textile-reinforced mortar. Materials 2017, 10, 1099. [Google Scholar] [CrossRef] [PubMed]
- Classen, M. Shear Crack Propagation Theory (SCPT)–The mechanical solution to the riddle of shear in RC members without shear reinforcement. Eng. Struct. 2020, 210, 110207. [Google Scholar] [CrossRef]


| Parameter 1 | Description | DT 2 | Unit | μX3 | σX4 |
|---|---|---|---|---|---|
| dI | effective depth | ND | (mm) | 15 | 2 |
| dII | effective depth | ND | (mm) | 60 | 3 |
| hI | height | det. | (mm) | 30 | – |
| hII | height | det. | (mm) | 80 | – |
| B | width | det. | (mm) | 1000 | – |
| L | span | det. | (mm) | 1000 | – |
| ρl | reinforcement ratio | varies | (–) | – | – |
| Parameter | Description | DT 1 | Unit | Char. Value | μx | σx | vx |
|---|---|---|---|---|---|---|---|
| G | dead loads [19] | ND | (N/mm2) | gk | gk | 0.1 gk | 0.1 |
| Q | live loads [19] | Ext. I | (N/mm2) | qk | 0.7 qk | 0.14 qk | 0.2 |
| η1 | load ratio g/q | det. | (–) | – | 0.5 | – | – |
| η2 | load ratio g/q | det. | (–) | – | 1.0 | – | – |
| Parameter | Description | Unit | Value |
|---|---|---|---|
| γG | dead load | (–) | 1.35 |
| γQ | variable load | (–) | 1.5 |
| Parameter | Description | DT 1 | Unit | Char. Value | μx | σx | vx |
|---|---|---|---|---|---|---|---|
| θE | action | LN | (–) | (–) | 1.0 | (–) | 0.1 |
| θR | resistance | LN | (–) | (–) | 1.0 | (–) | 0.1 |
| Parameter | Description | DT | Unit | Char. Value | μX | σX | vX |
|---|---|---|---|---|---|---|---|
| fc,50 | C50/60 | LN | (N/mm2) | 50 | 58 | 5 | 0.09 |
| fc,90 | C90/105 | LN | (N/mm2) | 90 | 98 | 5 | 0.05 |
| εcu1,50 | C50/60 | LN | (‰) | (–) | 3.5 | (–) | 0.15 |
| εcu1,90 | C90/105 | LN | (‰) | (–) | 2.8 | (–) | 0.15 |
| εcu3,50 | C50/60 | LN | (‰) | (–) | 3.5 | (–) | 0.15 |
| εcu3,90 | C90/105 | LN | (‰) | (–) | 2.6 | (–) | 0.15 |
| αcc | permanent concrete | det | (–) | (–) | 0.85 | (–) | (–) |
| Parameter | Description | DT | Unit | Char. Value | μX | σX | vX |
|---|---|---|---|---|---|---|---|
| ft,A | AR-glass | ND | (N/mm2) | 1150 | 1300 | 91 | 0.07 |
| ft,C | carbon | ND | (N/mm2) | 2345 | 2700 | 216 | 0.08 |
| Et,A | AR-glass | ND | (N/mm2) | (–) | 75,000 | 750 | 0.01 |
| Et,C | carbon | ND | (N/mm2) | (–) | 240,000 | 2400 | 0.01 |
| αt,A | AR-glass | det | (–) | (–) | 0.6 | (–) | (–) |
| αt,C | carbon | det | (–) | (–) | 0.9 | (–) | (–) |
| αt | AR-glass/carbon | det | (–) | (–) | 1.0 | (–) | (–) |
Publisher’s Note: MDPI stays neutral with regard to jurisdictional claims in published maps and institutional affiliations. |
© 2020 by the authors. Licensee MDPI, Basel, Switzerland. This article is an open access article distributed under the terms and conditions of the Creative Commons Attribution (CC BY) license (http://creativecommons.org/licenses/by/4.0/).
Share and Cite
Rempel, S.; Ricker, M.; Hegger, J. Safety Concept for Textile-Reinforced Concrete Structures with Bending Load. Appl. Sci. 2020, 10, 7328. https://doi.org/10.3390/app10207328
Rempel S, Ricker M, Hegger J. Safety Concept for Textile-Reinforced Concrete Structures with Bending Load. Applied Sciences. 2020; 10(20):7328. https://doi.org/10.3390/app10207328
Chicago/Turabian StyleRempel, Sergej, Marcus Ricker, and Josef Hegger. 2020. "Safety Concept for Textile-Reinforced Concrete Structures with Bending Load" Applied Sciences 10, no. 20: 7328. https://doi.org/10.3390/app10207328
APA StyleRempel, S., Ricker, M., & Hegger, J. (2020). Safety Concept for Textile-Reinforced Concrete Structures with Bending Load. Applied Sciences, 10(20), 7328. https://doi.org/10.3390/app10207328