Article

Structural Analysis and Design of Reinforced Concrete Bridge Corbels

1
Department of Architecture, Built Environment and Construction Engineering, Politecnico di Milano, 20133 Milan, Italy
2
Construction Technologies Institute, Italian National Research Council (ITC-CNR), Viale Lombardia 49, San Giuliano Milanese, 20098 Milan, Italy
*
Author to whom correspondence should be addressed.
Appl. Sci. 2020, 10(19), 6727; https://doi.org/10.3390/app10196727
Submission received: 27 August 2020 / Revised: 21 September 2020 / Accepted: 21 September 2020 / Published: 25 September 2020

Abstract

:
Post-installed systems for the anchorage of safety barriers to bridge corbels are widely used today thanks to their flexibility and easiness of installation. Because of commonly found in situ boundary constraints, however, the design requirements for post-installed fasteners and rebars are frequently not satisfied or only partially satisfied. This paper assesses the mechanical response of a corbel where an innovative solution concerning the placement of post-installed reinforcement in reinforced concrete members was suggested. With reference to the refurbishment of bridge curbs, which usually requires concrete removal in the damaged top layers, the proposed method was based on the introduction of additional U-shaped post-installed rebars connecting the existing portion of the corbel to the newly cast top layer, in order to allow the transfer of the tension pull-out force exerted by the posts restraining the safety barrier. The layout investigated in this paper consisted of three anchors connecting the baseplate of the post supporting the safety barrier to the corbel (a layout commonly found in Italy). These anchors transfer the external actions (bending moment and shear) to the corbel thanks to the formation of a strut-and-tie system where the U-shaped rebars and the existing reinforcement play a crucial role. A strut-and-tie model of the corbel was presented to allow the use of a simplified approach to assess the safety of the corbel. The tests on real-scale specimens were also modeled numerically and additional models were considered to evaluate the effect of characteristics parameters (i.e., size of the corbel, existing shear reinforcement, etc.) on the overall response of the corbel.

1. Introduction

The refurbishment of existing infrastructures is becoming very important due to their aging or lack of maintenance [1,2,3,4]. A common problem of existing bridges is the installation or substitution of safety barriers that must be replaced due to their aging or increased demand [5,6,7]. The substitution of safety barriers is usually associated with the partial reconstruction of the upper part of the concrete curb and the addition of post-installed reinforcing or anchoring bonded systems.
In the last decades, these types of connections have been largely used thanks to their flexibility and to their wide range of applications. Several researchers investigated the limits of the field of application (exploiting the performances in low- and high-strength concrete [8,9,10,11] and the reliability of these systems [12,13,14,15,16]).
Quite frequently, however, this affordable connection does not satisfy code requirements for the design of connectors considered as overlapped reinforcing bars (according to [16,17]) or as post-installed anchors (according to [18,19]). The main challenges are the reduced thickness of the concrete corbel, which often does not guarantee enough bonded length, and the limited edge distance, preventing the development of the full concrete capacity according to anchor theory [20,21,22].
Nevertheless, the use of post-installed bonded anchors is very attractive due to their high versatility and strength [23]. This study considered a new solution presented in [6] that meets the common refurbishment practice requirements in Italy (with slight modifications) and is based on the removal and rebuilding of the damaged top concrete layer of the curb. The novelty consists in the installation of additional U-shaped post-installed bonded rebars (with a prescribed spacing along the whole corbel length) before the new, top, concrete layer is cast. The safety barriers are then installed into the new reinforced curb via three post-installed bonded bars (according to one of the most typical layouts adopted in Italy). The adoption of this layout represents the minimum viable solution for the application investigated in this study and that the use of a larger number of anchors, while affecting the design parameters, would not hinder the applicability of the proposed model. To evaluate the influence of the U-shaped rebars in the connection system, three full scale specimens were tested.
Cattaneo, S et al. state that the transfer mechanism of the forces from the tensioned bars to the U-shaped rebars and their anchorage into the bridge deck was studied via a 3D strut-and-tie model and validated with numerical analyses [6]. This study considered the same geometry but was focused on the corbel behavior. The aim of the paper was to propose an analytical, simplified formulation that allows designers to verify the concrete corbel. This formulation derived from a strut-and-tie model, in which the geometry was defined on the basis of a finite element model (FEM) [24,25,26] considering a different specimen geometry.

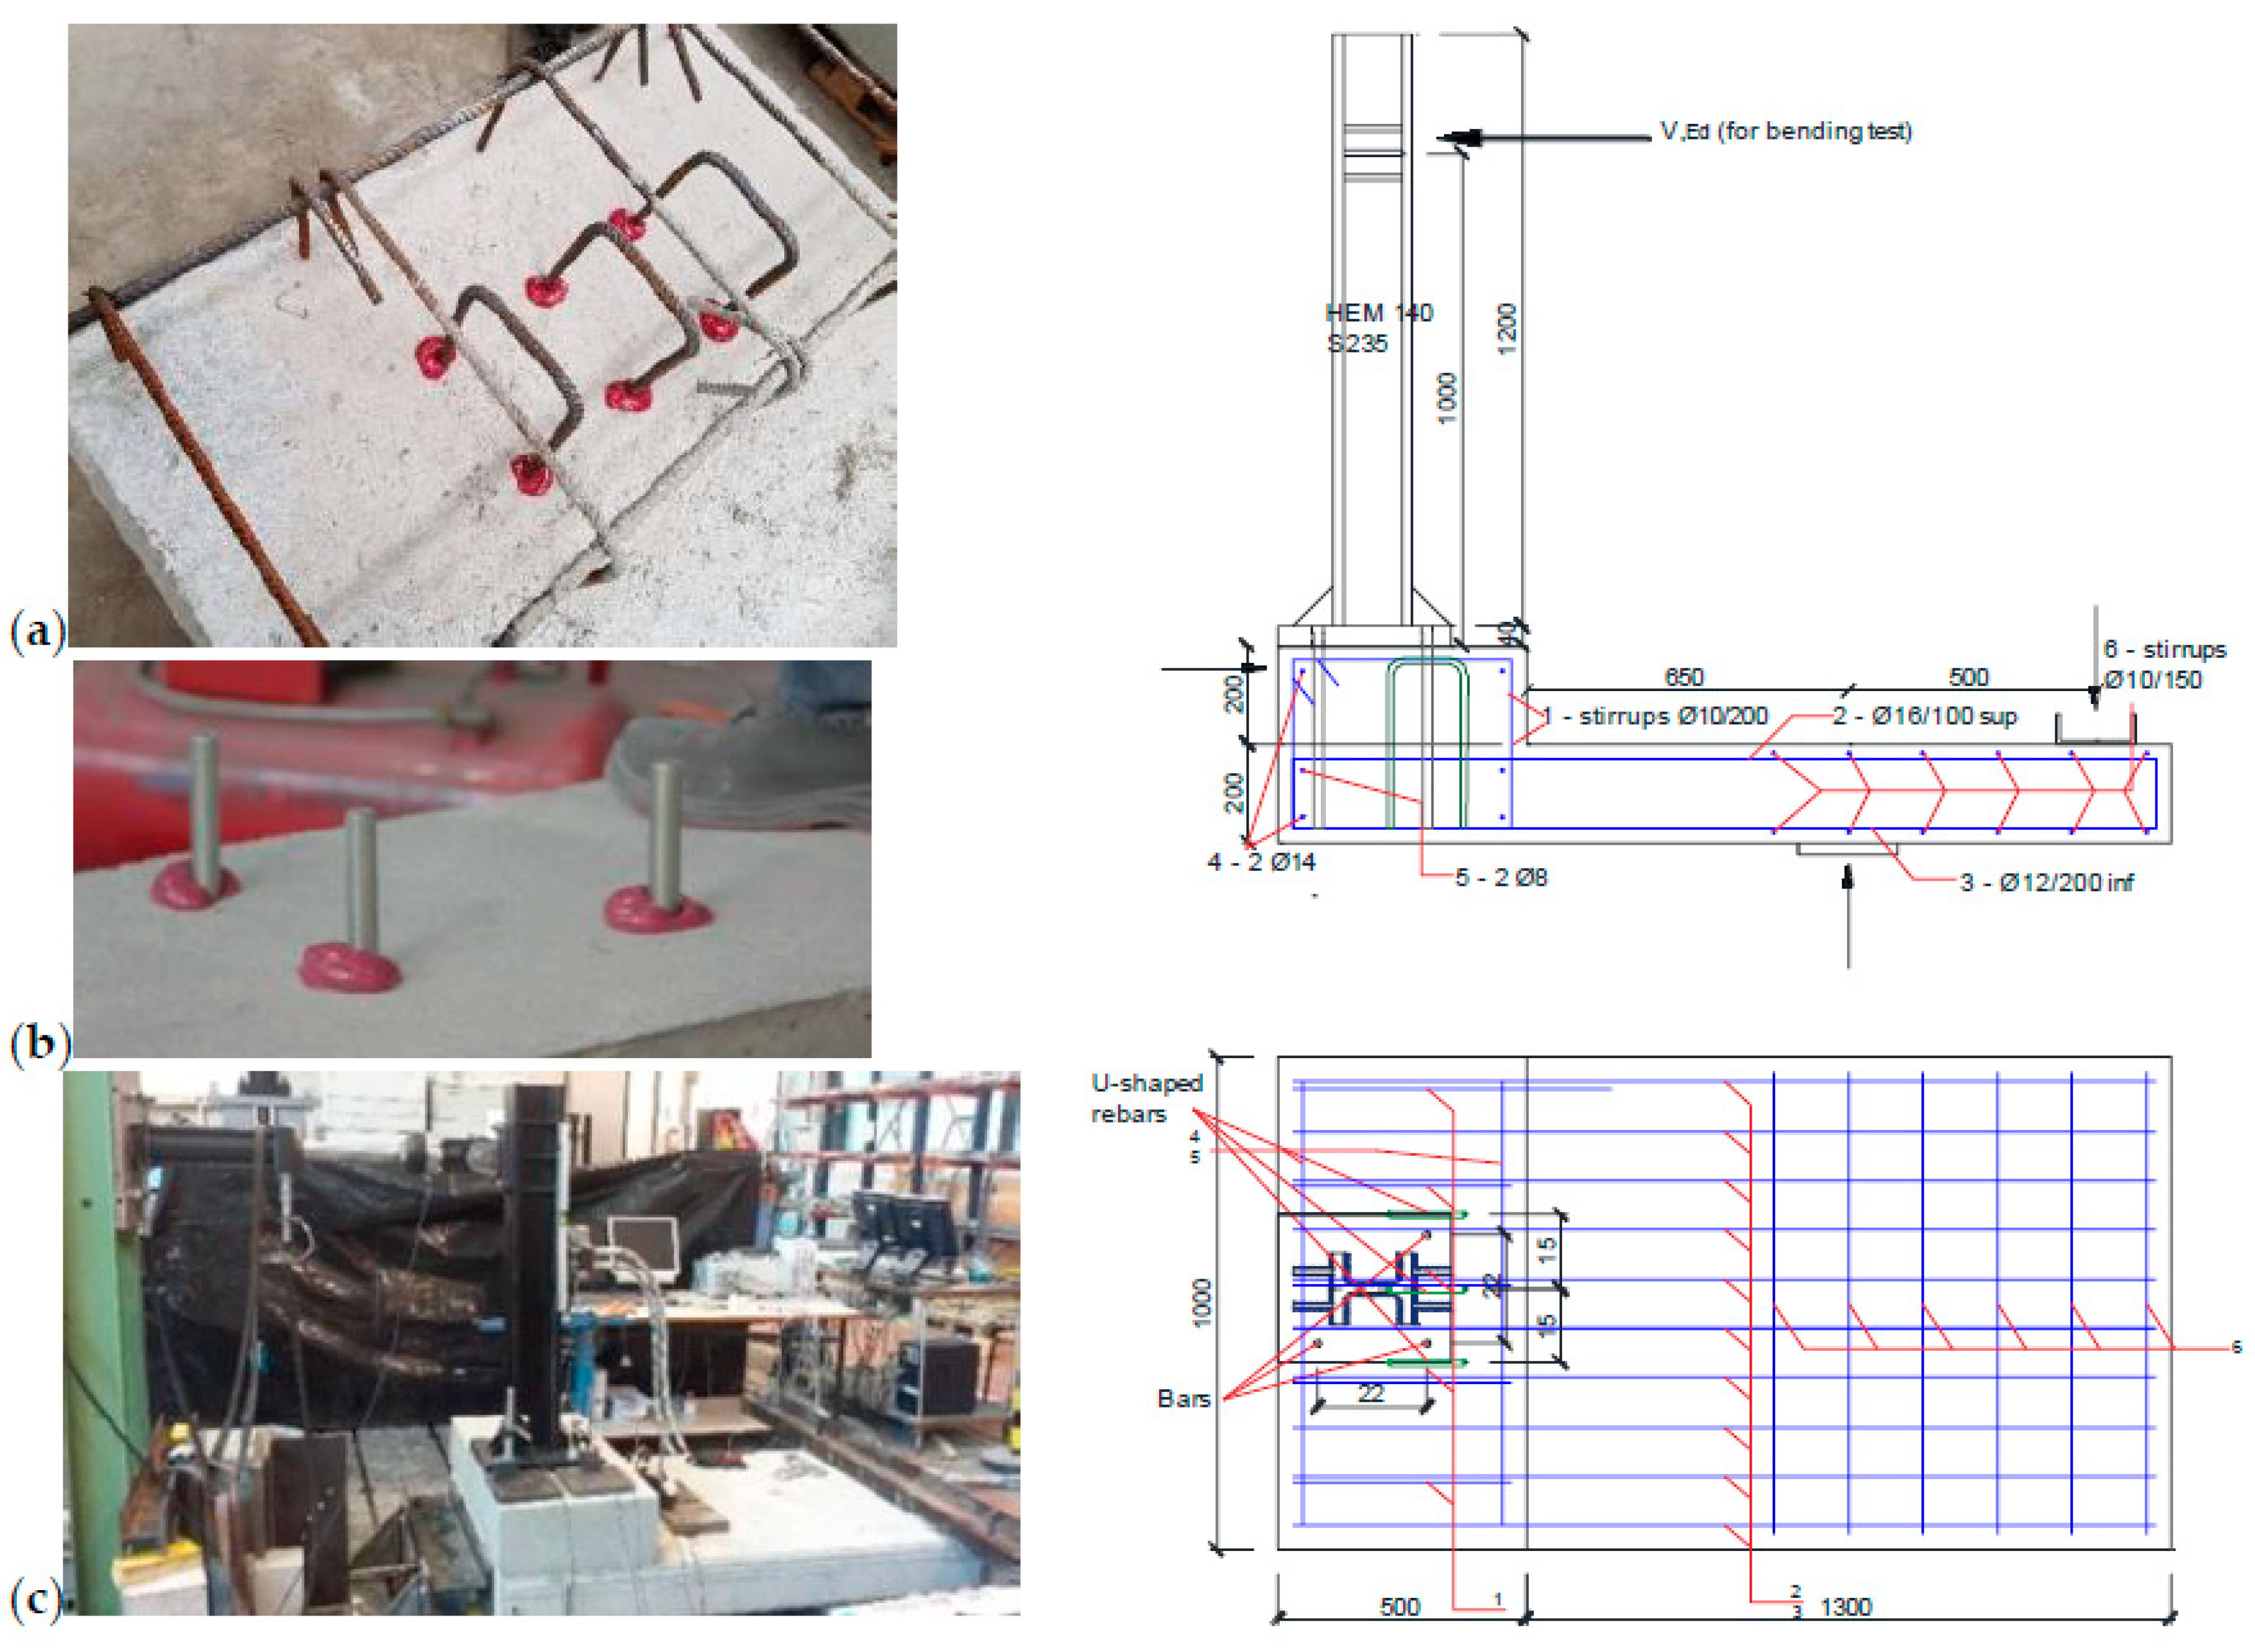
2. Experimental Research

The experimental research presented by Cattaneo, S et al. [6] is here recalled and summarized. Three identical specimens composed of a reinforced concrete slab having dimensions 180 × 100 × 20 cm with a 50 × 100 × 20 cm curb placed on top were tested. The reinforcement in the curb region was selected to satisfy the minimum reinforcement condition for Italian bridge corbels, while the reinforcement in the remaining portion of the slab was designed to avoid any possible premature failure during the test. The specimens were cast in two steps using C20/25 concrete (CEMII/A L 32.5 R with a dosage of 310 kg/m3 and a water/cement ratio of 0.55 [27]) and B450C reinforcing bars. The slab was cast first, and, after 28 days, three ϕ 12 U-shaped B450C rebars (Figure 1a) were post-installed with an epoxy injection mortar having a characteristic bond strength of 14 MPa ([28], uncracked concrete conditions). After 24 h, the curb was cast above the slab and, after an additional 28 days, three threaded bars of M20 [28] were post-installed in the slab through the curb (Figure 1b).
The load was applied using a hydraulic jack located at a height of 100 cm from the steel plate. The specimen was supported in the middle of the slab and vertically restrained at a distance of 50 cm from the support. An additional horizontal restraint was placed in front of the specimen to avoid sliding. A sketch of the system is shown in Figure 1c.
The load protocol consisted of: (1) Three loading cycles from 0 to 38 kN, (2) an increase in load up to 51 kN to check the crack pattern (load held for 2–3 min), (3) an increase in load up to 65 kN for tests 1 and 2 and up to 84 kN for test 3, and (4) unloading.
The load of 51 kN was chosen, as ultimate limit state load, in accordance with common practice of design in Italy for safety barriers’ class H4 BP (edge bridge). It is worth mentioning that for accidental actions the partial safety factor is 1 for both materials and actions [29].
The displacements of the three post-installed anchors, the horizontal displacements at the bottom and at the top of the curb, and the sliding displacement of the specimen were measured via Linear Variable Differential Transformers (LVDTs) (tolerance ± 0.2%).
All specimens behaved in a similar way and no failure was observed. At a load level of about 47 kN, two cracks (one for each lateral side) were detected at the corner between the slab and the curb (Figure 2a,b. In specimens 2 and 3, at a load of about 65–68 kN, some cracks were observed originating from the bar close to the edge and developing continuously up to the reached maximum load (about 84 kN) (Figure 2c). To avoid damage in the testing system, the test was stopped at a load level of 84.07 kN.

3. Discussion

Figure 3 shows the free body diagram of the concrete curb. The tensile force (T) acting on the bars is transferred from the bars to the U-shaped rebars by a 3D strut-and tie mechanism (red area of Figure 3, as explained by Cattaneo, S et al. [6]), while the U-shaped rebars are anchored to the concrete slab (light blue area). In the previous study [6], the overall behavior of the structure (considering the steel plate, the corbel, and the bridge deck) was not evaluated, while the verification of the corbel must account for the effect of the compressive (dark blue) and shear (green) stress fields in the concrete element.
The geometry of the structure under investigation shows that the curb can be regarded as a D-region according to the definition of the Building Code Requirements for Structural Concrete ACI318-Appendix A [18], where there is a complex mechanism of stress diffusion inside the concrete. In this part of the structure, the assumptions of the beam model are no longer valid and can be used only to evaluate the bridge deck effect on the corbel. In this way, it is possible to isolate the portion of the structure under investigation by substituting the steel column and the bridge deck with their acting external forces (Figure 4, C and T compressive and tensile forces and V shear force). The easiest way to model the structural behavior of the D-regions is the strut-and-tie modeling [24,25,26,30].

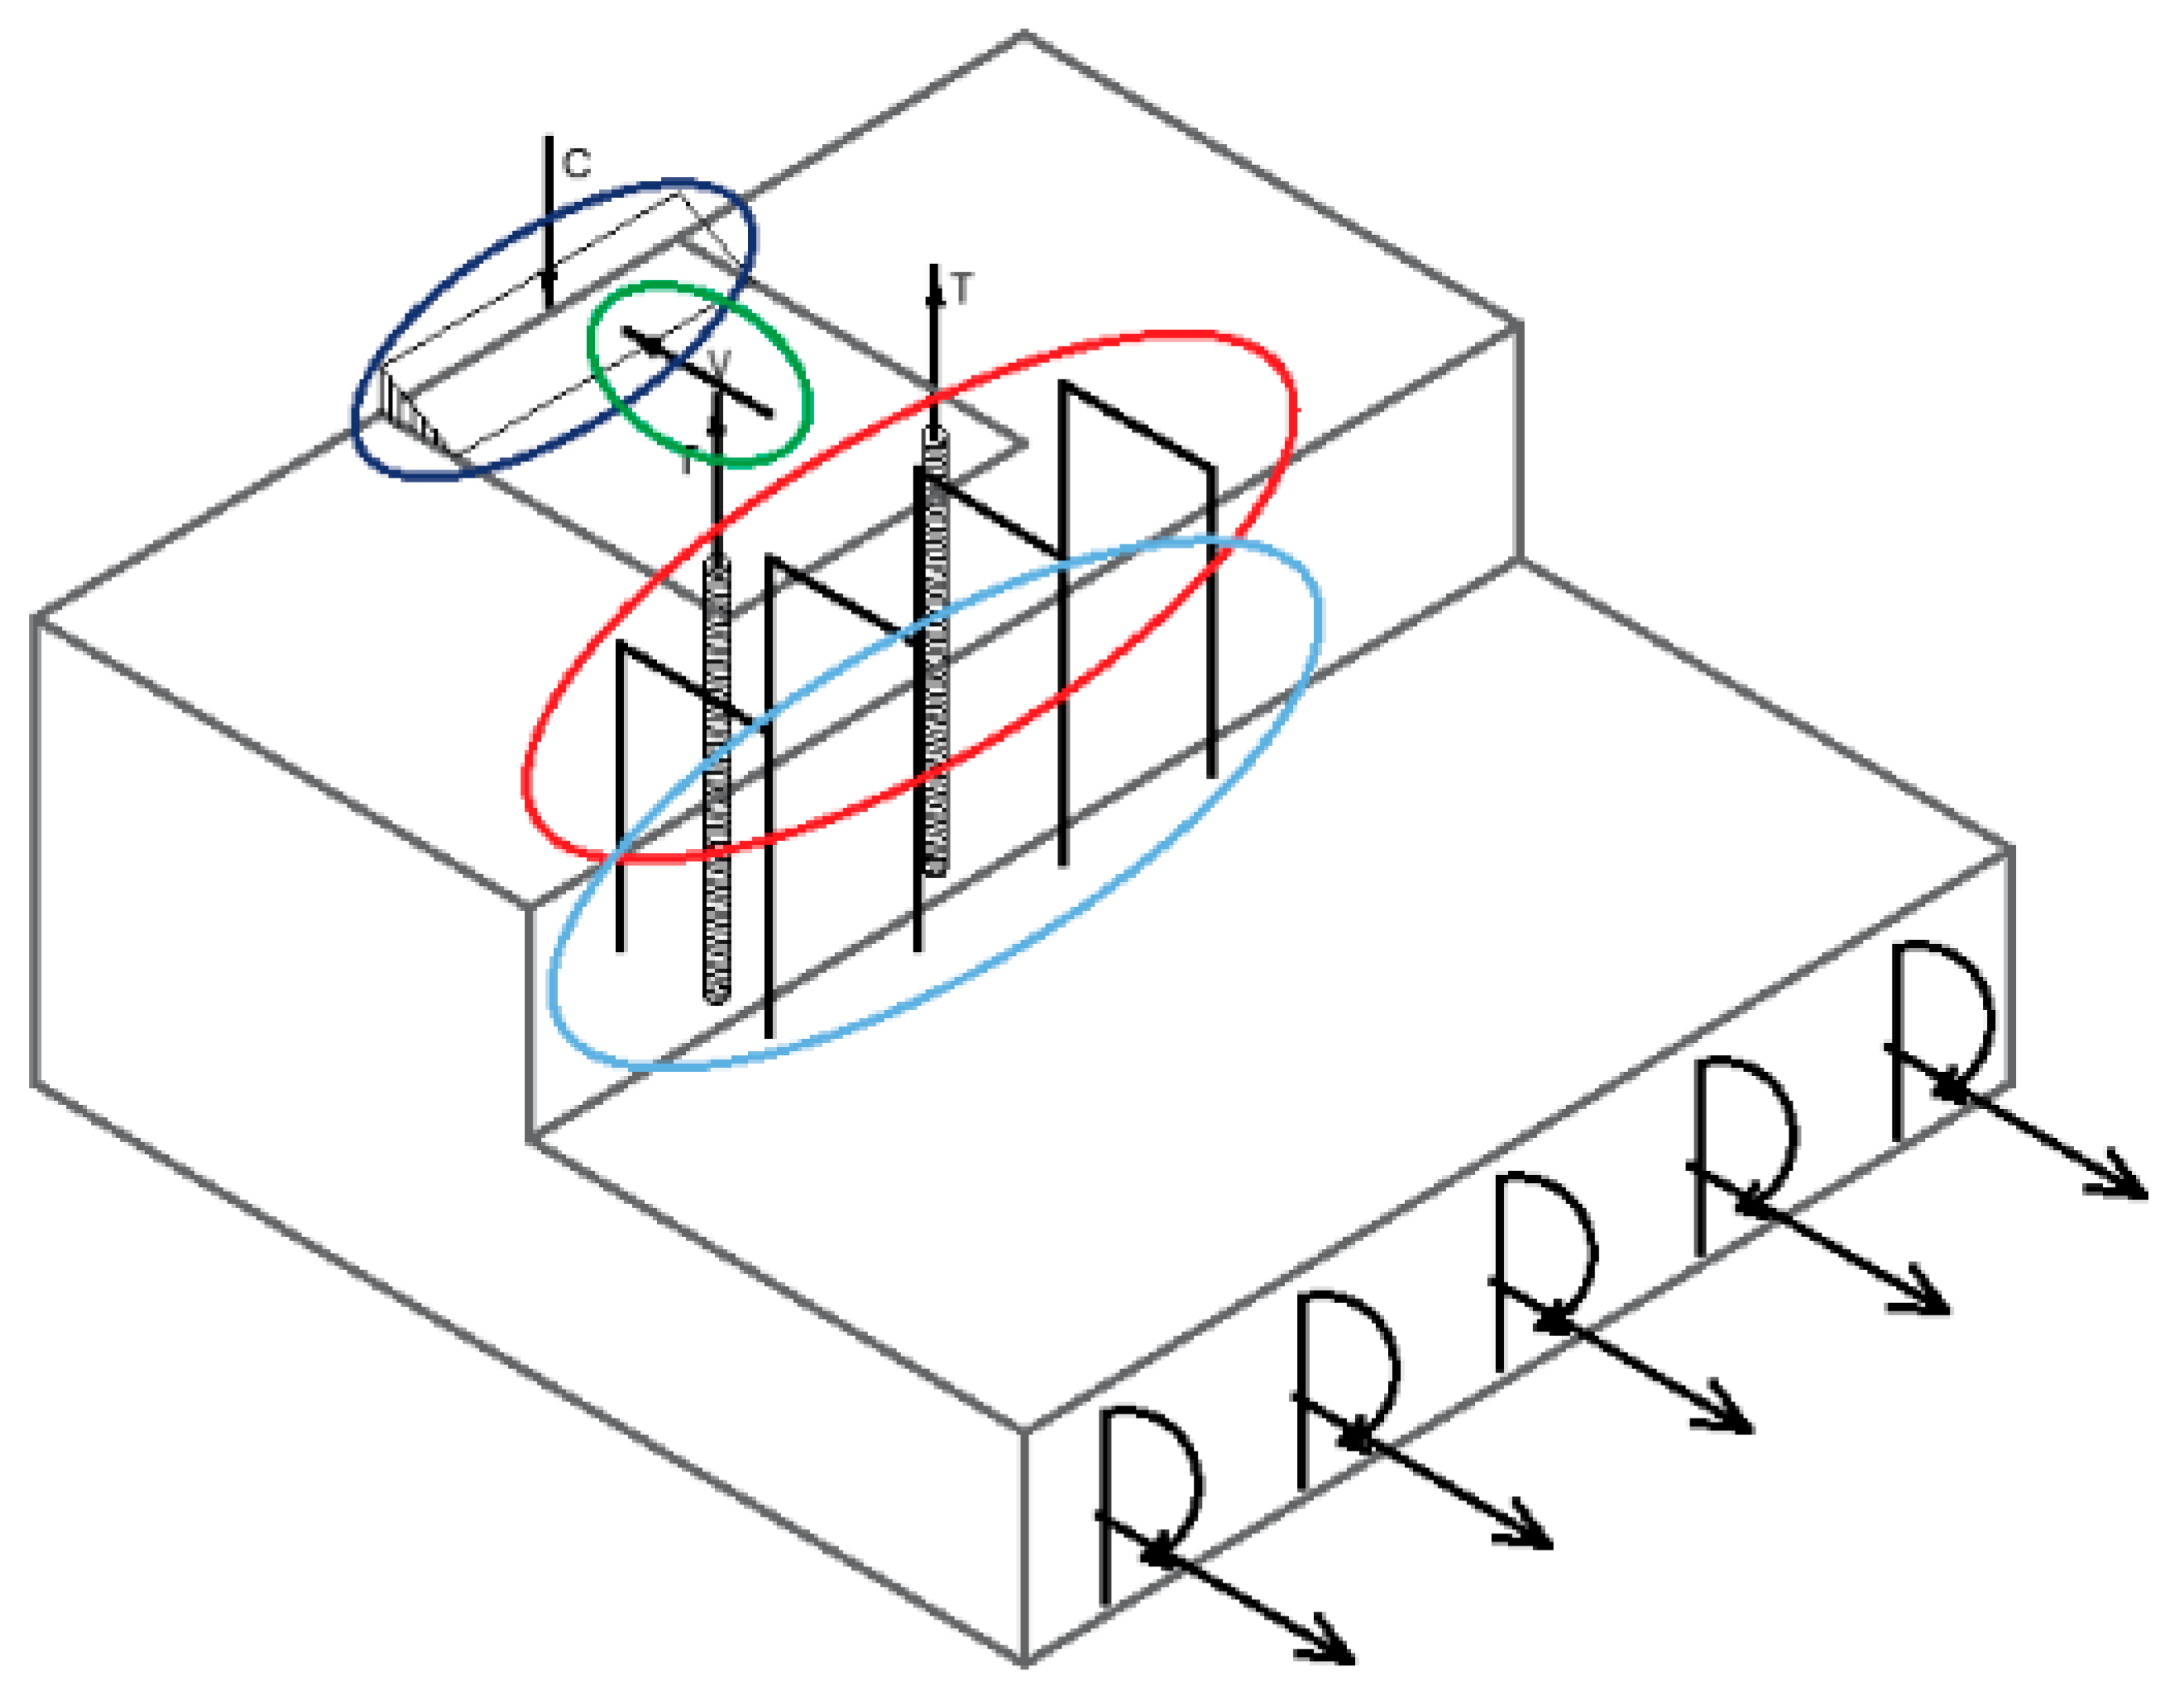
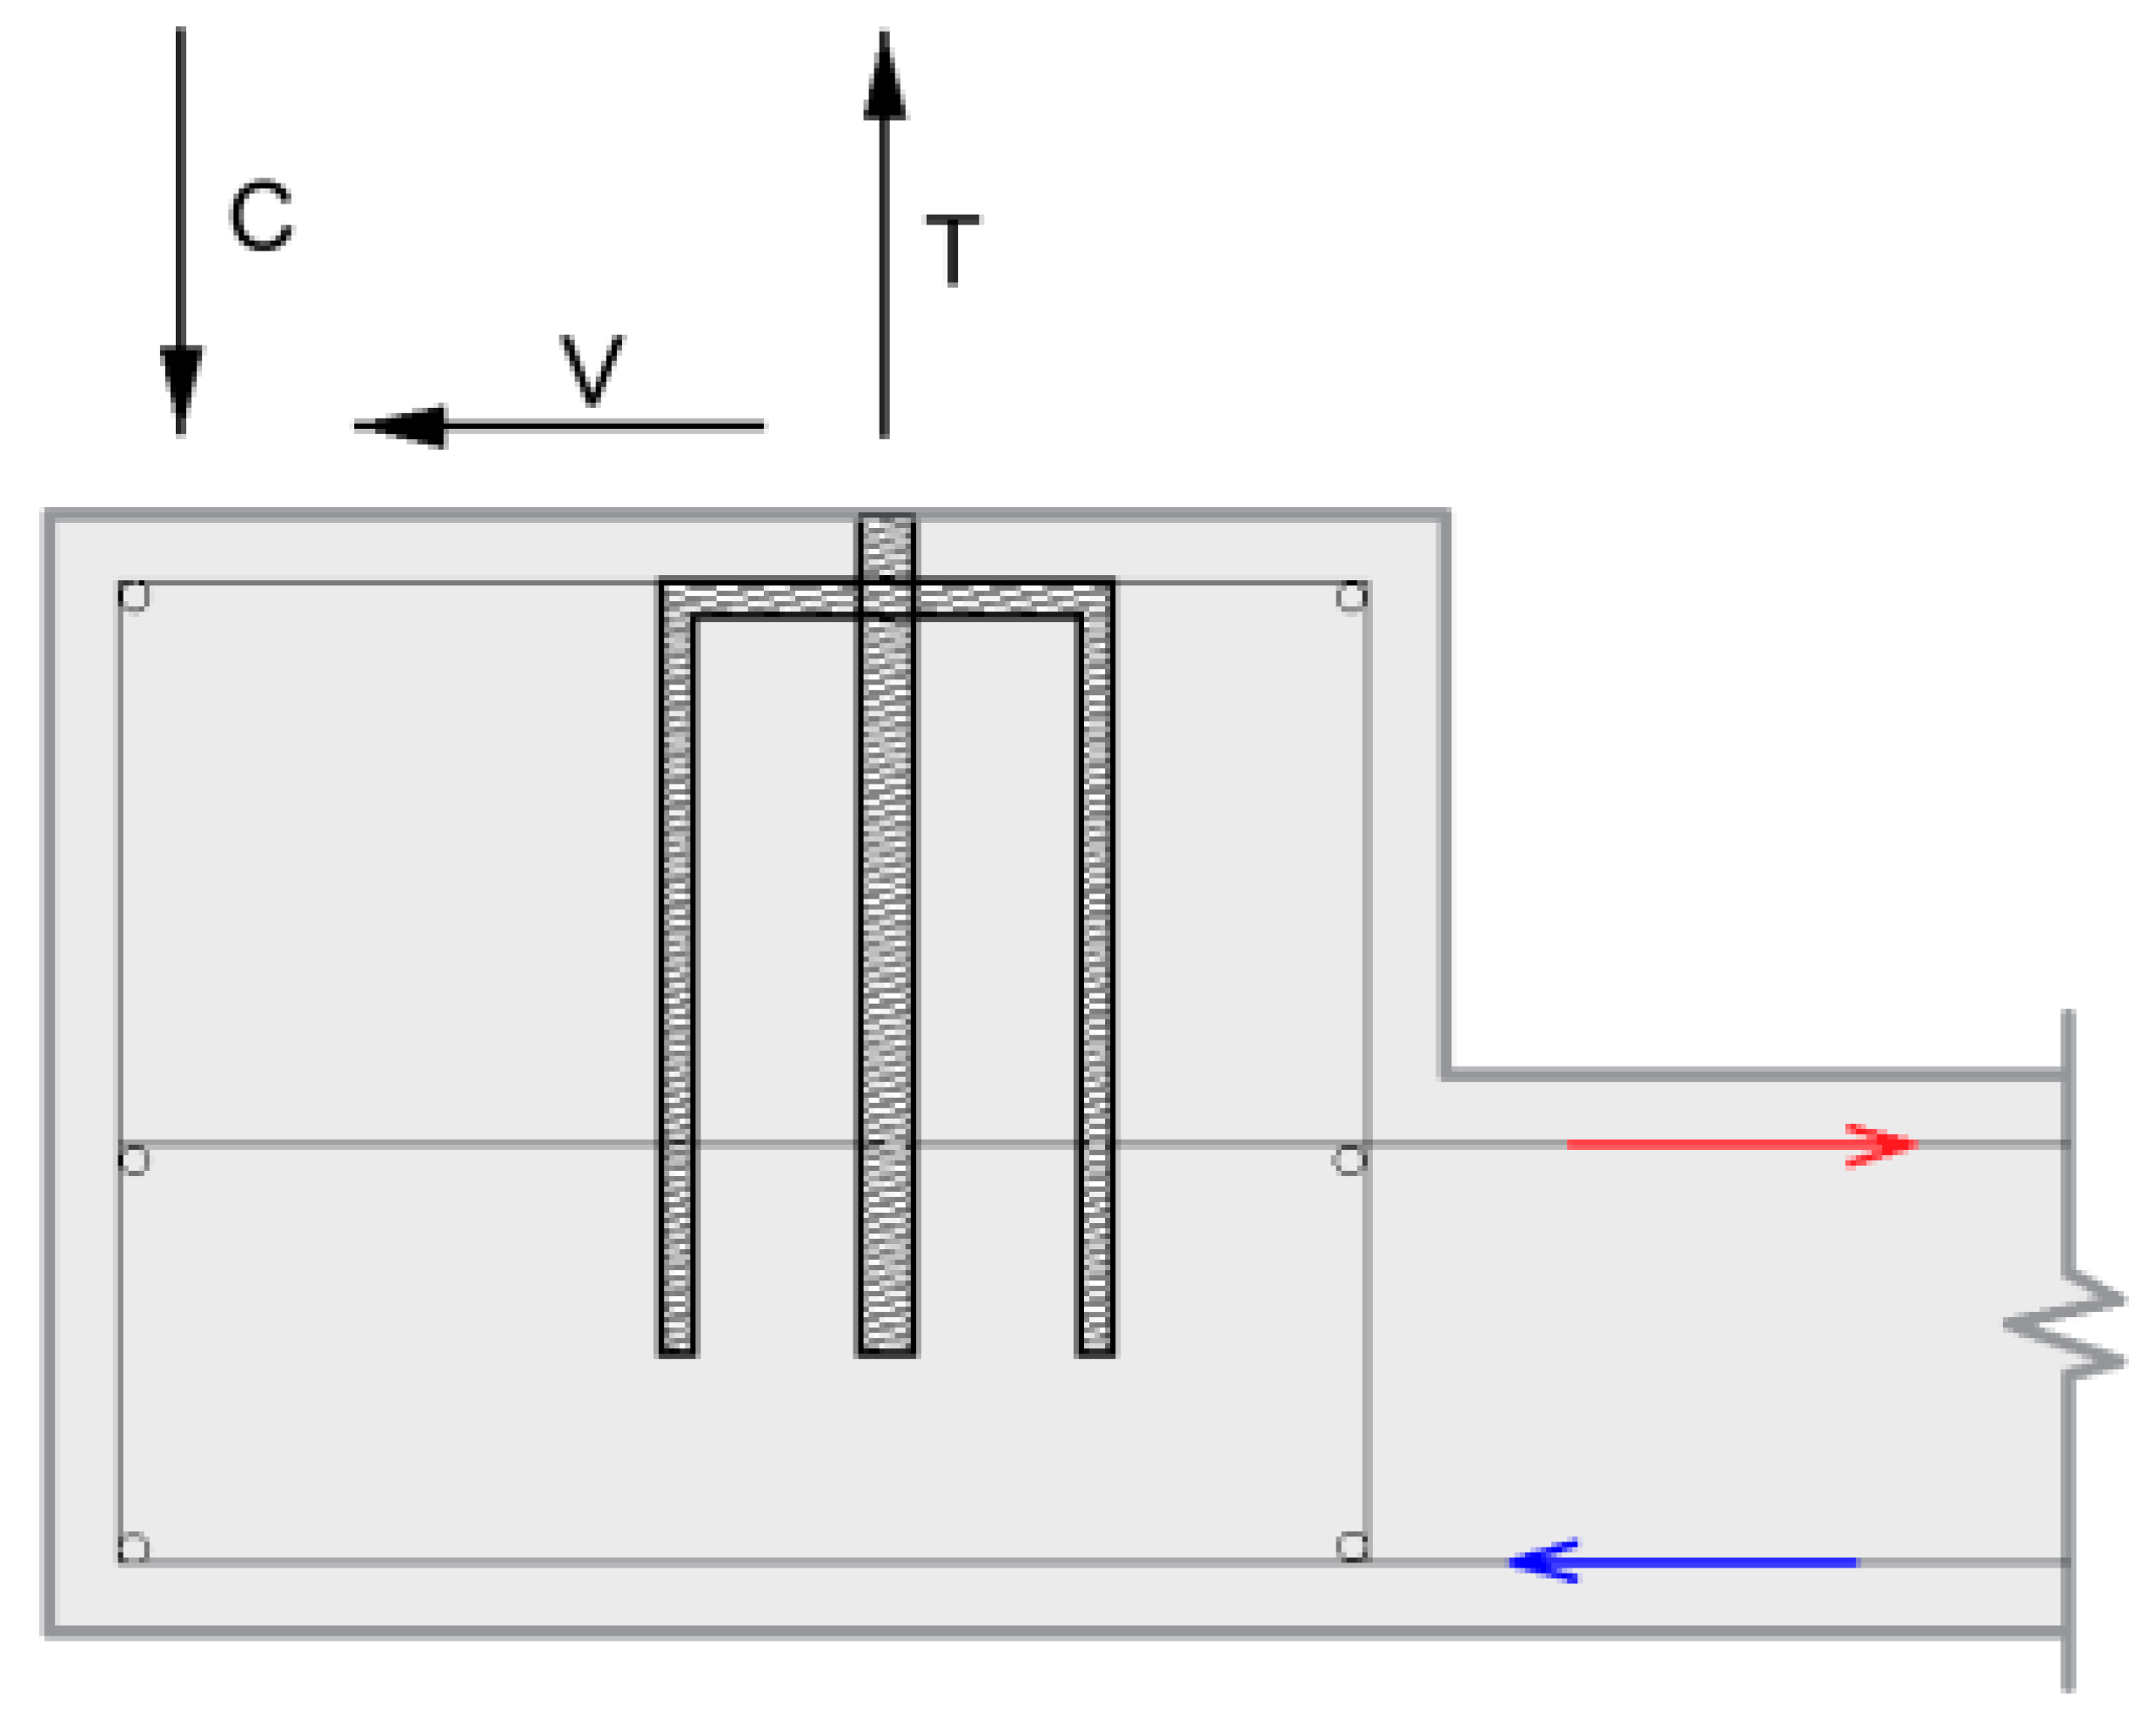
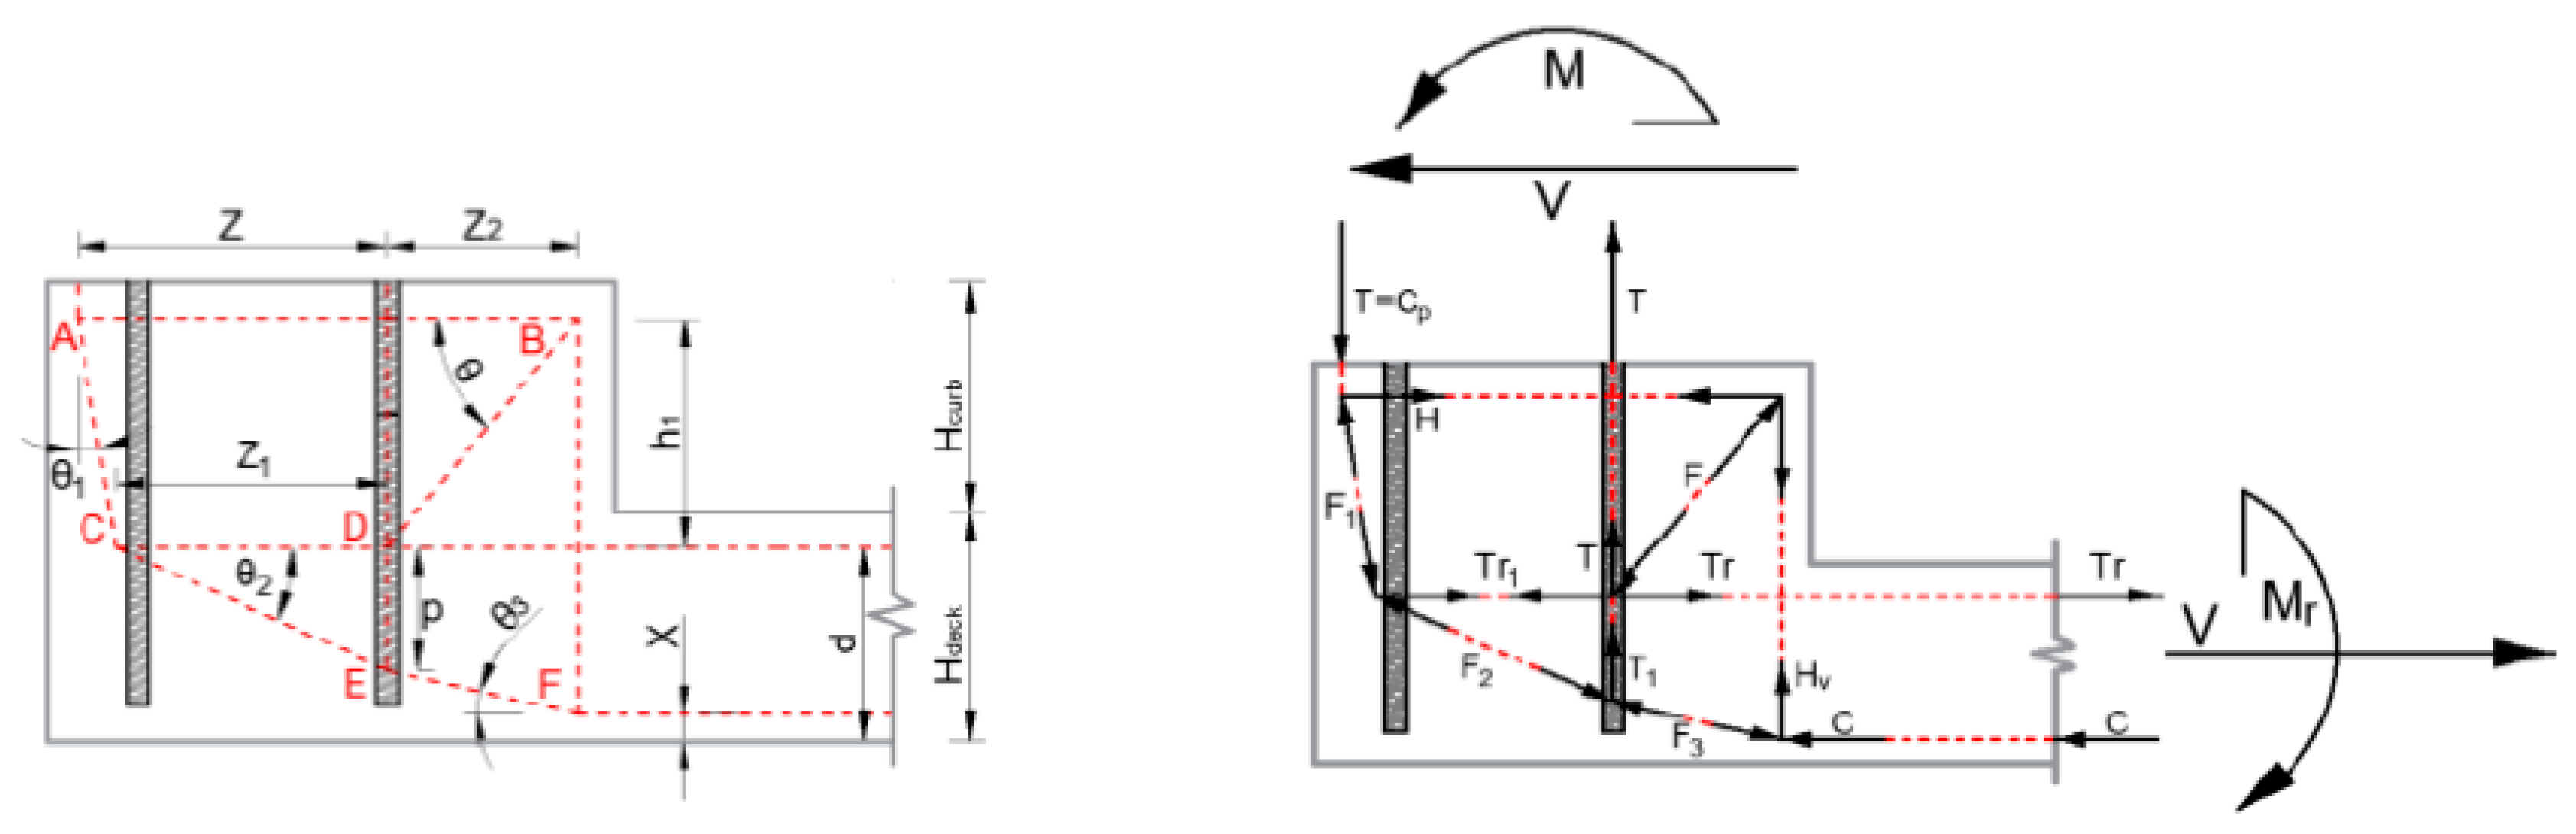
3.1. Strut-and-Tie Model

In this case, a 2D strut-and-tie model (Figure 5) was developed to catch the overall behavior (the structural response described with the parameters listed in Table 1). The model (Figure 5) can be described as follows: The compressive force transferred by the steel baseplate was first deviated toward the horizontal direction by the corbel’s stirrups acting in tension. This force was equilibrated by the tension in the vertical branch of the stirrups themselves and by another concrete strut converging to the node (C) formed by the anchor and the upper (flexural) reinforcements of the deck (or slab).
The compressive strut under the compressed portion of the steel plate was further deviated by the presence of the upper reinforcement of the deck, the tensioned anchor, and the vertical branch of the corbel stirrups (Node C- E -F).
As shown in Figure 5, equilibrium conditions must be fulfilled for six nodes (A–F):
  • The node located close to the external edge of the concrete element under the compressed part of the plate (A). In this node, three elements of the model are converging: Two struts in compression and the top reinforcement of the curb in tension.
  • The node located at the internal upper corner of the curb (B): Here the stirrups are bent at 90° and the two ties, which represent the vertical and horizontal branches of the stirrups, are equilibrated by an inclined concrete strut.
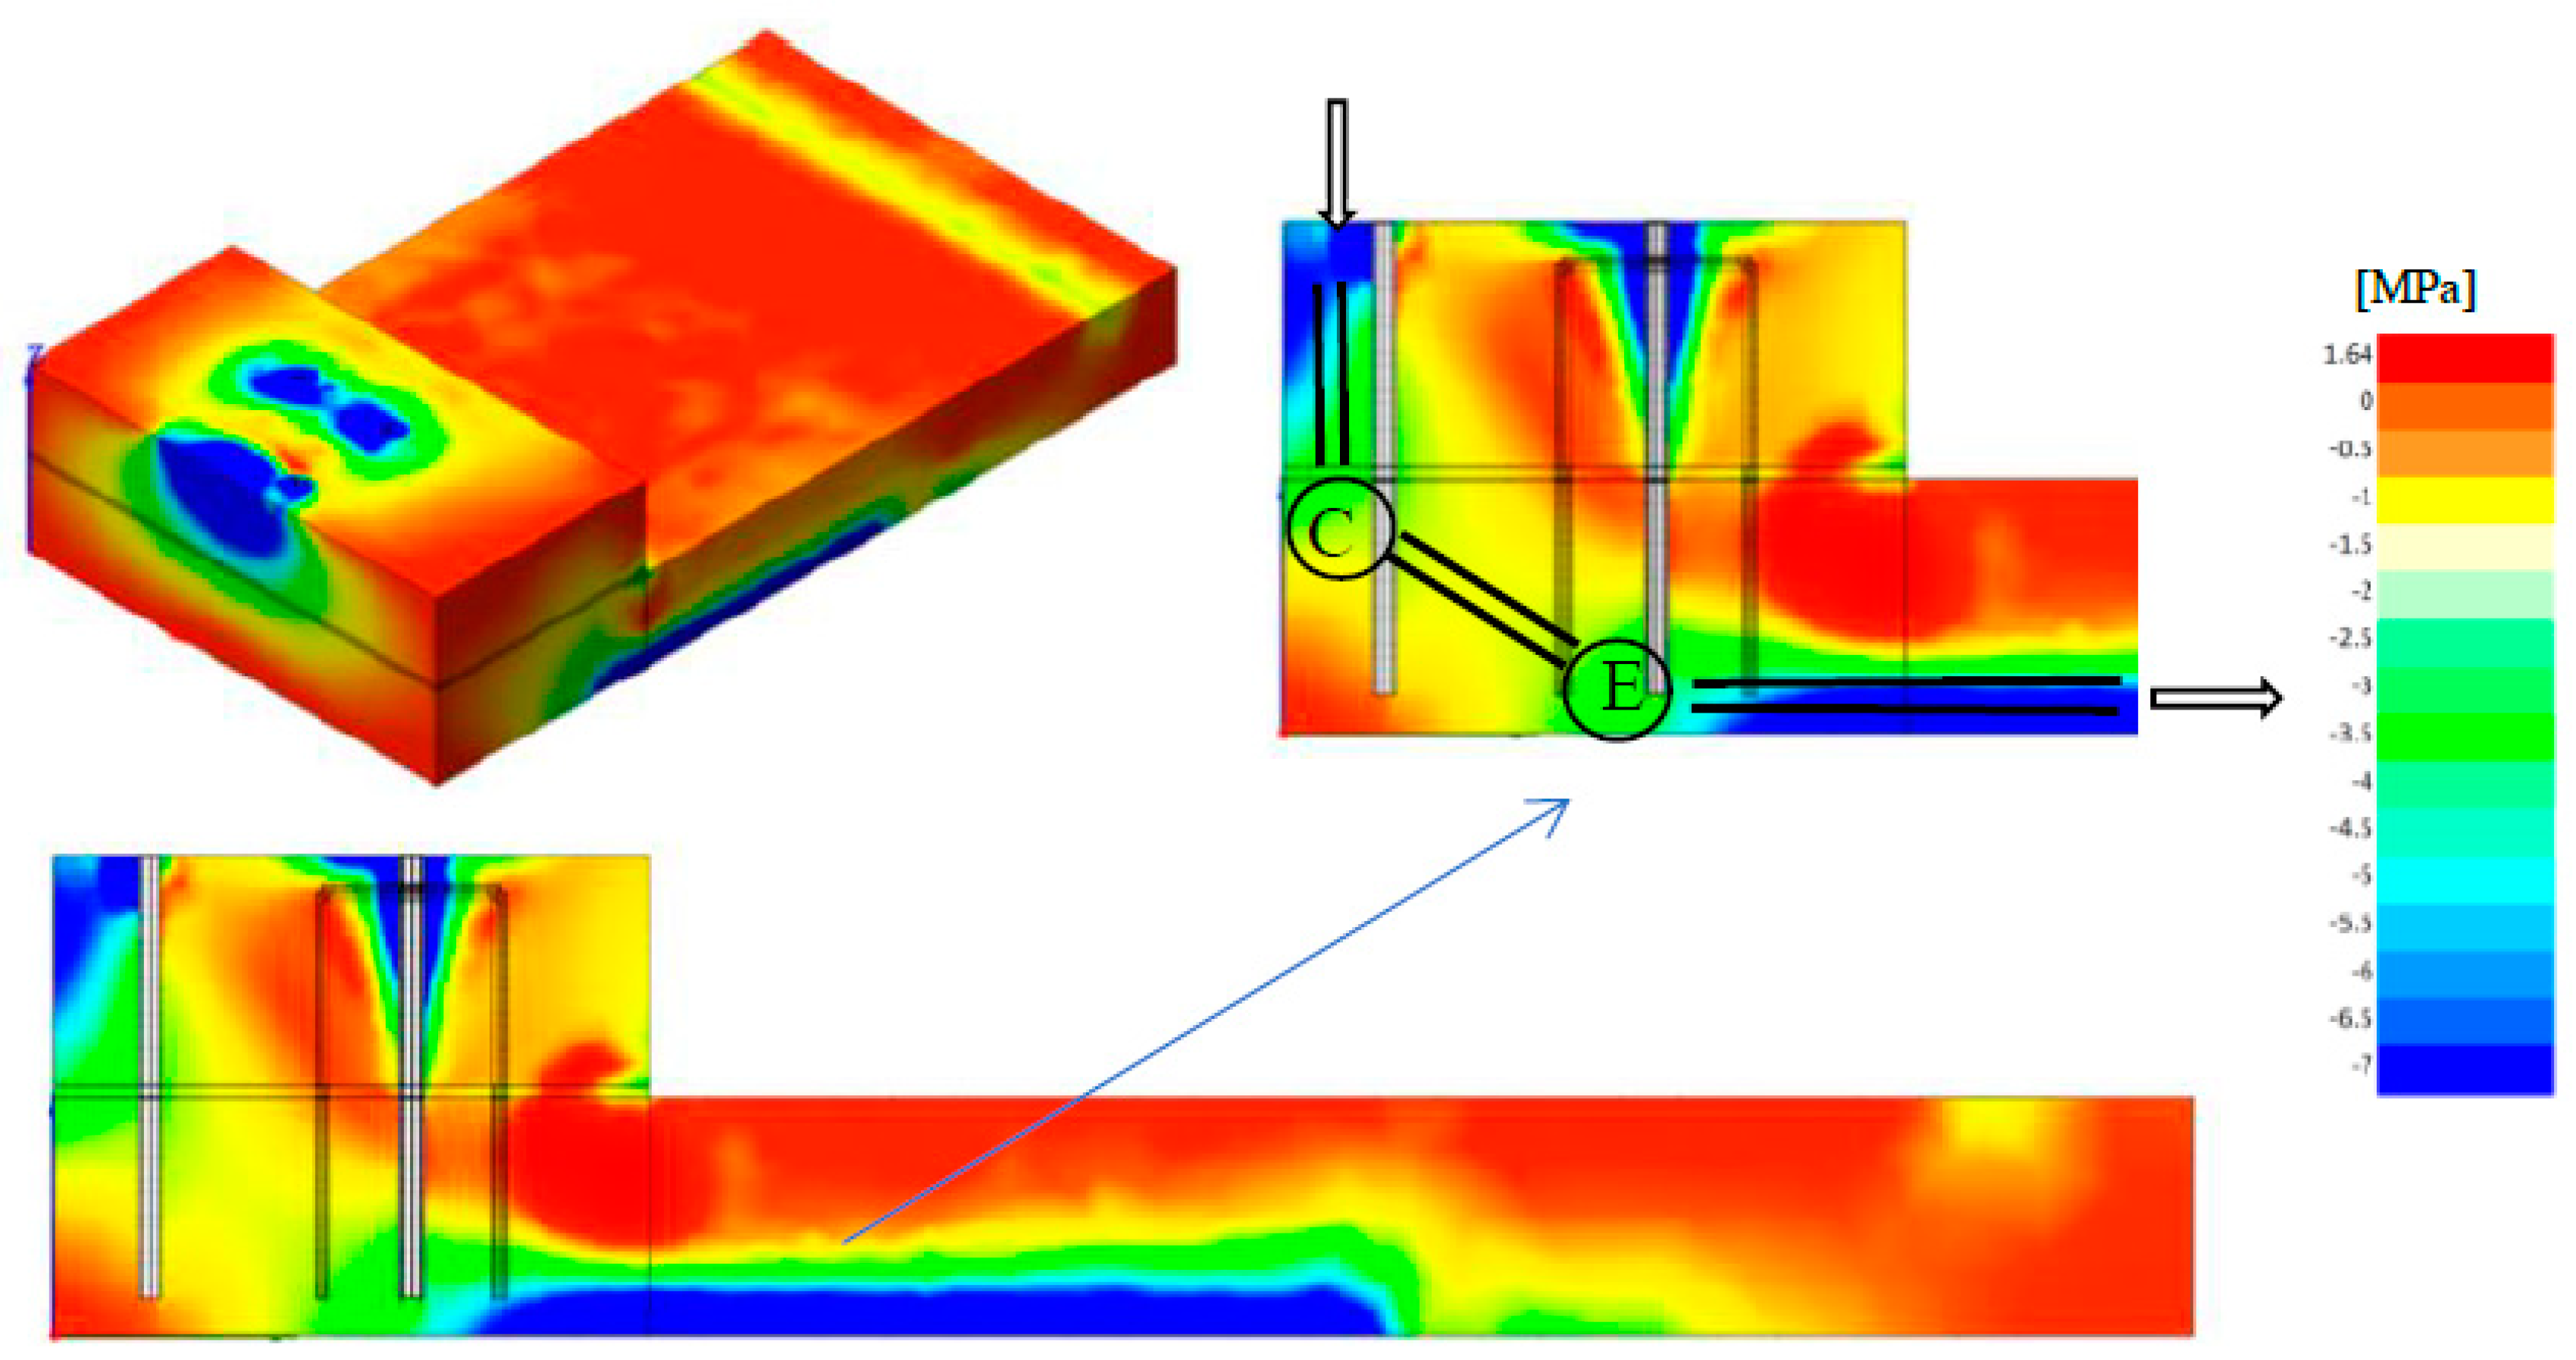
  • The node between the two struts in compression deviated by the effect of the tensile force in the upper reinforcement of the deck slab (C).
  • The node (D), placed where the compressed concrete strut coming from node B is equilibrated by the difference in vertical tension in the bar and the difference in horizontal tension in the upper reinforcement of the deck.
  • The node (E), placed at the bottom of the bar where the tension in the bar contributes to the deviation of the compressive force in the concrete struts.
  • The node (F), placed where the vertical branch of the corbel stirrups meets the two compressed struts coming, respectively, from node E and from the compressed lower chord of the deck.
Table 1 describes the procedure to evaluate the main quantities of the strut-and-tie model. In particular, for the given geometry, the designer should verify the resistance of the minimum reinforcement present in the structure (Table 1, column “Design”) and the moment, Mr, acting on the bridge cantilever (that should be lower than the design moment, MRd).
M r = M + V ( H c o r b e l + H d e c k 2 c s ) M R d
The model is based on equilibrium conditions and is, therefore, frequently suggested by design code because it is always on the safe side, being founded on the limit lower bound theory of plasticity. Nevertheless, some conditions (i.e., z1 < 0 or p < 0) lead to meaningless solutions. In addition, angles between struts and ties must be higher than 25°, according to ACI approach [18].
Furthermore, in the above computations [6], it was implicitly assumed that the system is able to transfer the applied shear force to the deck (or slab). A simple design verification is suggested to verify this assumption. Moreover, it is advisable to provide a slotted hole (for the front bar) in the steel plate to transfer the entire shear load to the rear anchors. In turn, the load transfer mechanism of the two rear anchors to the bottom of the slab can be verified following the cold-joint interface provisions of Eurocode 2 [17] and Model Code for Concrete Structures [31]. It could be expected that a verification in accordance with the latter provisions would be satisfied considering only the dowel action contribution of the anchors to the overall resistance across the interface.

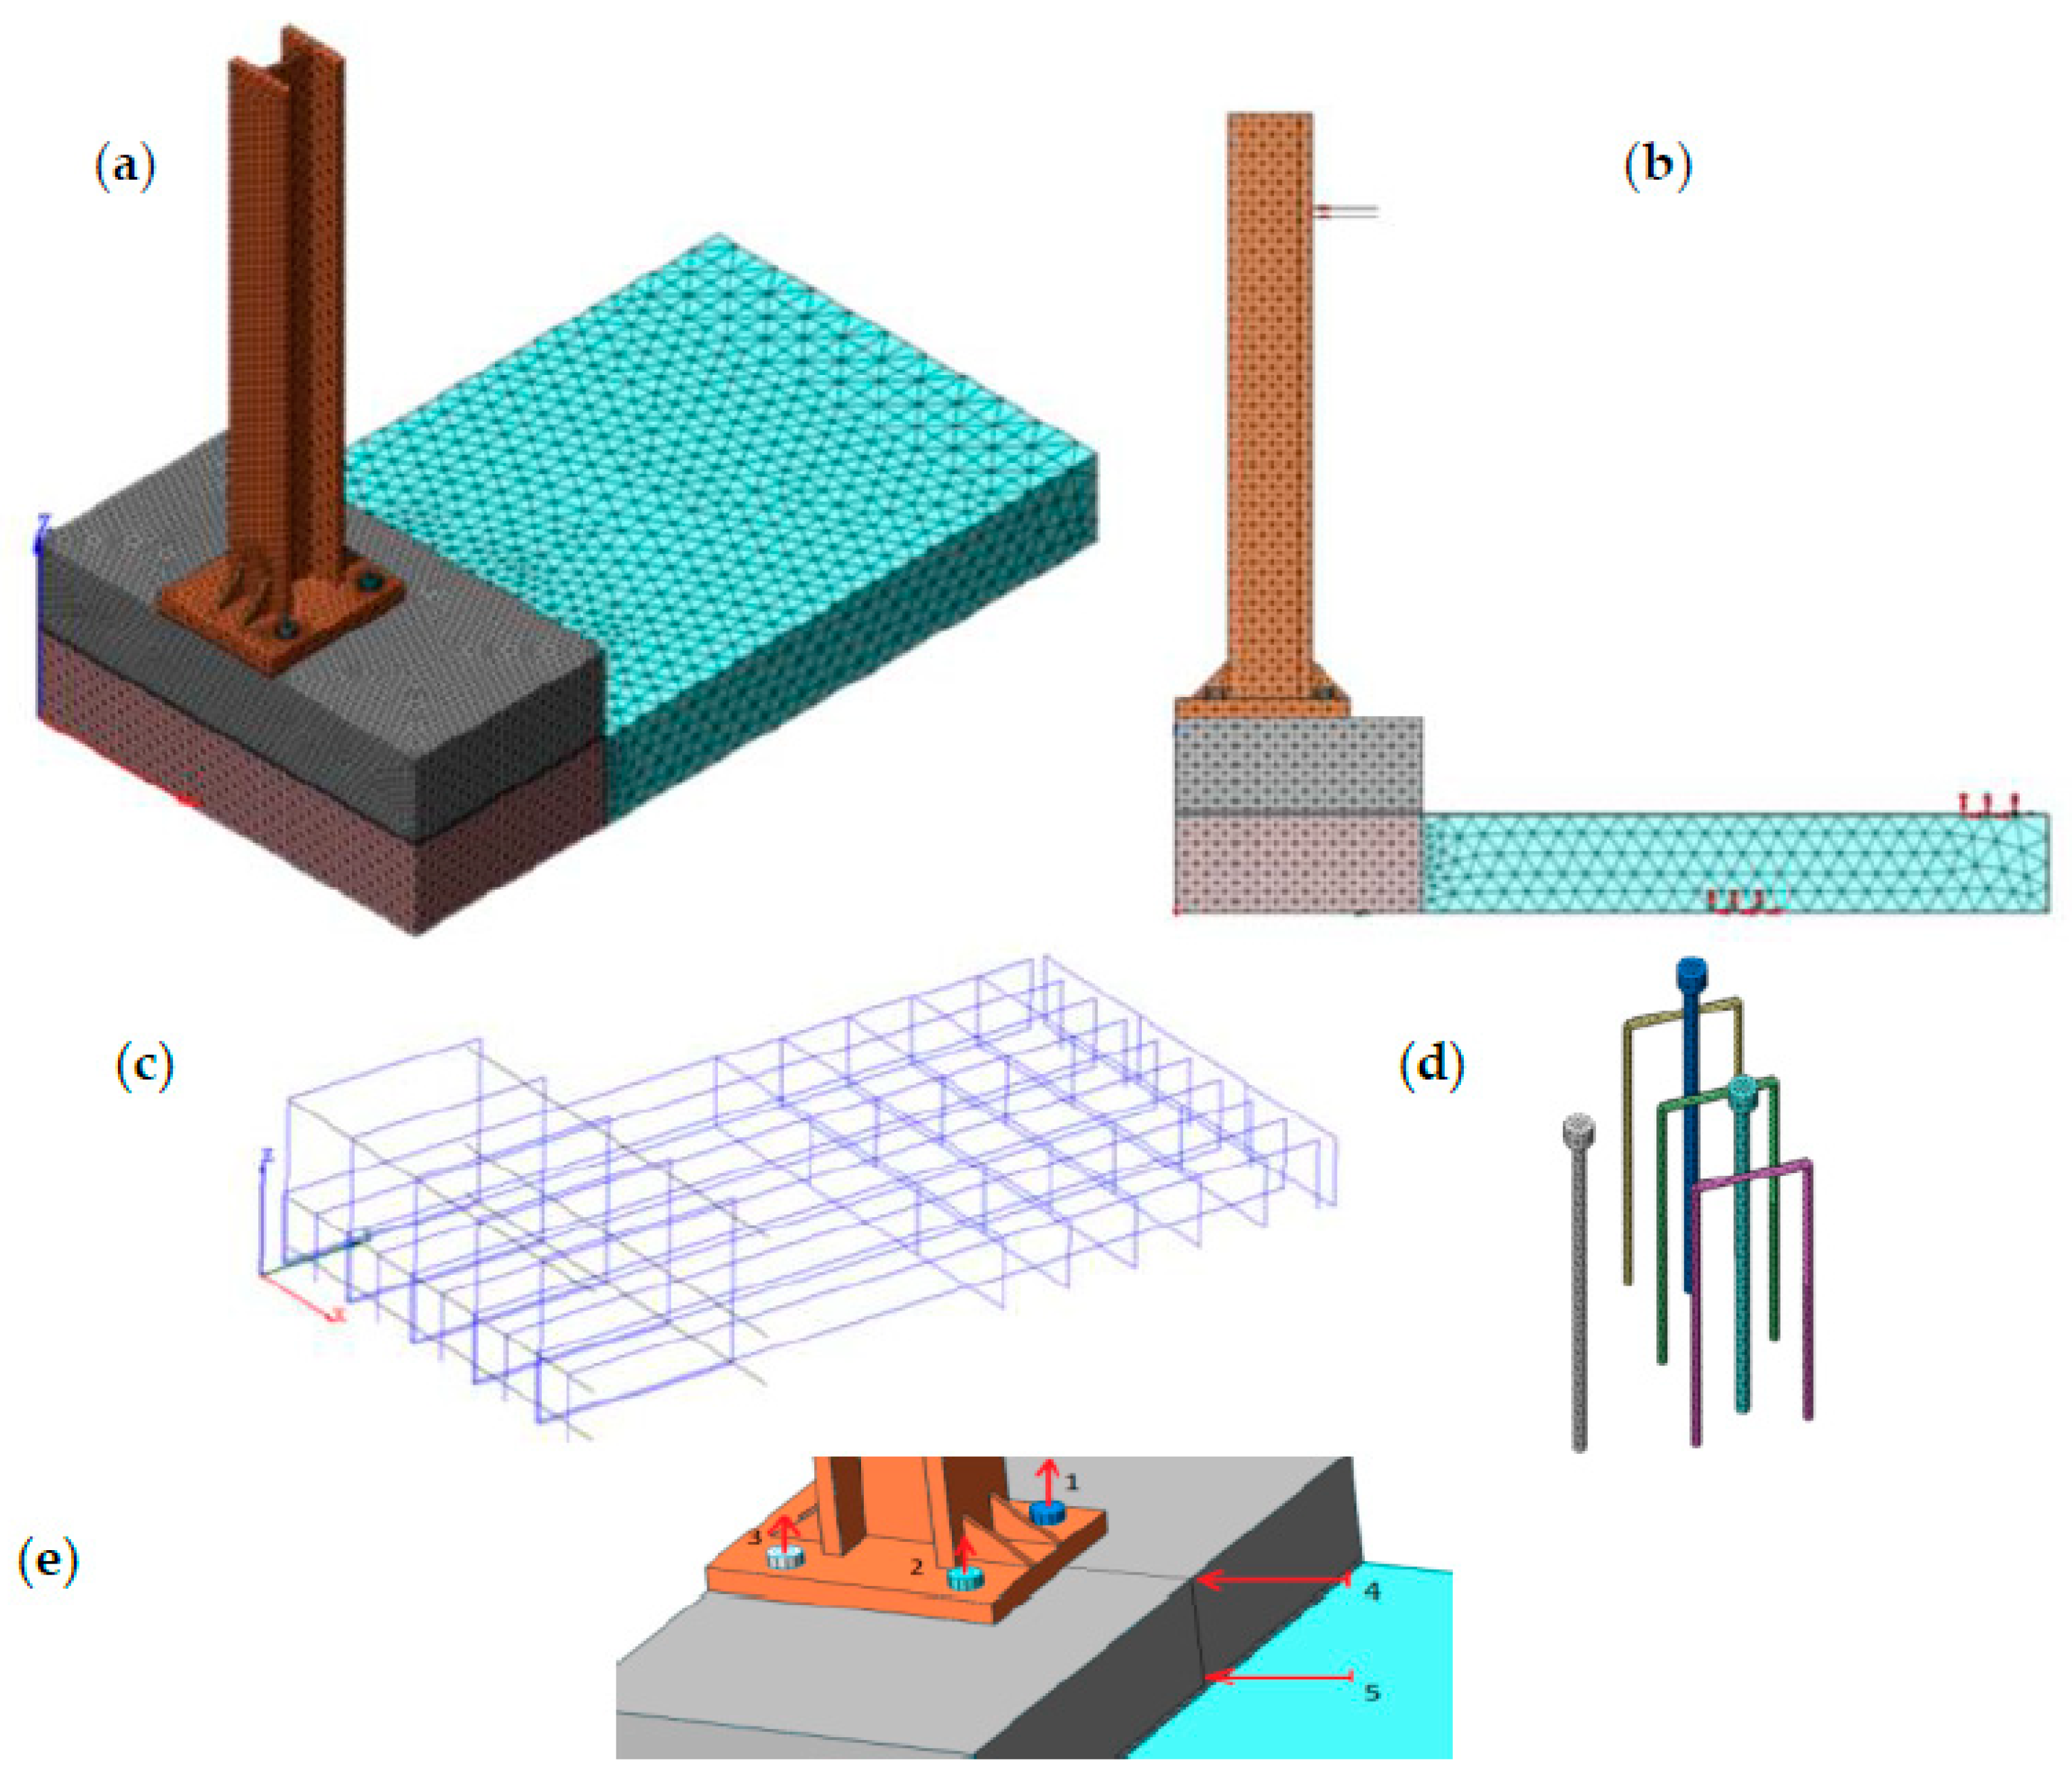
3.2. Numerical Analyses

A finite element model was developed within the software MIDAS FEA [32] to analyze the corbel behavior to conduct a structural analysis and compare the numerical prediction with the experimental evidence in terms of load-displacement curves.
The concrete mechanical properties were chosen in accordance with Eurocode 2 [17] for a concrete class C20/25 (elastic modulus Ec = 30 GPa, average compressive strength fcm = 28 MPa) and the steel was assumed to behave elastically (elastic modulus Es = 200 GPa).
The tensile behavior of the concrete was modeled using a linear total strain crack law [32] characterized by a tensile strength fct = 2.2 MPa and a fracture energy Gf = 73 fcm0.18 = 132 N/m. Following the classical assumption of reinforced concrete structures, a perfect bond between steel and concrete interface was assumed.
The maximum element mesh size of the model ranged between 10 mm for the concrete elements close to the bars (which were modeled using steel beam elements of equivalent size) and 50 mm for the elements far from the bars. These dimensions were selected after completion of a mesh-size sensitivity analysis.
The geometry of the corbel presents a cold joint between the upper face of the slab and the lower face of the curb, where the safety barrier is anchored. The bars, as well as the U-shaped rebars, pass through this cold joint. This joint was modeled as a thin layer of concrete elements (about 1 cm in size) with a reduced tensile strength (1.2 MPa [33]) compared to the typical 2.2 MPa of C20/25 concrete.
The ordinary reinforcement located in the slab was modeled with 1D reinforcement elements of B450C steel while, to model the possibility of the plate to uplift at the interface between the steel plate and concrete, 2D elements were selected.
To compare the numerical and experimental results, the constraints adopted in the test setup were introduced and the load was increased up to 84 kN (maximum load applied). The complete geometry of the FEM is shown in Figure 6a–e.
To validate the model, the experimental and numerical results were compared in terms of the displacements of five control points monitored with LVDTs (vertical displacements of the heads of the three bars) and the horizontal sliding of the upper part of the corbel measured on its top and bottom edges (Figure 6e).
The comparison between experimental (dashed line) and numerical (continuous line) displacements is shown in Figure 7. As it can be seen, the results are in good agreement (load average difference below 5%). Considering the control points of the bars (Arrows 1–3, Figure 6e), it can be observed that the calculation ended close to the displacements experimentally detected. As the aim of the Finite Element Model (FEM) was the identification of the load path required to identify the consequent strut-and-tie model, the analyses were focused only on the nonlinear behavior up to the maximum applied load. In order to determine the ascending branch of the load-displacement curves, load controlled nonlinear analyses were conducted up to the predefined value of 84 kN. Displacement-driven nonlinear analyses could also be used to describe the post-peak behavior, with the consequent big effort in terms of computational cost due to the difficulties of solving the numerical instabilities related to softening, without any control on the results owing to the post-peak behavior being monitored during tests. As well, the unloading phase of the specimen, represented by the descending branches in the experimental curves in Figure 7, was not simulated.
On the basis of the comparison between experimental and numerical data, it can be concluded that the model is able to represent the actual behavior of the tested specimen; therefore, it is possible to analyze the internal stress field to identify the load paths.
Figure 8 and Figure 9 show the results obtained for an applied force of 51 kN (ultimate limit state condition). The upper part of the 3D strut-and-tie model can be confirmed by the typical cone-shaped crack pattern triggered by the load transfer mechanism from bars to the U-shaped rebars, as already discussed by Cattaneo, S et al. [6]. The highest tensile stresses were reached close to the corbel–deck connection and the ordinary reinforcement was mainly stressed in bending along the deck (under constant bending moment, Mr, up to the first vertical support), while the stirrups under the steel plate were stressed due to the shear force.
Figure 10 shows the principal compression stresses (P3) in a cross-section of the system, chosen as the one cutting the two vertical threaded bars parallel to the applied load. This figure allows a better understanding of the stresses’ direction to validate the strut-and-tie model, especially its lower part. In Figure 10, to highlight the gradient of stresses, the scale of the colors has been modified. The red color represents tensile regions, with P3 ≅ 0, while the blue portion has principal compression stresses higher than 7 MPa. Figure 10 shows that the flow of compression stresses undergoes two main deviations in regions C and E. By means of equilibrium considerations, to obtain such deviations, additional forces are needed in regions C and E. For region C, the necessary contribution is given by the upper reinforcement of the slab, while for region E, the reading is less defined due to the presence of several elements (bars, U-shaped rebars, stirrups, tensile strength of the concrete, etc.), which can affect the structural response.
To verify the applicability of the results, a parametric analysis was conducted considering different boundary conditions, geometries, and mechanical properties. On the basis of the most relevant actual cases, the following most significant analyses are reported:
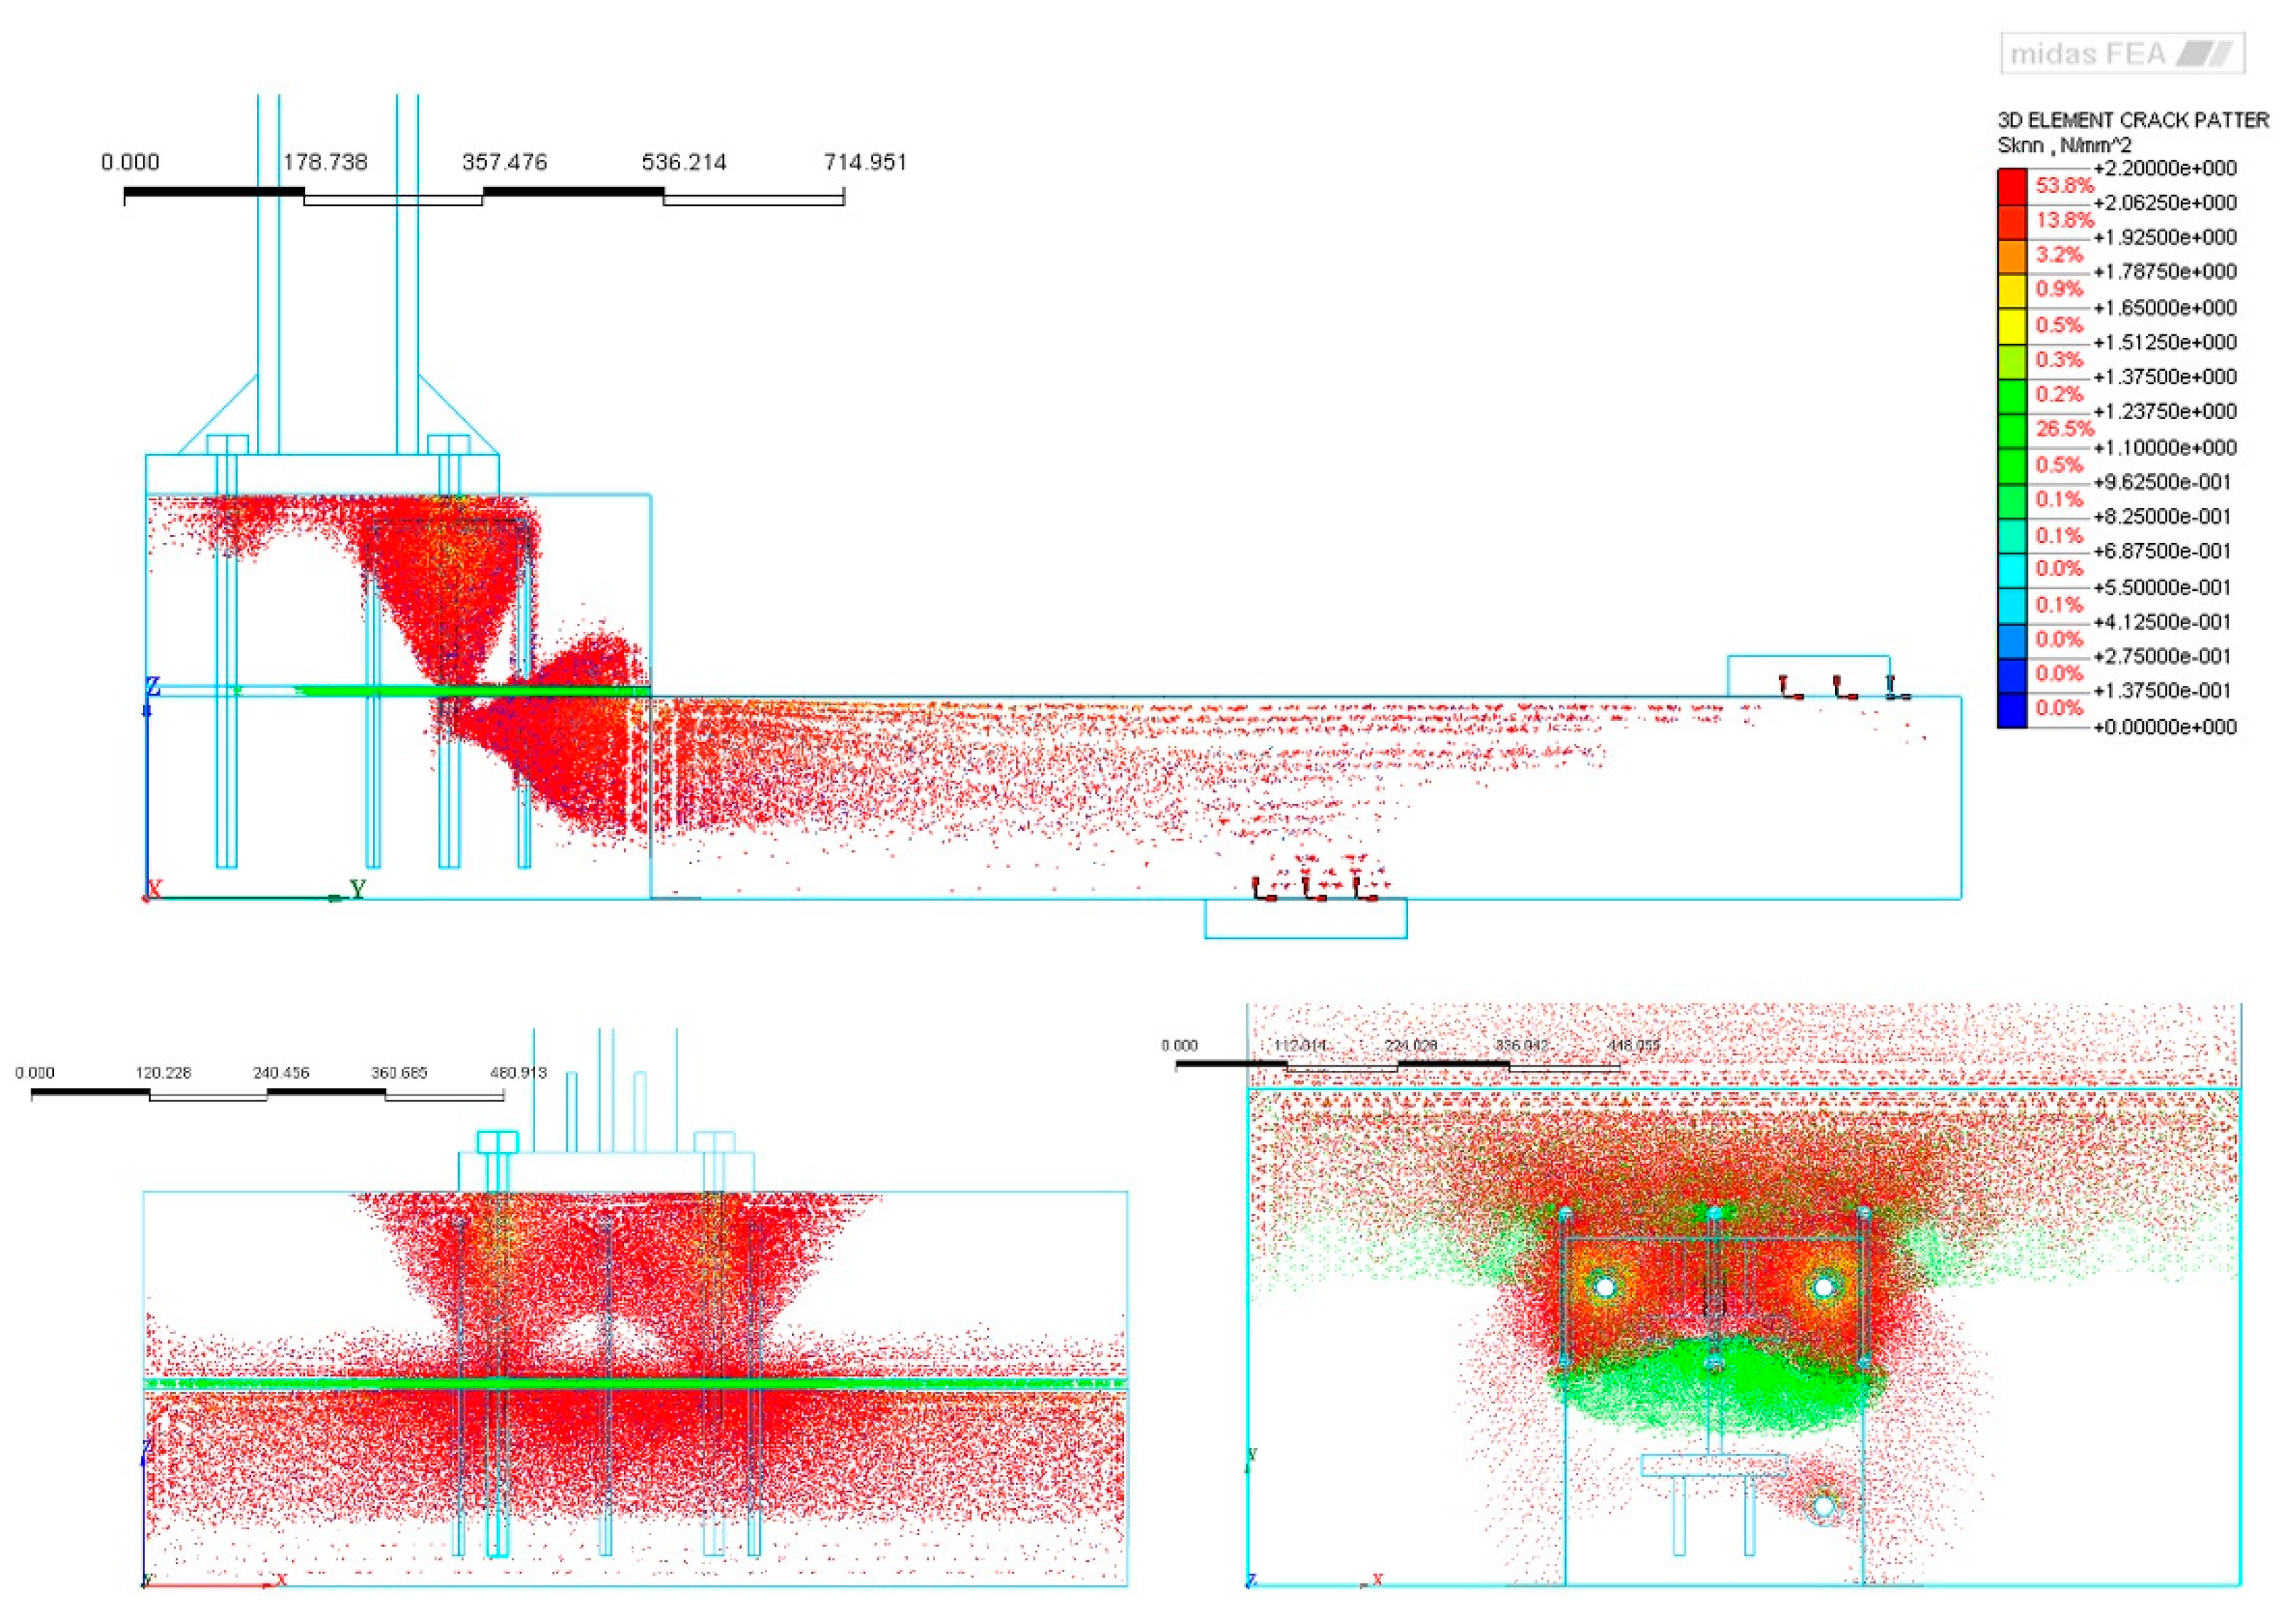
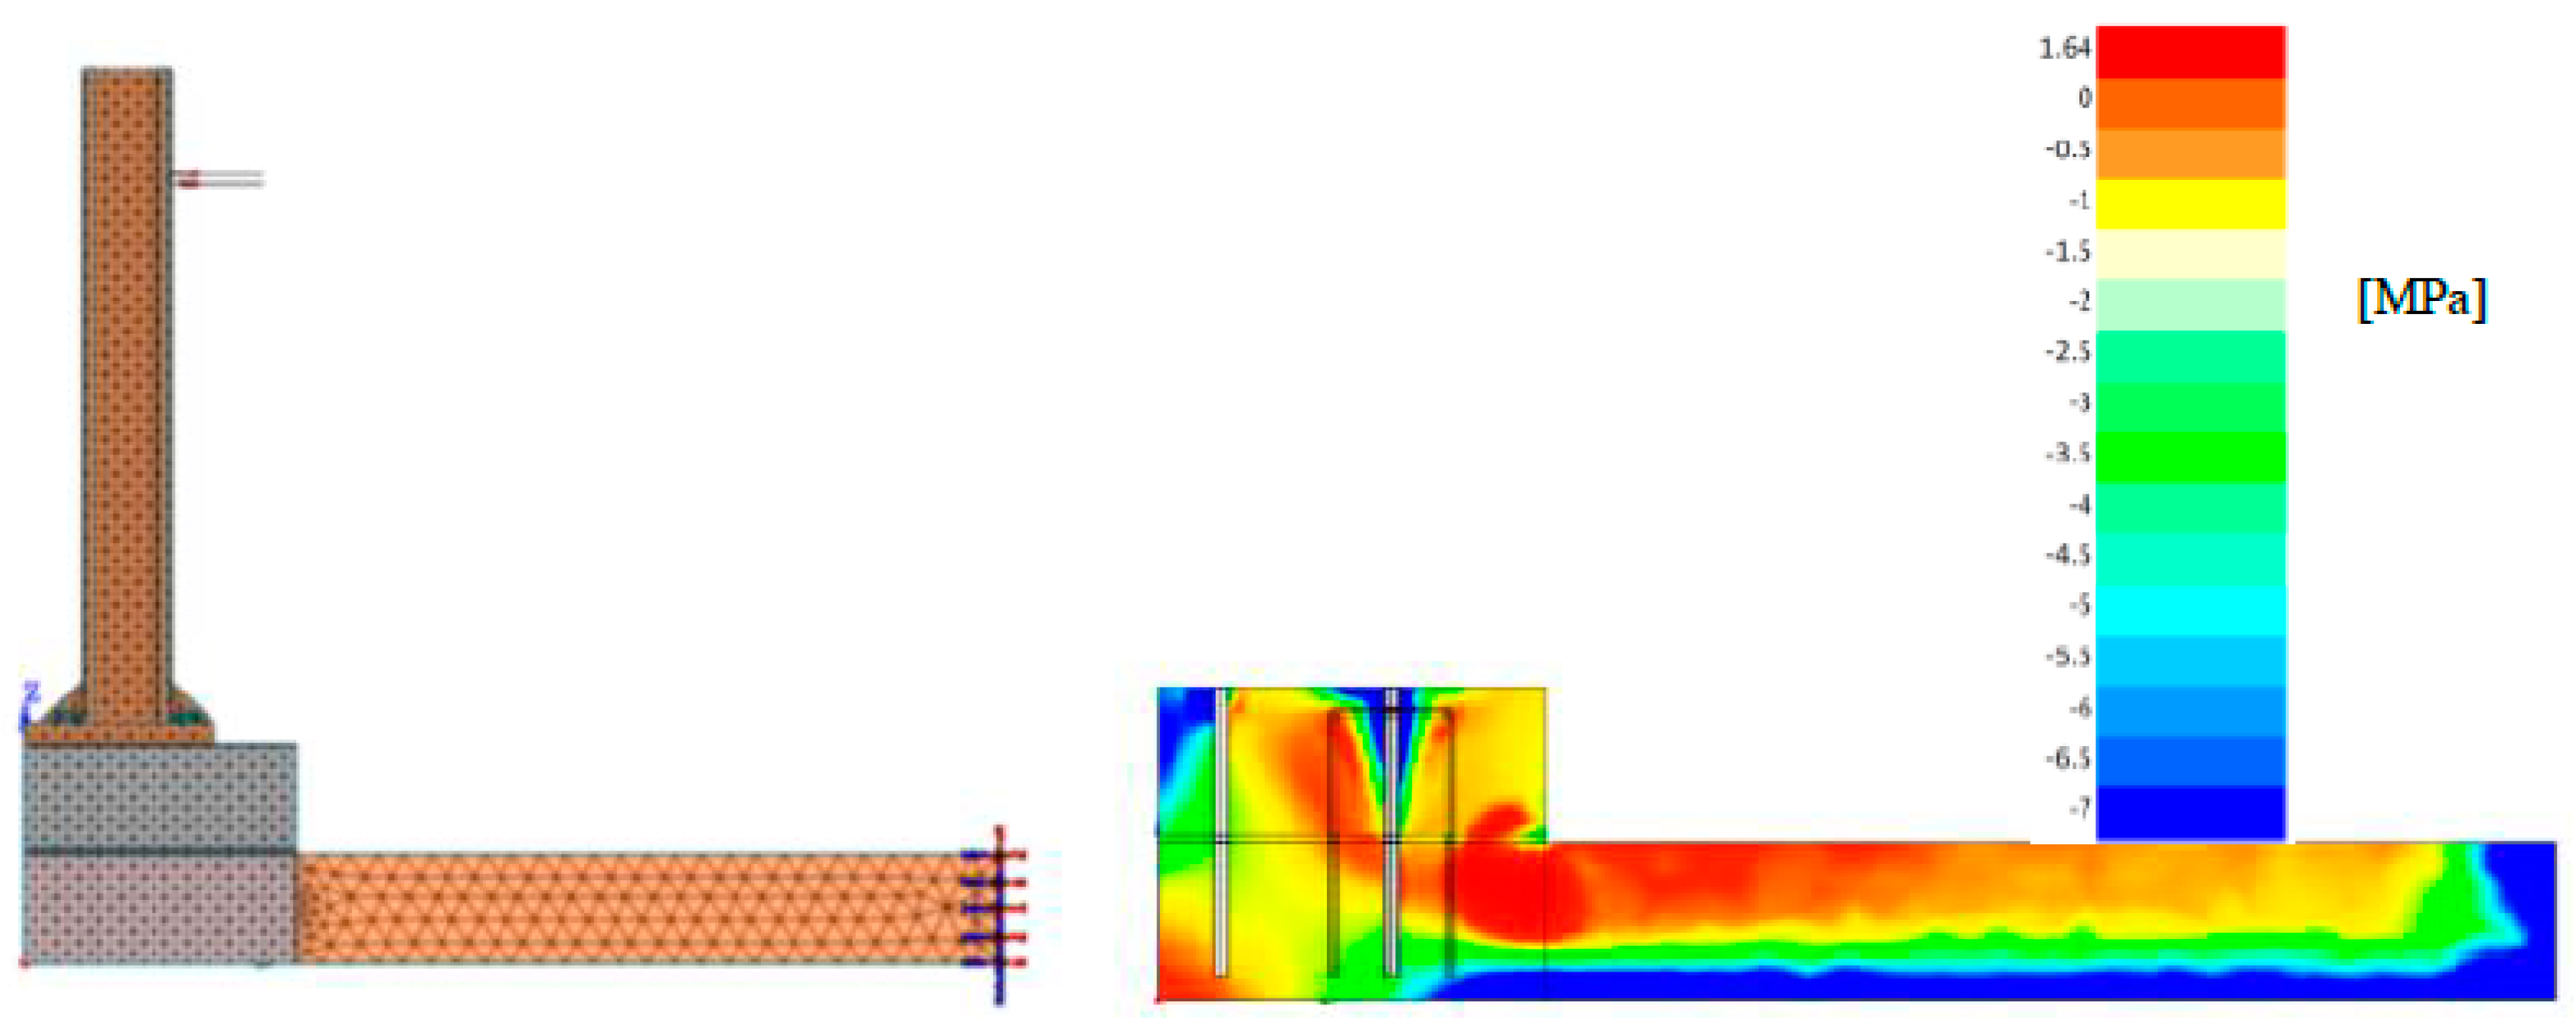
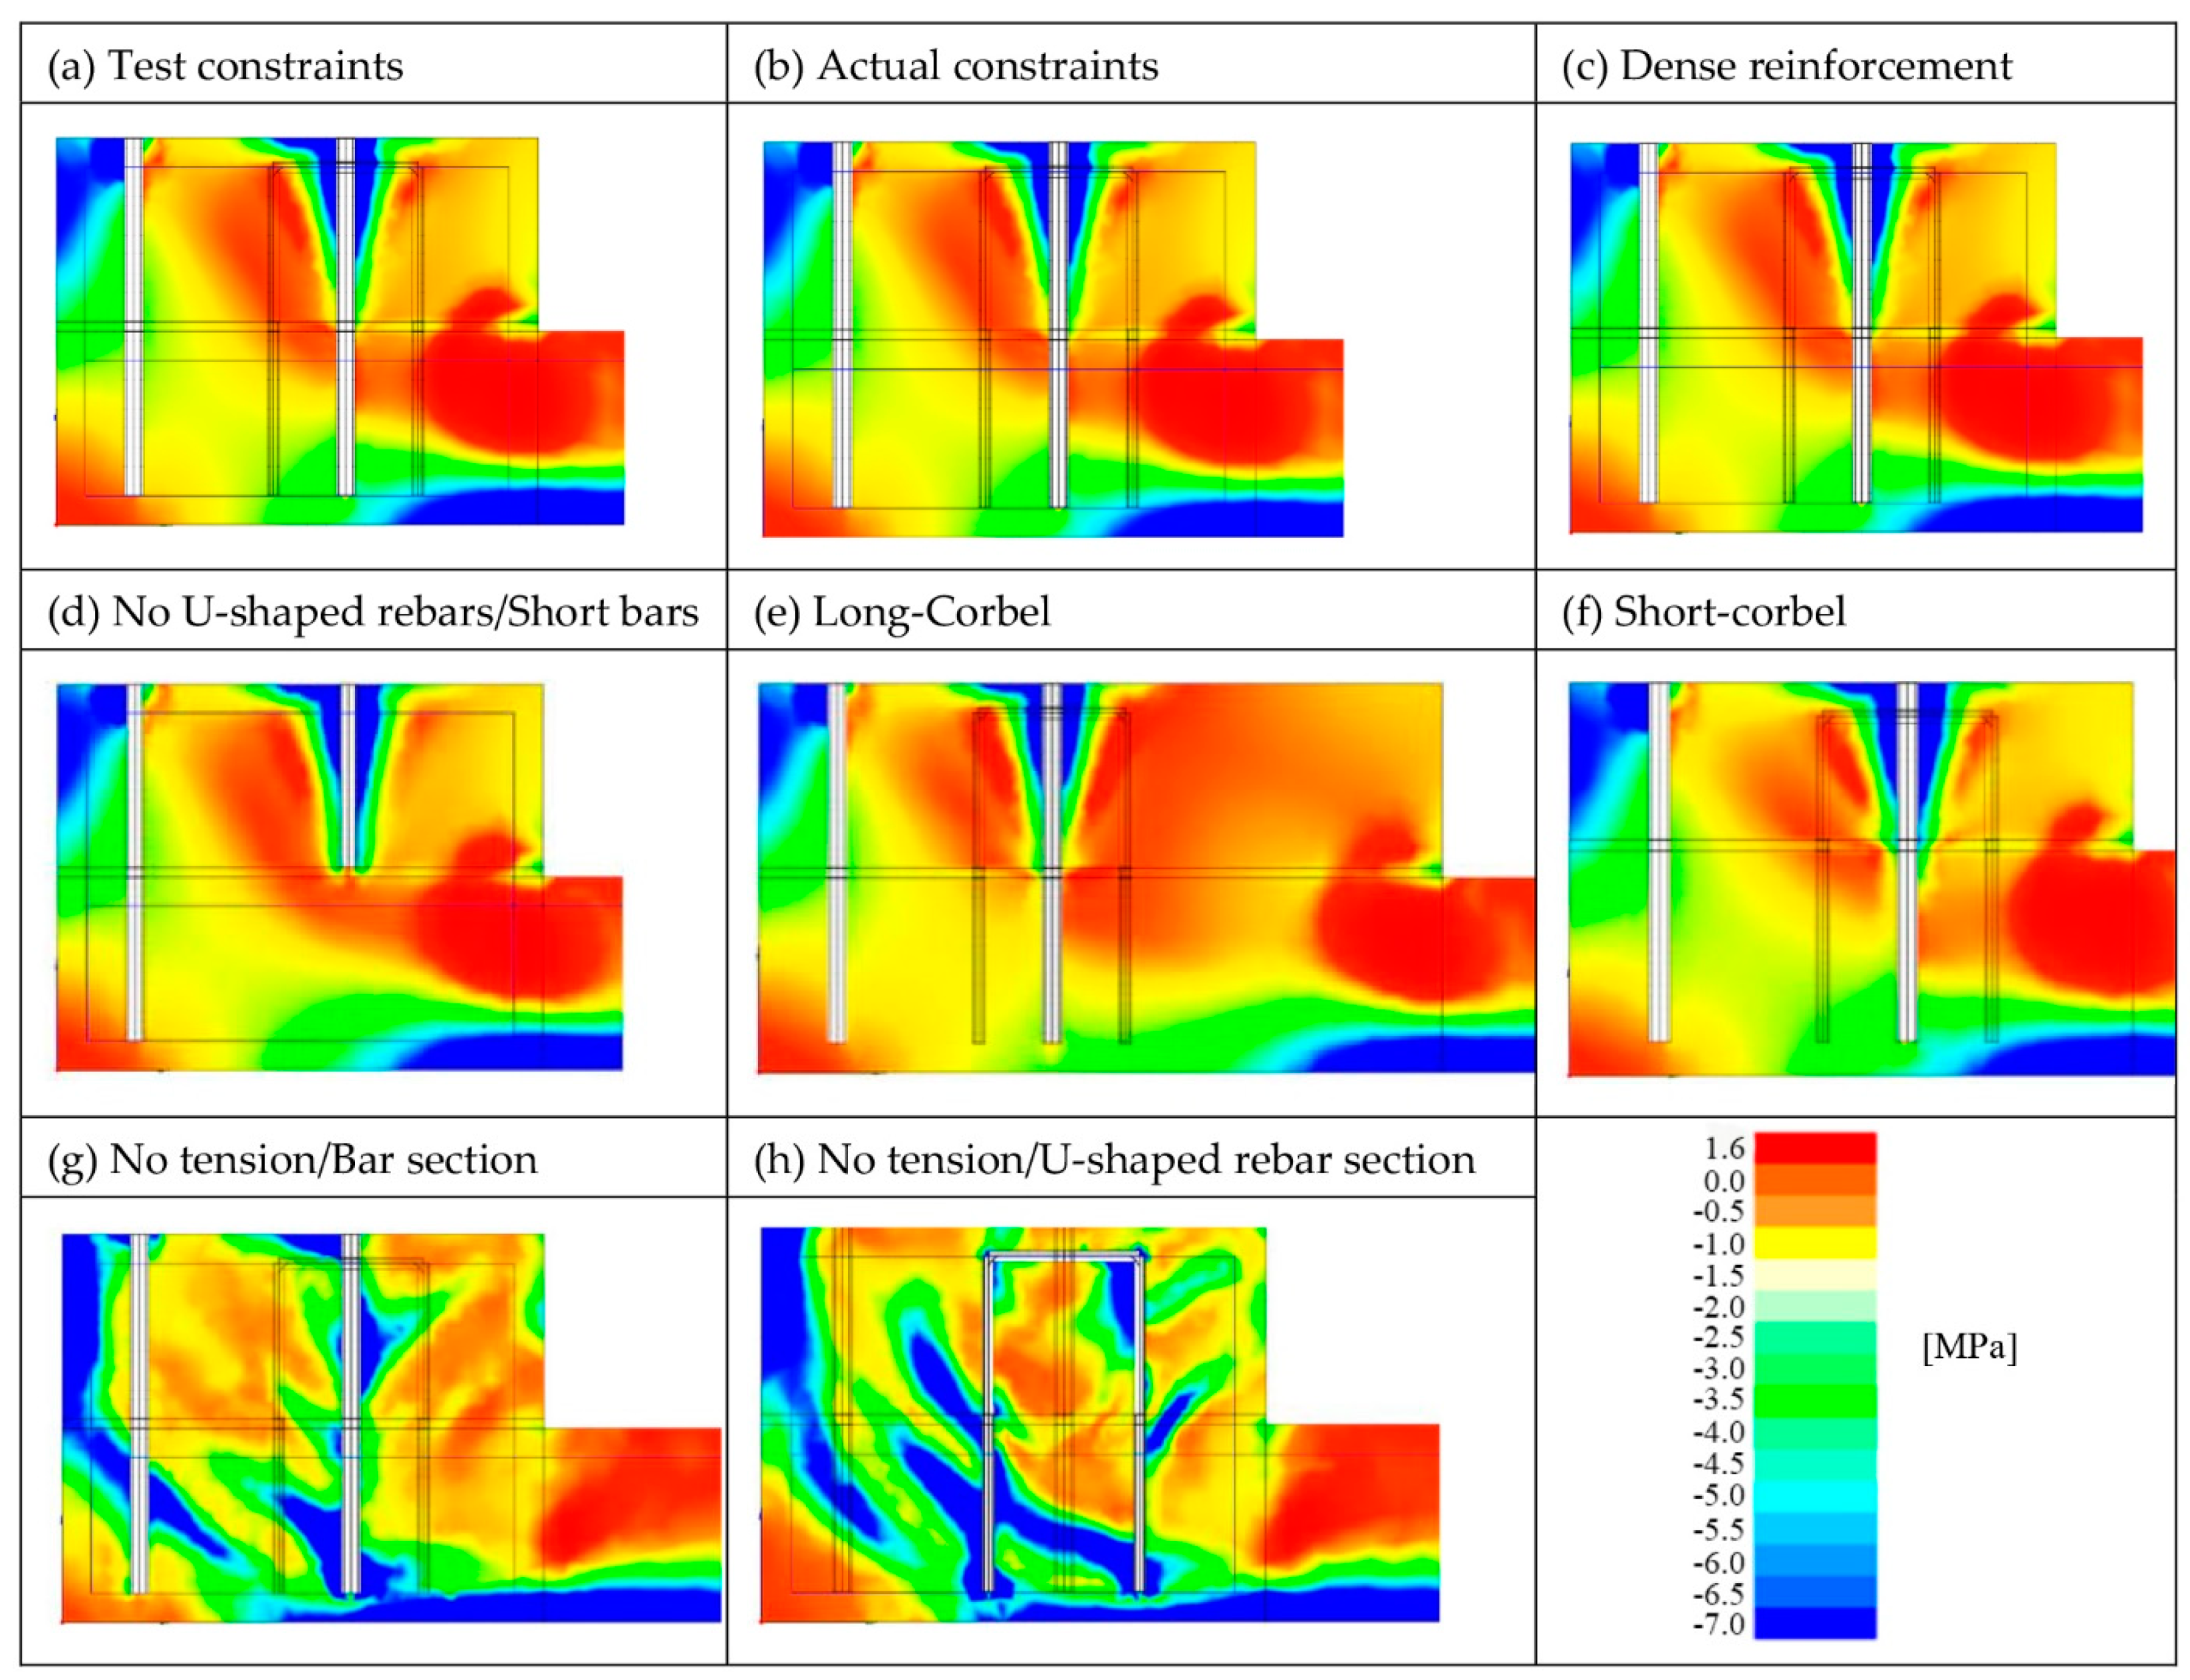
  • Model with actual constraints: Substituting the two supports used to simulate the experimental tests (Figure 6b) with a clamped edge that simulates the real bridge situation. This model showed that the stress field around the anchorage group was not affected by these different boundary conditions (Figure 11).
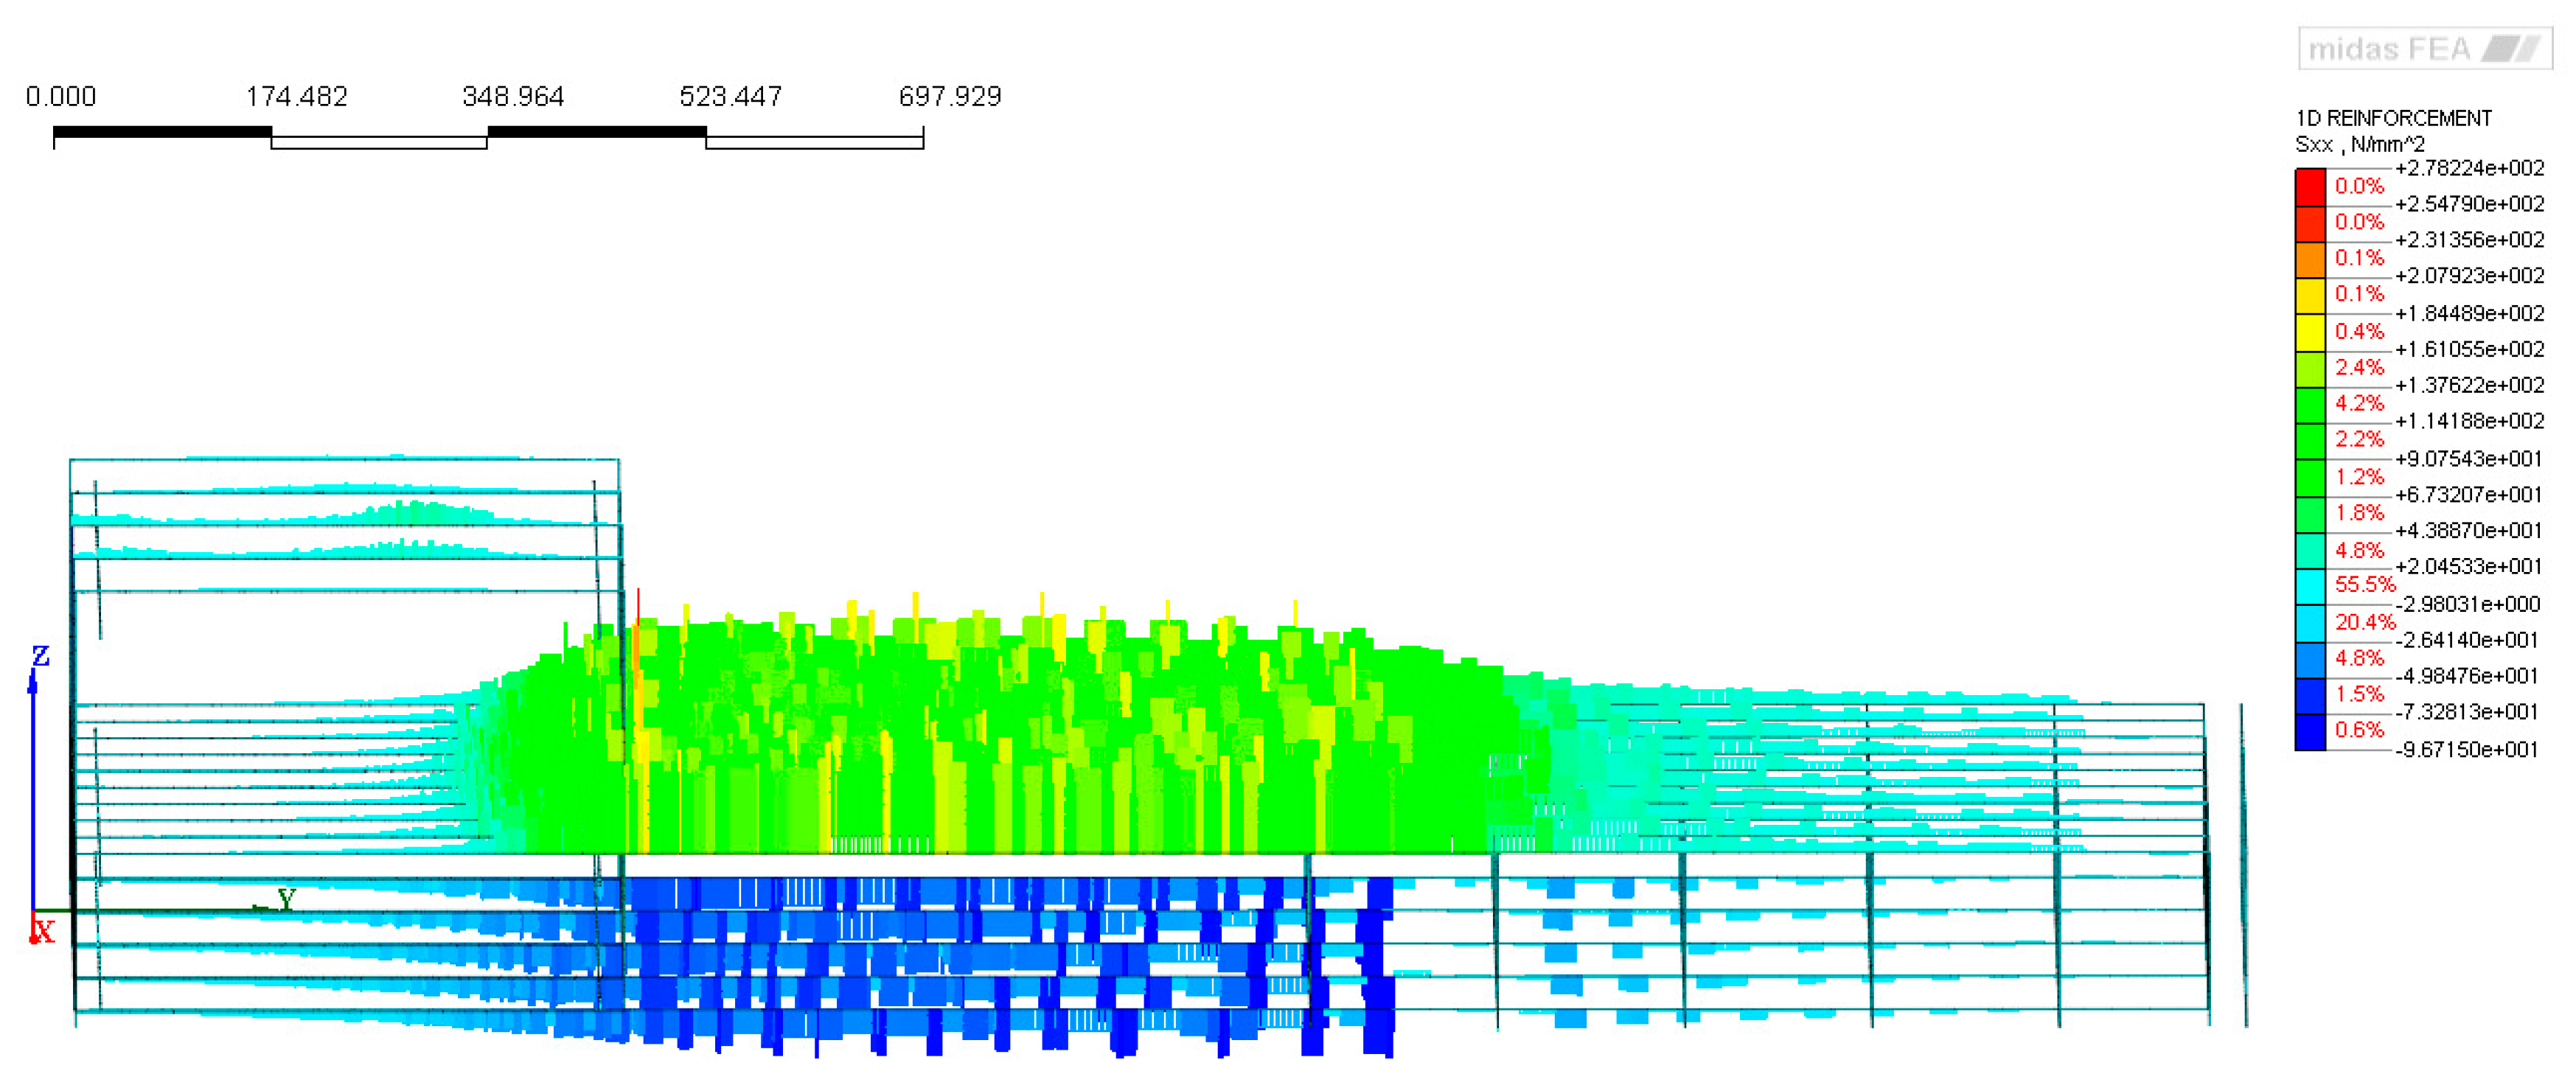
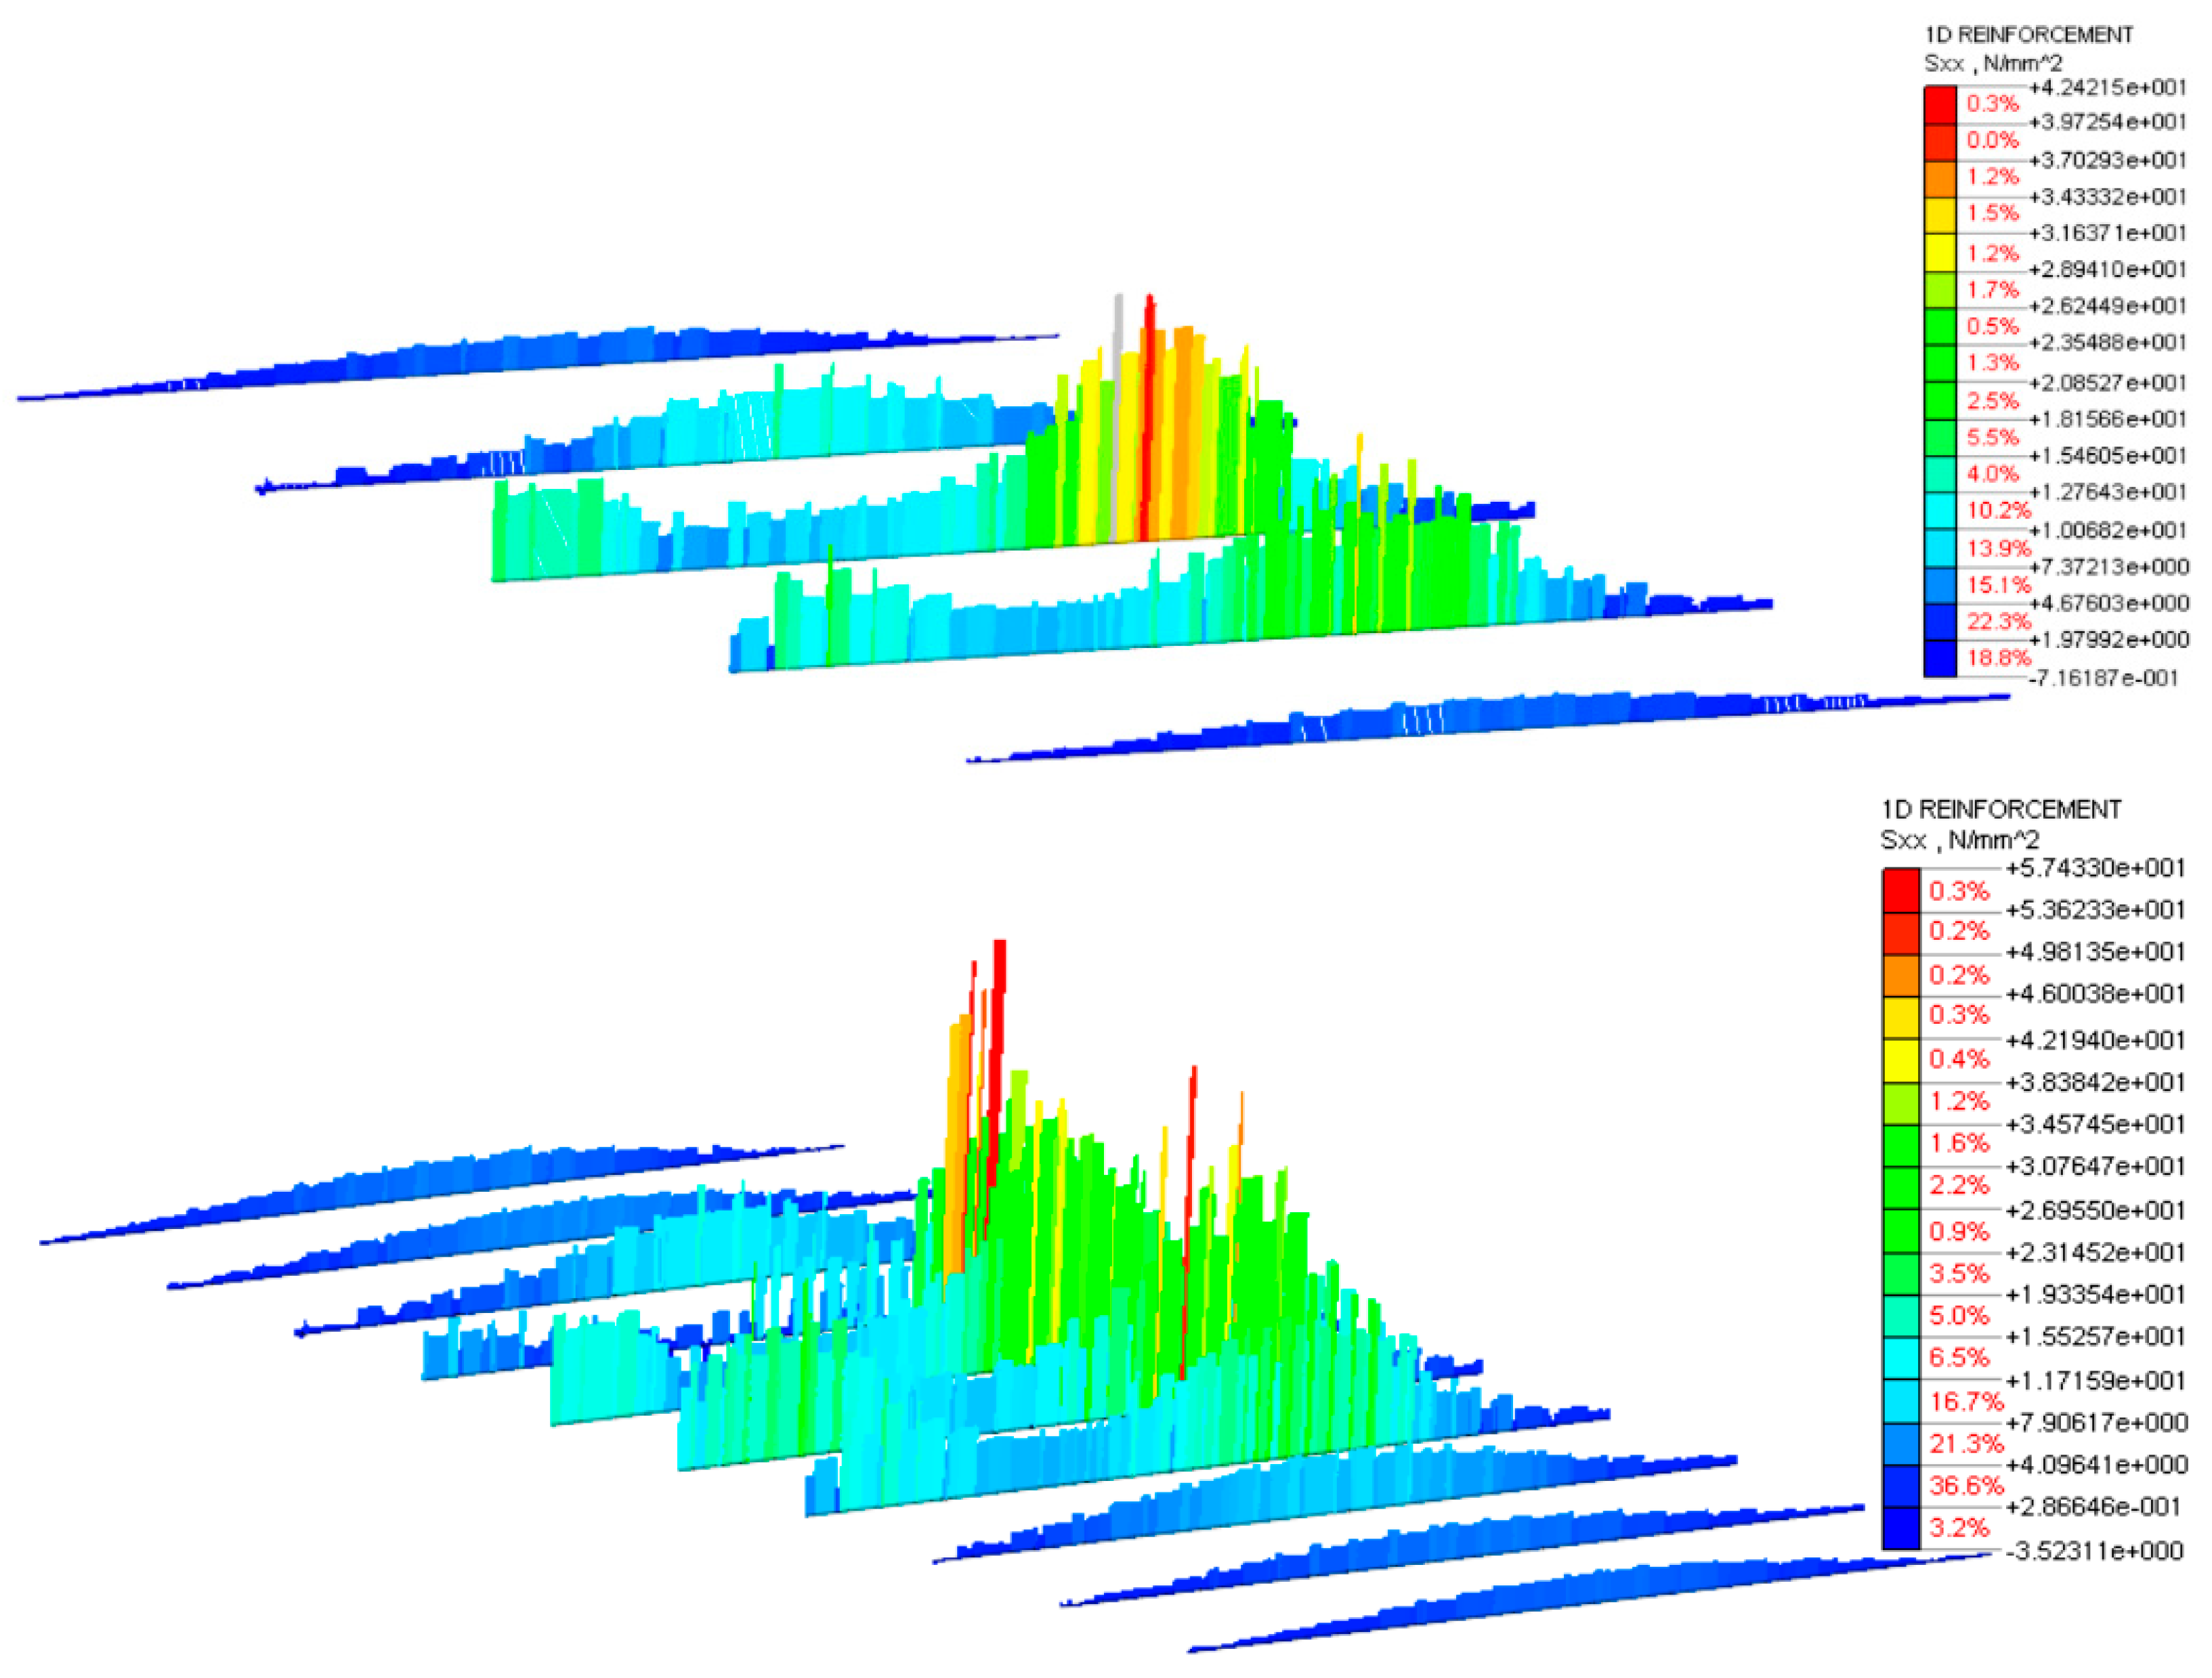
  • Model with dense stirrups to verify if a lower spacing of the stirrups of the corbel affects the stress field. The spacing of the stirrups in the curb was chosen, according to the common practice considering the low reinforcement case (200 mm), while in this model the spacing was reduced to 100 mm, providing twice the area of stirrups. Consequently, only a limited decrease in the average stress of the stirrups was observed (of about 23%, Figure 12) but the overall stress distribution within the corbel did not change (Figure 13c).
  • No U-shaped rebars model: The U-shaped rebars were removed and the anchoring bars in tension were shortened up to the cold joint to evaluate if the presence of the U-shaped rebars and the bars in the region E (Figure 10) had an influence on the deviation of the stress field. This solution obviously is not feasible because, in this case, the tension load cannot be properly transferred to the concrete of the underneath slab (Figure 13d).
The comparison of the stress fields resulting from the numerical analyses, with respect to the reference one, is shown in Figure 13. Although some slight effects due to bonding are present, no appreciable changes can be observed. It is interesting to observe that the tensile stresses in the transition region between deck and curb were unchanged. Thus, these stresses are not related to splitting forces generated by the U-shaped rebars. The transfer mechanism of the tension load follows always the “cone” path and the compression under the plate close to edge has, in all cases, the same inclination.
According to the numerical models (Figure 13), it appears that the steel elements inside the corbel did not play a substantial role in deviating the compressive stress field of the region E (Figure 10), as it is shown in Figure 13a,b, compared to Figure 13c,d. Therefore, the concrete played a major role in the corbel response. In the next models, the geometry and the properties of the concrete were modified to look at their influences on the stress field.
  • Short-corbel and long-corbel models, which are considered as possible geometry in practical applications. In these two models the geometry of the corbel was modified by decreasing the height of the curb from 40 cm to 35 cm (short-corbel model, Figure 13f) and by increasing the length of the curb from 50 cm to 70 cm (long-corbel model, Figure 13e). The comparison of the principal stress in compression fields (Figure 13e,f) allowed us to remark that, even if some modifications in the stresses occurred, the main flow of compression stresses remained substantially unchanged in terms of starting and ending points (Figure 10, points C and E) while changing the geometry of the curb.
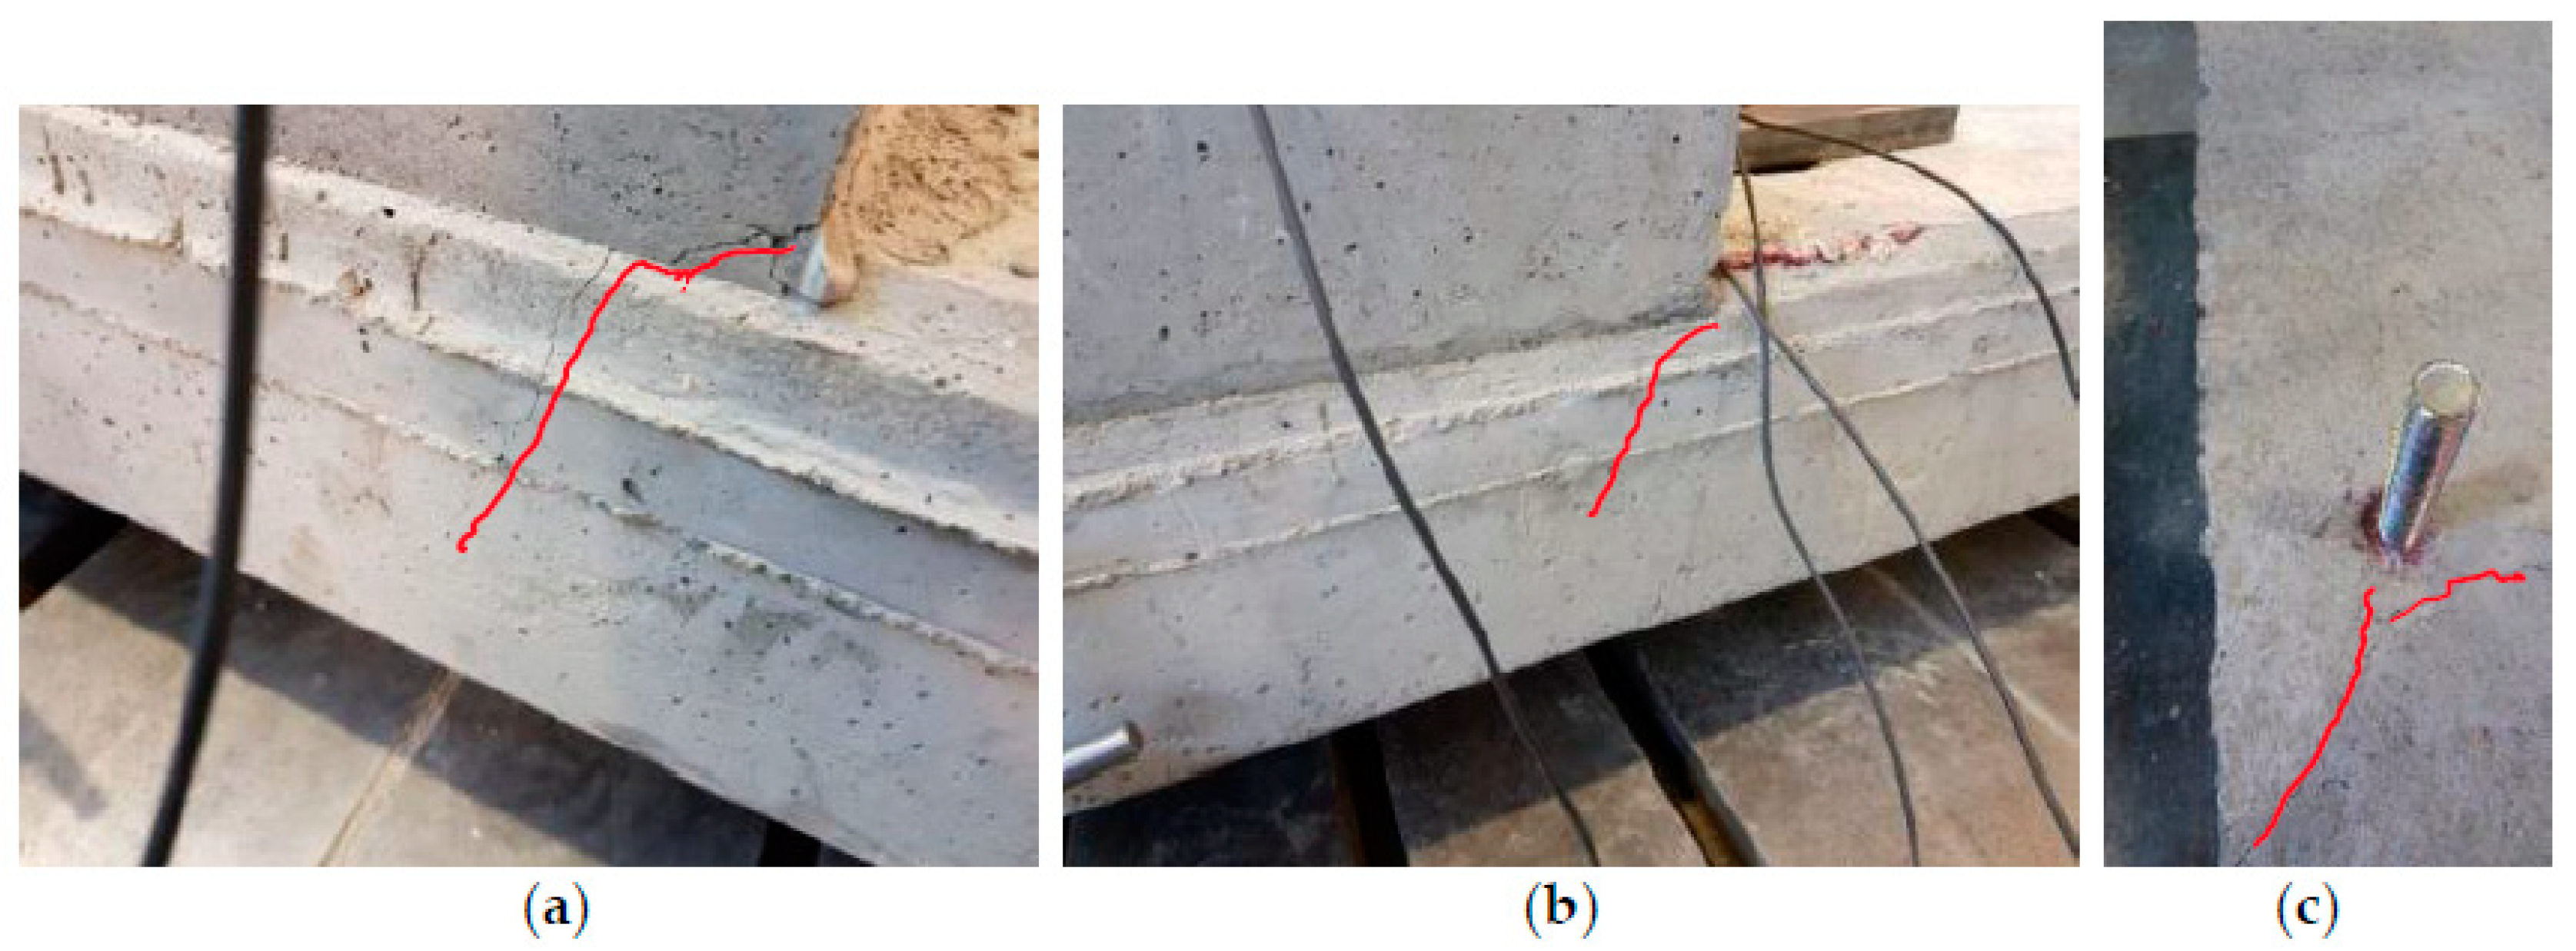
  • No-tension constitutive model (introduced in the 1960s by Zienkiewicz et al. [34]): With the assumption of “no-tension material”, the concrete is considered without any tensile strength. This model can help to understand the implications of the usual hypothesis of no-tension material and what is the role of concrete in this case. The stress fields for the same section passing through the two bars, and for the section passing through the central, U-shaped rebar, are represented in Figure 13g,h, respectively. In this case the stress field was strongly influenced by the anchorage system since concrete could no longer bear tensile stresses. By comparing this model (Figure 13g,h) with the previous ones (Figure 13a–f), it can be observed that the deviation of the stresses in region E was due to the tensile strength of concrete. This model (Figure 13g,h) highlighted the main role of the concrete tensile strength, usually not considered in the design phase. In defining the strut-and-tie model, this contribution cannot be disregarded when dealing with nodal equilibrium. In addition, the no-tension model did not highlight the stress concentration in the corbel/deck transition section, which appeared as the highly stressed section in other models and where cracks appeared during the experimental tests (Figure 2).

4. Conclusions

Safety barriers are usually installed on bridge corbels with a system composed of three post-installed anchors, which is not verified when anchor design provisions are applied. To overcome this problem a new solution with the addition of U-shaped rebars was proposed. This improved connection showed an excellent structural response from experimental point of view and, in addition, was supported by theoretical and numerical analyses. Indeed, with the strut-and-tie model it is possible to evaluate the overall behavior of the corbel and it allows the designer to check quickly whether the reinforcement in the structure is sufficient to carry the external loads or not.
The numerical analyses investigated several parameters to validate the applicability of the strut-and-tie model and showed the global behavior of the concrete member: A dense reinforcement and/or limited variations in the corbel geometry (height or length of the corbel) did not affect the stress field.
The numerical models in which the tensile strength of the concrete was neglected did not meet experimental evidence. Indeed, high stresses’ concentration close to the corbel/deck connection was observed, suggesting that the tensile strength of the concrete plays a crucial role in this type of element and cannot be neglected in a numerical simulation.

Author Contributions

Conceptualization, S.C.; methodology, S.C., L.B. and P.C.; software, S.C. and P.C.; validation, S.C., L.B. and P.C.; formal analysis, S.C. and P.C.; investigation, S.C. and P.C.; data curation, S.C., L.B. and P.C.; writing—original draft preparation, S.C., L.B. and P.C.; writing—review and editing, L.B.; visualization, S.C., L.B. and P.C.; supervision, S.C. and L.B. All authors have read and agreed to the published version of the manuscript.

Funding

This research received no external funding.

Acknowledgments

The authors would like to thank Mirko Squillace of Hilti Italia S.p.A. and Roberto Piccinin of Hilti AG for their technical support of this study, together with the technical staff of the Materials and Structures Testing Laboratory of Politecnico di Milano (particularly, Daniele Spinelli) for their assistance during the experimental work. Findings, opinions, and conclusions are those of the authors and do not necessarily reflect those of the sponsoring organization.

Conflicts of Interest

The authors declare no conflict of interest. The funders had no role in the design of the study; in the collection, analyses, or interpretation of data; in the writing of the manuscript; or in the decision to publish the results.

References

  1. Liu, M.; Frangopol, D.M. Optimizing Bridge Network Maintenance Management under Uncertainty with Conflicting Criteria: Life-Cycle Maintenance, Failure, and User Costs. J. Struc. Eng. 2006, 132, 1835–1845. [Google Scholar] [CrossRef]
  2. Yehia, S.; Abudayyeh, O.; Fazal, I.; Randolph, D. A decision support system for concrete bridge deck maintenance. Adv. Eng. Softw. 2008, 39, 202–210. [Google Scholar] [CrossRef]
  3. Wan-Wendner, R. Aging concrete structures: A review of mechanics and concepts. Die Bodenkult. J. Land Manag. Food Environ. 2018, 69, 175–199. [Google Scholar] [CrossRef] [Green Version]
  4. Cardinale, G.; Orlando, M. Structural evaluation and strengthening of a reinforced concrete bridge. J. Bridge. Eng. ASCE 2004, 9, 35–42. [Google Scholar] [CrossRef]
  5. Mitchell, G.; Strahota, M.T.; Gokani, V.; Picón, R.; Yang, S.; Klingner, R.E.; Williamson, E.B. Performance of Retrofit Highway Barriers with Mechanical Anchors. ACI Struct. J. 2010, 107, 381–389. [Google Scholar]
  6. Cattaneo, S.; Crespi, P. Response of connections between concrete corbels and safety barriers. Materials 2019, 12, 4103. [Google Scholar] [CrossRef] [Green Version]
  7. Cattaneo, S.; Crespi, P.; Locatelli, A.; Rago, D. Safety Barriers for Bridges, Report Dept; ABC, Politecnico di Milano: Milano, Italy, 2018. [Google Scholar]
  8. Gesoglu, M.; Ozturan, T.; Ozel, M.; Guneyisi, E. Tensile behavior of post-installed anchors in plain and steel fiber reinforced normal and high-strength concretes. ACI Struct. J. 2005, 102, 224–231. [Google Scholar]
  9. Cattaneo, S. Wedge-type expansion anchors in high performance concrete. ACI Struct. J. 2007, 104, 191–198. [Google Scholar]
  10. Gurbuz, T.; Ilki, A. Pullout performance of fully and partially bonded retrofit anchors in low strength concrete. ACI Struct. J. 2011, 108, 61–70. [Google Scholar]
  11. Delhomme, F.; Brun, M. Pullout Tests on Post-Installed Bonded Anchors in Ultra-High Performance Fiber Reinforced Concrete. Struct. Eng. Int. 2019, 29, 1–8. [Google Scholar] [CrossRef]
  12. Eligehausen, R.; Cook, R.A.; Appl, J. Behavior and design of adhesive bonded anchors. ACI Struct. J. 2006, 103, 822–831. [Google Scholar]
  13. Cook, R.A.; Konz, R.C. Factors Influencing Bond Strength of Adhesive Anchors. ACI Struct. J. 2001, 98, 76–86. [Google Scholar]
  14. Grosser, P.; Fuchs, W.; Eligehausen, R. A field study of adhesive anchor installations. Concr. Int. 2011, 33, 57–63. [Google Scholar]
  15. González, F.; Fernández, J.; Agranati, G.; Villanueva, P. Influence of construction conditions on strength of post installed bonded anchors. Constr. Build. Mater. 2018, 165, 272–283. [Google Scholar] [CrossRef]
  16. Cattaneo, S.; Locatelli, A.; Rago, D. Reliability of bonded anchors with different installation techniques: Experimental assessment. Asian J. Civ. Eng. 2019, 20, 681–692. [Google Scholar] [CrossRef]
  17. European Committee for Standardization (CEN). CEN/EN1992-1-1+AC. Eurocode 2: Design of Concrete Structures-Part 1-1: General Rules and Rules for Buildings; CEN: Brussels, Belgium, 2010. [Google Scholar]
  18. ACI Committee 318. Building Code Requirements for Structural Concrete (ACI 318-14) and Commentary on Building Code Requirements for Structural Concrete (ACI 318R-14); ACI: Farmington Hills, MI, USA, 2014. [Google Scholar]
  19. European Committee for Standardization (CEN). CEN/EN1992-4. Eurocode 2-Design of Concrete Structures-Part 4: Design of Fastenings for Use in Concrete; CEN: Brussels, Belgium, 2018. [Google Scholar]
  20. Eligehausen, R.; Mallée, R.; Silva, J. Anchorage in Concrete Construction; Ernst&Sohn: Hamburg, Germany, 2006. [Google Scholar]
  21. Charney, F.A.; Pal, K.; Silva, J. Recommended procedures for development and splicing of post-installed bonded reinforcing bars in concrete structures. ACI Struct. J. 2013, 110, 437–446. [Google Scholar] [CrossRef]
  22. Mahrenholtz, C.; Eligehausen, R.; Reinhardt, H. Design of post-installed reinforcing bars as end anchorage or as bonded anchor. Eng. Struct. 2015, 100, 645–655. [Google Scholar] [CrossRef]
  23. Kunz, J.; Hamad, B.S.; Al Hammoud, R. Evaluation of Bond Strength of Bonded-In or Post-Installed Reinforcement. ACI Struct. J. 2006, 103, 207–218. [Google Scholar] [CrossRef]
  24. He, Z.; Liu, Z.; Wang, J.; Ma, Z. Development of Strut-and-Tie Models Using Load Path in Structural Concrete. ASCE J. Struct. Eng. 2020, 146, 06020004. [Google Scholar] [CrossRef]
  25. Cai, C.S. Three-Dimensional Strut-and-Tie Analysis for Footing Rehabilitation. Pract. Period. Struct. Des. Constr. 2002, 7, 14–25. [Google Scholar] [CrossRef]
  26. Xia, Y.; Langelaar, M.; Hendriks, M.A.N. Automated optimization-based generation and quantitative evaluation of Strut-and-Tie models. Comput. Struct. 2020, 238, 106297. [Google Scholar] [CrossRef]
  27. European Organisation for Technical Assessment (EOTA). EOTA/TR048. Details of Tests for Post-Installed Fasteners in Concrete; EOTA: Brussels, Belgium, 2016. [Google Scholar]
  28. European Organisation for Technical Assessment (EOTA). EOTA/ETA 16/0143. Injection System Hilti HIT-RE 500 V3; EOTA: Brussels, Belgium, 2016. [Google Scholar]
  29. Ministero delle Infrastrutture e dei Trasporti. Aggiornamento delle Norme Tecniche per le Costruzioni (NTC2018); Ministero delle Infrastrutture e dei Trasporti: Roma, Italy, 2018. [Google Scholar]
  30. Russo, G.; Venir, R.; Pauletta, M.; Somma, G. Reinforced Concrete Corbels—Shear Strength Model and design Formula. ACI Struct. J. 2006, 103, 3–10. [Google Scholar]
  31. Fib. Model Code for Concrete Structures 2010; Fib: Lausanne, Switzerland, 2013. [Google Scholar]
  32. MidasFEA. Analysis and Algorithm Manual; MidasFEA: South Korea, Seongnam, 2015. [Google Scholar]
  33. Cattaneo, S.; Giussani, F. Shear behaviour of R.C. beams with water-stop joints. Eng. Struct. 2013, 56, 1775–1786. [Google Scholar] [CrossRef]
  34. Zienkiewicz, O.C.; Valliappan, S.; King, I.P. Stress Analysis of Rock as a ‘No Tension’ Material. Géotechnique 1968, 18, 56–66. [Google Scholar] [CrossRef]
Figure 1. (a) U-shaped rebar installation, (b) bar installation, (c) test setup (measures in mm).
Applsci 10 06727 g001
Figure 2. Cracks at the corner between curb and slab (a) and (b) crack close to the edge (c).
Applsci 10 06727 g002
Figure 3. Sketch of the structure.
Applsci 10 06727 g003
Figure 4. Sketch of the curb, vertical section.
Applsci 10 06727 g004
Figure 5. Scheme of the 2D strut-and-tie model, geometrical quantities, and nodes.
Applsci 10 06727 g005
Figure 6. FEM (finite element model) of the tested specimen (a) model, (b) load and boundary conditions, (c) reinforcement layout, (d) anchorage system, and (e) displacement control points.
Applsci 10 06727 g006
Figure 7. Experimental (dashed) vs. numerical (continuous) displacements.
Applsci 10 06727 g007
Figure 8. Crack pattern from different views.
Applsci 10 06727 g008
Figure 9. Distribution of stresses in the ordinary reinforcement.
Applsci 10 06727 g009
Figure 10. Distribution of principal compression stresses in the considered section.
Applsci 10 06727 g010
Figure 11. Actual constraints of the system and principal stresses of compression.
Applsci 10 06727 g011
Figure 12. Stresses in the upper portion of corbel stirrups, spacing 200 mm vs. 100 mm.
Applsci 10 06727 g012
Figure 13. Summary of results of the analyzed models in terms of stress distribution.
Applsci 10 06727 g013
Table 1. Components of the strut-and-tie model of the corbel.
GeometryActions/ForcesDesign
Z, Z2, h1, Hcorbel, Hdeck (see Figure 5)T, VEd, MEd
Z 1 = Z h 1 · tan ( θ 1 ) F 1 = T cos ( θ 1 ) Area of stirrups within 2 steel plate width
A T = max ( H v , H ) f y d
cs concrete cover H = F 1 sen ( θ 1 ) + V E d Steel area at the top of the deck
A s = T r f y d
S1 =spacing between U-shaped rebars
S2 =spacing between the vertical branches of the U-shaped rebars
F = H cos ( θ ) Area of concrete under tension
A c = 3 S 1 · 2 S 2 T 1 f c t d
X (see Figure 5)—determined as the half of the neutral axis at the ultimate limit state of the slab with a width B = 3S1 H v = F   sen ( θ )
p = H c u r b + H d e c k c s h 1 X Z 2 · tan ( θ 3 ) C = M E d + V E d H c u r b H d e c k c s x / 2
θ1 = 10° T r = C + V E d
θ = a r c t g ( h 1 Z 2 ) F 3 = C cos ( θ 3 )
F 2 = F 1 cos ( θ 1 ) sen ( θ 2 )
θ 2 = a r c t g ( p Z 1 ) T 1 = F 2 sen ( θ 2 ) F 3 sen ( θ 3 )
θ 3 = a r c t g ( H v C )

