Article

Influence of Radar and Gauge Rainfall Data Sources on the Analysis of Spatial Distribution of Traffic Accidents and Rainfall Events

1
Korea Institute of Civil Engineering and Building Technology, 283, Goyangdae-Ro, Ilsanseo-Gu, Goyang-Si, Gyeonggi-Do 10223, Korea
2
Department of Civil and Environmental Engineering, Korea University of Science and Technology, 283, Goyangdae-Ro, Ilsanseo-Gu, Goyang-Si, Gyeonggi-Do 10223, Korea
*
Author to whom correspondence should be addressed.
Appl. Sci. 2020, 10(20), 7327; https://doi.org/10.3390/app10207327
Submission received: 3 September 2020 / Revised: 15 October 2020 / Accepted: 16 October 2020 / Published: 20 October 2020
(This article belongs to the Section Civil Engineering)

Abstract

:
The records of 24,797 traffic accidents (9039 involving fatalities or severe injury) during rainy conditions from 2007 to 2017 in Seoul, South Korea, were used to analyze the spatial distribution of the traffic accidents and rainfall events based on radar and gauge rainfall data. According to the spatial correspondence analysis between rainfall distribution and accident locations for localized and stratiform rain events, radar data in a two-dimensional grid (250 by 250 m) of 10 min temporal resolution benefited the localized rainfall distribution concerning the accident location. The relative accident rate (RAR) from radar data, which was used as a quantitative reference value for the effect of rainfall on traffic accidents, was about 18% higher than that from gauge rainfall. The radar data more clearly classified the number of traffic accidents during rainy conditions because its spatial distribution was more precise for all accidents. In addition, the RAR estimation of accidents involving fatalities and severe injury during rainfall could provide information on the district in which traffic accidents increase due to rainfall. The study results support the adoption of radar-derived rainfall data to analyze the influence of rainfall on accidents and the development of more accurate risk-assessment tools for drivers and planners.

1. Introduction

The number of fatal road accidents increases sharply during adverse weather conditions such as fog, snow, or rain; this trend causes problems including socio-economic loss and increased social anxiety [1,2,3,4]. The causes of traffic accidents can be divided into three categories: first, driver-related factors that include recognition error, decision error, and performance error; second, vehicle-related factors that include tire/wheel-related, brake-related, and steering-related; and third, environment-related reasons that include slick roads, fog/rain/snow, and road design [5]. This study focuses on rain-related factors. Precipitation has a particularly significant impact on the risk and frequency of traffic accidents that occur in relation to weather conditions [6,7]. For example, accidents and injuries are 10% and 8% more likely, respectively, on rainy days, and higher rainfall intensity is associated with a 50% increase in the possibility of accidents [8]. Moderate rainfall (>10 mm) has also been associated with increased accident risk [9]. Rain causes accidents through a combination of physical effects that affect the driving environment [10], such as tire friction loss, and drivers’ lowered abilities [11], such as poor visibility due to rainy conditions or secondary spray from other vehicles. Therefore, it is necessary to clarify the relationship between adverse weather and road safety to develop smarter technology that enables safe driving of both normal and autonomous vehicles [9]. According to the Korea Road Traffic Authority, the total number of fatalities in road traffic accidents has decreased; however, the number of crashes during rainy conditions has increased [12]. In particular, in Seoul, traffic fatality rates on rainy days were the highest of all cities [13]. In the Seoul area, the observation network measuring rainfall information is sparse; hence, a limited number of studies have been conducted on the relationship between rain and traffic accidents and its effects [14].
Previous studies investigating the effects of rainfall on accidents have focused on urban areas [9,15] because global urbanization is increasing the relative importance of cities. Improved vehicle design and driver training have reduced weather-related accident rates in developed countries in recent decades, but urbanization and rising occurrences of extreme rainfall events have led to the need for more effective approaches to analyzing the links between rainfall and accidents [7,16,17]. For example, Jaroszweski and McNamara [18] compared the relative accident rate (RAR) for precipitation events using both radar-derived and gauge-based rainfall data for two urban areas in the United Kingdom, finding that the former approach was far superior. RAR values vary based on rain data sources. Although many studies have assessed the cause-and-effect relationship between traffic accidents and rainfall, few have used such time-based high-resolution radar data, especially to analyze changes in the frequency of traffic accidents due to differences in spatial rainfall distribution within urban areas. In this study, we analyzed the relationship between rainfall and traffic accident rates in Seoul, South Korea, using the gauge- and radar-derived rainfall data to assess the influence of the type of rainfall data used on the spatial distribution of traffic accident patterns.

2. Study Area and Data
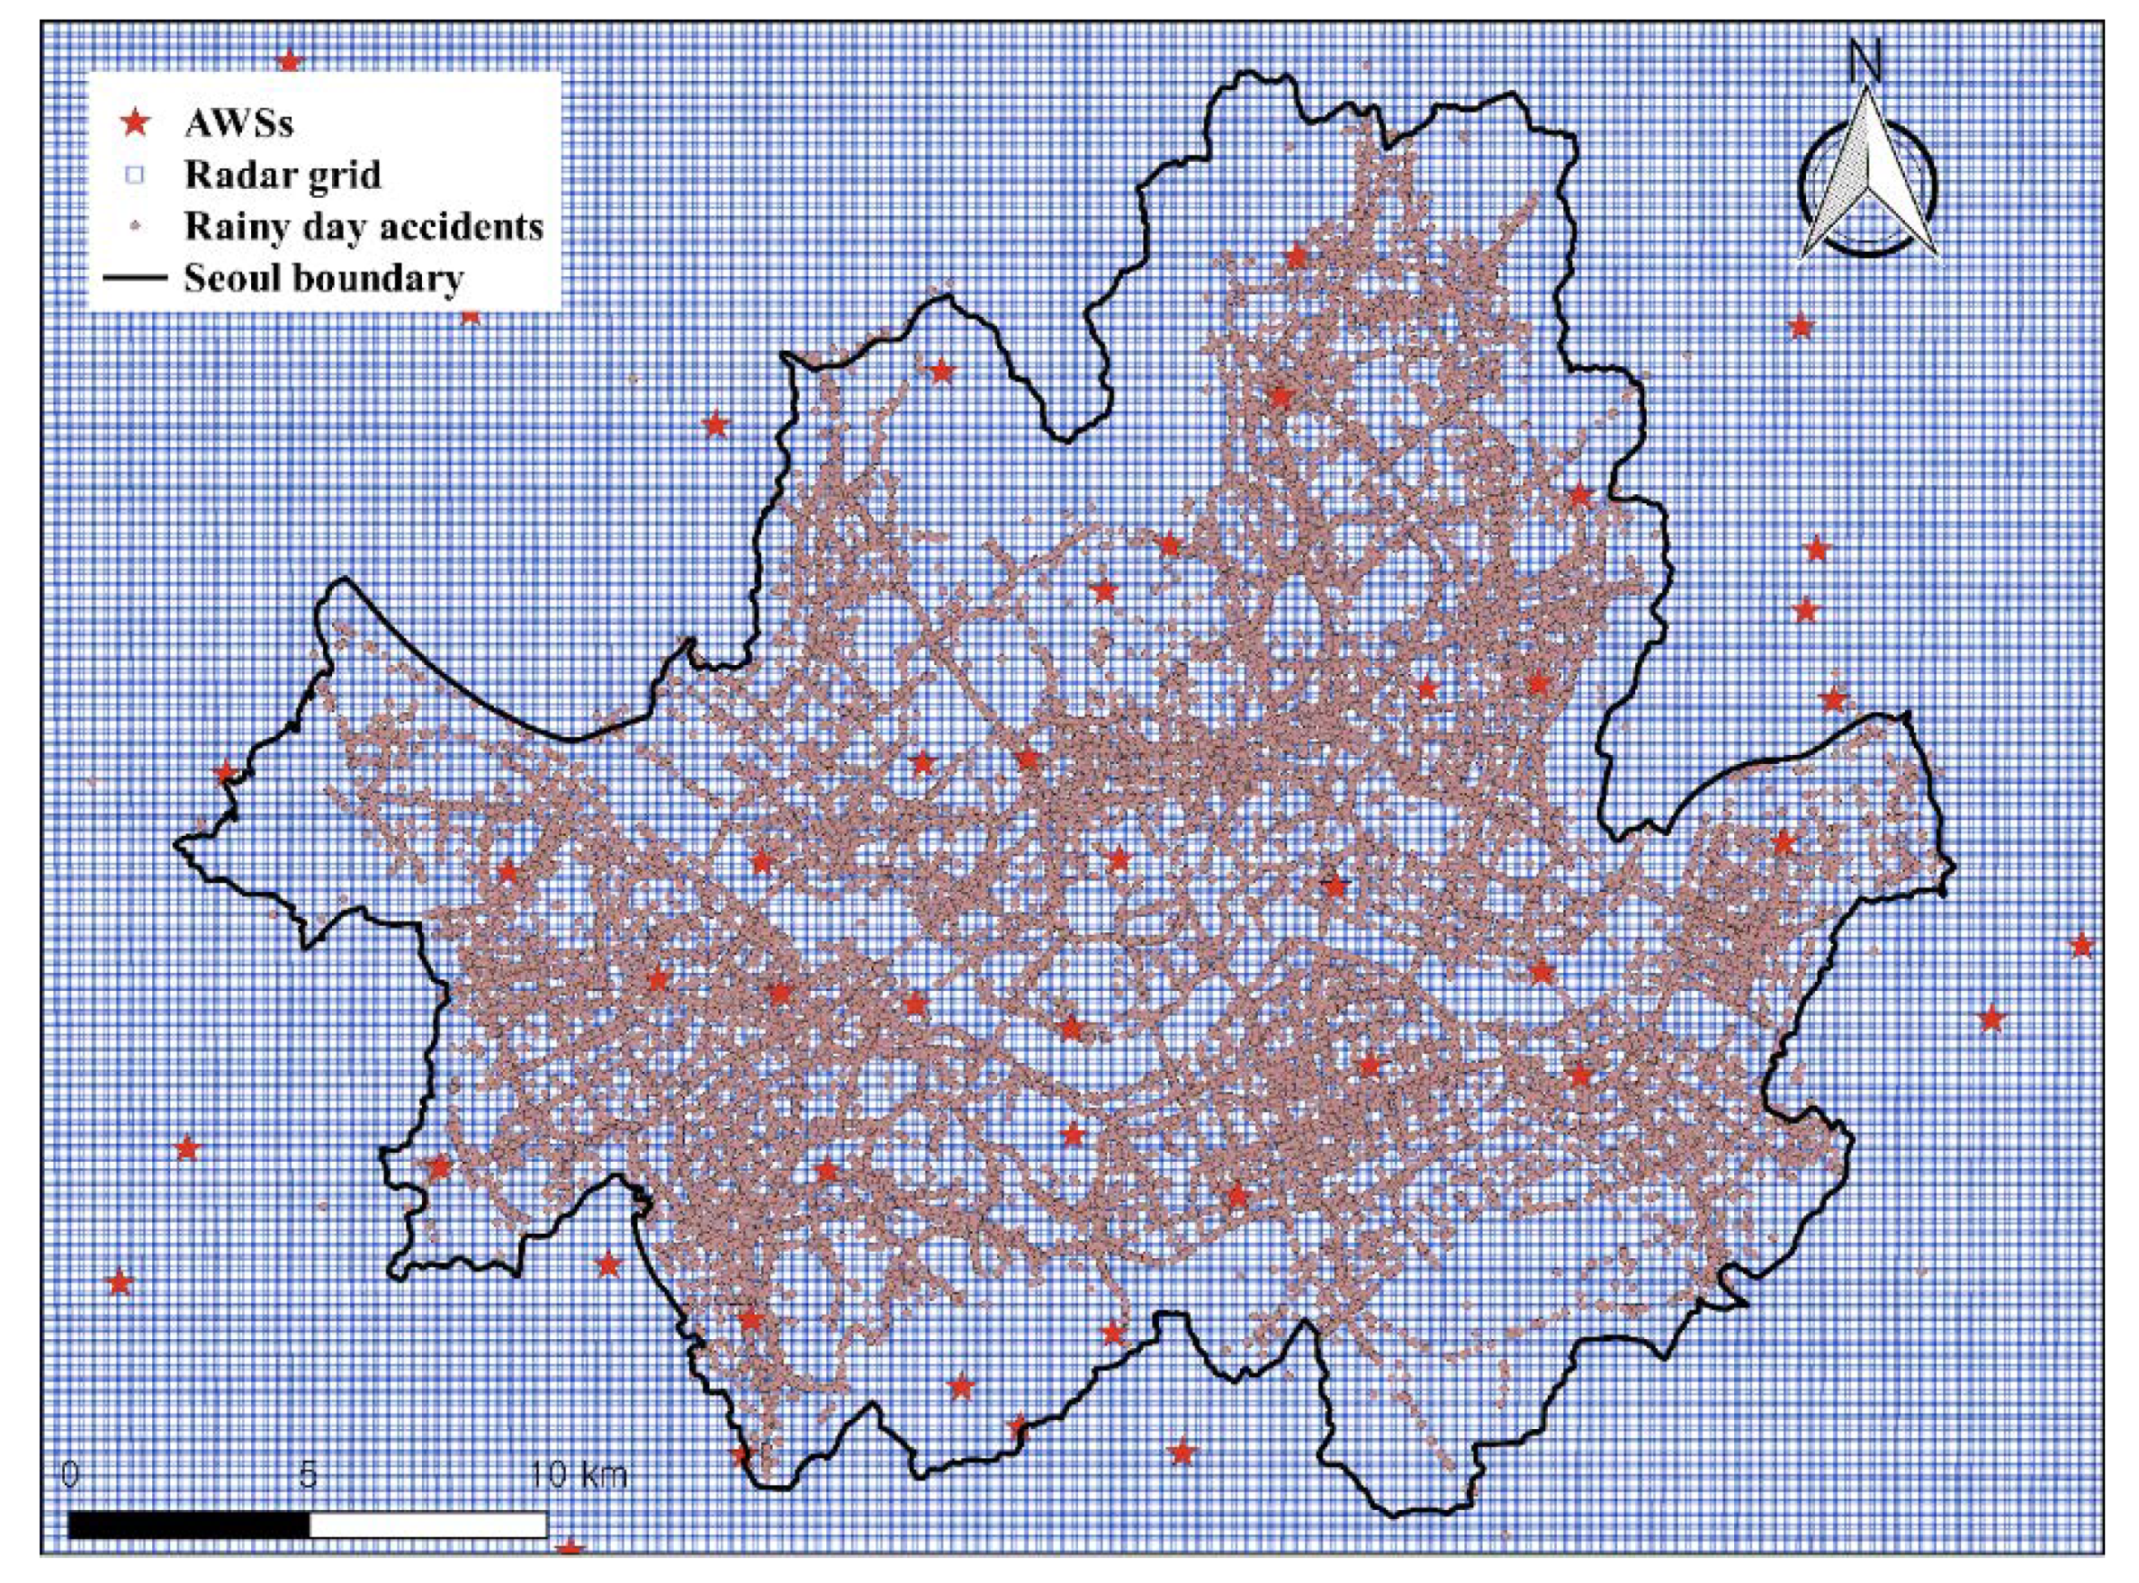
2.1. Study Area

The metropolitan city of Seoul was selected as the study area. Seoul is located in the center of the Korean Peninsula and is the country’s capital. Its area is 0.6% (605 km2) of the total area of Korea, but the population density is very high at 16,100 people/km2. Due to this high population density, the traffic volume is also extremely high, road safety is diminished, and the road safety index is low [13].
Seoul city has 80.6 rainy days with over 1.0 mm rainfall per year on average, and the average annual rainfall of Seoul city is 1387 mm, which is 28.9 mm higher than the average for Korea, according to the data from the Korea Meteorological Administration. Due to the recent extreme weather, the rainfall deviation in each administrative area, including that in Seoul, is large. Therefore, it is necessary to analyze the relationship between traffic accidents and the rainfall in Seoul using appropriate rainfall information.

2.2. Traffic Accident Data

We used accident records collected by the Traffic Accident Analysis System (TASS) operated by the South Korean Road Traffic Authority [12], focusing on accidents in Seoul (the most urbanized city in South Korea) during the rainy season (April to October) from 2007 to 2017. A total of 259,088 traffic accident cases were collected for this period. Among the collected 259,088 cases, 24,797 accidents occurred in rain conditions, and the remained occurred in absence of rainfall. Each collected accident record included the date and time of the accident combined with details such as the number of fatalities, number and degree of injuries, gender and age of those involved, and accident summaries. Among the 24,797 accidents that occurred in rain conditions, 9039 accidents involved fatalities or severe injury. The accident reports also included the records of weather conditions (rainfall, fog, etc.) by the police handling the accident.
From the 24,797 accidents that occurred in rain conditions, we extracted the data on weather conditions occurring one week prior and one week after the accidents. The extraction of this data allowed consideration of data from a similar period during which no rain was falling. Classification of rainfall/no-rain conditions in the record was based on weather conditions directly recognized by the police officer handling the accident, without using weather information observed at the time. Therefore, rainfall conditions based on accident reports were defined as actual weather conditions at the time in that location. The geographic locations of all selected accidents were used when collecting relevant gauge- and radar-derived rainfall data.

2.3. Gauge and Radar Data

Although physical rain gauges can be used to obtain rainfall information, their limited distribution and point-source data make it impossible to obtain accurate rainfall information for specific accident locations. In contrast, radar-derived rainfall data can provide two-dimensional high-resolution (250 m to 1 km) coverage that can be tied to the accident location and provides a significantly more detailed picture of rainfall distribution than rain gauges [19,20].
The Korea Meteorological Administration (KMA) operates 30 automatic weather stations (AWSs) in or near Seoul (Figure 1). These AWSs collect 1-min rainfall observation data that we converted into 1-h cumulative rainfall data for further analysis. Radar-derived rainfall data were collected from two KMA weather radar sites to investigate the three-dimensional structure of rainfall. The Kwanaksan weather radar site is located in Seoul, where a cone of silence causes some observation gaps, and the Gwangdeoksan weather radar site is located approximately 100 km away and is affected by beam attenuation and topography because the city is surrounded by mountains. The data from the two sites were composited to compensate for these issues. Both radars are S-band with a beam width of 1° and a gate size of 250 m; radar is provided in Universal Format (UF). Volume data were extracted from the radar reflectivity data to obtain constant altitude plan position indicator (CAPPI) data at a height of 1.5 km using a bilinear interpolation program based on the algorithm suggested by Mohr and Vaughan [21]. The spherical coordinates of the volume data were then transformed into Cartesian coordinates. The spatial and temporal resolutions of the extracted CAPPI data were 250 × 250 m2 and 10 min accumulated [22]. To use radar data, the raw data (dBZ) were converted into rainfall intensity data using the Z–R power-law relation (Z = aRb), with a = 200 and b = 1.6.
In general, it is known that the adjustment of the radar rainfall value is quantitatively estimated by calculating the bias of the ground rainfall gauge. Then, the calibrated radar data are generally used to replace ungauged locations. However, it is not an appropriate calibration process for the radar data for this study, because the radar and gauge station data should be directly compared and each paired with the accident locations. Therefore, when analyzing the effect of rainfall on traffic accidents in this study, a separate radar rainfall correction technique was not applied.
The interpolated rainfall data were used to obtain rainfall information corresponding to the accident location in some previous studies [14,23]. To consider a spatial distribution of rainfall using a point rain gauge, we also used kriging to interpolate the rain gauge data into a distributed data set, then used Geographic Information System (GIS) spatial analysis to compare the gauge- and radar-derived rainfall to identify the rain gauges nearest the accident site and rainfall distribution at the time of the accident (Figure 1).

2.4. RAR Calculation

The RAR has been used as an indicator of the effect of rainfall on traffic accidents; this compares the rate of accidents recorded during a rainfall event to that during normal weather conditions. Mostly, a matched-pair approach can generally be used to determine the RAR on the basis that incidents observed (usually via police reports) during rainy periods in a particular area can be compared to a no-rain period. Matched rainfall periods are those periods in which police reports and either gauge or radar coincide with the rainfall data. It should be assumed that other factors, such as traffic volume, driver demographics, and lighting conditions, are otherwise similar to each other. After identifying all matched pairs, we counted crashes occurring during each matched period and calculated the RAR [4,8,18]. In this study, the following equation was used to calculate the RAR, where n represents the total number of RAR calculations within the period for data analysis. The daily average number of accidents during matched days without rain was calculated with the accident data in no-rain days within one week before and after each day of accidents occurring during rainfall.
R A R = N u m b e r   o f   t h e   a c c i d e n t s   d u r i n g   m a t c h e d   r a i n y   h o u r s   w i t h i n   a   r a i n y   d a y D a i l y   a v e r a g e   n u m b e r   o f   a c c i d e n t s   d u r i n g   m a t c h e d   d a y s   w i t h o u t   r a i n f a l l

3. Results and Discussion

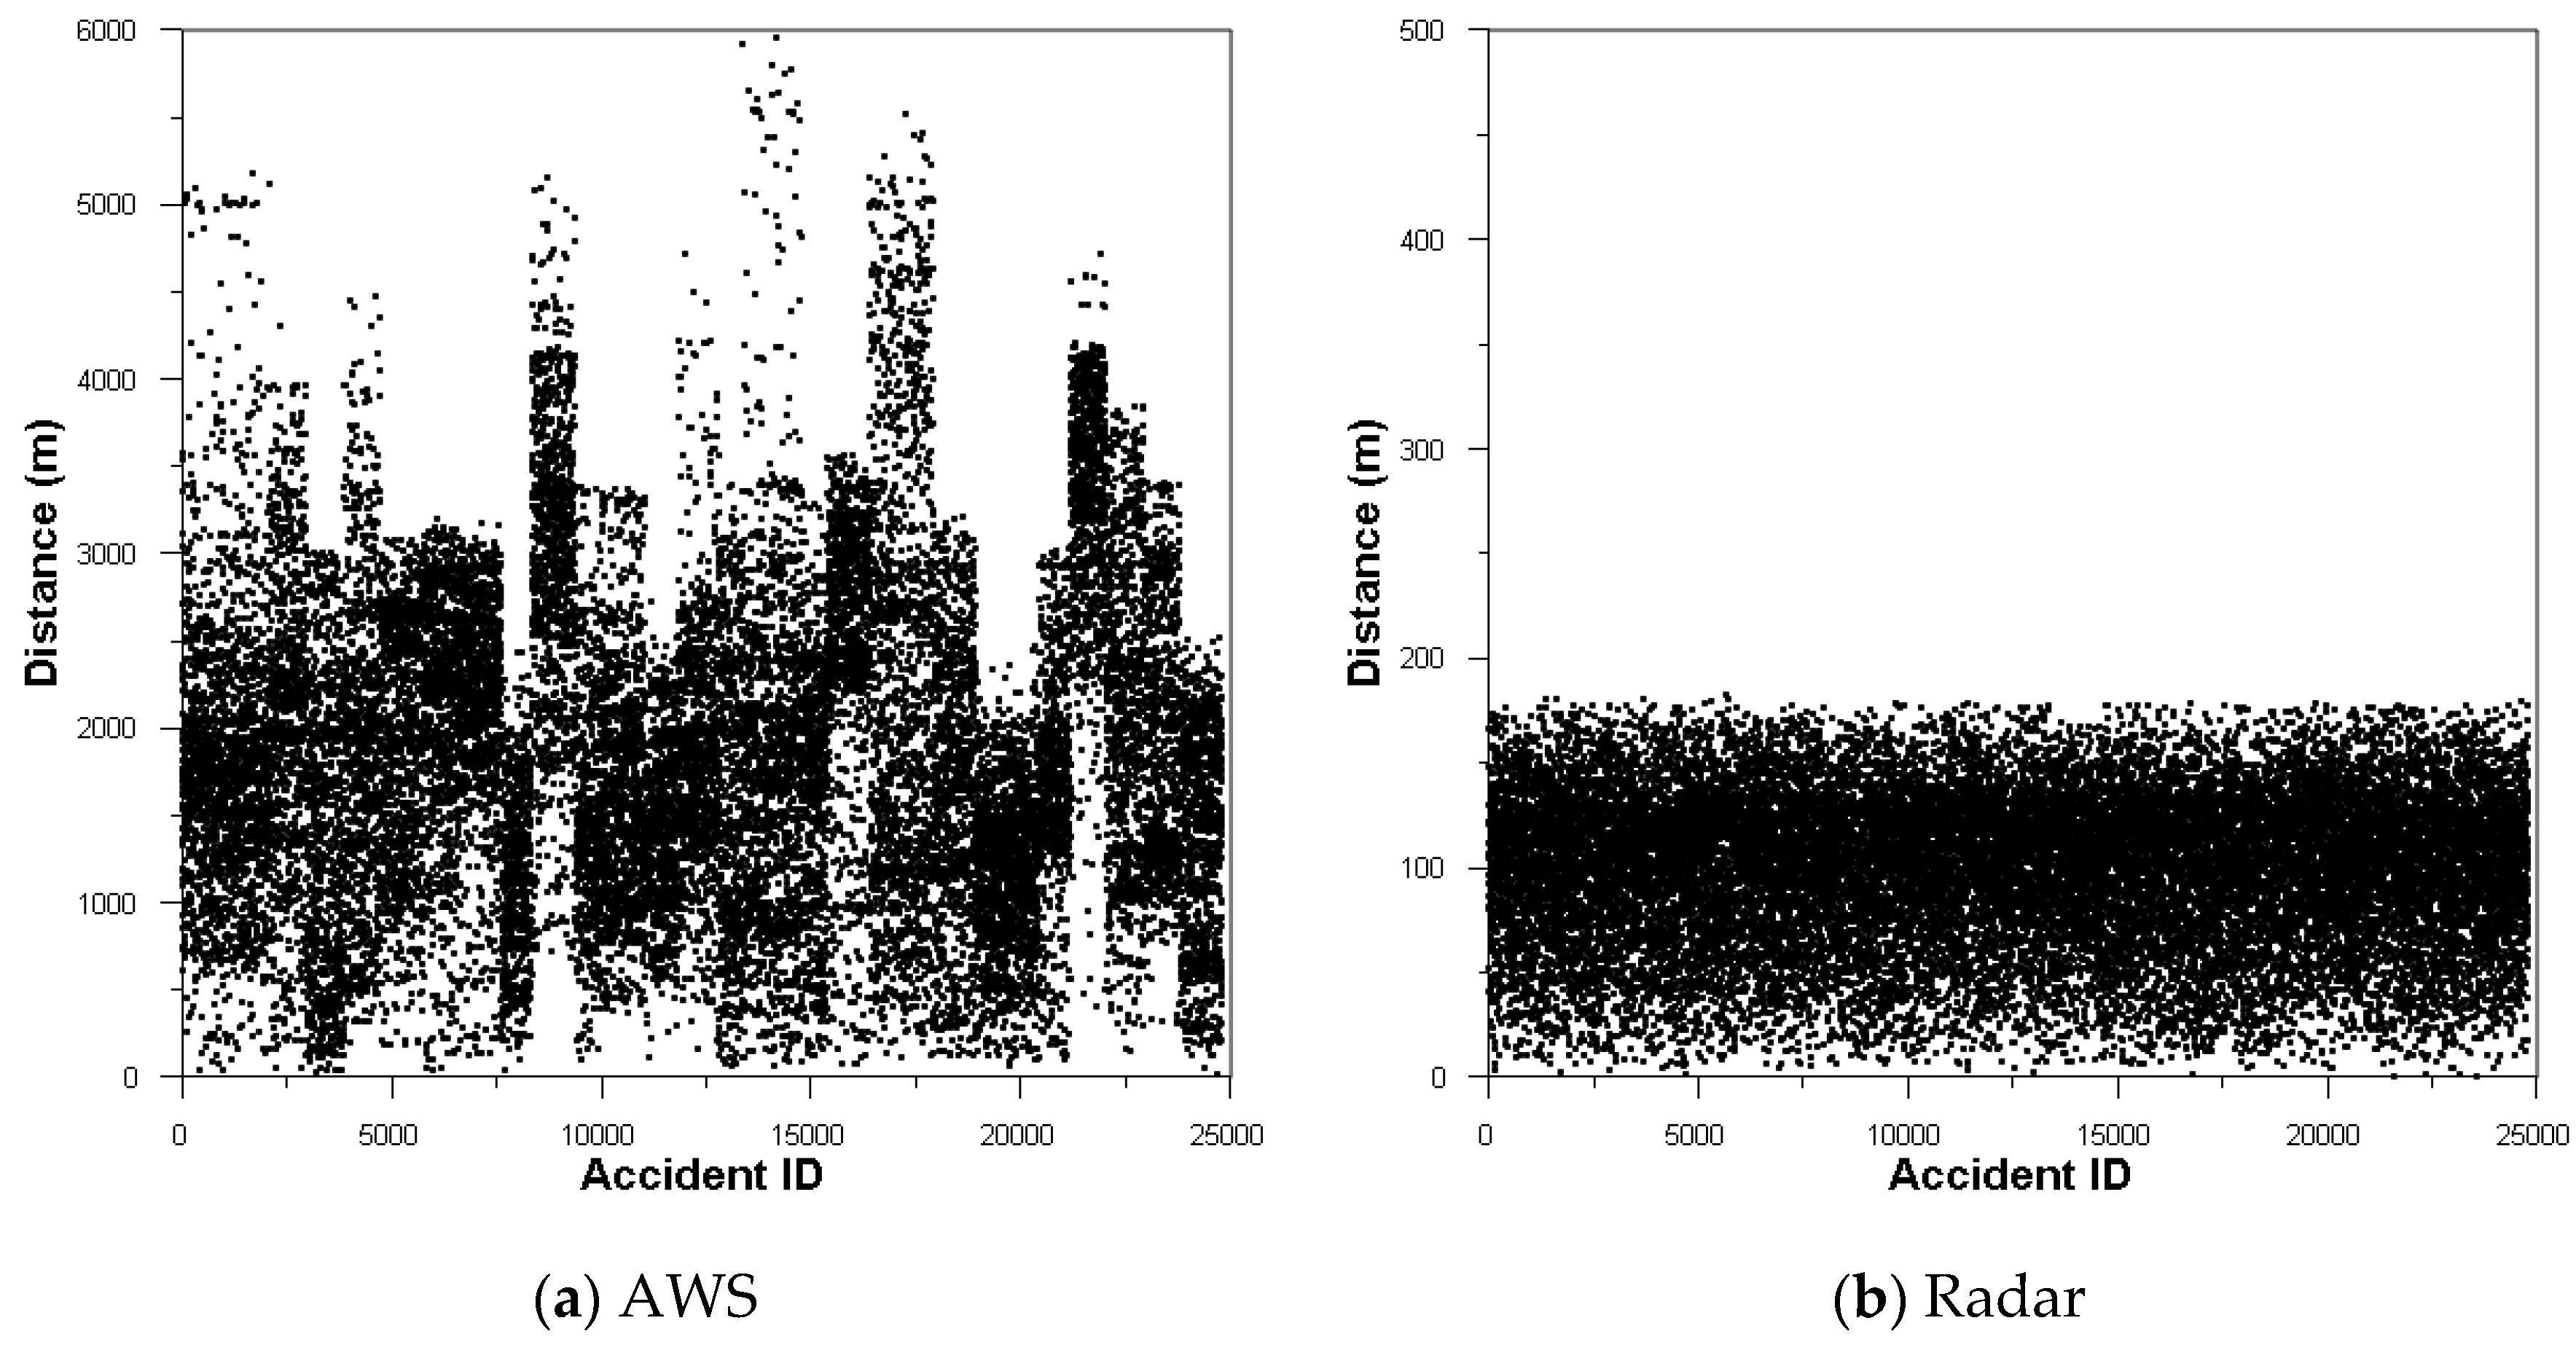
3.1. Distance between Accident Location and Nearest Rainfall Data

Based on the number of traffic accidents that occurred under rainy conditions (24,797), the distance between the traffic accident location and closest point of each rainfall data source (radar grid point and AWS) was analyzed. The results are shown in Table 1 and Figure 2. Accident location and rainfall observation points did not directly match because of spatial differences. In Figure 2, the Accident IDs were sorted according to the nearest AWS and the high-resolution radar grid point. As shown in Table 1, the minimum distance between the traffic accident point and the AWSs location is 16 m, and the maximum distance is 5956 m. On average, AWSs are 1886 m from the accident site. The minimum, maximum, and average distances to the radar grid point are 1, 183, and approximately 99 m, respectively. Clearly, the use of AWS locations to assess accident-causing rainfall phenomena is not reliable given the range of distances involved, whereas the high-resolution radar ensures that any given accident location is no more than 183 m from a rainfall data point, resulting in much higher accuracy.

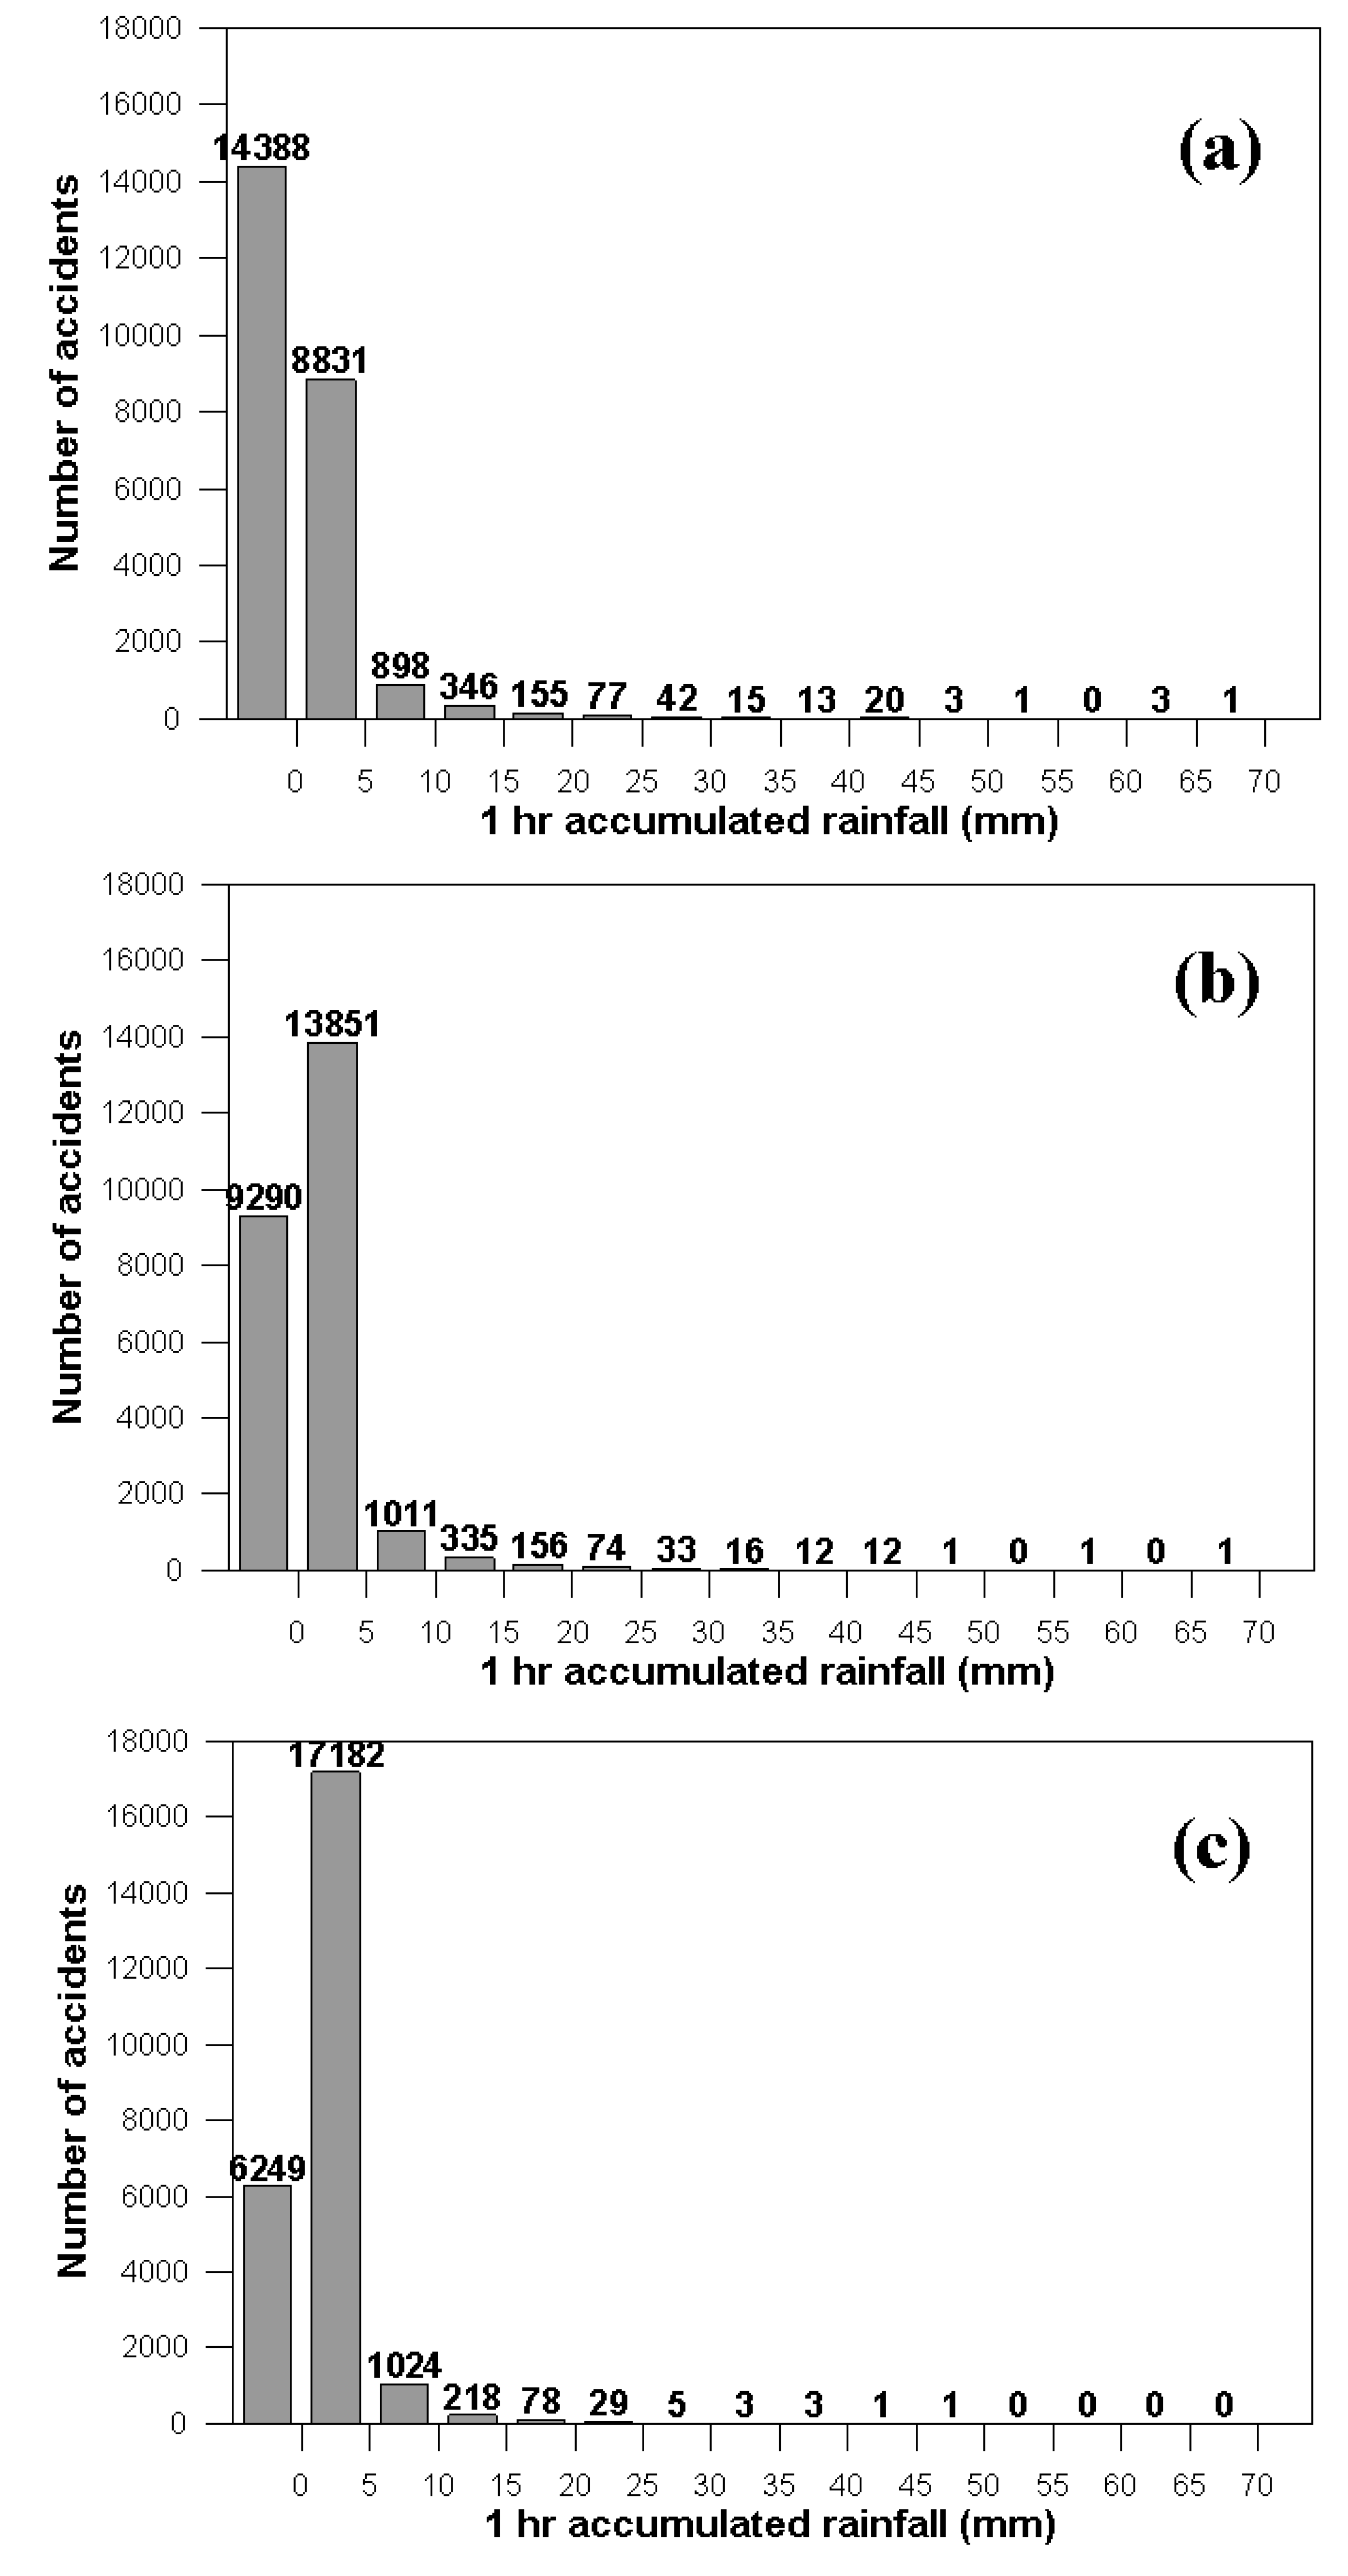
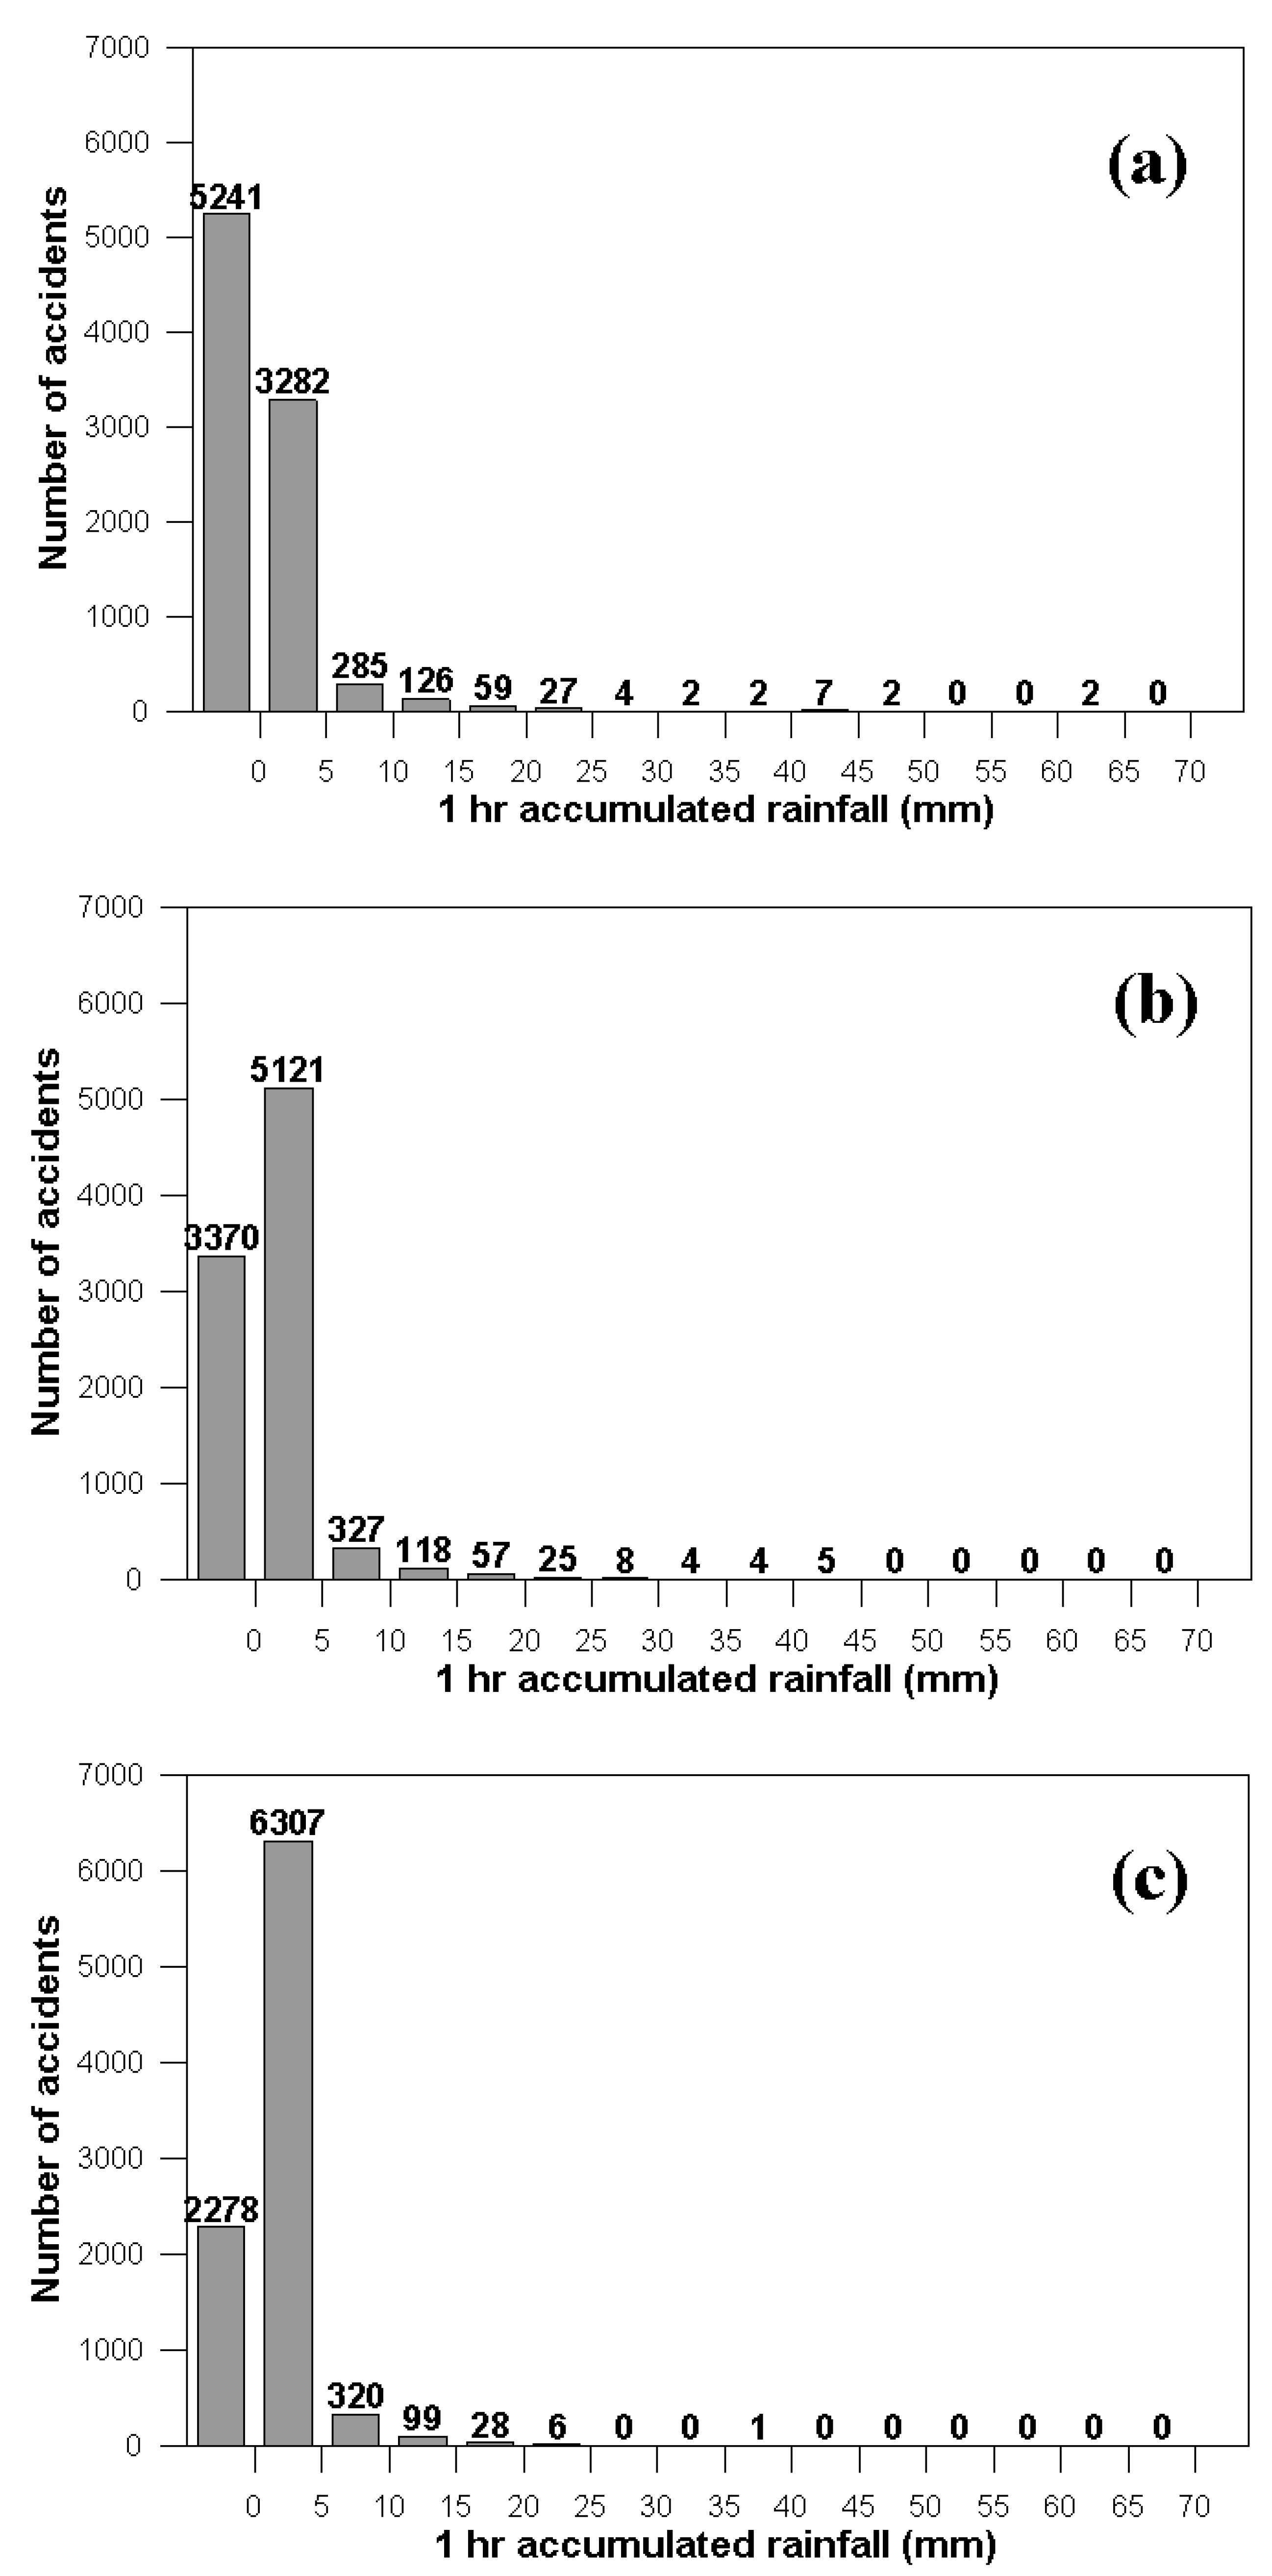
3.2. Frequency Analysis of Accident-Inducing Rainfall

It is important to determine the rainfall amount that causes the most traffic accidents to be able to respond adequately to an accident. The sources of rainfall data also determine the accident-inducing rainfall. In this study, AWSs and radar were used to obtain rainfall data at the time of traffic accidents, and the rainfall frequency of each rainfall data source was checked.
Figure 3 shows a significant number of incidents with zero measured rainfall in all rainfall data sources, unlike the data recorded as rain conditions in the police reports. These data are based on the judgment of the police officer handling the accident at the accident location at that time, which might differ from the actual observed data of different data sources. The 14,388 cases among 24,797 traffic accidents (58%) under rainfall conditions according to the police accident report corresponded to no-rain conditions in the data of the AWS nearest to the accident location. In the case of the interpolated rainfall data from the distributed AWSs, the 9290 accident cases were also considered to cause traffic accidents in no-rain conditions (Figure 3b). The radar rainfall data for 6249 cases of traffic accidents represented the no-rain condition, which was lower than the cases of AWS observations. Most traffic accidents under rainfall occurred at rainfall of 0.1–5 mm per hour, with the exception of when the rainfall was observed as zero. The number of accidents is more strongly related to the range of rainfall frequency, that is, higher frequent rainfall ranges contained a larger number of accidents. Figure 4 shows the same frequency analysis of accident-induced rainfall with only fatal and severe accidents of 9039 cases among 14,388 accidents; however, similar results were presented for all rainfall data sources. The results indicated no differences in accident-inducing rainfall amounts based on the type of rainfall data; however, a high possibility of the rainfall conditions on the road being mismatched according to the type of rainfall data was confirmed. Therefore, as presented in the next sections, the difference between the spatial distribution of rainfall and accidents according to the types of rainfall data must be examined qualitatively based on the specific rainfall event and confirmed by quantitative indicators such as RAR.

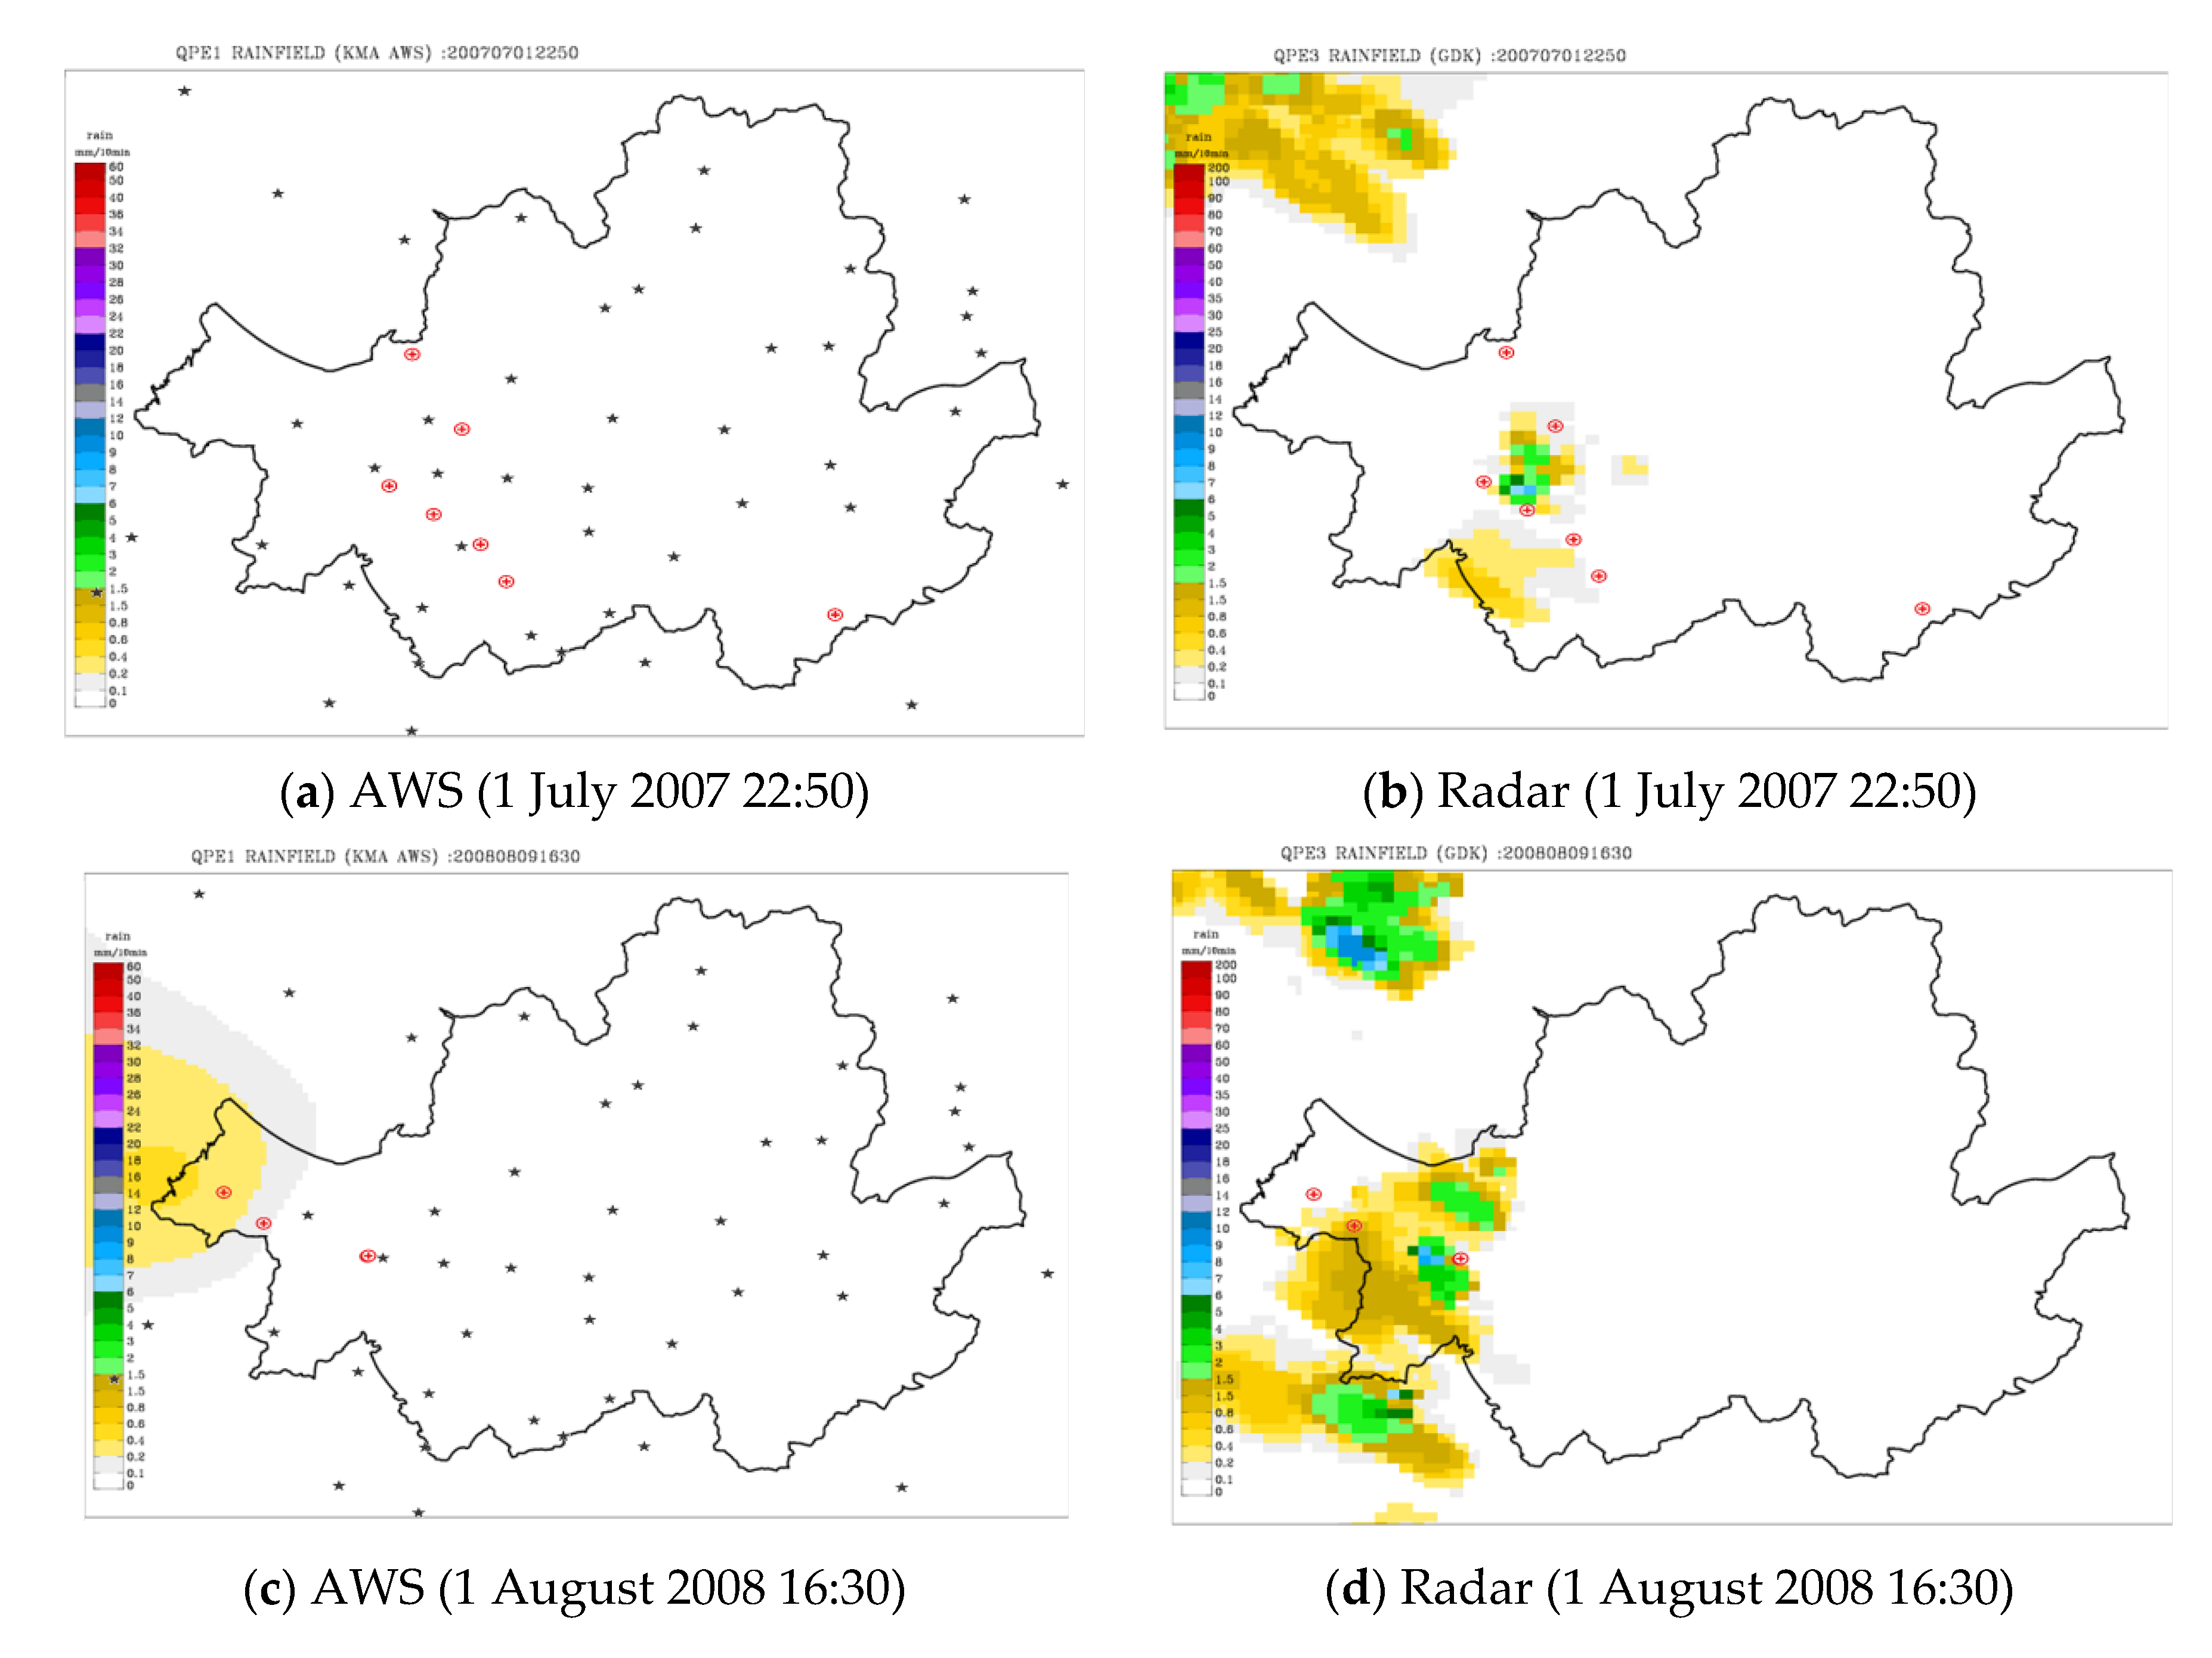
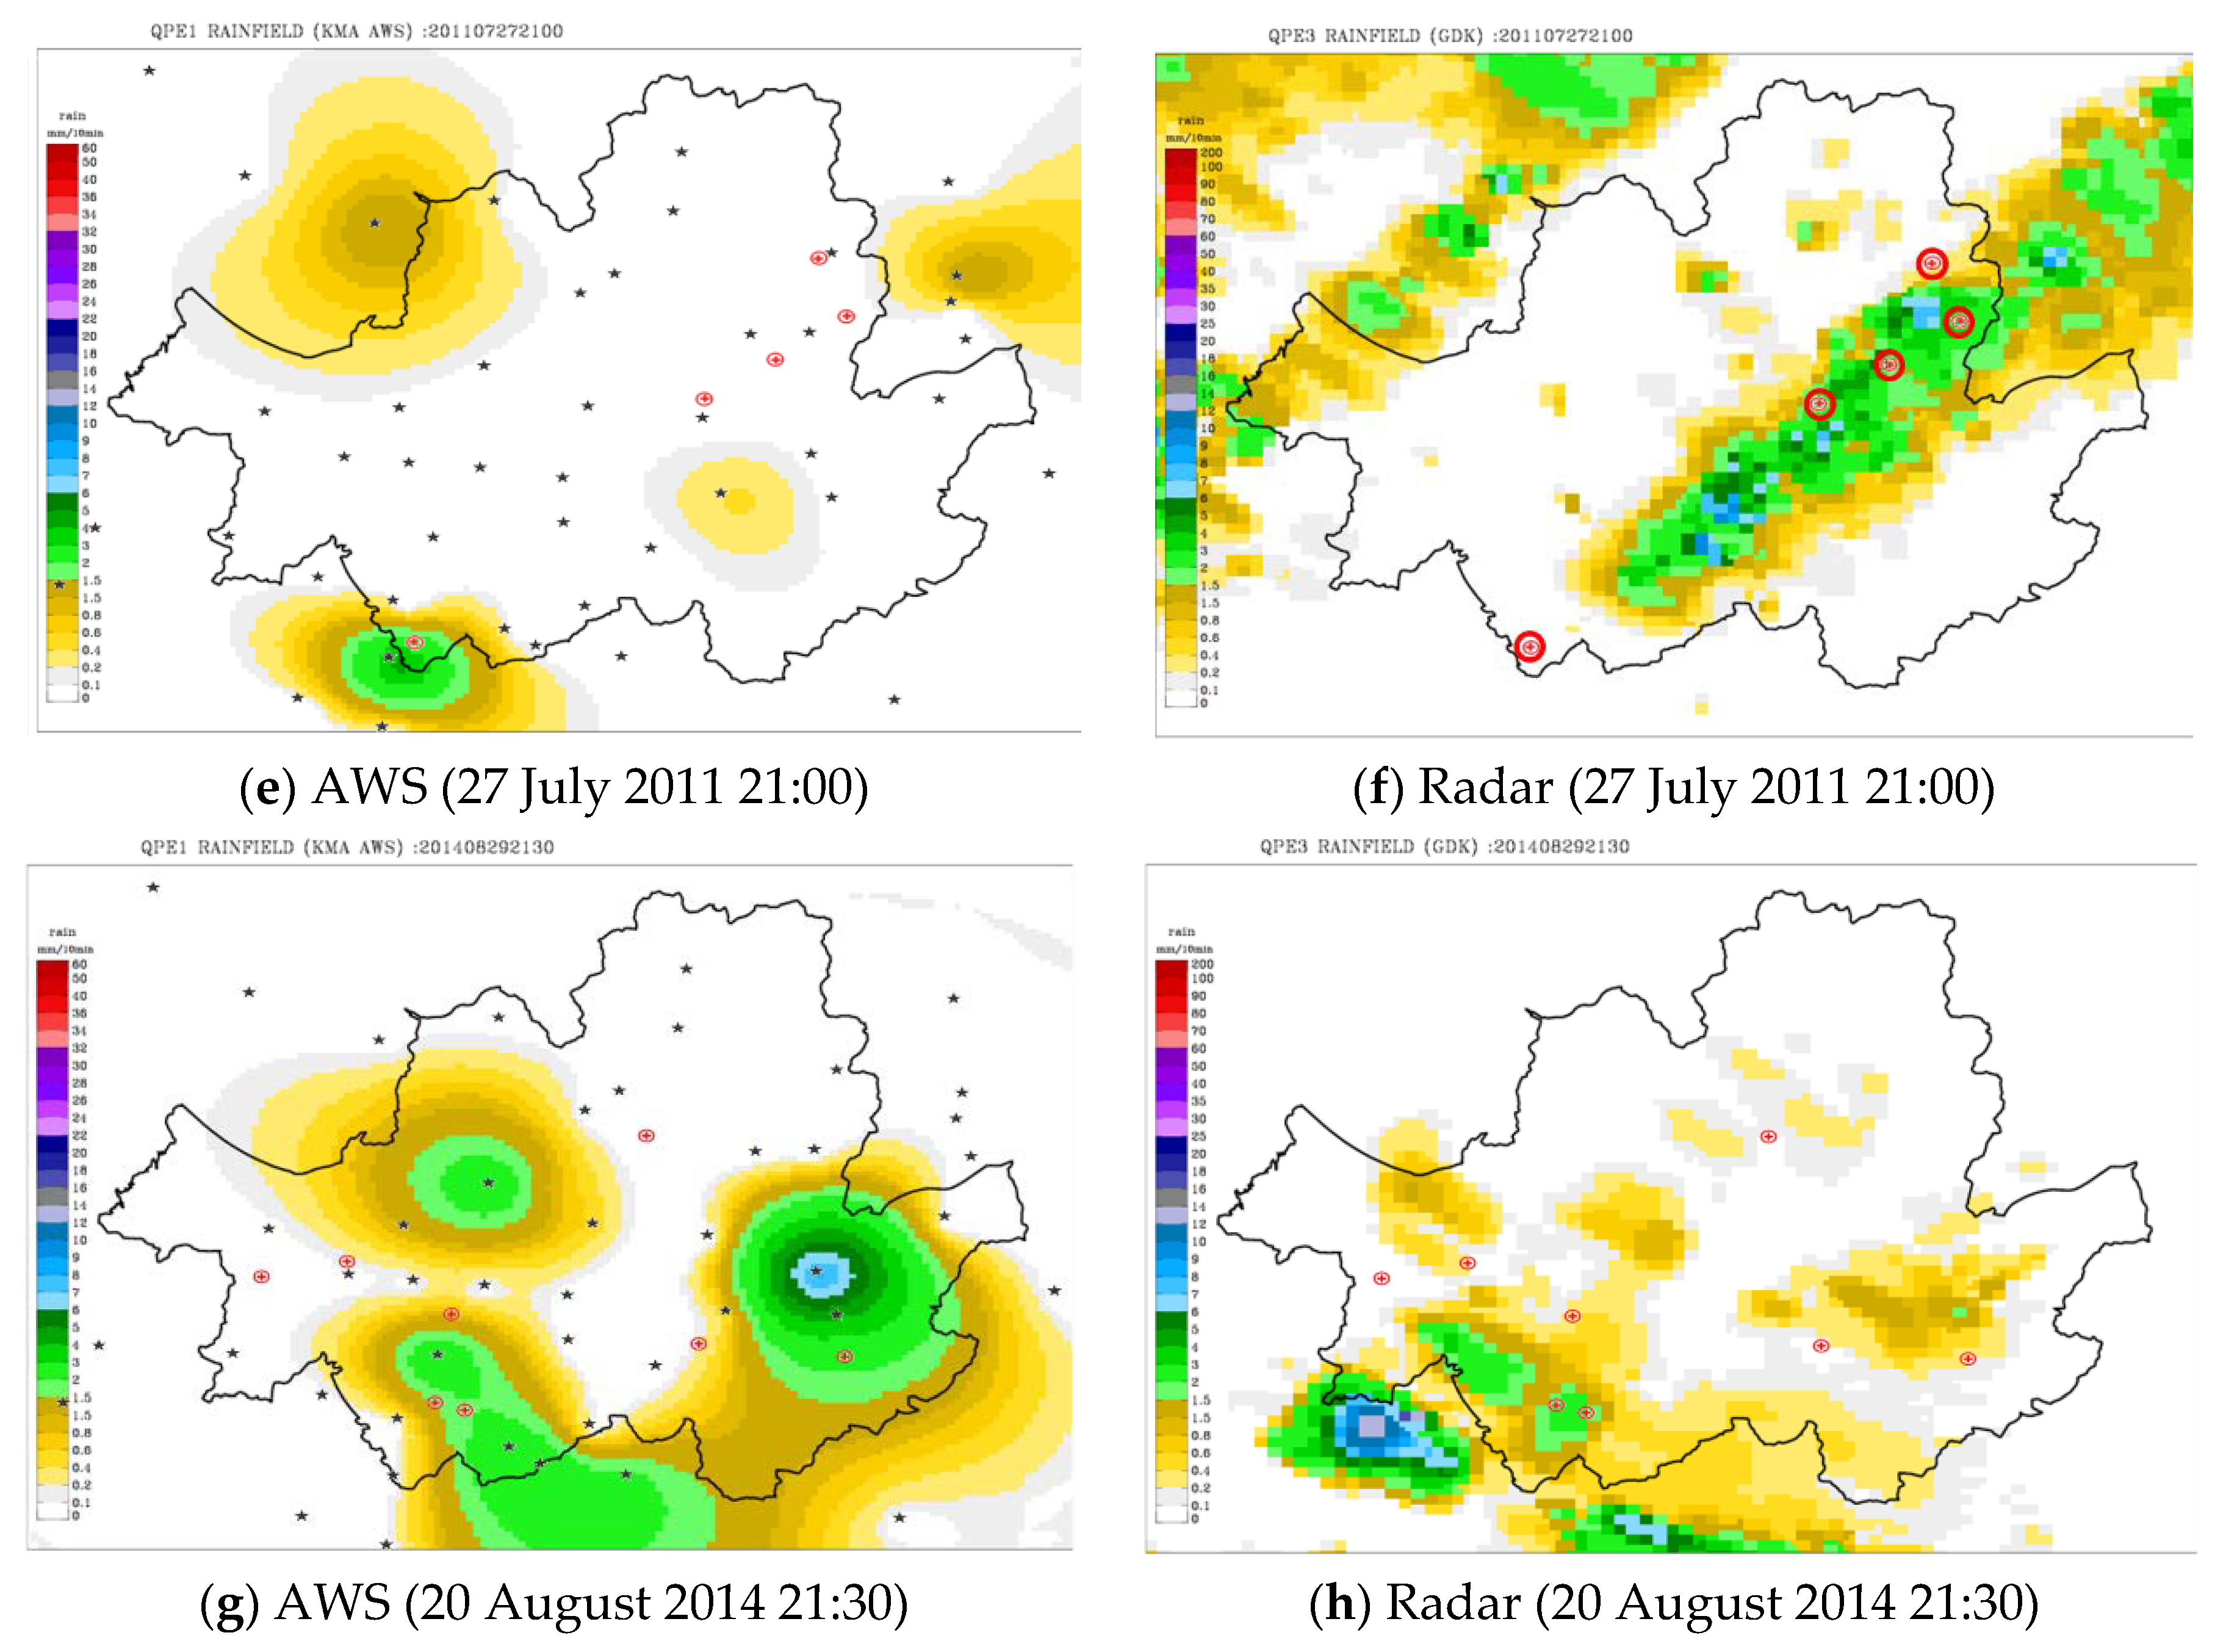
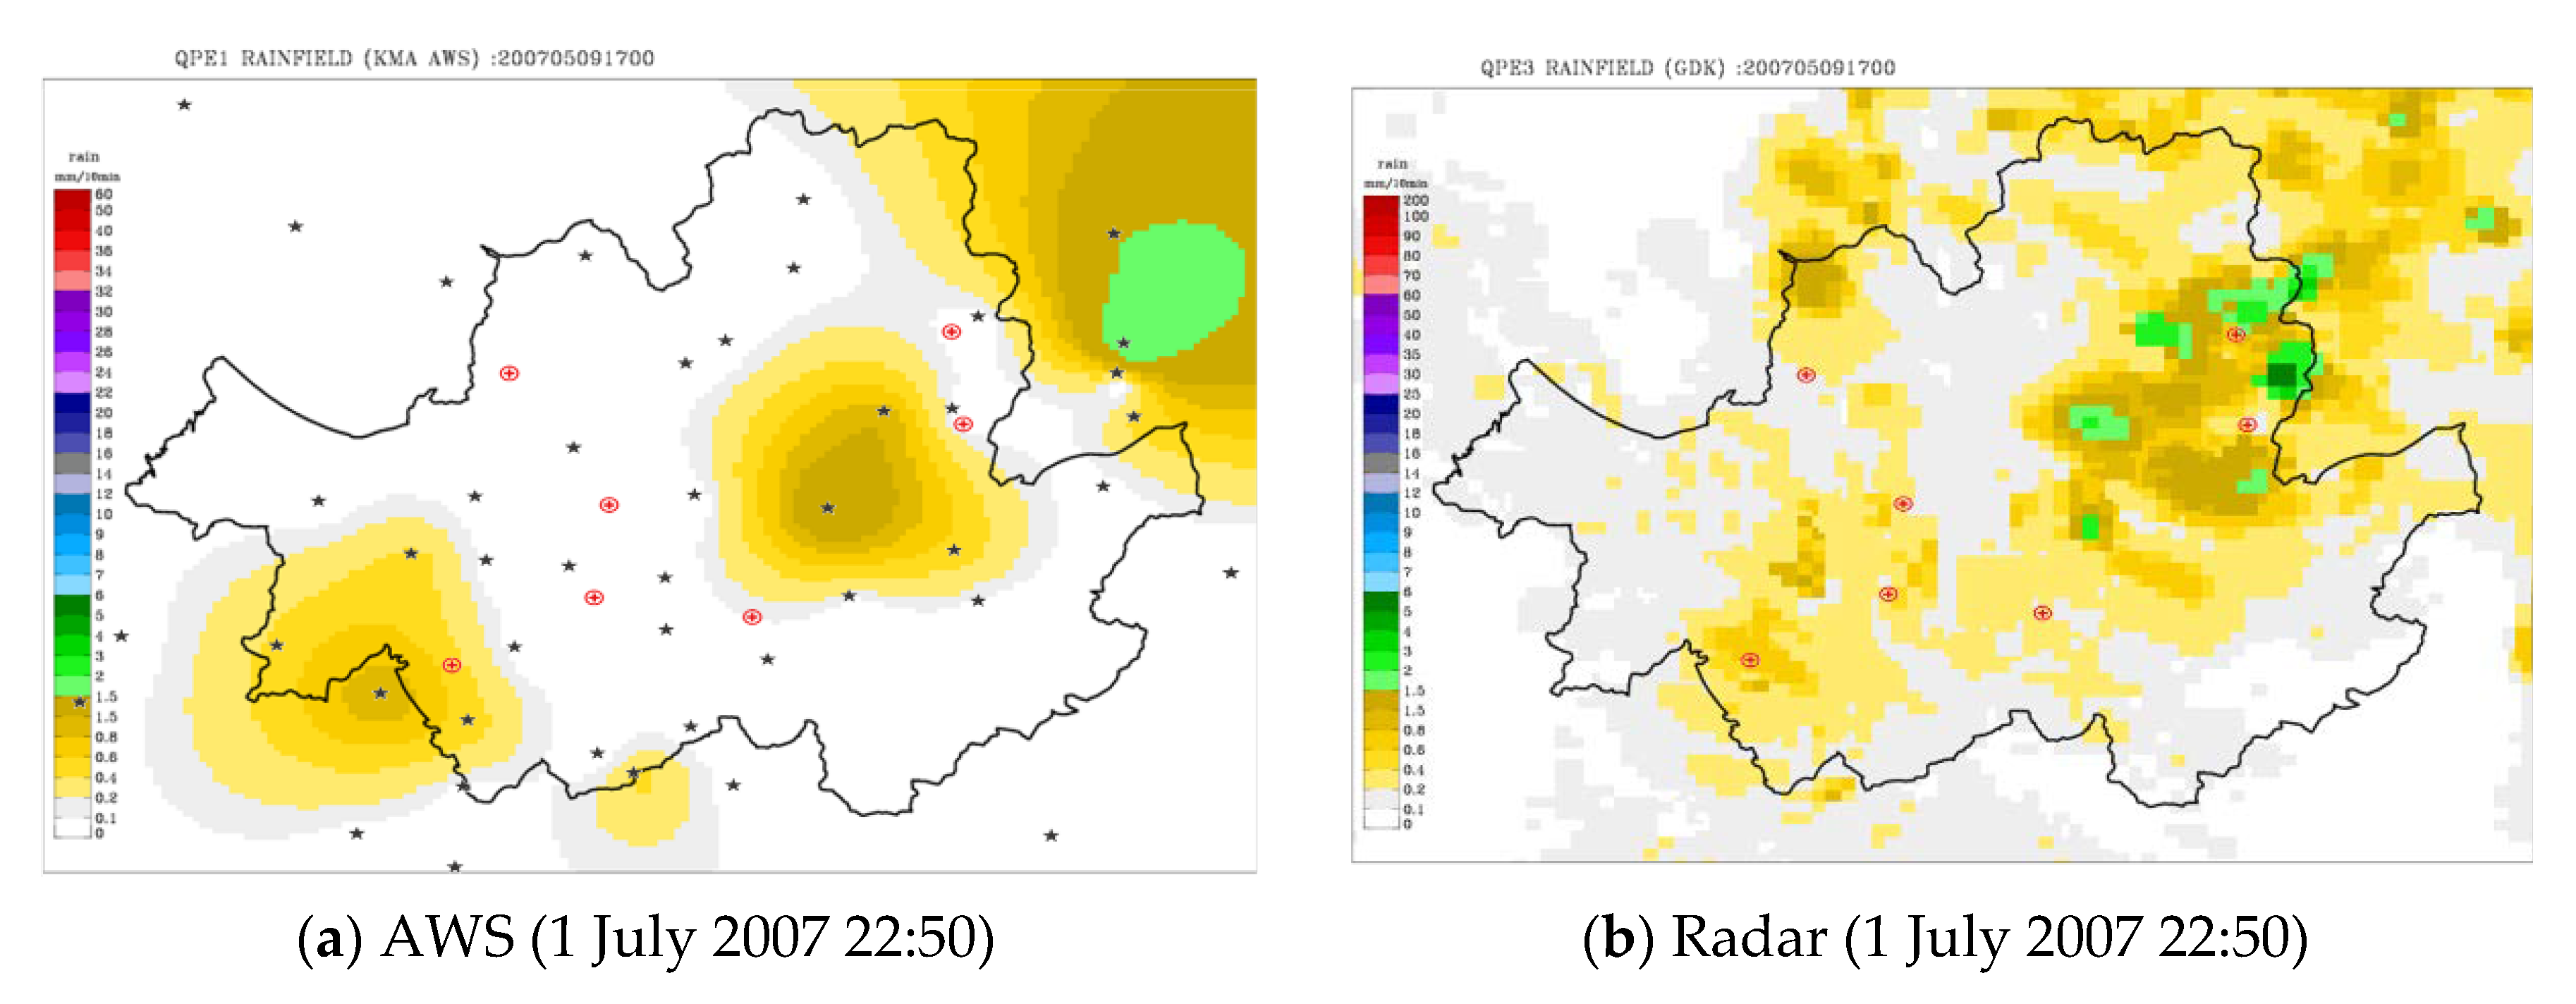
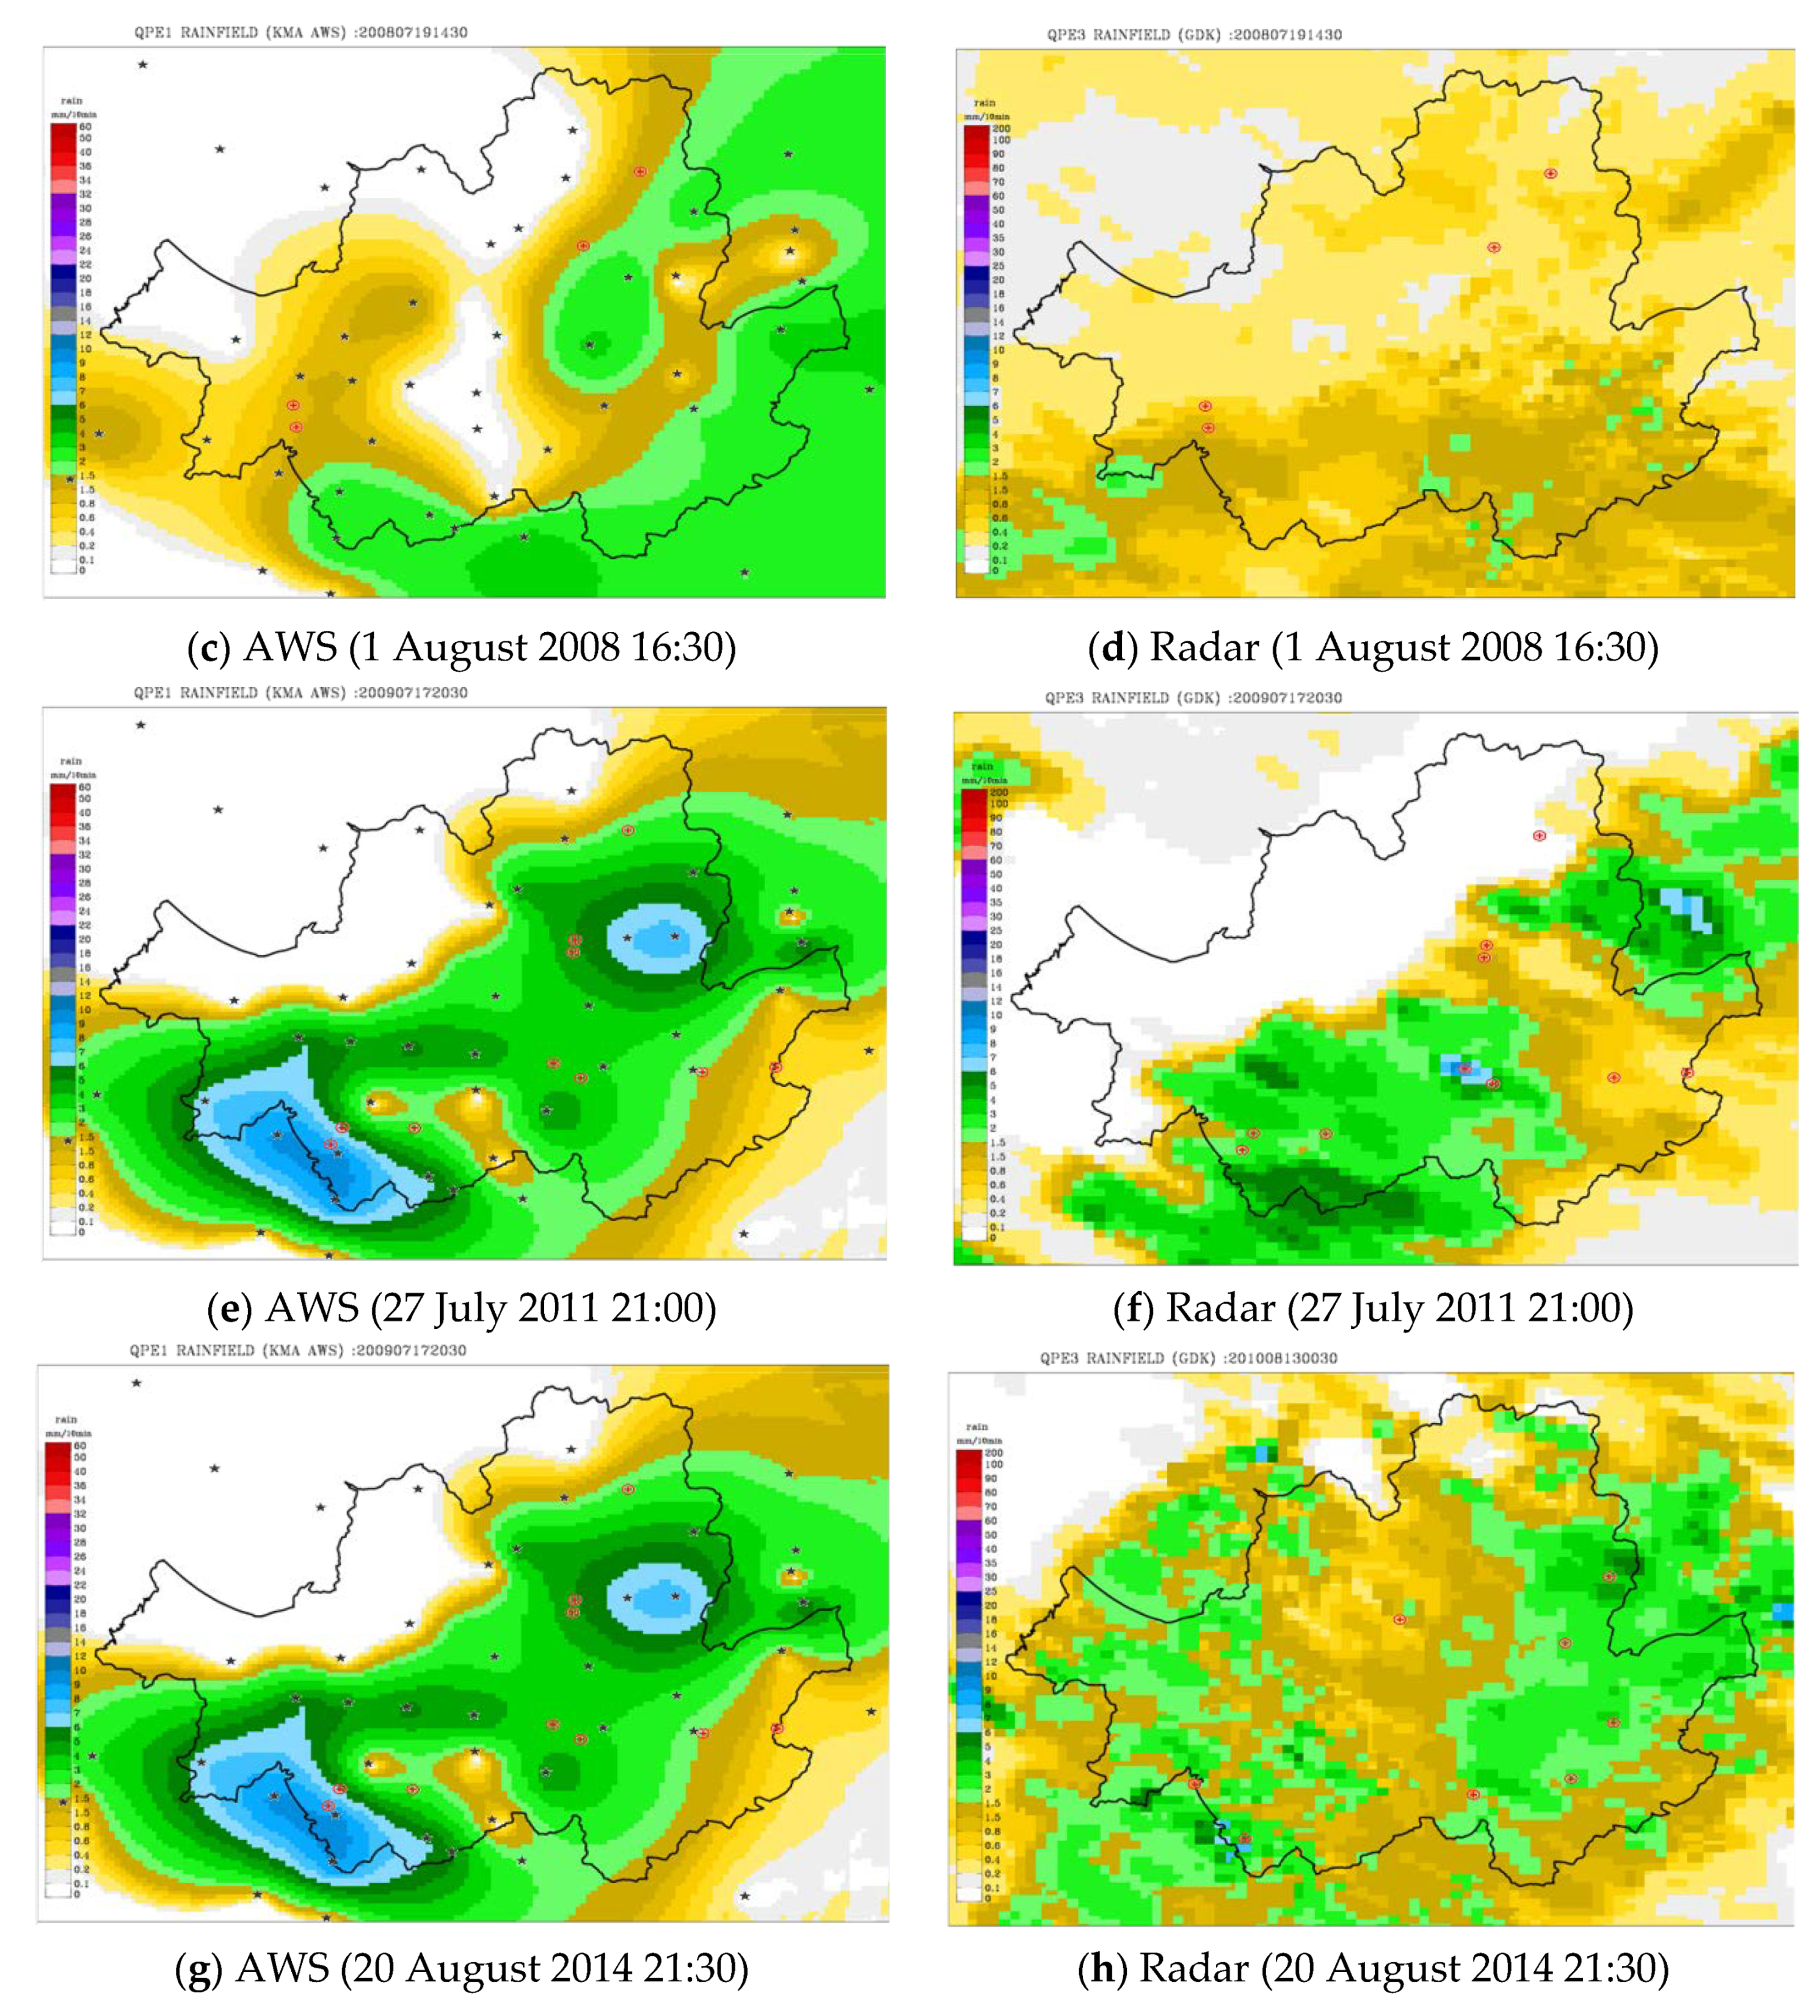
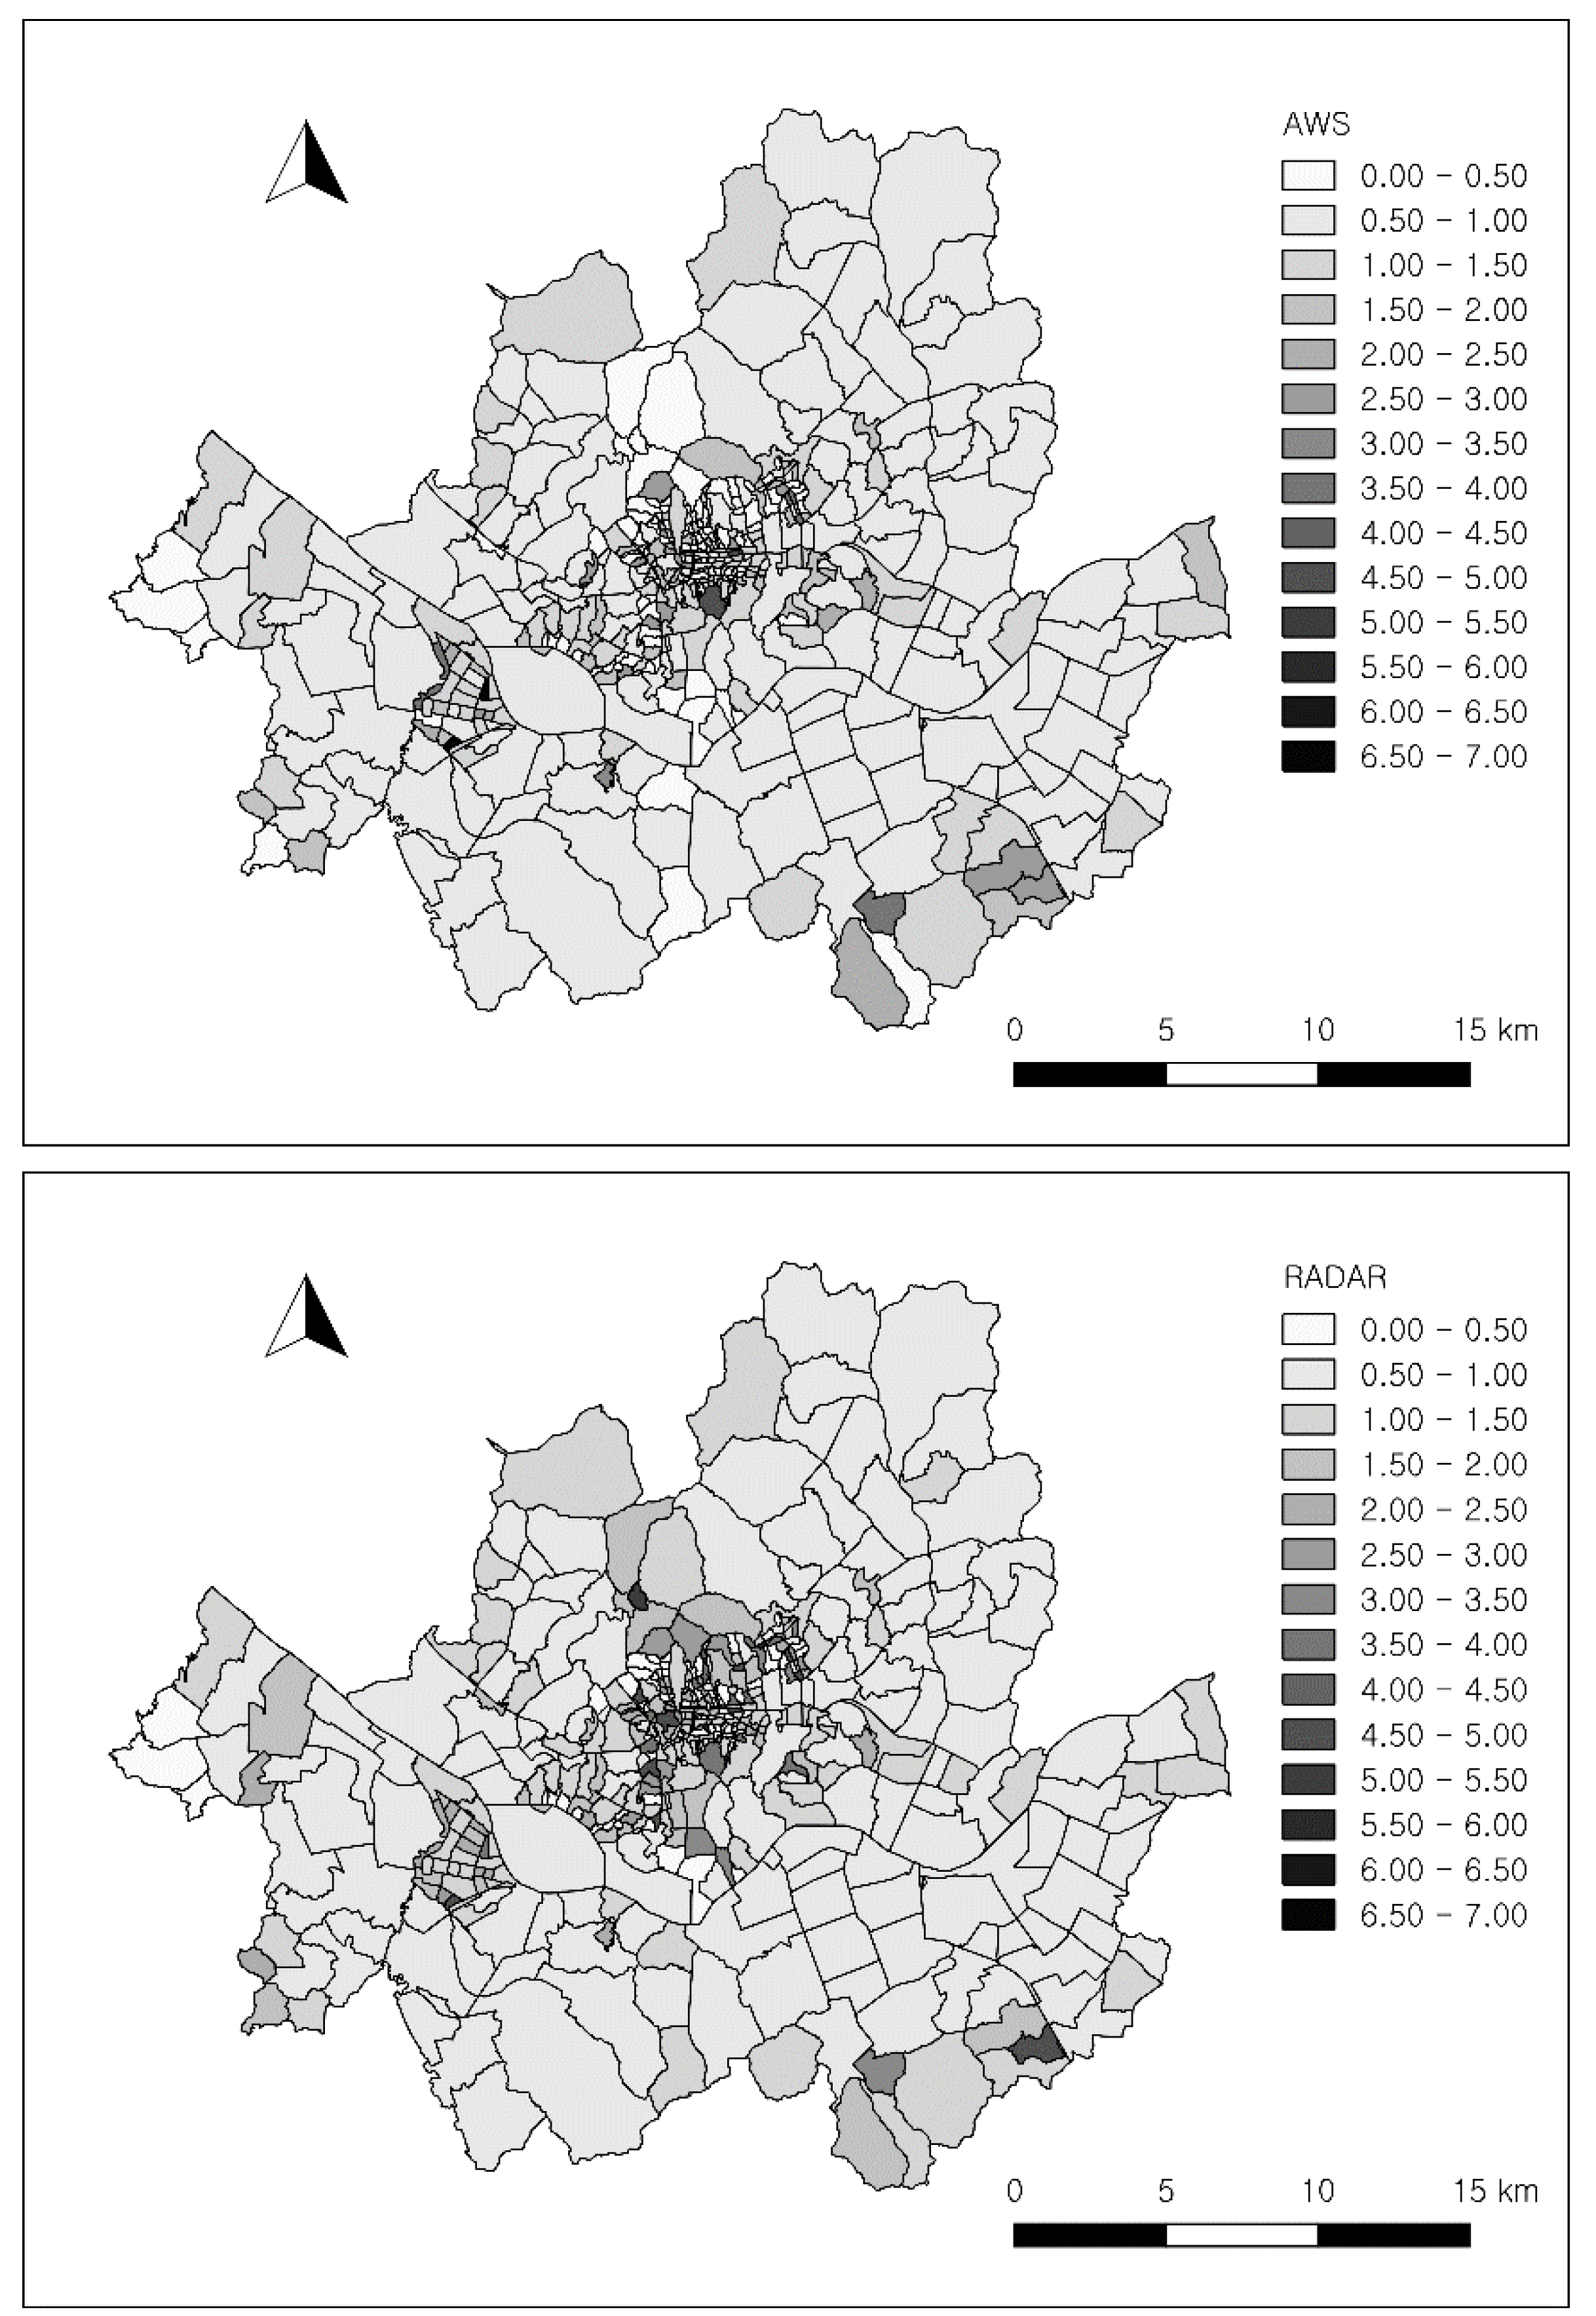
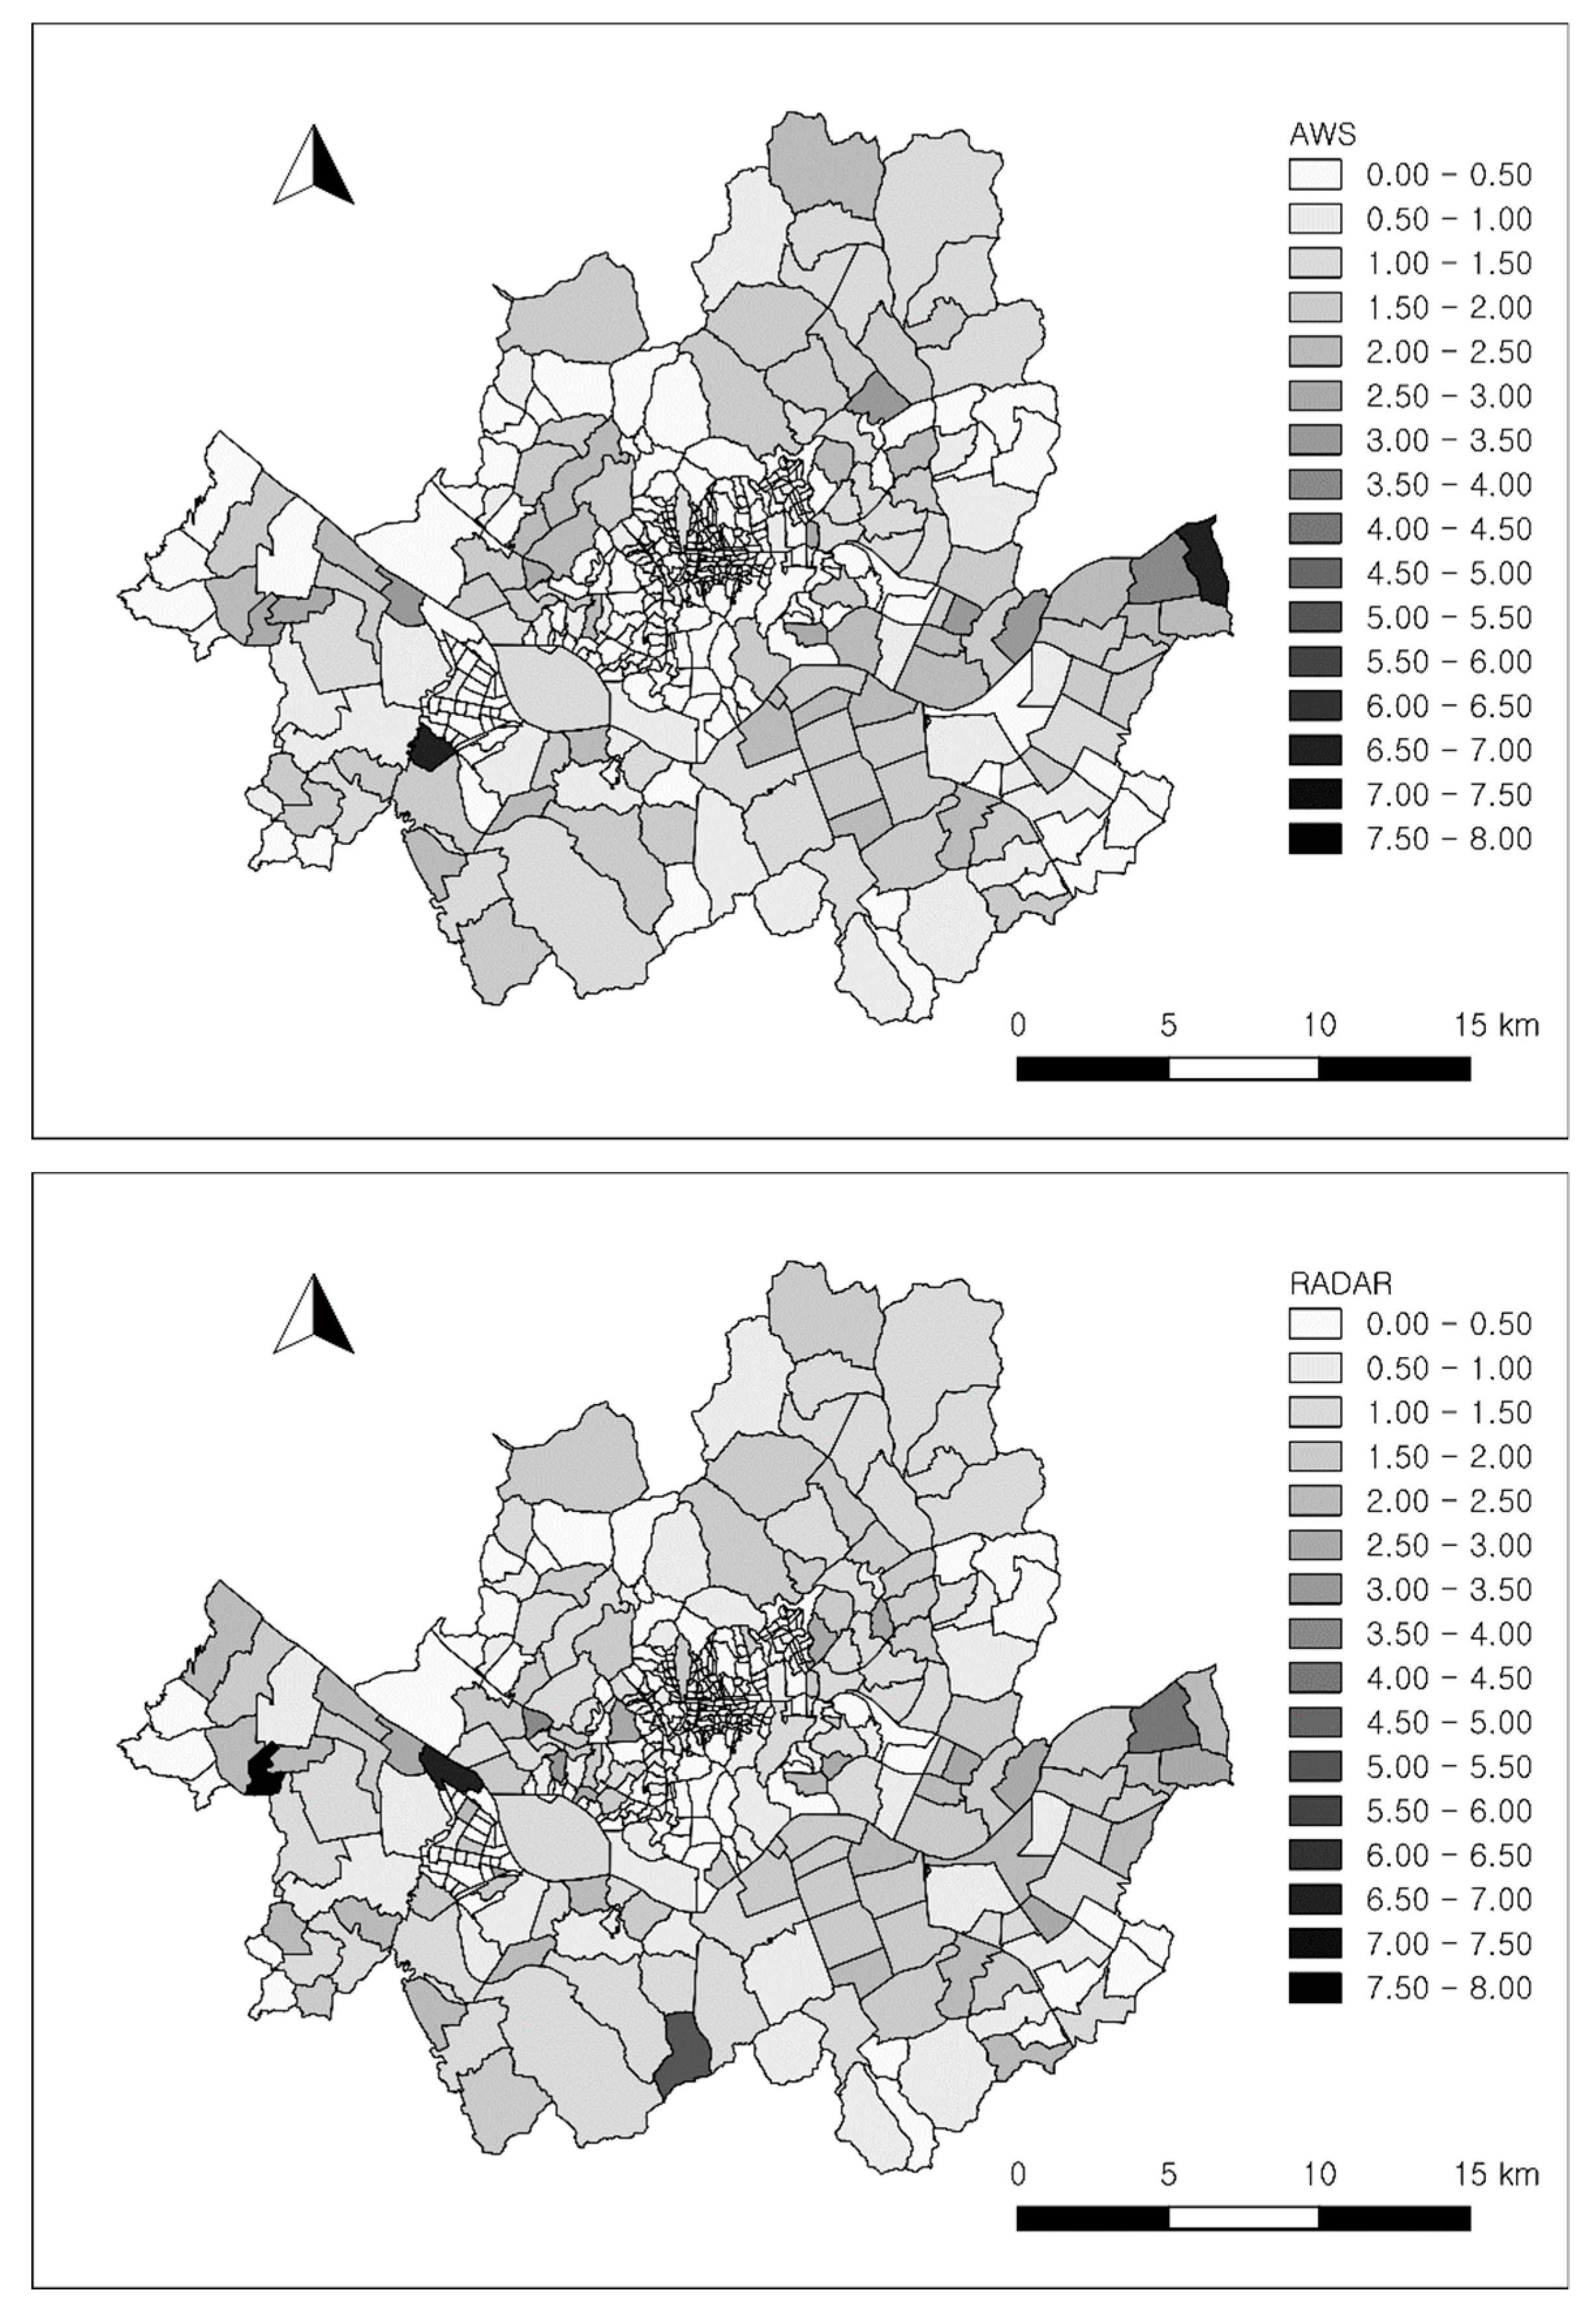
3.3. Spatial Distribution of Rainfall and Accident Locations
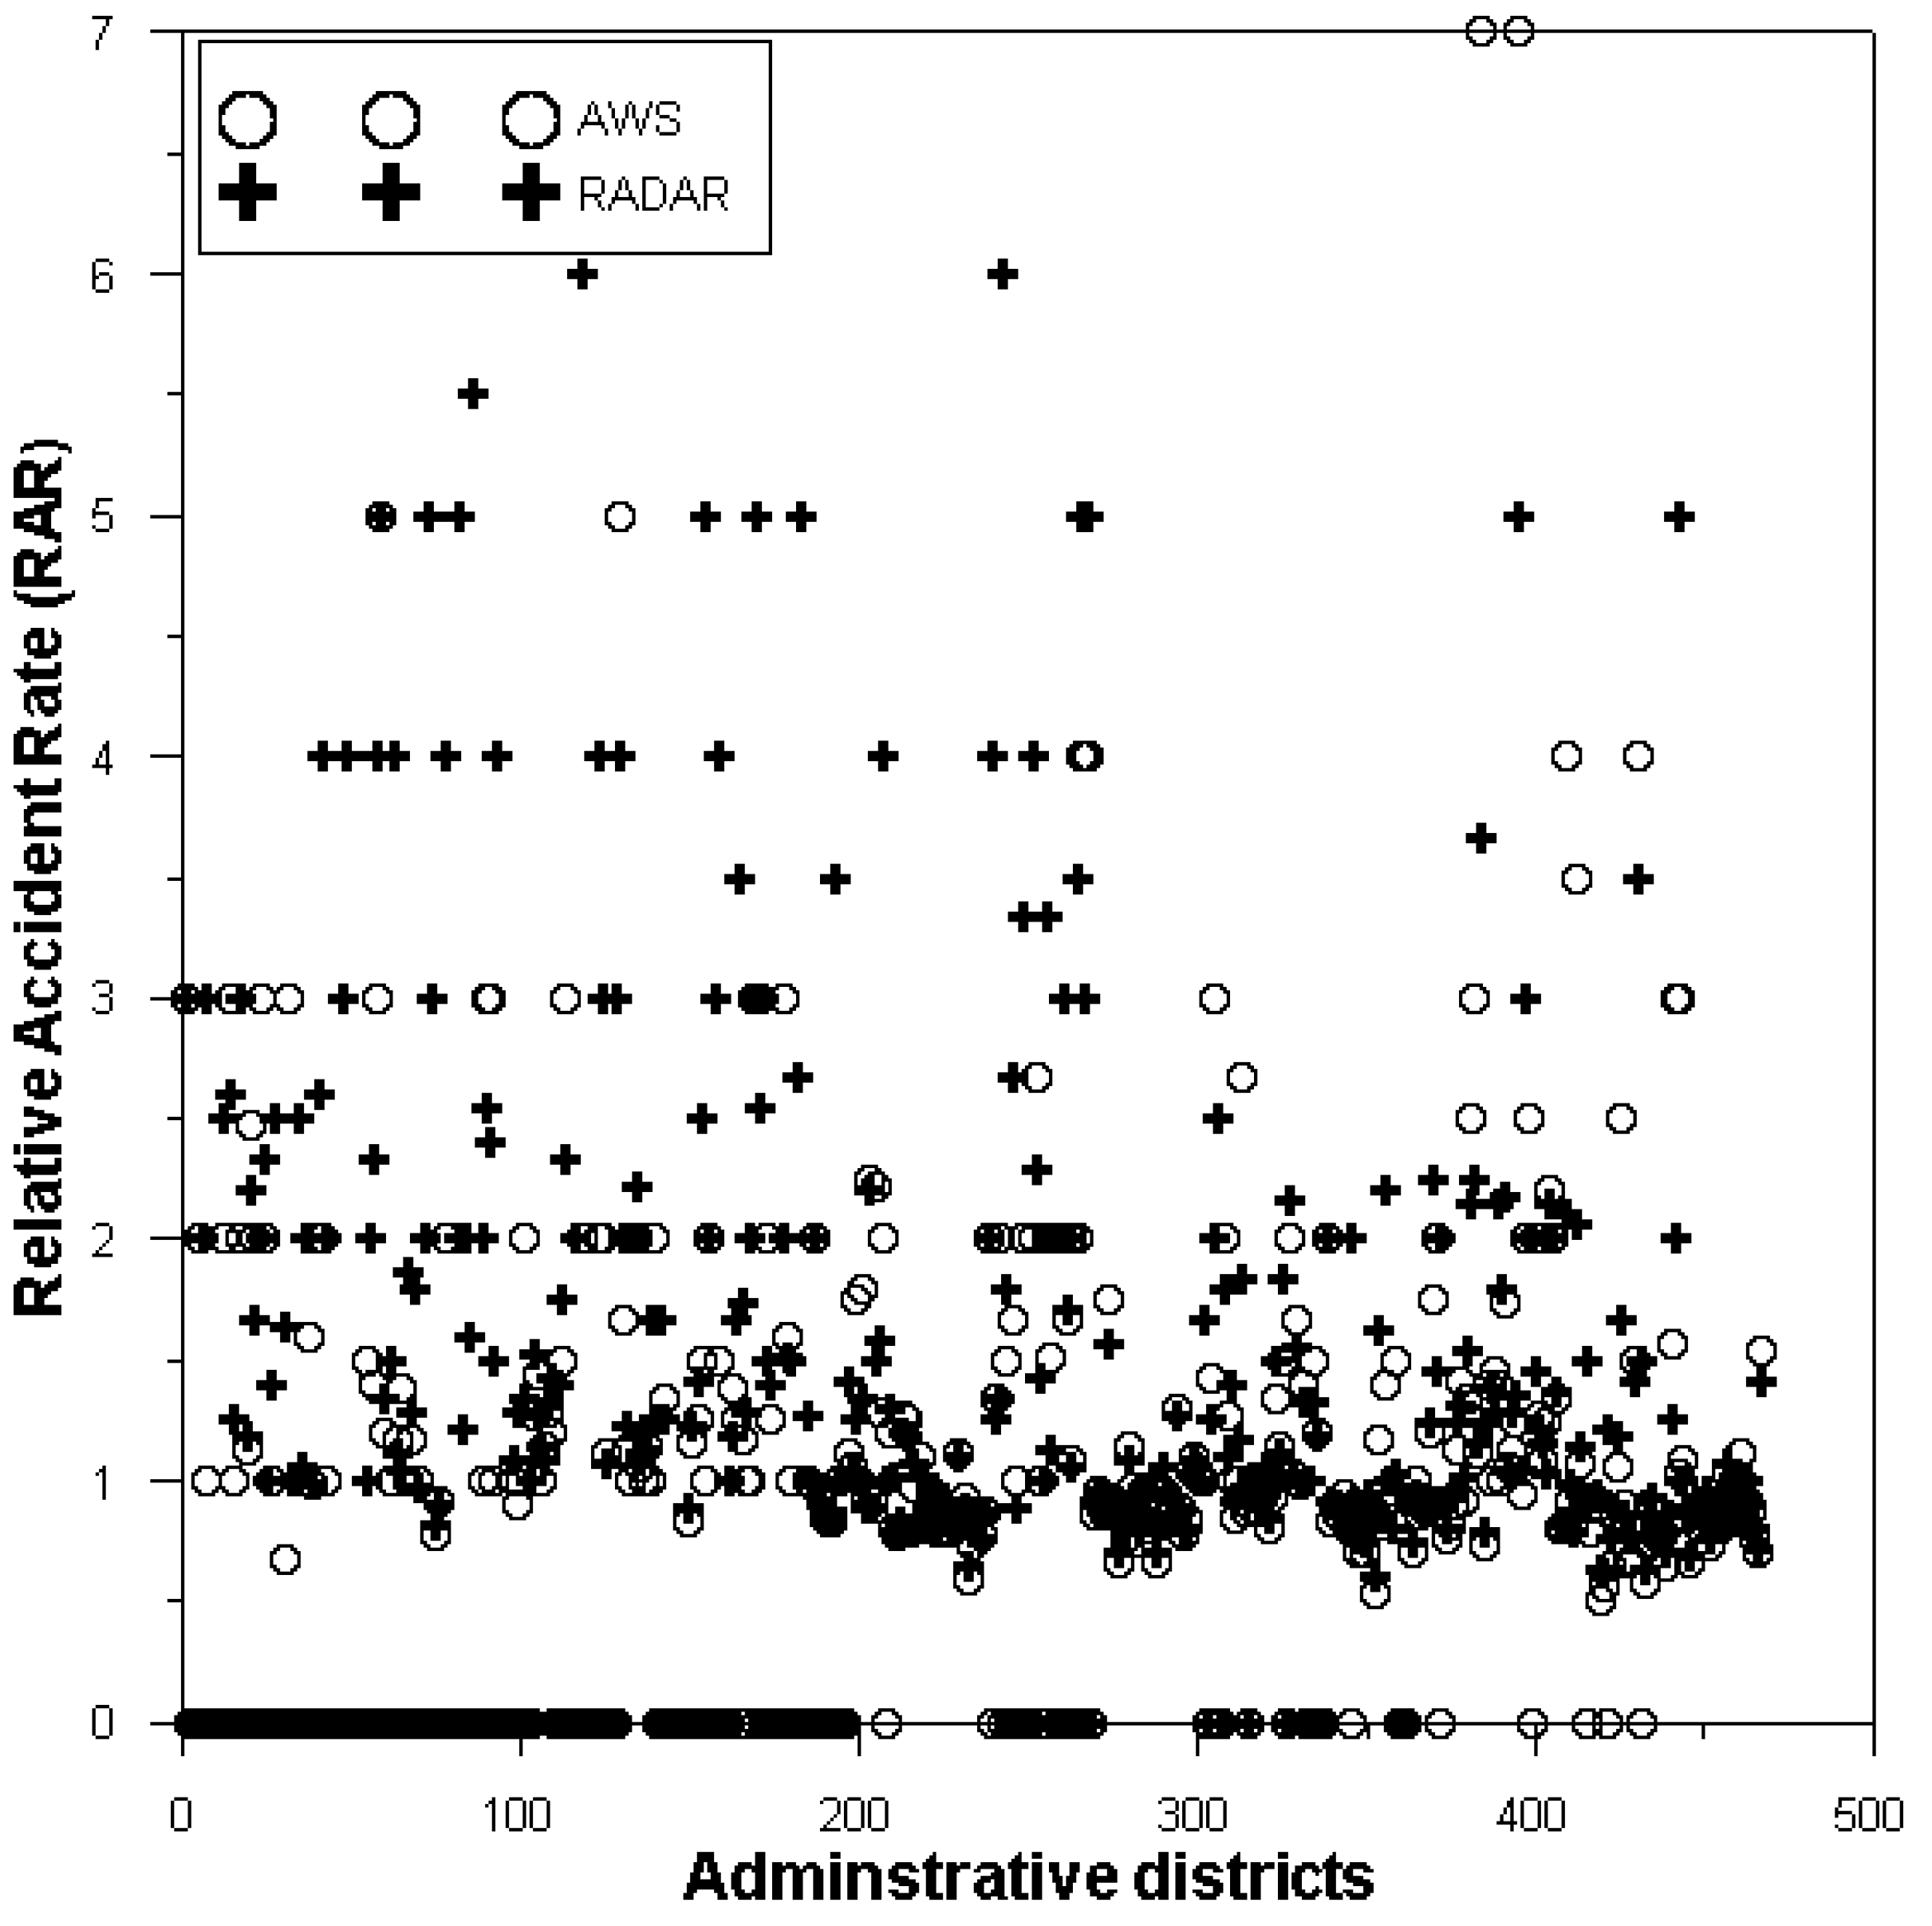
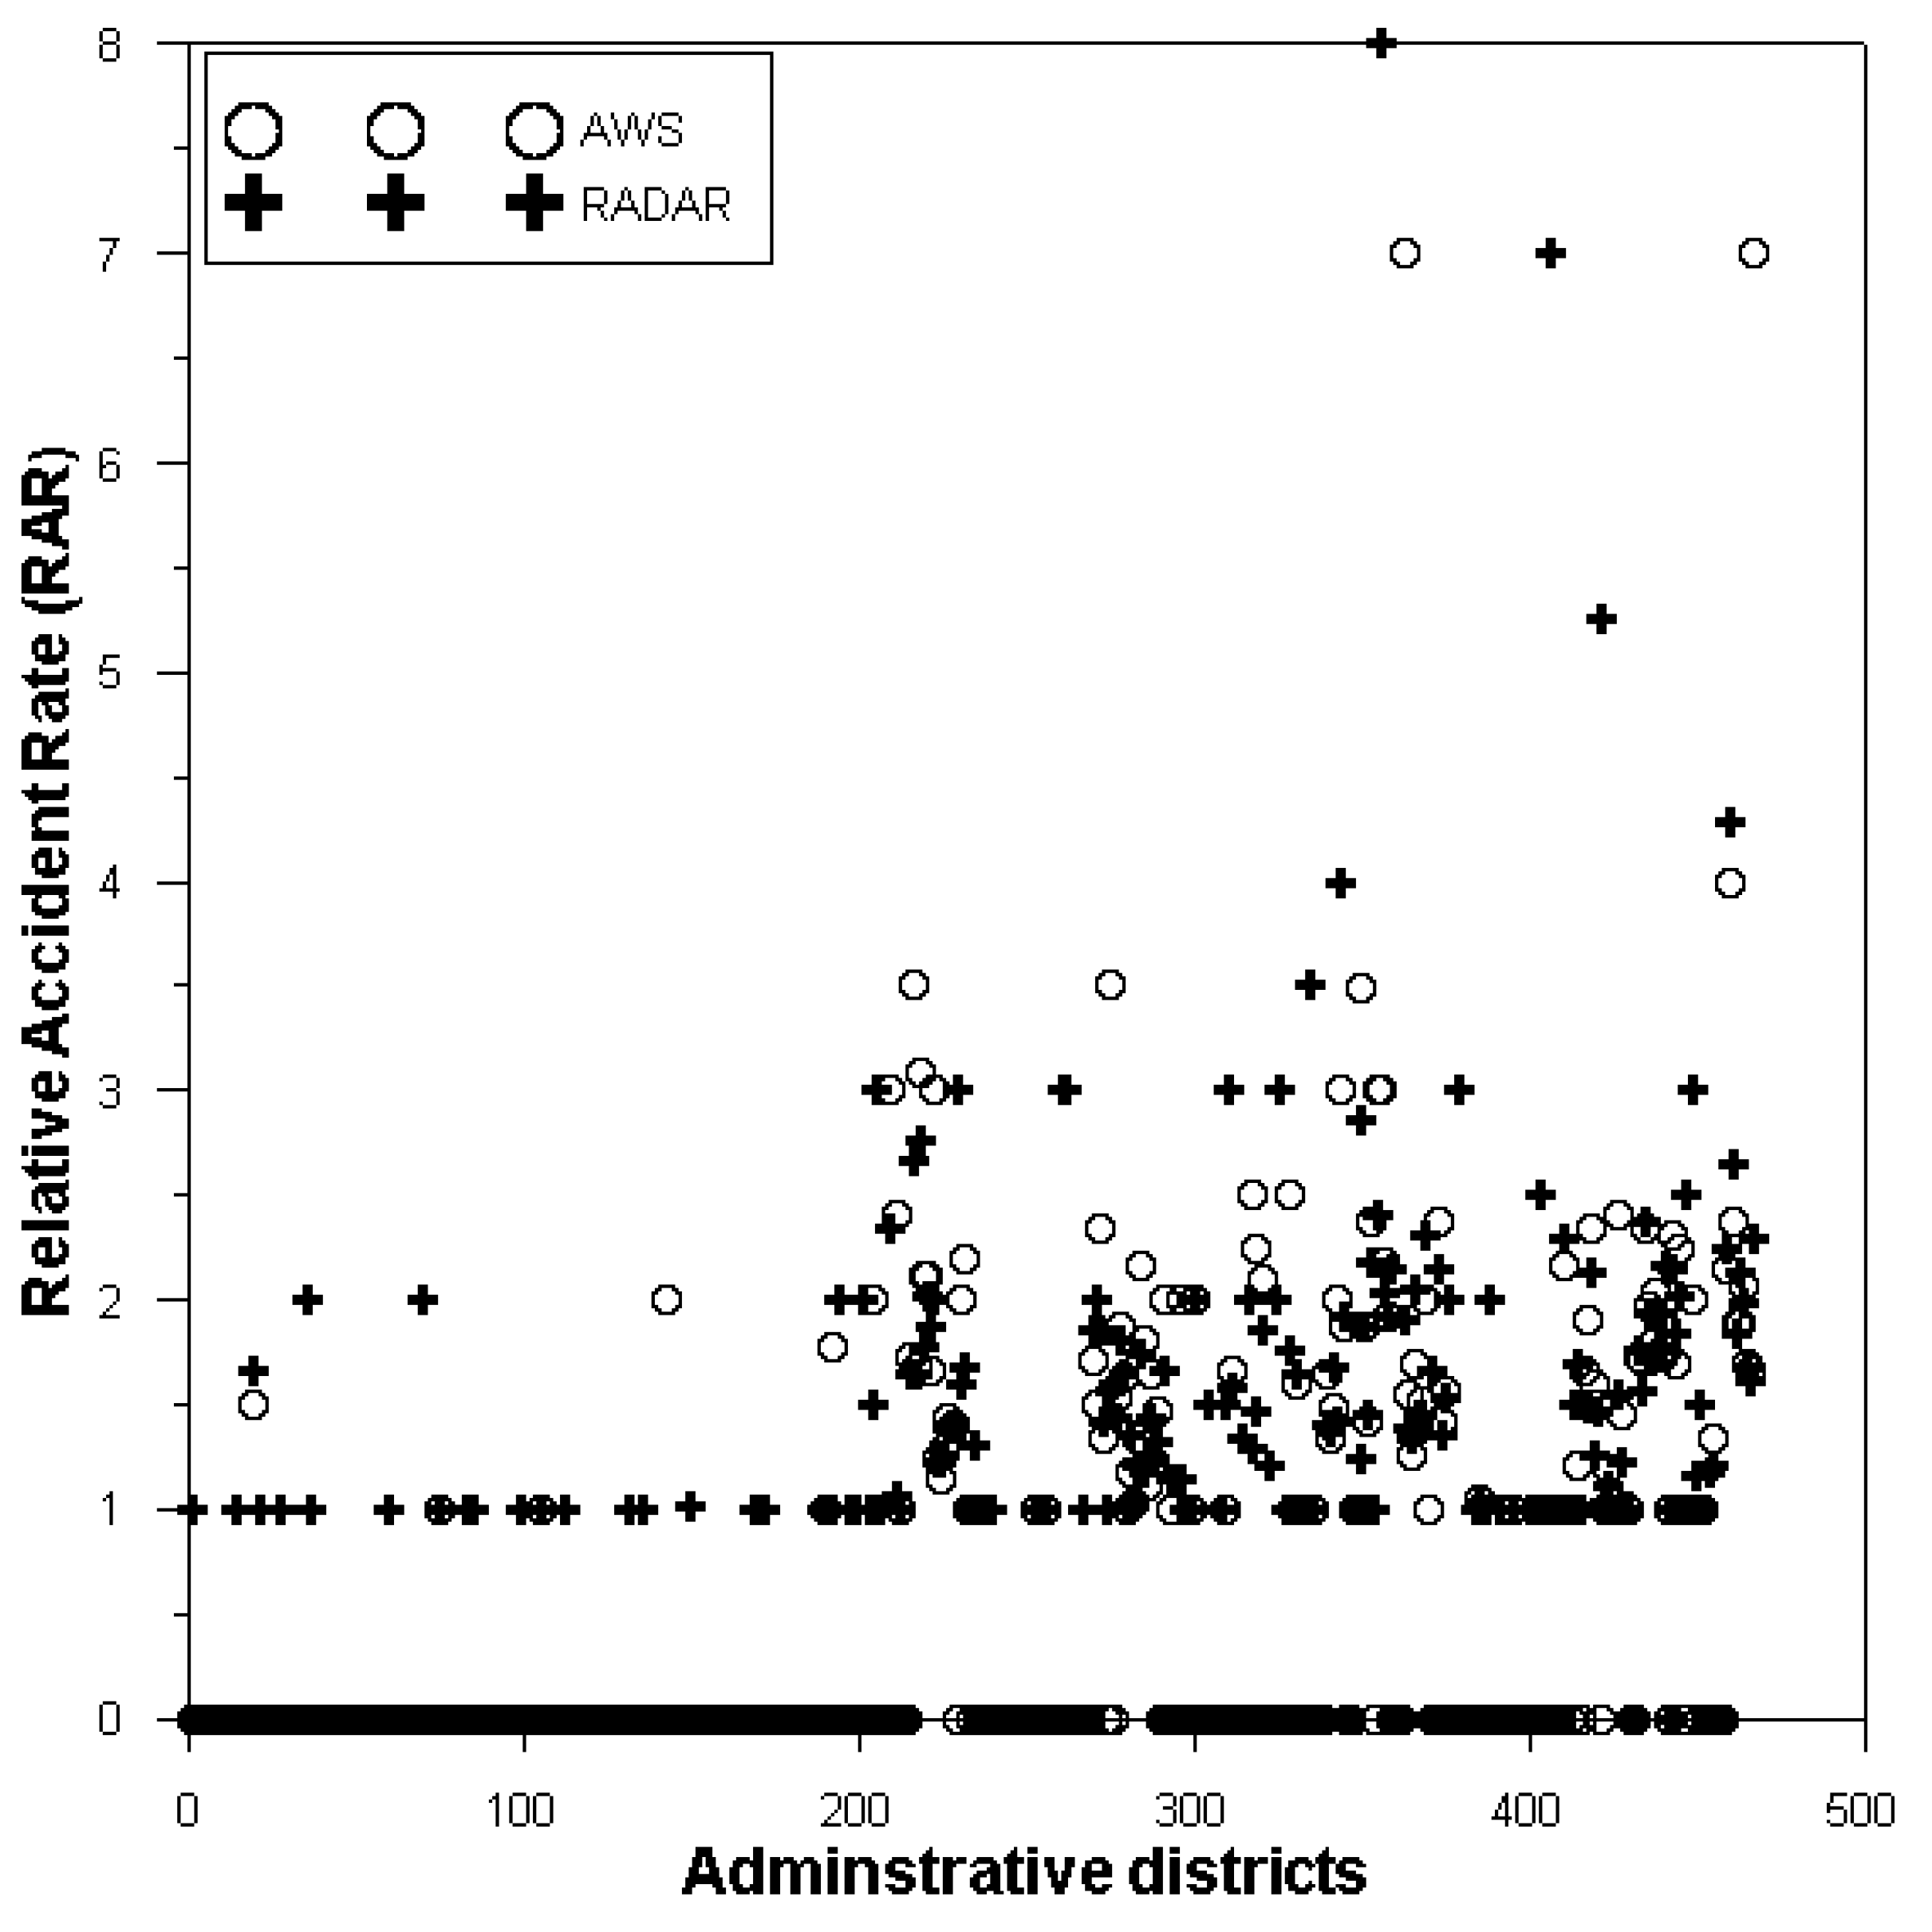
To analyze the spatial correspondence between rainfall distribution and accident location, we plotted data for localized rain events and stratiform rain events [24,25]. A localized rain event is defined as when the area of the rainfall-field is less than 30% of the total area of Seoul. The criterion was determined to be less than 30% by reflecting the heavy rainfall area of Seoul at the time, defined as locally heavy rain in the report [26]. The total number of observed rainfall events related to the 24,797 traffic accidents during rainy conditions was 8288, and localized rain accounted for 2546 events, which corresponded to 30.7% of all rainfall events. The spatial scale of the localized rain, such as the convective band, was set at 10 km based on the research report by the Meteorological Administration, which noted that the convective region is formed while maintaining a width of 2–20 km and a length of several hundred km in radar images. Figure 5 shows the locations of accidents (red stars), and interpolated rainfall from AWS (left) and radar rainfall (right) for localized rain events. Localized rainfall distributions were not observed by AWS and were estimated as non-rainfall in many cases, resulting in considerable differences in rainfall intensity and spatial distribution of rainfall. In particular, the rainfall of the line-shape was concentrated in southeastern Seoul on 27 July 2011 and it is strongly suspected that this caused traffic accidents; AWSs could not measure the rainfall in the region (Figure 5e,f) [27].
The distribution of interpolated AWS rainfall was far less consistent with accident locations than that of radar-derived rainfall, which indicated that localized heavy rainfall likely affected accident occurrence. A quantitative analysis of the spatiotemporal correlation between rain strength and accident occurrence was performed by actively utilizing the spatial distribution information of the radar-derived rainfall.
Figure 6 shows the images for stratiform rainfall events. In this study, a rainfall event was classified as stratiform when the area of rainfall exceeded 50%. Compared with Figure 5 and Figure 6, there is a difference in rainfall amount based on the type of rainfall data, but the area covered by rainfall is generally similar between interpolated AWS and radar-derived rainfall distribution with traffic accident locations in the case of stratiform. However, in the case of very light rainfall intensity, as that seen on 9 May 2007, the area observed by AWS did not cover the entire area of rainfall and regarded the rainfall as local (Figure 6a,b). This occurred due to a measuring error of AWS because a 0.5 mm tipping bucket is used which cannot measure light rainfall below 0.5 mm.

3.4. RAR Analysis

The RAR was estimated to quantitatively analyze the effects of rainfall data sources on the relationship between rainfall and traffic accidents. RAR analysis was based on accident-causing rainfall, without considering specific rainfall criteria or range. The wet and dry hours of Equation (1) to calculate the RAR were estimated using the data one week before and after each accident during the rainfall condition. The RAR was calculated for 467 administrative districts in Seoul using the interpolated AWS and radar-derived data to produce an average RAR of 1.35 and 1.59, respectively (Figure 7). Because the radar better captures the spatial distribution of rainfall, the number of traffic accidents due to rainfall was counted more accurately. For fatal and severe accidents, the RAR was 1.49 using gauge (AWS) data and 1.63 using radar data (Figure 8).
Figure 9 shows the mapping result of RAR for the administrative districts of Seoul. The RAR of all accidents during rainy conditions differs according to the number of accidents and rainfall occurrence patterns in each administrative district. In particular, there are many districts with a RAR of 6 or higher estimated according to radar data. Considering the recent increase in localized rainfall, the analysis using radar rainfall should also be considered for future safety planning applications in Seoul.
Because traffic accidents occur more frequently during rainfall below 5 mm, the spatial detection of rain affects RAR calculations more than the quantity of rainfall. Therefore, the radar in the two-dimensional grid is better able to detect rainfall spatially than the rain gauge, which measures rainfall in a fixed location, thus increasing the reliability of RAR estimation
Figure 10 shows the mapping results of RAR with fatal and severe injury accidents for the administrative districts of Seoul. The range of RAR values was widened to 8 for fatal and severe injury accidents. It is expected that the district where the severity of traffic accidents increases due to rainfall could be detected based on these results.

4. Conclusions

In this study, the frequency and spatial distribution of rainfall and traffic accidents in Seoul, South Korea, were analyzed using point data from AWS gauges, interpolated data from the same gauges, and 250 m resolution gridded radar data.
The frequency analysis of the rainfall amount and the number of traffic accidents indicated little difference in accident-inducing rainfall amounts based on the rainfall data sources. A large number of accidents occurred in the lowest rainfall range, and this was more strongly related to the high frequency of rainfall occurrence than the rainfall amount. This is because the lowest rainfall range might contain a large number of accidents due to various factors.
The spatial distribution of traffic accidents and rainfall events was influenced by radar and gauge rainfall data sources. The analysis results of the spatial distribution of rainfall and accident locations for localized and stratiform rain events indicated that radar data was superior to gauge data for mapping localized rainfall distribution and accident location. The RAR calculated from radar-derived rainfall was about 18% higher than that from AWS rainfall, and the radar data more clearly classified the number of traffic accidents during rainy conditions because its spatial distribution was more precise for all accidents during rainy conditions. In addition, the RAR estimation with fatal and severe injury accidents during rainfall conditions provided information on the districts in which traffic accidents increase due to rainfall.
A more effective method for analyzing traffic accident risk in rainfall conditions was demonstrated in this study based on the superior spatial resolution of radar-derived rainfall, which is advantageous for calculating the value of the RAR. However, it should be noted that more data should be used to analyze the ranges of rainfall amount frequency with respect to the corresponding accident frequencies. Furthermore, calculations such as Cohen’s Kappa coefficient should be adopted to quantify the correspondence between the rainfall data sources. The approach of this study could be applied to the development of risk-warning technology in poor weather for drivers, especially given the potential increase in traffic accidents due to rising extreme weather phenomena, such as torrential rainfall due to climate change. In addition, the results derived in this study could contribute to developing a method for real-time prediction of the probability of traffic accidents using the higher spatial rainfall detection and prediction capability of radar.

Author Contributions

Conceptualization, S.-S.Y. and U.J.; methodology, S.-S.Y.; software, S.-S.Y. and I.B.; formal analysis, S.-S.Y.; investigation, I.B.; resources, I.B.; data curation, S.-S.Y.; writing—original draft preparation, S.-S.Y.; writing—review and editing, U.J.; visualization, U.J. and I.B.; supervision, U.J.; project administration, S.-S.Y. and U.J.; funding acquisition, U.J. All authors have read and agreed to the published version of the manuscript.

Funding

This study was supported by the internal project of Korea Institute of Civil Engineering and Building Technology (Project Number: 20190251) and the Korea Agency for Infrastructure Technology Advancement (KAIA) grant funded by the Ministry of Land, Infra structure and Transport (Grant 19AWMP-B121100-04).

Acknowledgments

We acknowledge the research support from Korea Institute of Civil Engineering and Building Technology (KICT) and the technical support for the data processing by Sewon Na, Chief Technology Officer of DAIER.

Conflicts of Interest

The authors declare no conflict of interest.

References

  1. Mannering, F.L.; Bhat, C.R. Analytic methods in accident research: Methodological frontier and future directions. Anal. Methods Accid. Res. 2014, 1, 1–22. [Google Scholar] [CrossRef]
  2. Tamerius, J.D.; Zhou, X.; Mantilla, R.; Greenfield-Huitt, T. Precipitation effects on motor vehicle crashes vary by space, time, and environmental conditions. Weather Clim. Soc. 2016, 8, 399–407. [Google Scholar] [CrossRef]
  3. Peng, Y.; Abdel-Aty, M.; Shi, Q.; Yu, R. Assessing the impact of reduced visibility on traffic crash risk using microscopic data and surrogate safety measures. Transp. Res. Part C Emerg. Technol. 2017, 74, 295–305. [Google Scholar] [CrossRef] [Green Version]
  4. Omranian, E.; Sharif, H.; Dessouky, S. Large-Scale Weather-Related Crash Risk Analysis over Texas–Application of Big Data. In Proceedings of the Transportation Research Board 97th Annual Meeting, Washington, DC, USA, 7–11 January 2018. [Google Scholar]
  5. Federal Highway Administration. Road Weather Management Program: How do Weather Events Impact Roads? Available online: http://www.ops.fhwa.dot.gov/weather/q1_roadimpact.htm (accessed on 12 February 2020).
  6. Edwards, J.B. The temporal distribution of road accidents in adverse weather. Meteorol. Appl. 1999, 6, 59–68. [Google Scholar] [CrossRef]
  7. Qiu, L.; Nixon, W. Effects of adverse weather on traffic crashes: Systematic review and meta-analysis. Transp. Res. Rec. J. Transp. Res. Board 2008, 2055, 139–146. [Google Scholar] [CrossRef]
  8. Black, A.W.; Villarini, G.; Mote, T.L. Effects of rainfall on vehicle crashes in six U.S. states. Weather Clim. Soc. 2017, 9, 53–70. [Google Scholar] [CrossRef]
  9. Hambly, D.; Andrey, J.; Mills, B.; Fletcher, C. Projected implications of climate change for road safety in Greater Vancouver, Canada. Clim. Chang. 2013, 116, 613–629. [Google Scholar] [CrossRef]
  10. Fridstrom, L.; Ifver, J.; Ingebrigtsen, S.; Kulmala, R.; Thomsen, L.K. Measuring the contribution of randomness, exposure, weather, and daylight to the variation in road accident counts. Accid. Anal. Prev. 1995, 27, 1–20. [Google Scholar] [CrossRef]
  11. Elvik, R. Laws of accident causation. Accid. Anal. Prev. 2006, 38, 742–747. [Google Scholar] [CrossRef] [PubMed]
  12. KoROAD. Analysis of Traffic Accident Statistics. 2016. Available online: http://tass.koroad.or.kr/ (accessed on 12 February 2020).
  13. KoROAD. Traffic Safety Index by Local Government in 2018; Road Safety Report; KoRoad: Wonju-si, Korea, 2019. [Google Scholar]
  14. Lee, J.; Chae, J.; Yoon, T.; Yang, H. Traffic accident severity analysis with rain-related factors using structural equation modeling—A case study of Seoul city. Accid. Anal. Prev. 2018, 112, 1–10. [Google Scholar] [CrossRef] [PubMed]
  15. Andrey, J.; Mills, B.; Leahy, M.; Suggett, J. Weather as a chronic hazard for road transportation in Canadian cities. Nat. Hazards 2003, 28, 319–343. [Google Scholar] [CrossRef]
  16. Andrey, J. Long-term trends in weather-related crash risks. J. Transp. Geogr. 2010, 18, 247–258. [Google Scholar] [CrossRef]
  17. Bernstein, L.; Bosch, P.; Canziani, O.; Chen, Z.; Christ, R.; Riahi, K. IPCC: Climate Change 2007; Synthesis Report; IPCC: Geneva, Switzerland, 2008; ISBN 2-9169-122-4. [Google Scholar]
  18. Jaroszweski, D.; McNamara, T. The influence of rainfall on road accidents in urban areas: A weather radar approach. Travel Behav. Soc. 2014, 1, 15–21. [Google Scholar] [CrossRef] [Green Version]
  19. Curtis, D.C.; Clyde, B. Comparing spatial distribution of rainfall derived from rain gauges and radar. J. Floodplain Manag. 1999, 1, 9–21. [Google Scholar]
  20. Yoon, S.; Phuong, A.T.; Bae, D. Quantitative comparison of the spatial distribution of radar and gauge rainfall data. J. Hydrometeor. 2012, 13, 1939–1953. [Google Scholar] [CrossRef]
  21. Mohr, C.G.; Vaughan, R.L. An economical procedure for Cartesian interpolation and display of reflectivity factor data in three-dimensional space. Bull. Am. Meteorol. Soc. 1979, 18, 661–670. [Google Scholar] [CrossRef]
  22. Yoon, S.S. Adaptive blending method of radar-based and numerical weather prediction QPFs for urban flood forecasting. Remote Sens. 2019, 11, 642. [Google Scholar] [CrossRef] [Green Version]
  23. Jung, S.; Qin, X.; Noyce, D.A. Rainfall effect on single-vehicle crash severities using polychotomous response models. Accid. Anal. Prev. 2010, 42, 213–224. [Google Scholar] [CrossRef] [PubMed]
  24. Biggerstaff, M.I.; Listemaa, S.A. An improved scheme for convective/stratiform echo classification using radar reflectivity. J. Appl. Meteor. 2000, 39, 2129–2150. [Google Scholar] [CrossRef]
  25. Jung, S.P.; Kwon, T.Y.; Han, S.O. Thermodynamic characteristics associated with localized torrential rainfall events in the middle west region of Korean Peninsula. Atmosphere. Korean Meteorol. Soc. 2014, 24, 457–470. [Google Scholar]
  26. Korea Meteorological Administration. Improvement of Understanding and Prediction Capability for High-Impact Heavy Precipitation Systems over the Korean Peninsula; Korea Meteorological Administration: Seoul, Korea, 2015; p. 214. [Google Scholar]
  27. Korea Meteorological Administration. Convective Storm TOP10. Available online: http://www.kma.go.kr/down/e-learning/hands/hands_35.pdf (accessed on 1 December 2019).
Figure 1. Locations of selected traffic accidents on rainy days, April to October 2008–2017; automatic weather stations (AWSs); and weather radar grid in Seoul.
Applsci 10 07327 g001
Figure 2. Distance between accident location and (a) nearest AWS location and (b) 250 m radar grid point.
Applsci 10 07327 g002
Figure 3. Number of accidents during 1 h accumulated rainfall measured by (a) rain gauges nearest to the accident location, (b) distributed rain gauges, and (c) radar.
Applsci 10 07327 g003
Figure 4. Number of fatal and severe accidents during 1 h accumulated rainfall measured by (a) rain gauges nearest to the accident location, (b) distributed rain gauges, and (c) radar.
Applsci 10 07327 g004
Figure 5. Comparison of interpolated AWS (left column) and radar-derived (right column) rainfall distribution with traffic accident locations (red circles) for localized rain events.
Applsci 10 07327 g005aApplsci 10 07327 g005b
Figure 6. Comparison of interpolated AWS (left column) and radar-derived (right column) rainfall distribution with traffic accident locations (red circles) for stratiform rain events.
Applsci 10 07327 g006aApplsci 10 07327 g006b
Figure 7. Relative accident rate (RAR) for all 467 administrative districts in Seoul (all accidents during rainfall).
Applsci 10 07327 g007
Figure 8. RAR for all 467 administrative districts in Seoul (fatal and severe accidents during rainfall).
Applsci 10 07327 g008
Figure 9. District-wise RAR distribution based on interpolated AWS rainfall (upper) and from radar-derived rainfall (lower) for all accidents in rain conditions.
Applsci 10 07327 g009
Figure 10. District-wise RAR distribution based on interpolated AWS rainfall (upper) and from radar-derived rainfall (lower) for fatal and severe injury accidents
Applsci 10 07327 g010
Table 1. Distance between rain gauges and radar grid with respect to the accident locations (unit: meters).
Data TypeMin.1st Qu.MedianMean3rd Qu.Max
Rain gauges1612211806188624665956
Radar17410399126183
Publisher’s Note: MDPI stays neutral with regard to jurisdictional claims in published maps and institutional affiliations.

