Diagnostics 101: A Tutorial for Fault Diagnostics of Rolling Element Bearing Using Envelope Analysis in MATLAB
Abstract
1. Introduction
2. Bearing Diagnostics
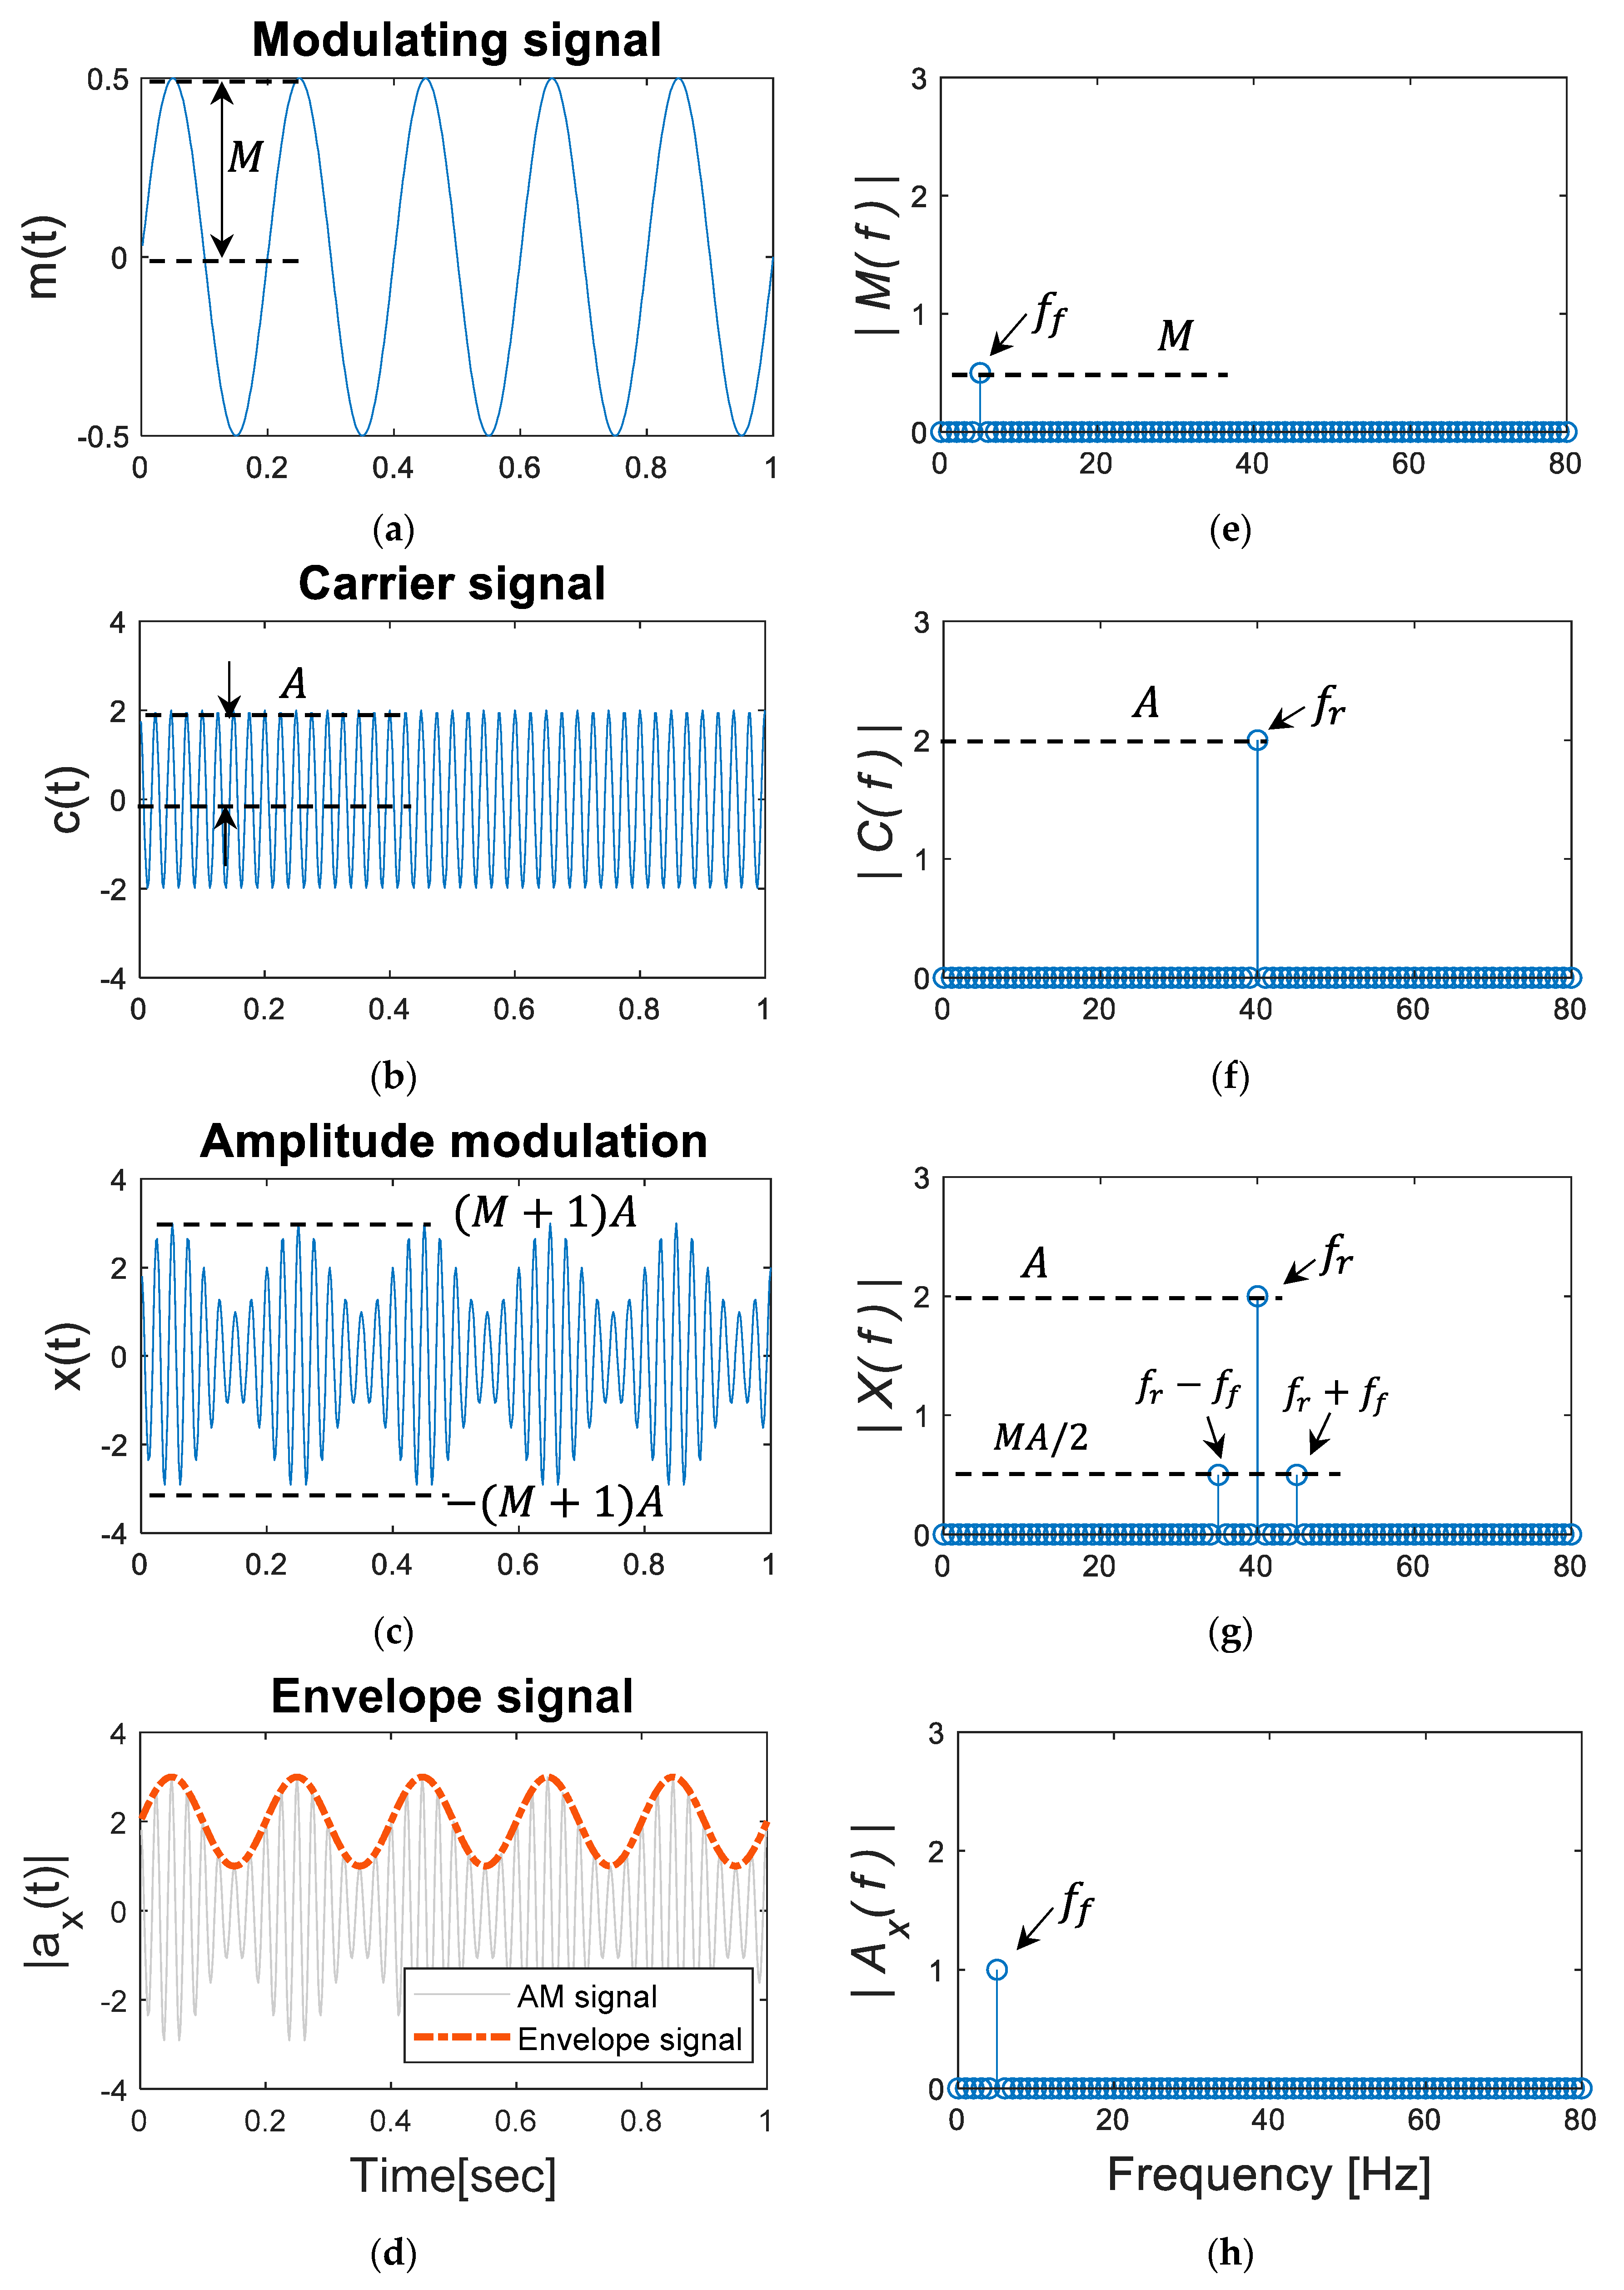
2.1. Fault Signal Given by Amplitude Modulation
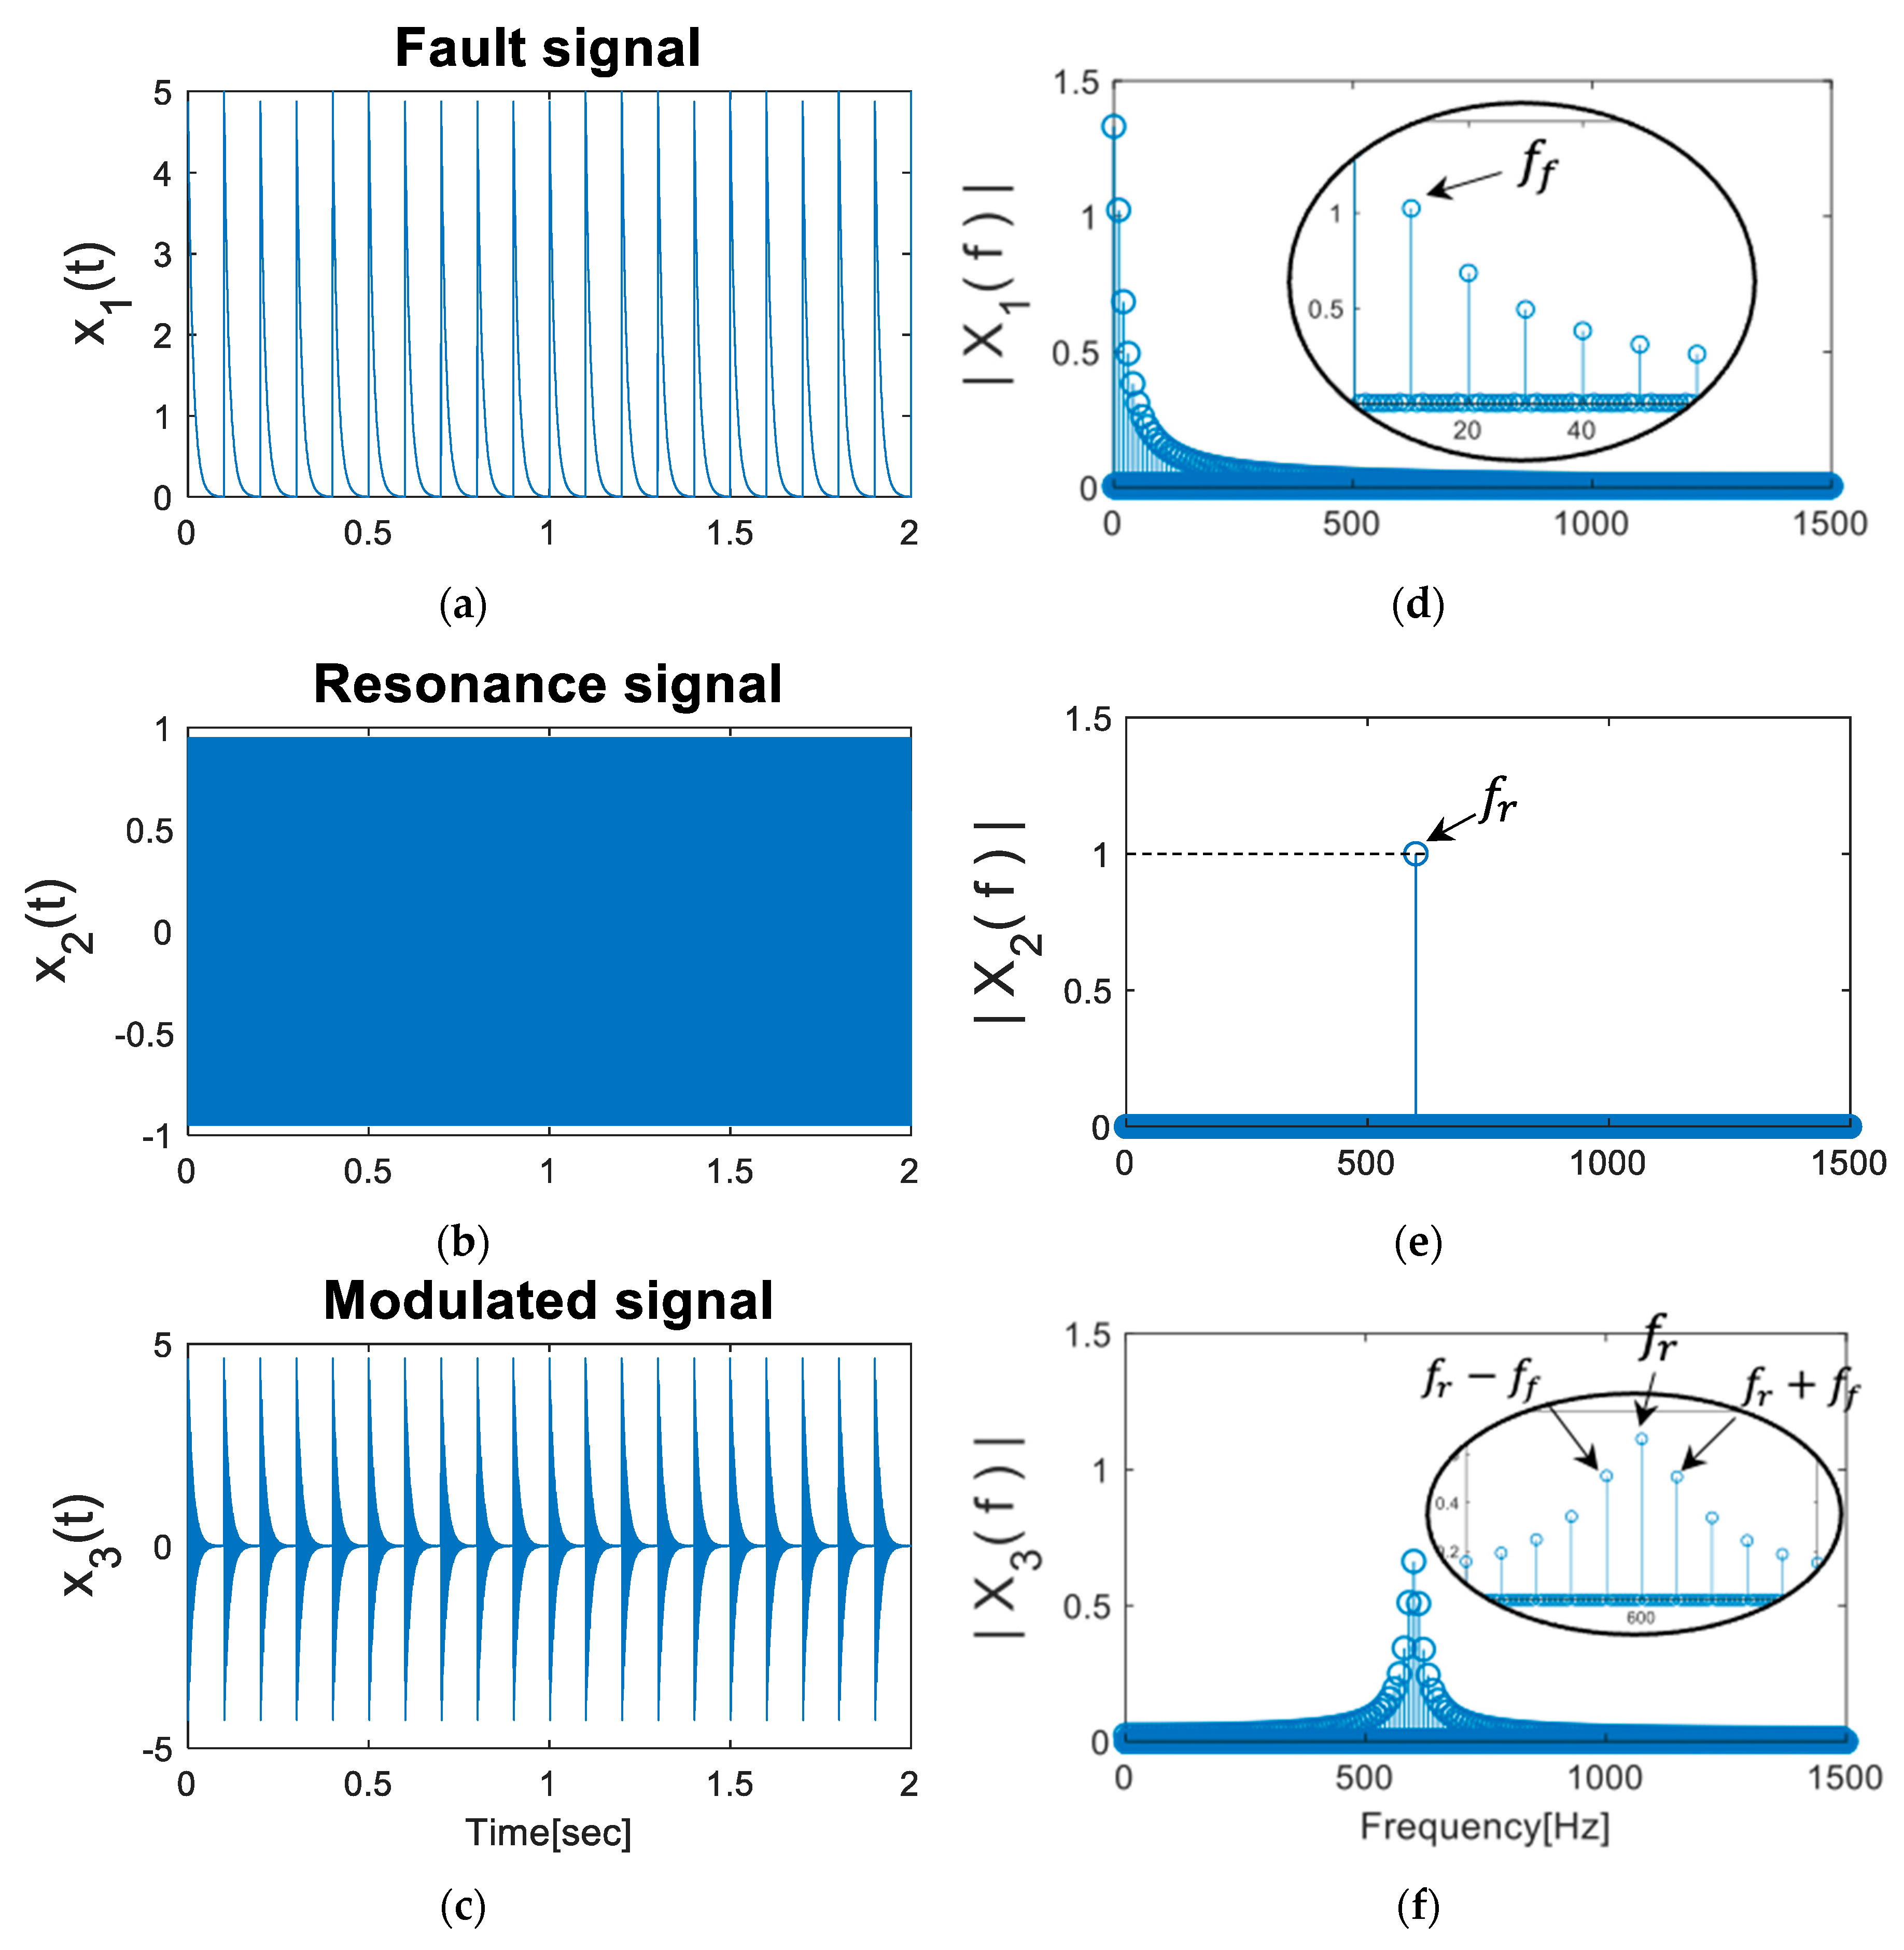
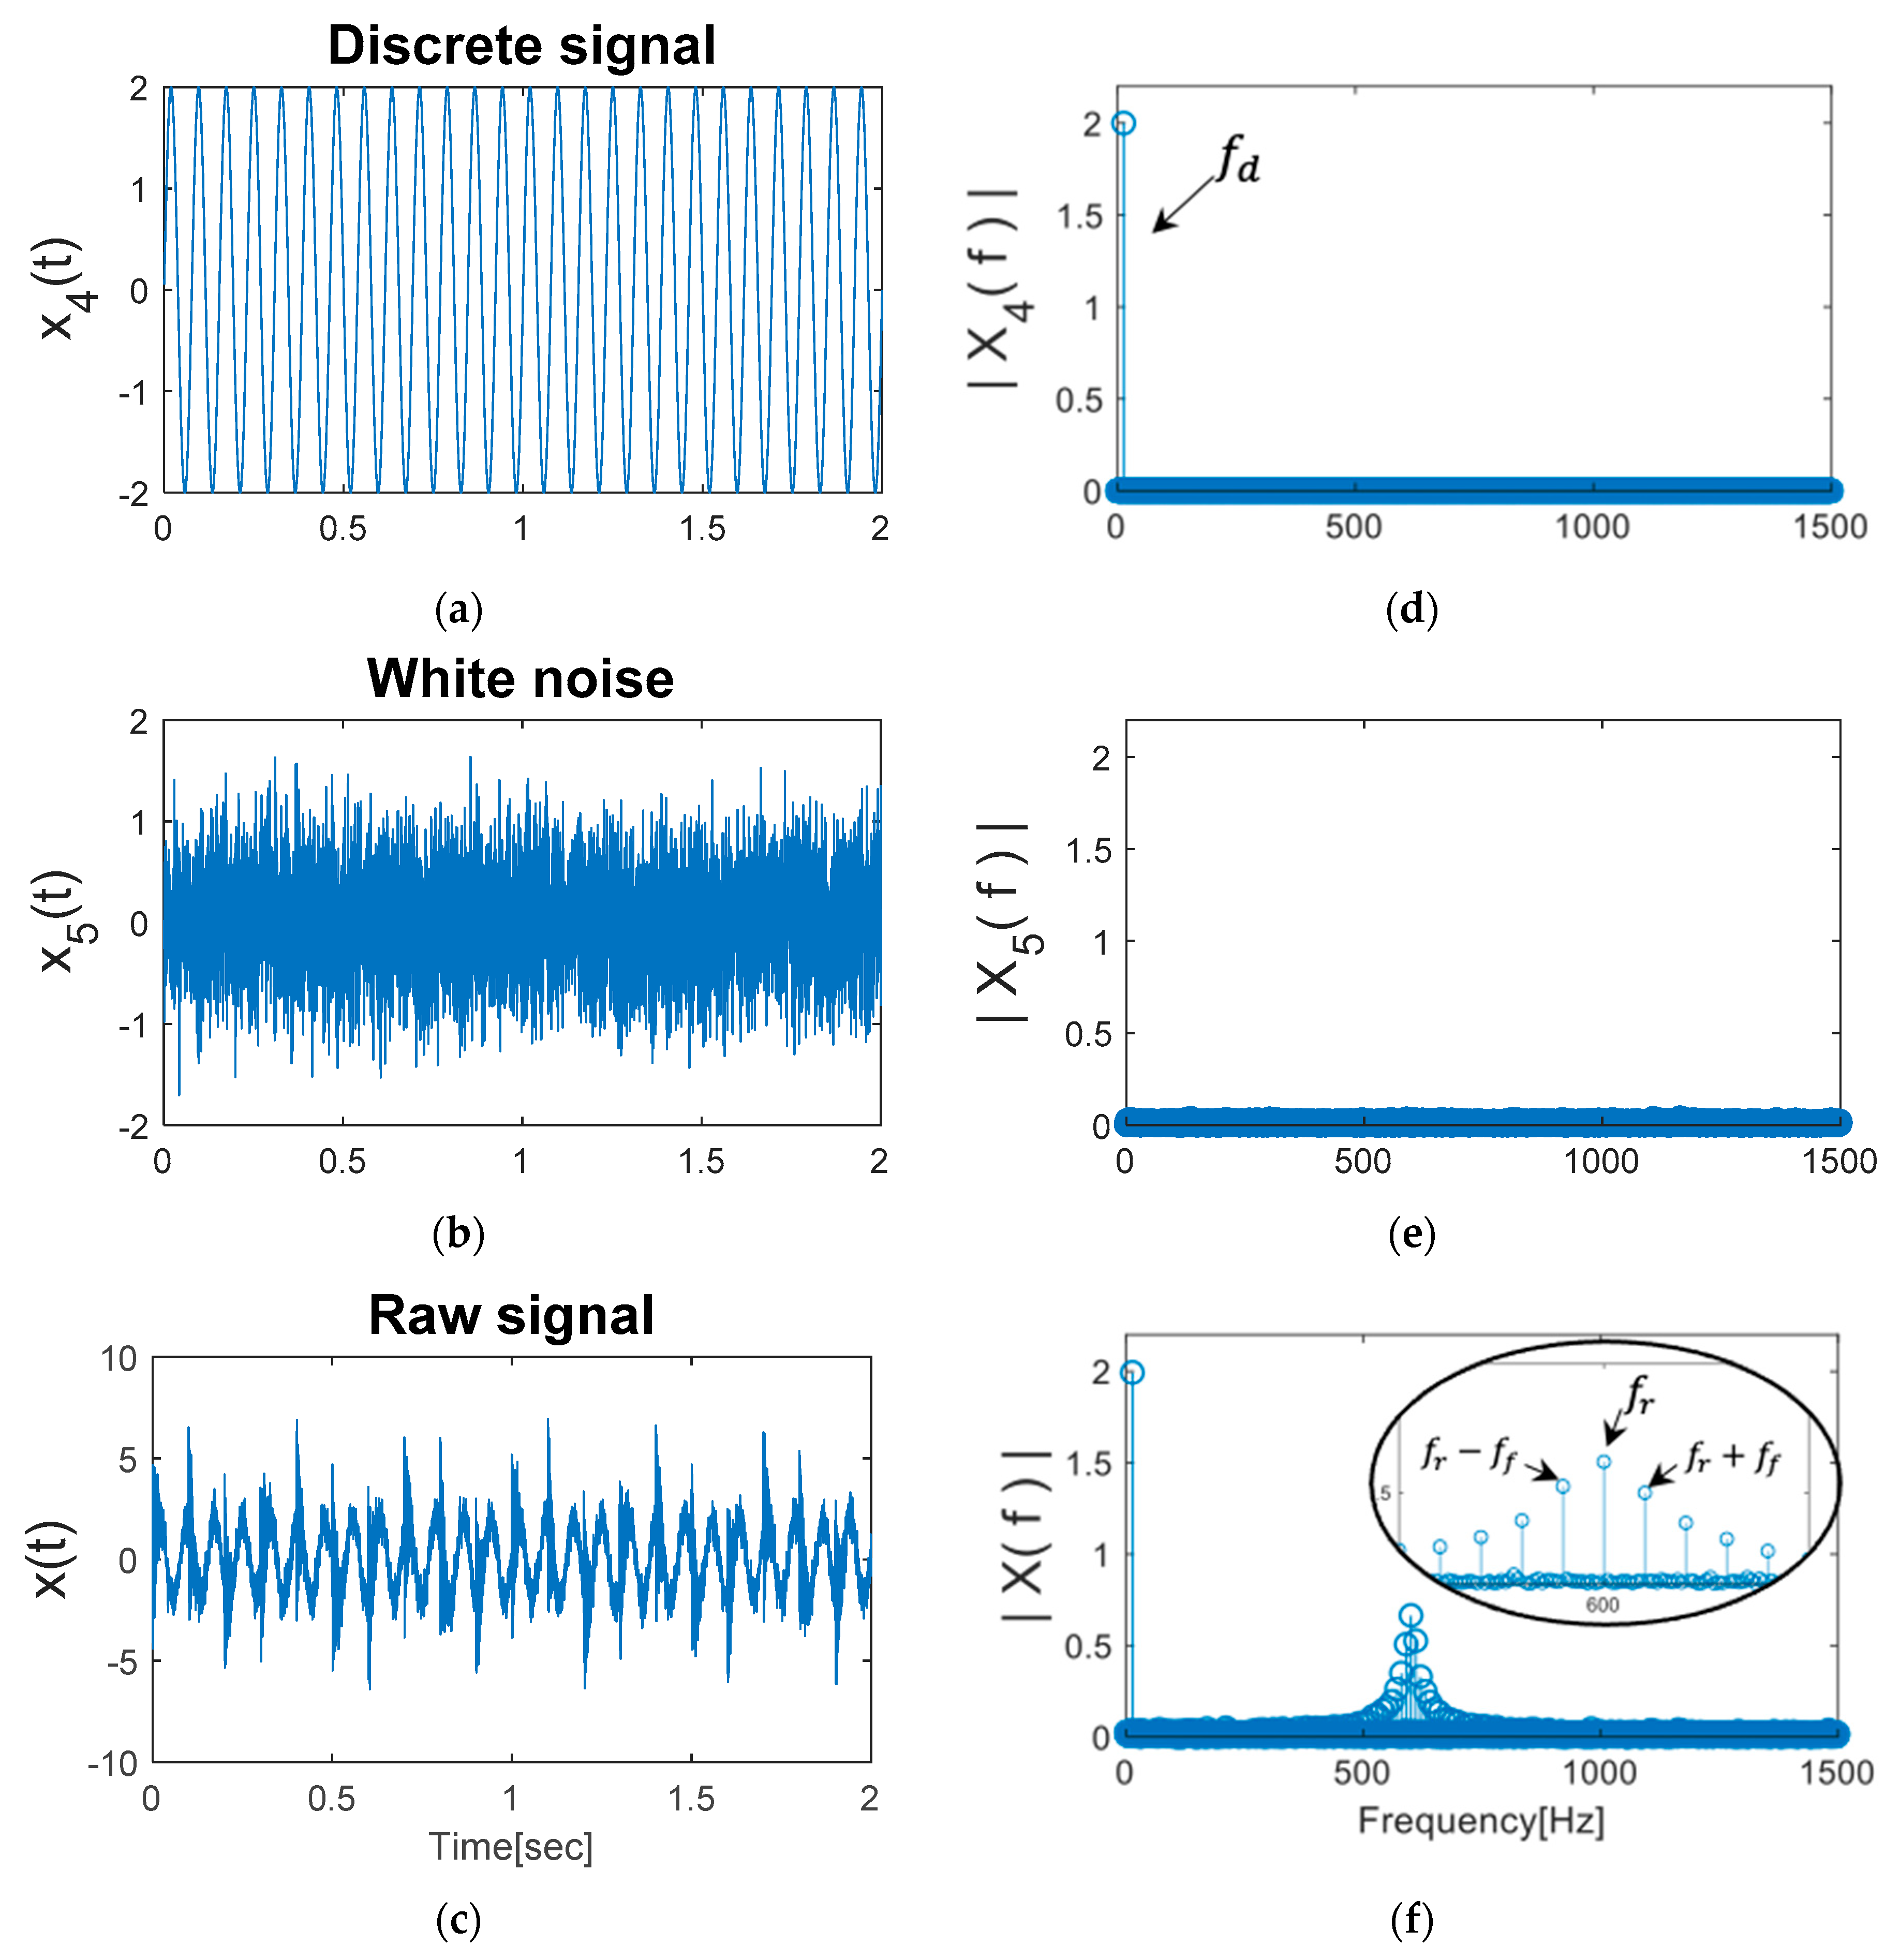
2.2. Simulation of Fault Signal
3. Diagnosis Using Simulation Data
3.1. Problem Definition (Lines 1–7)
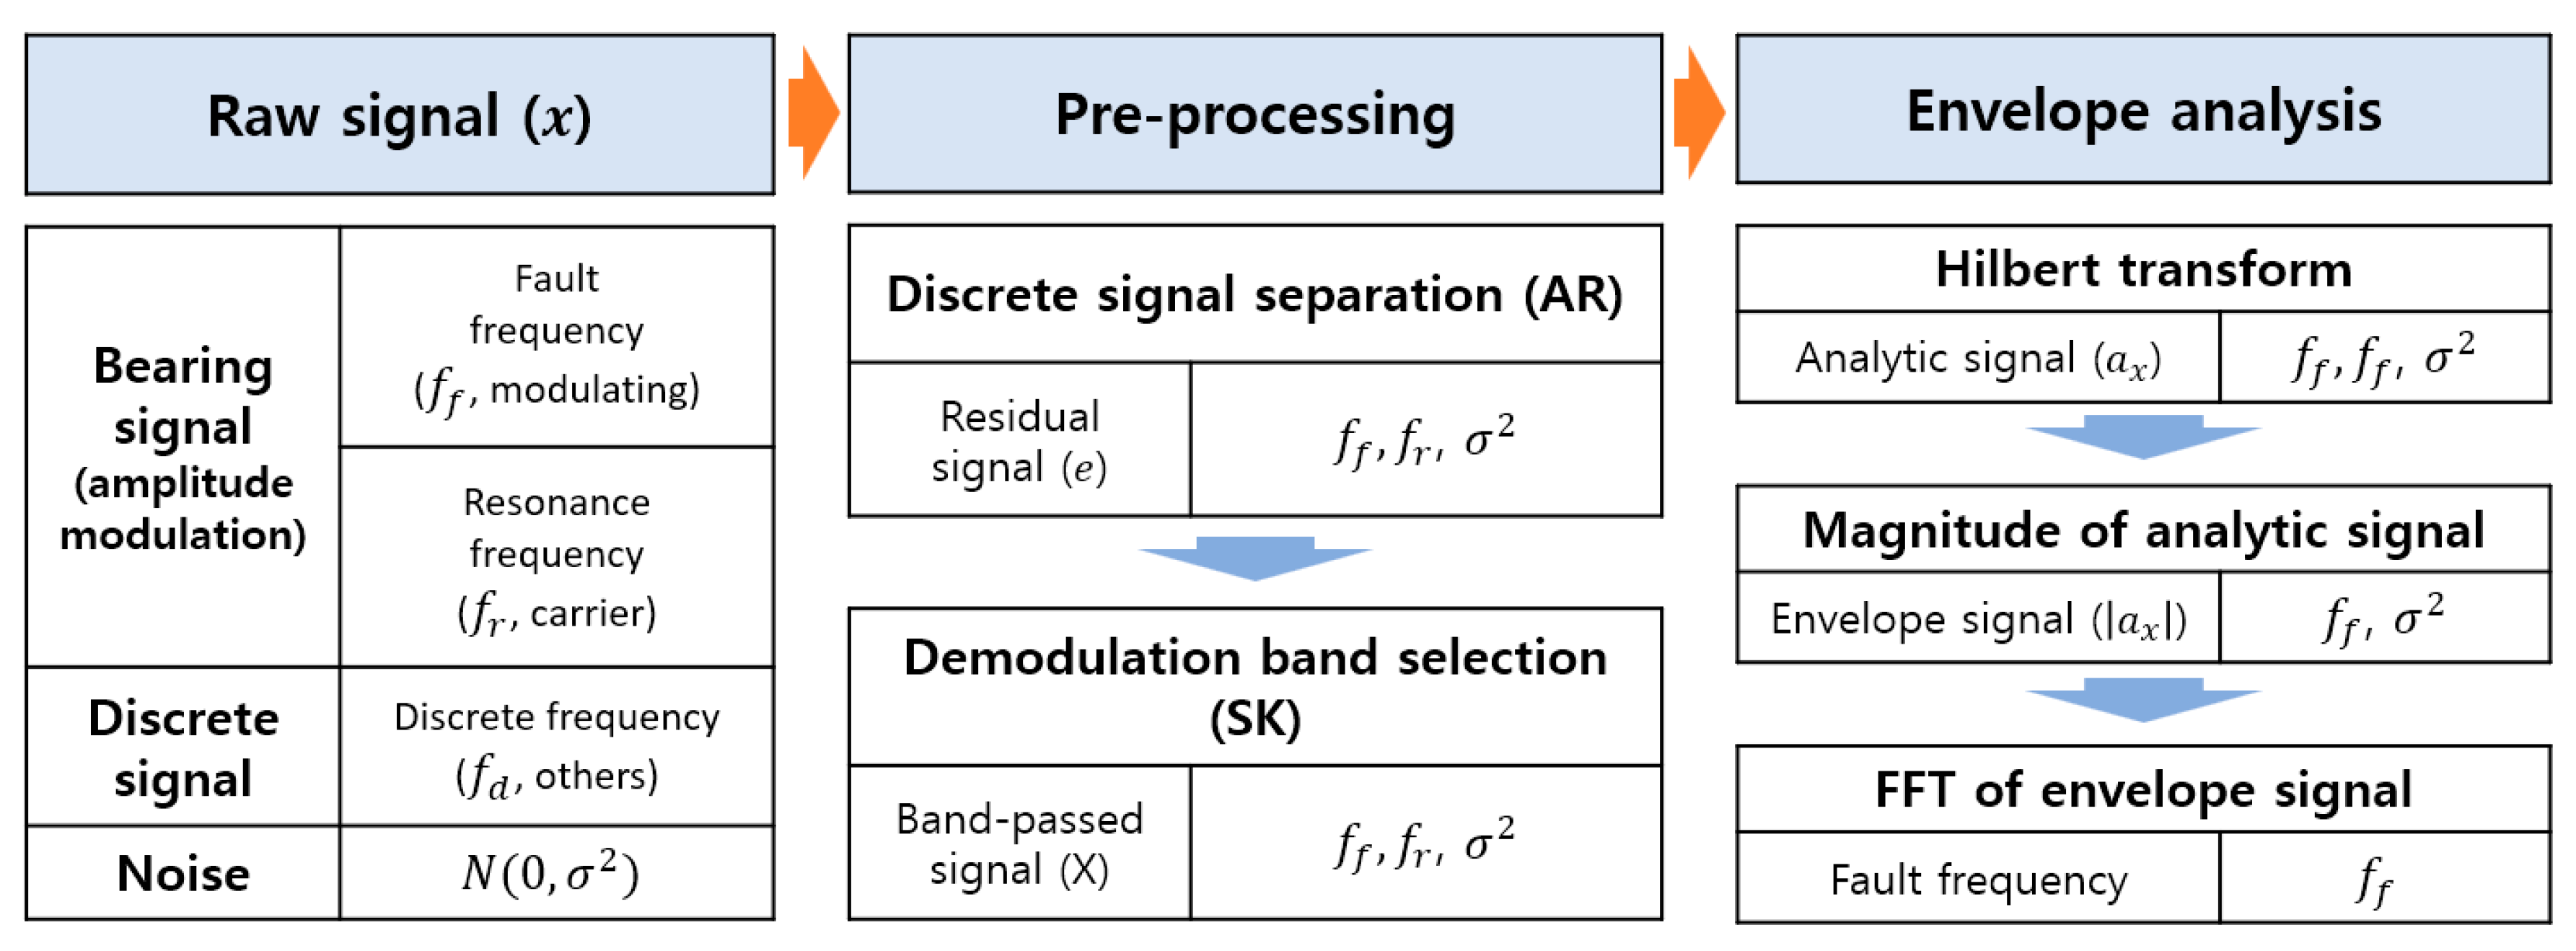
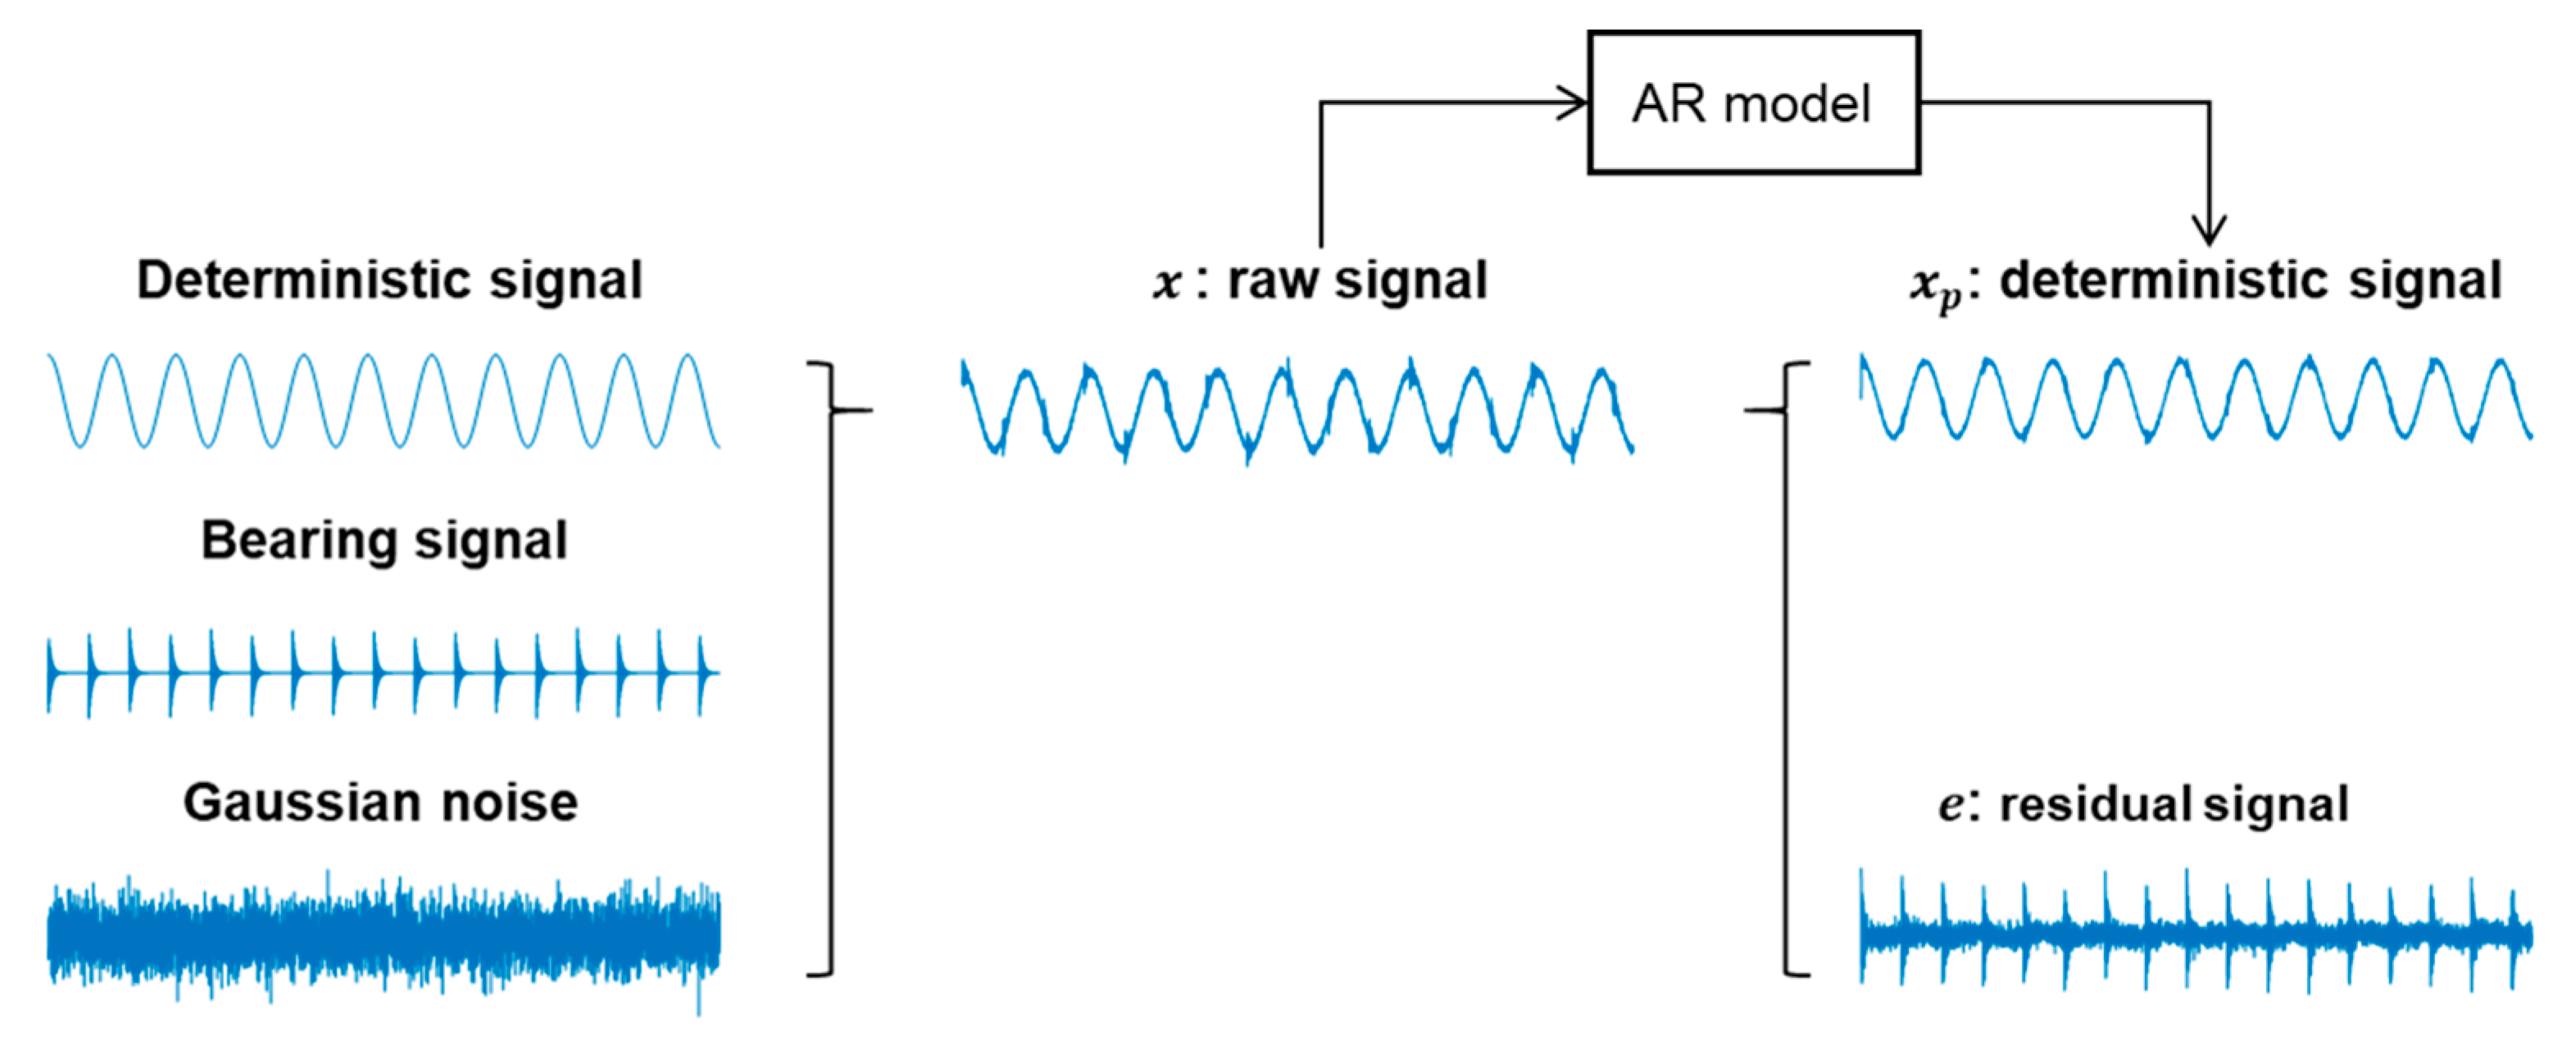
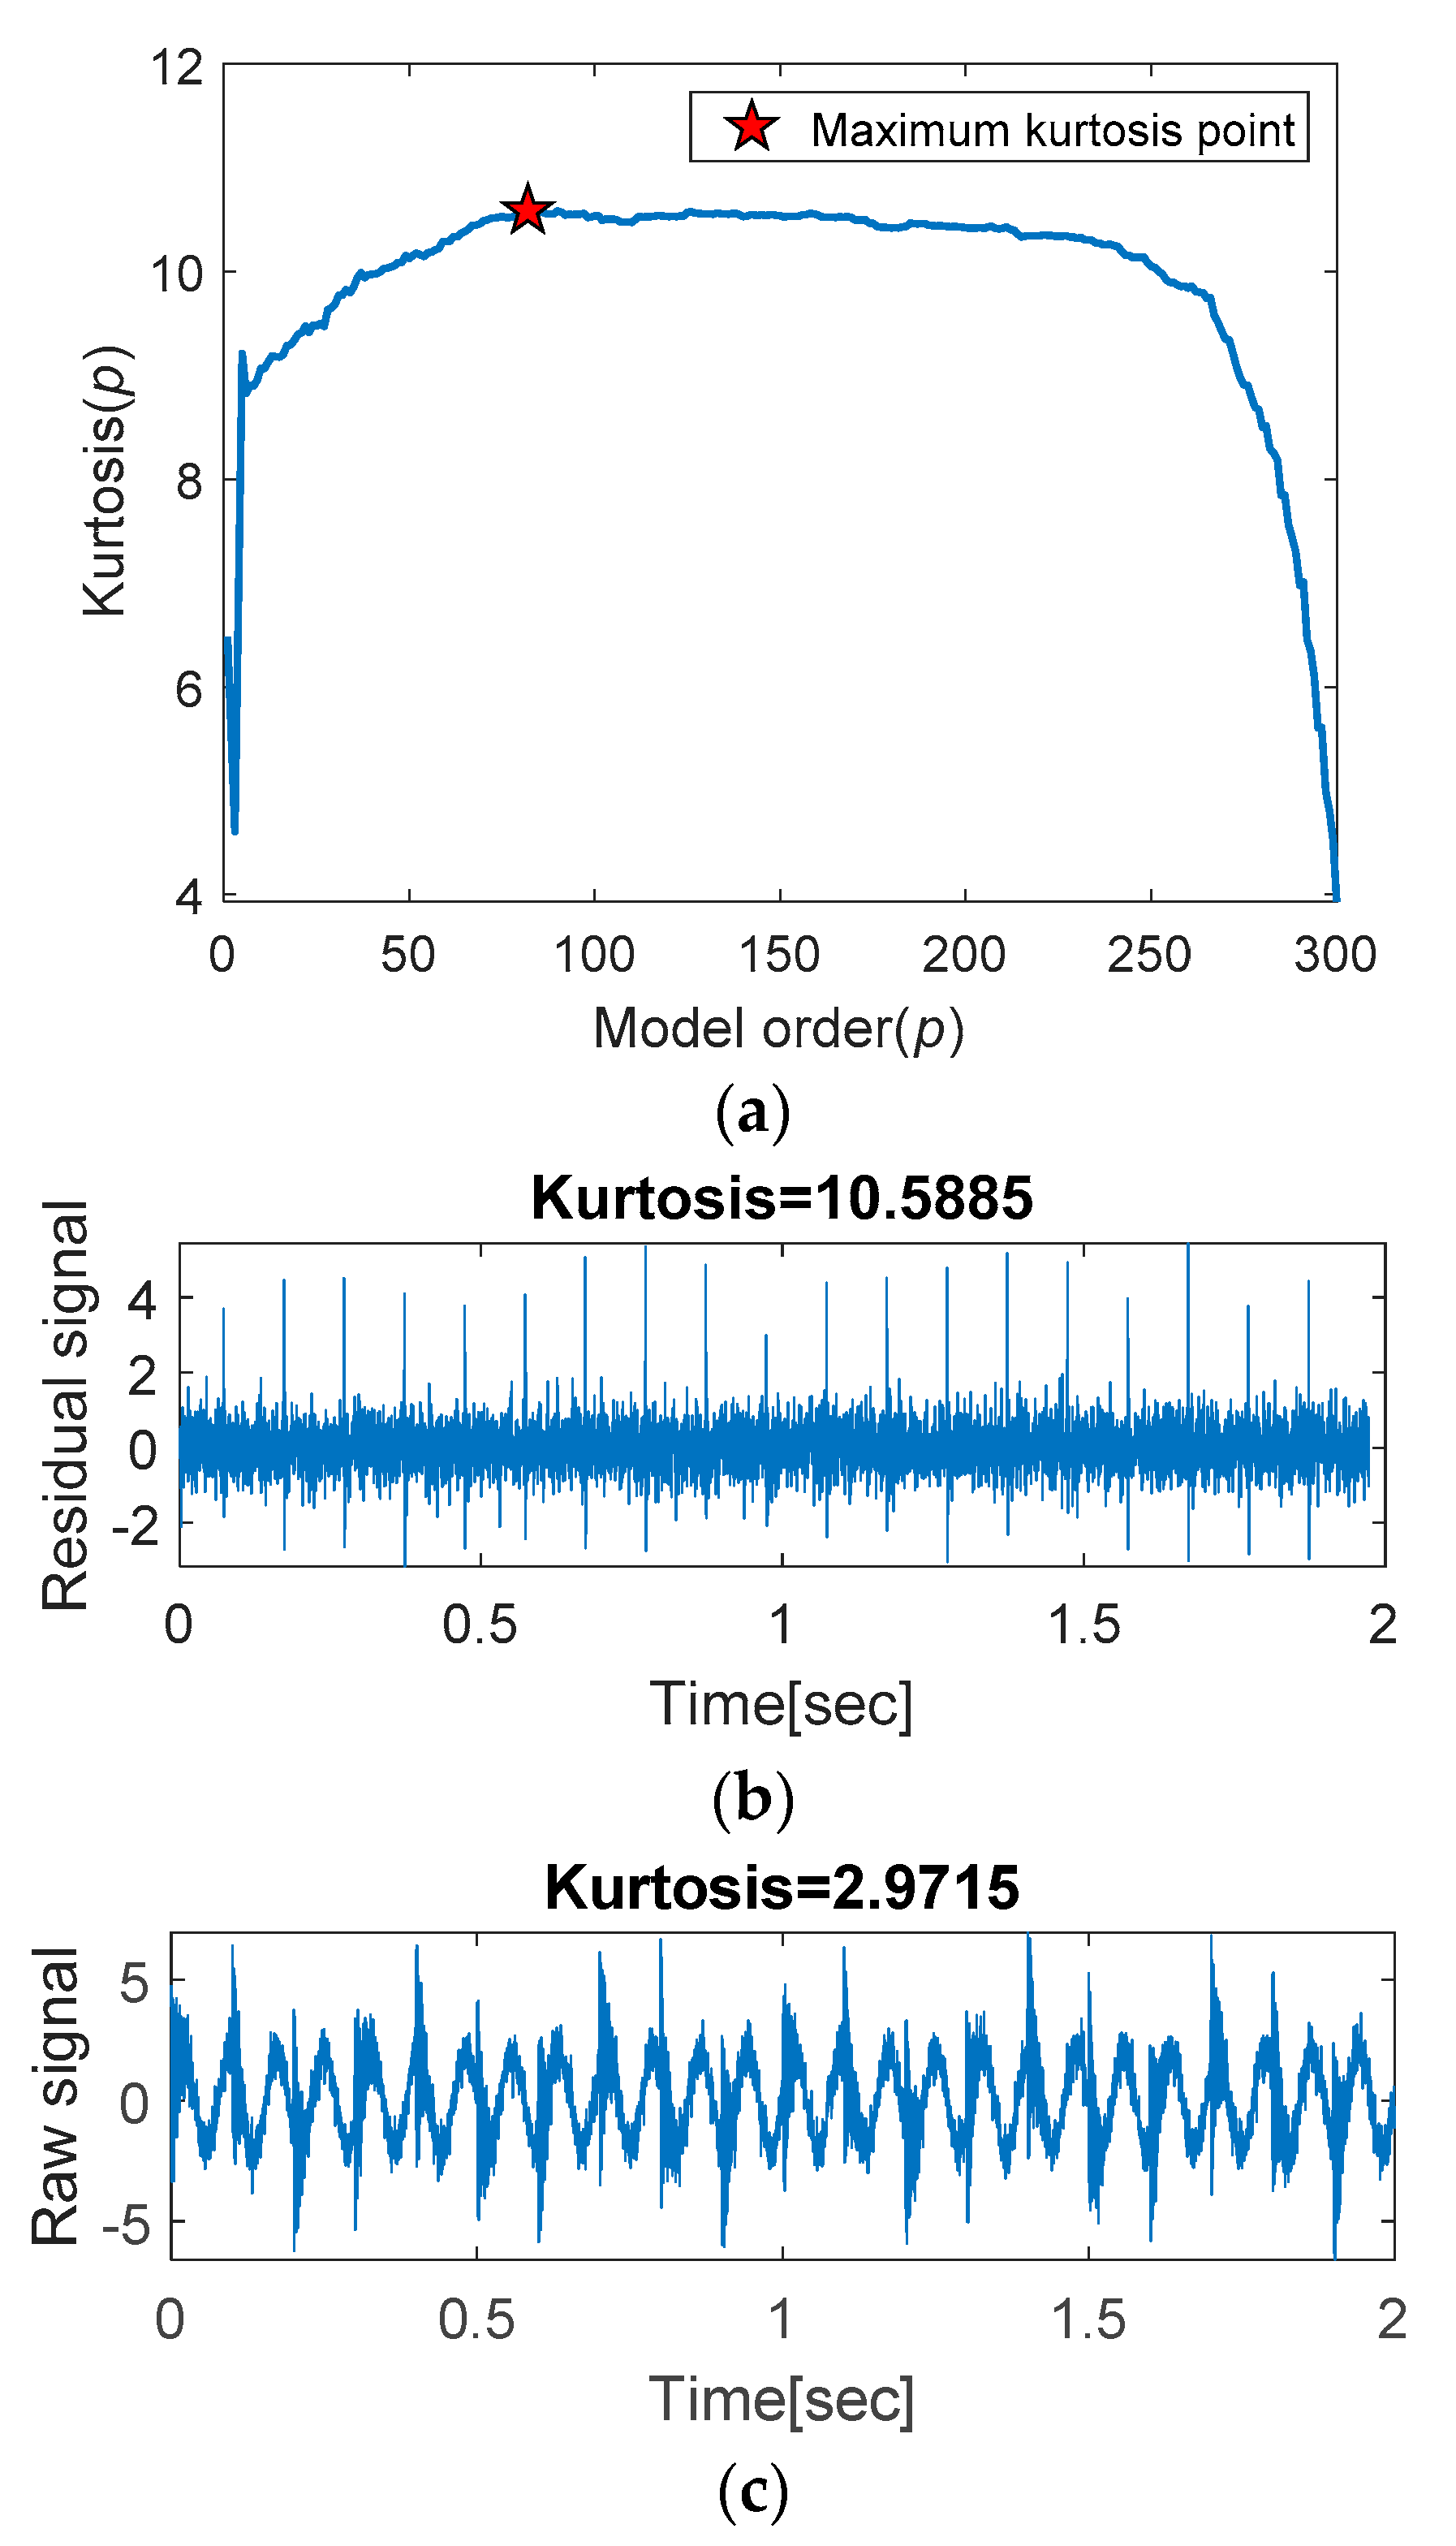
3.2. Discrete Signal Separation (Lines 8–22)
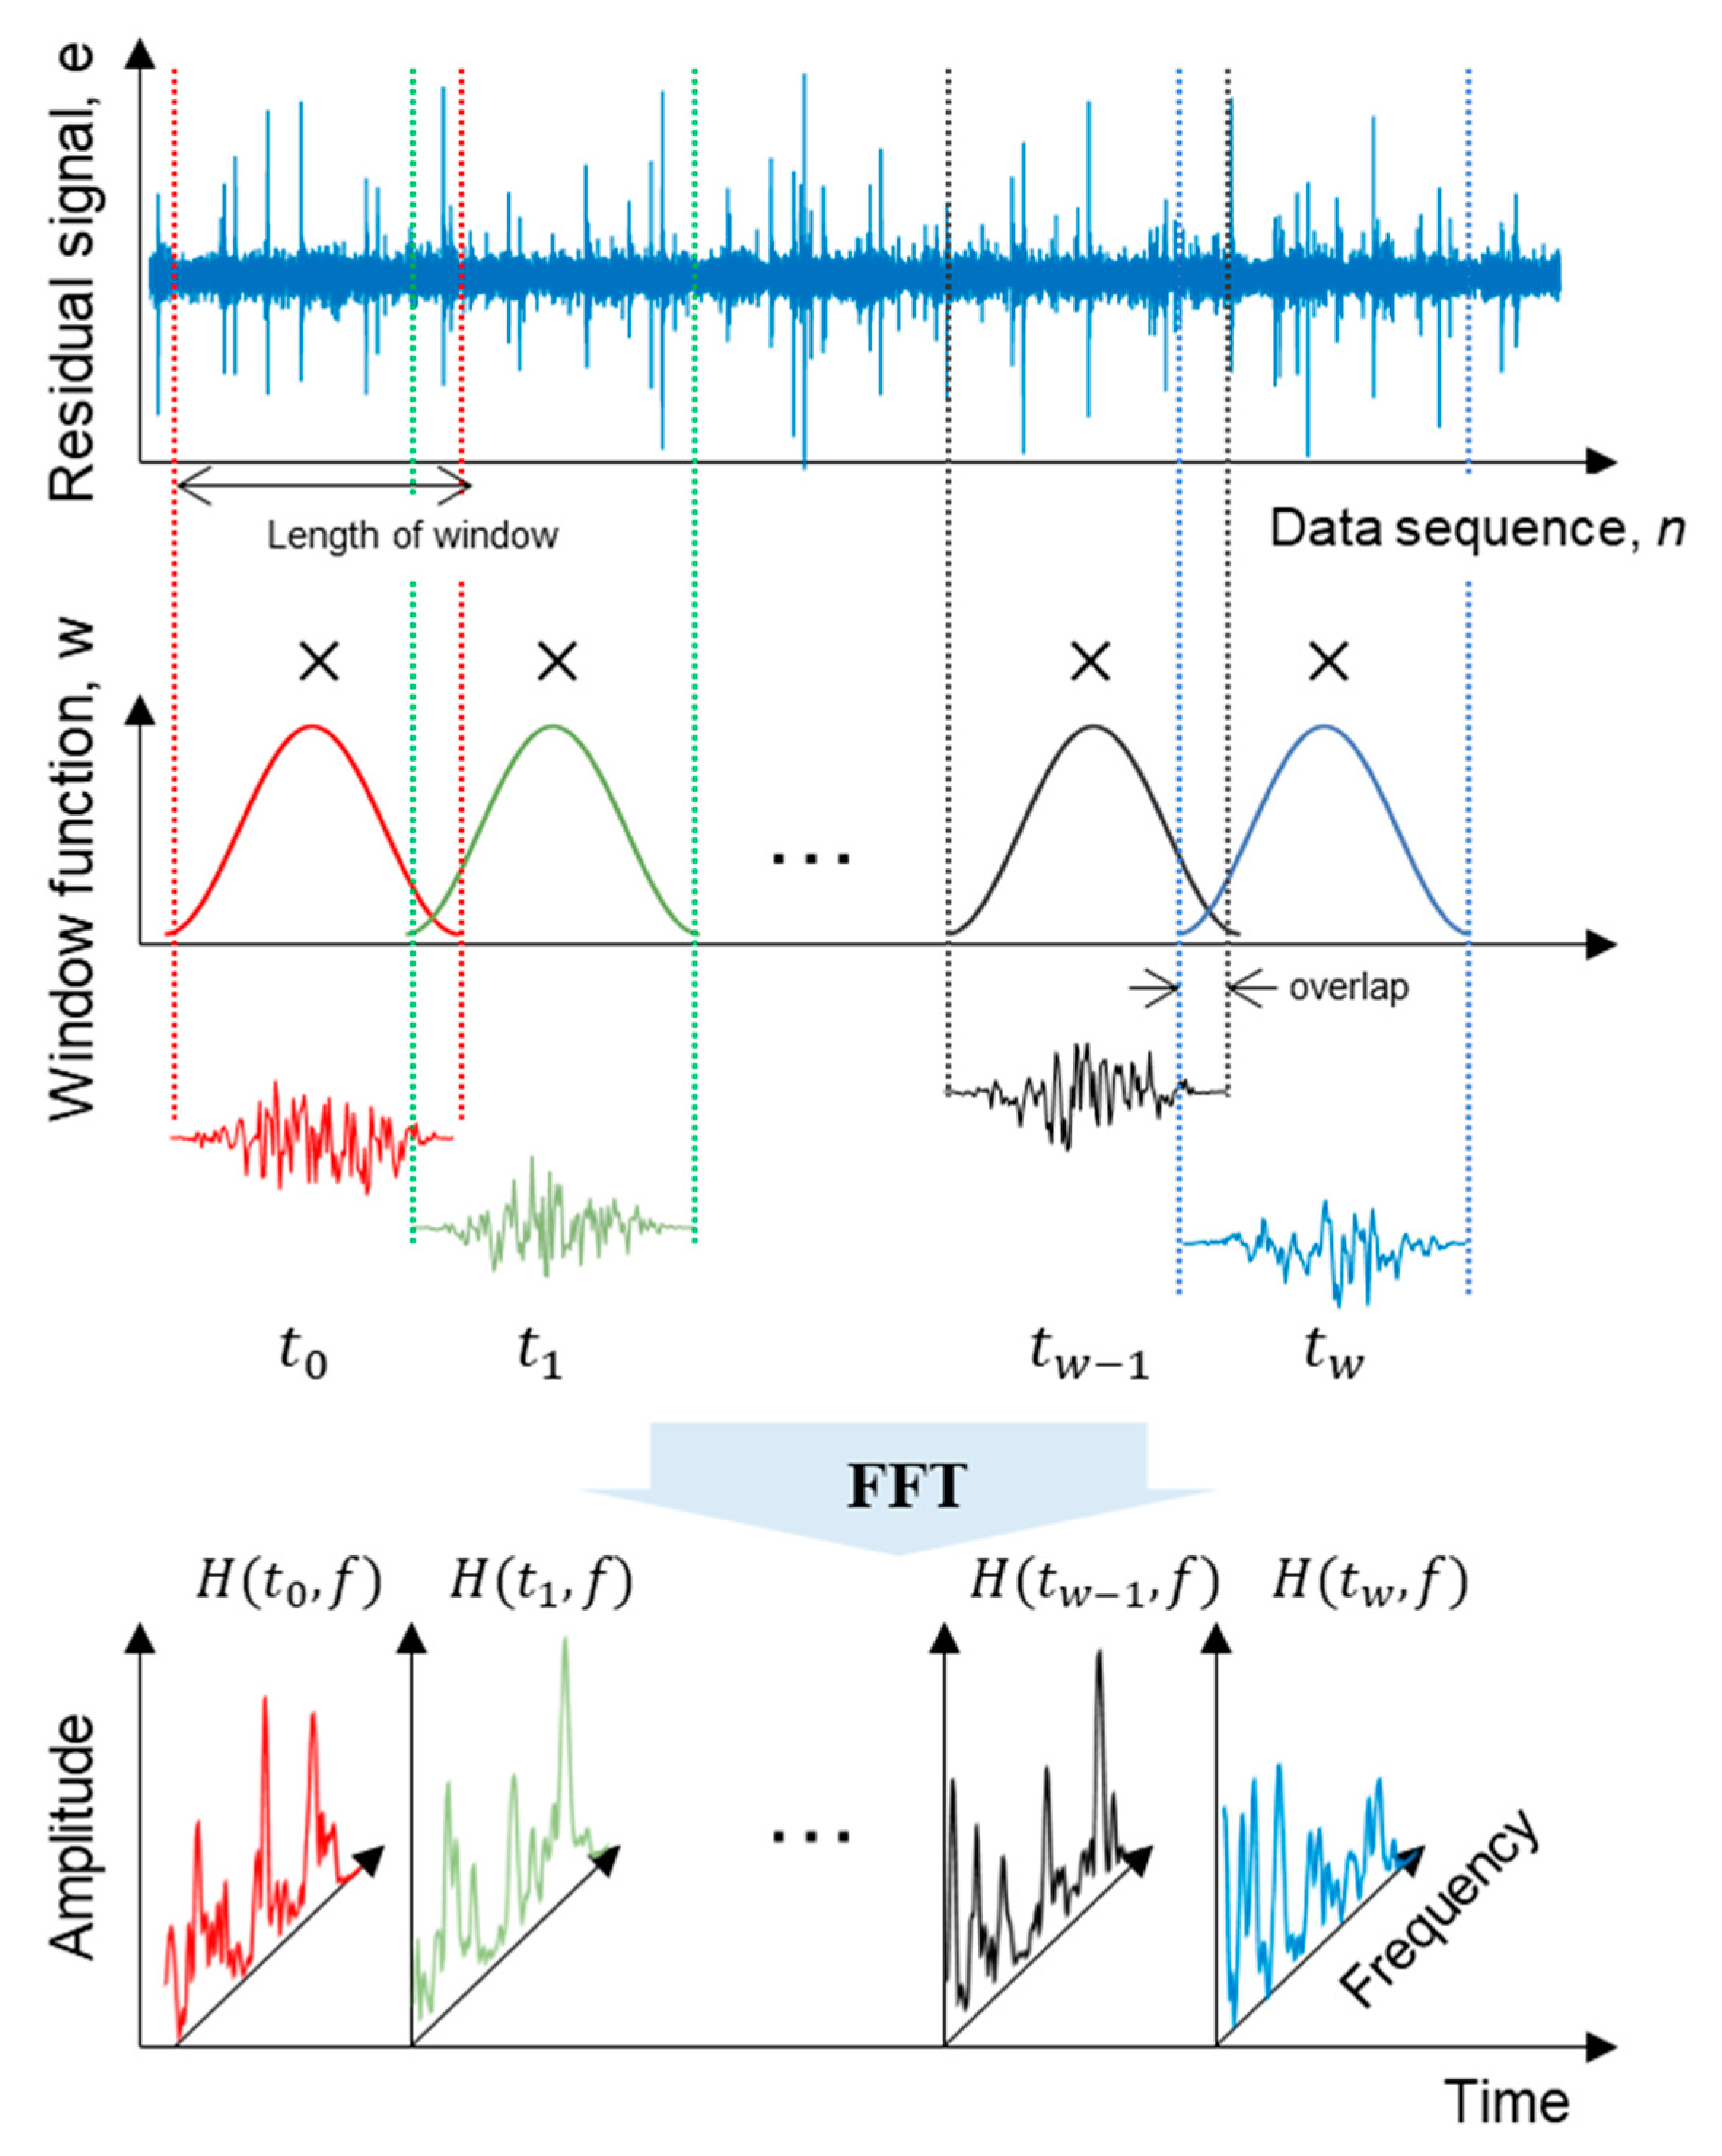
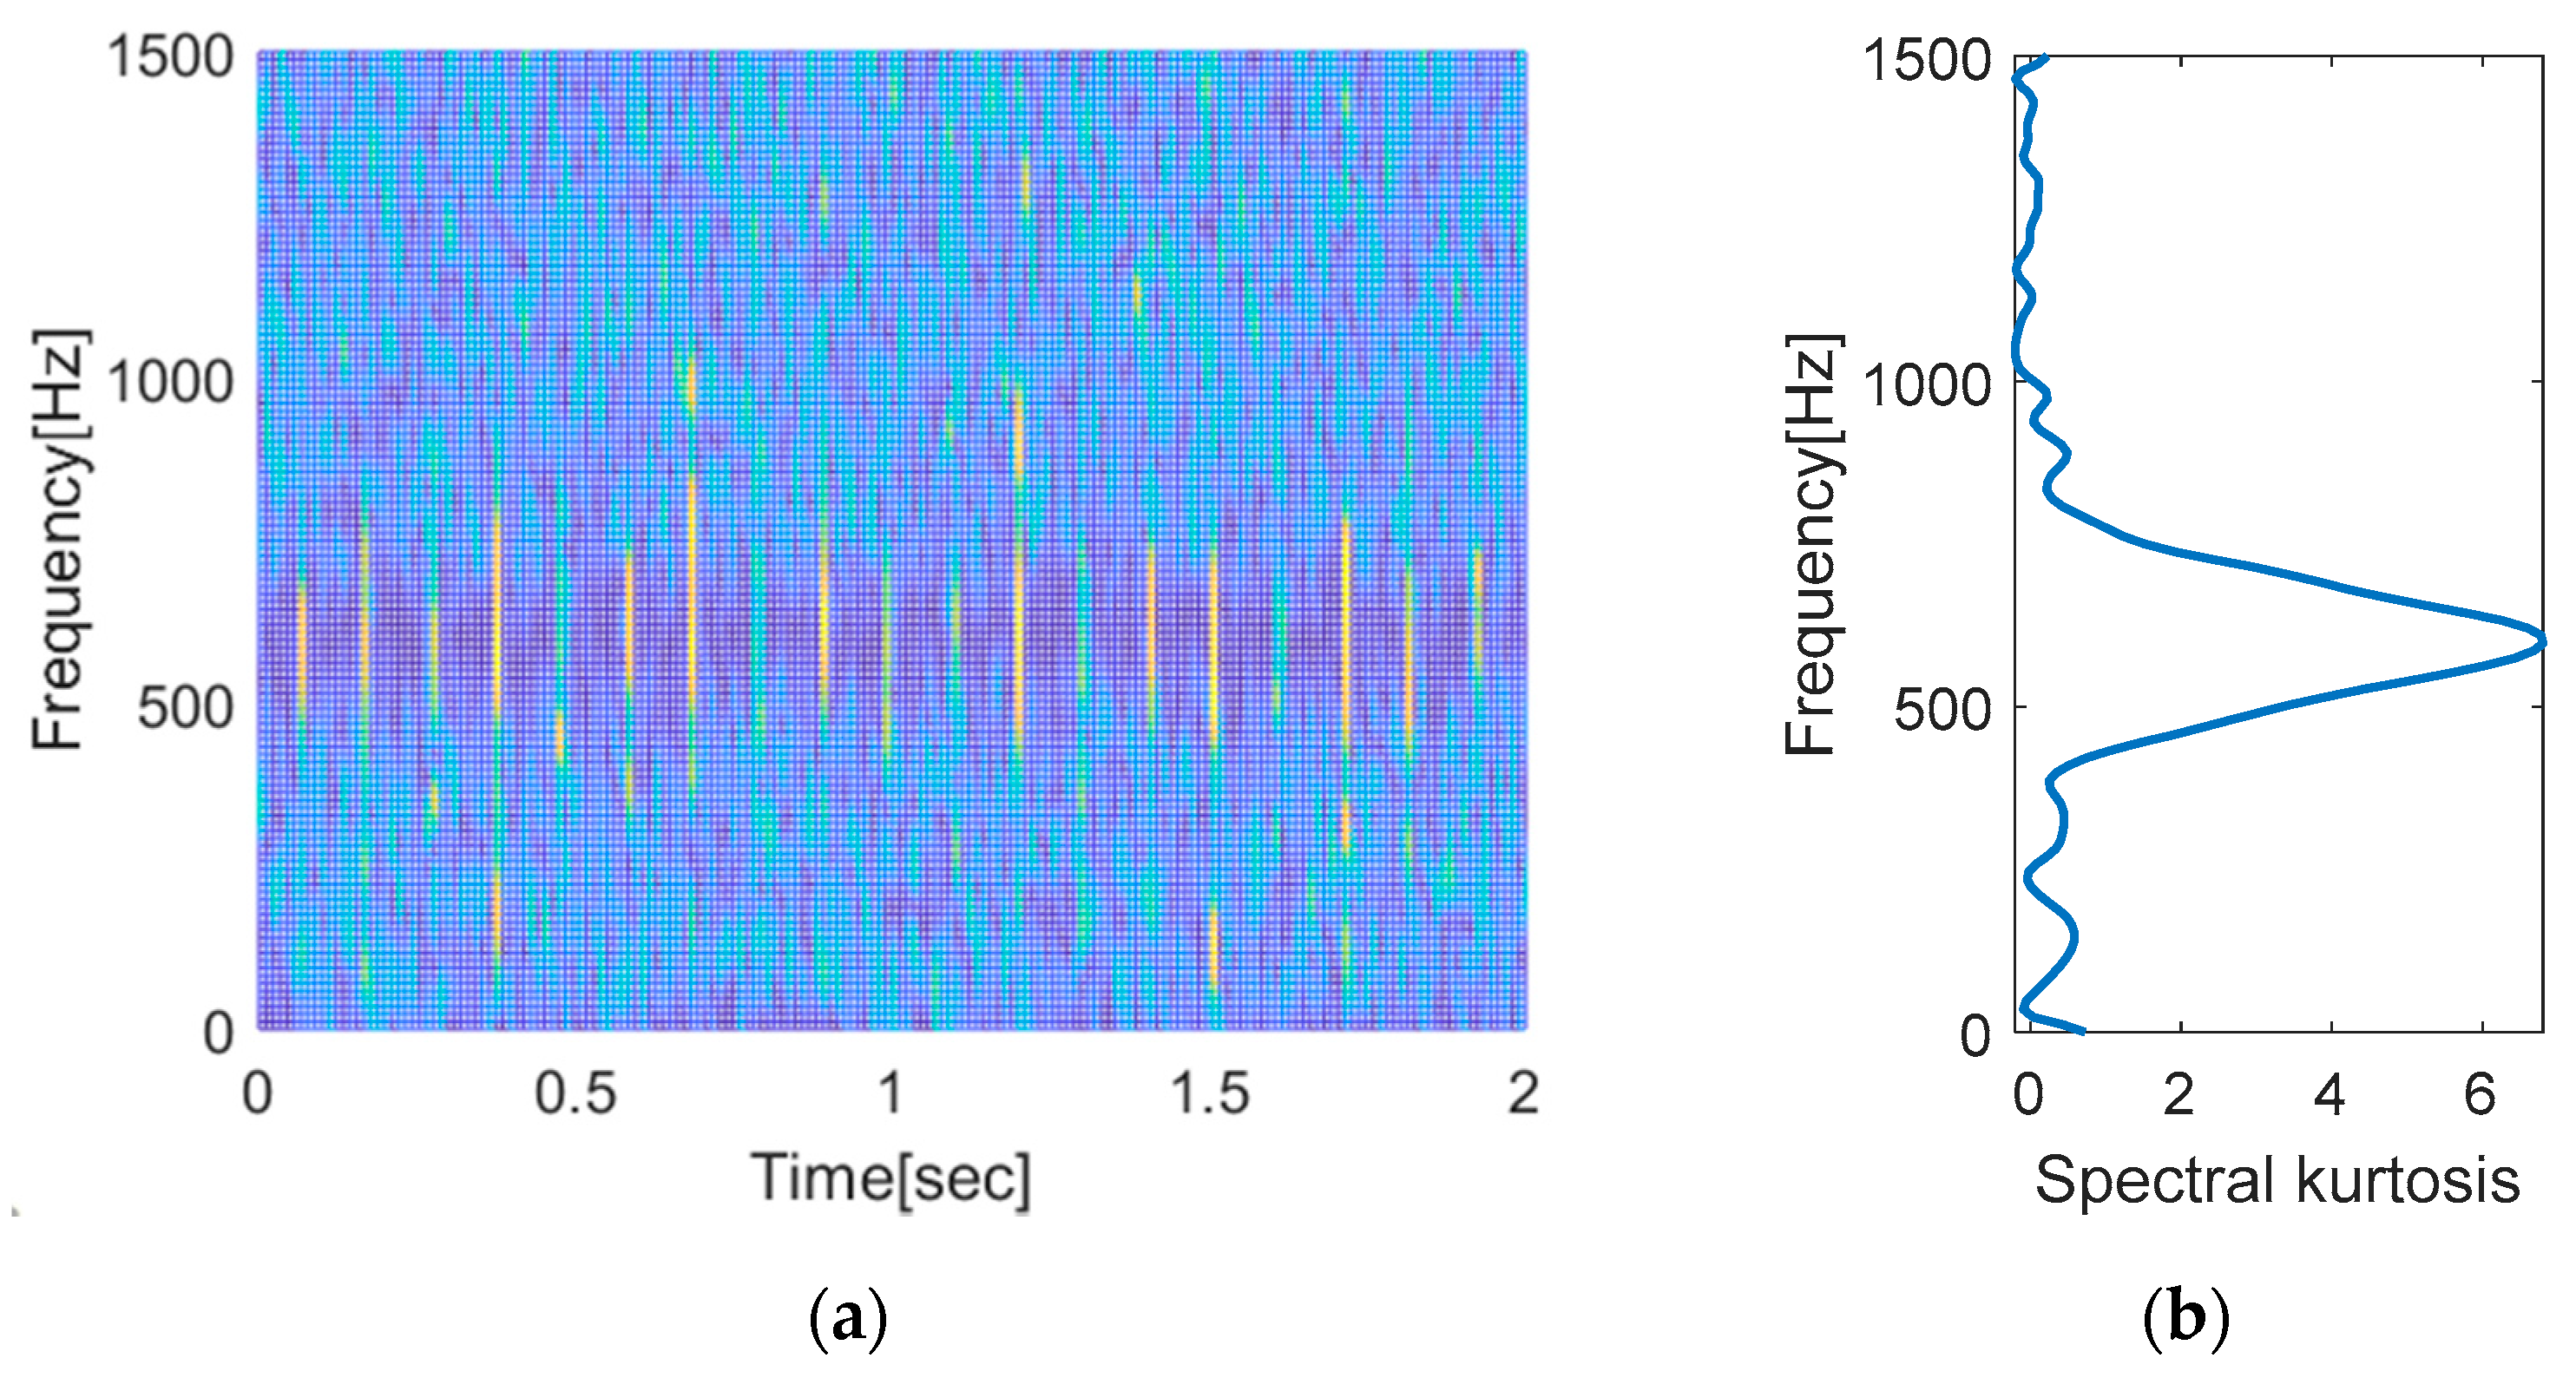
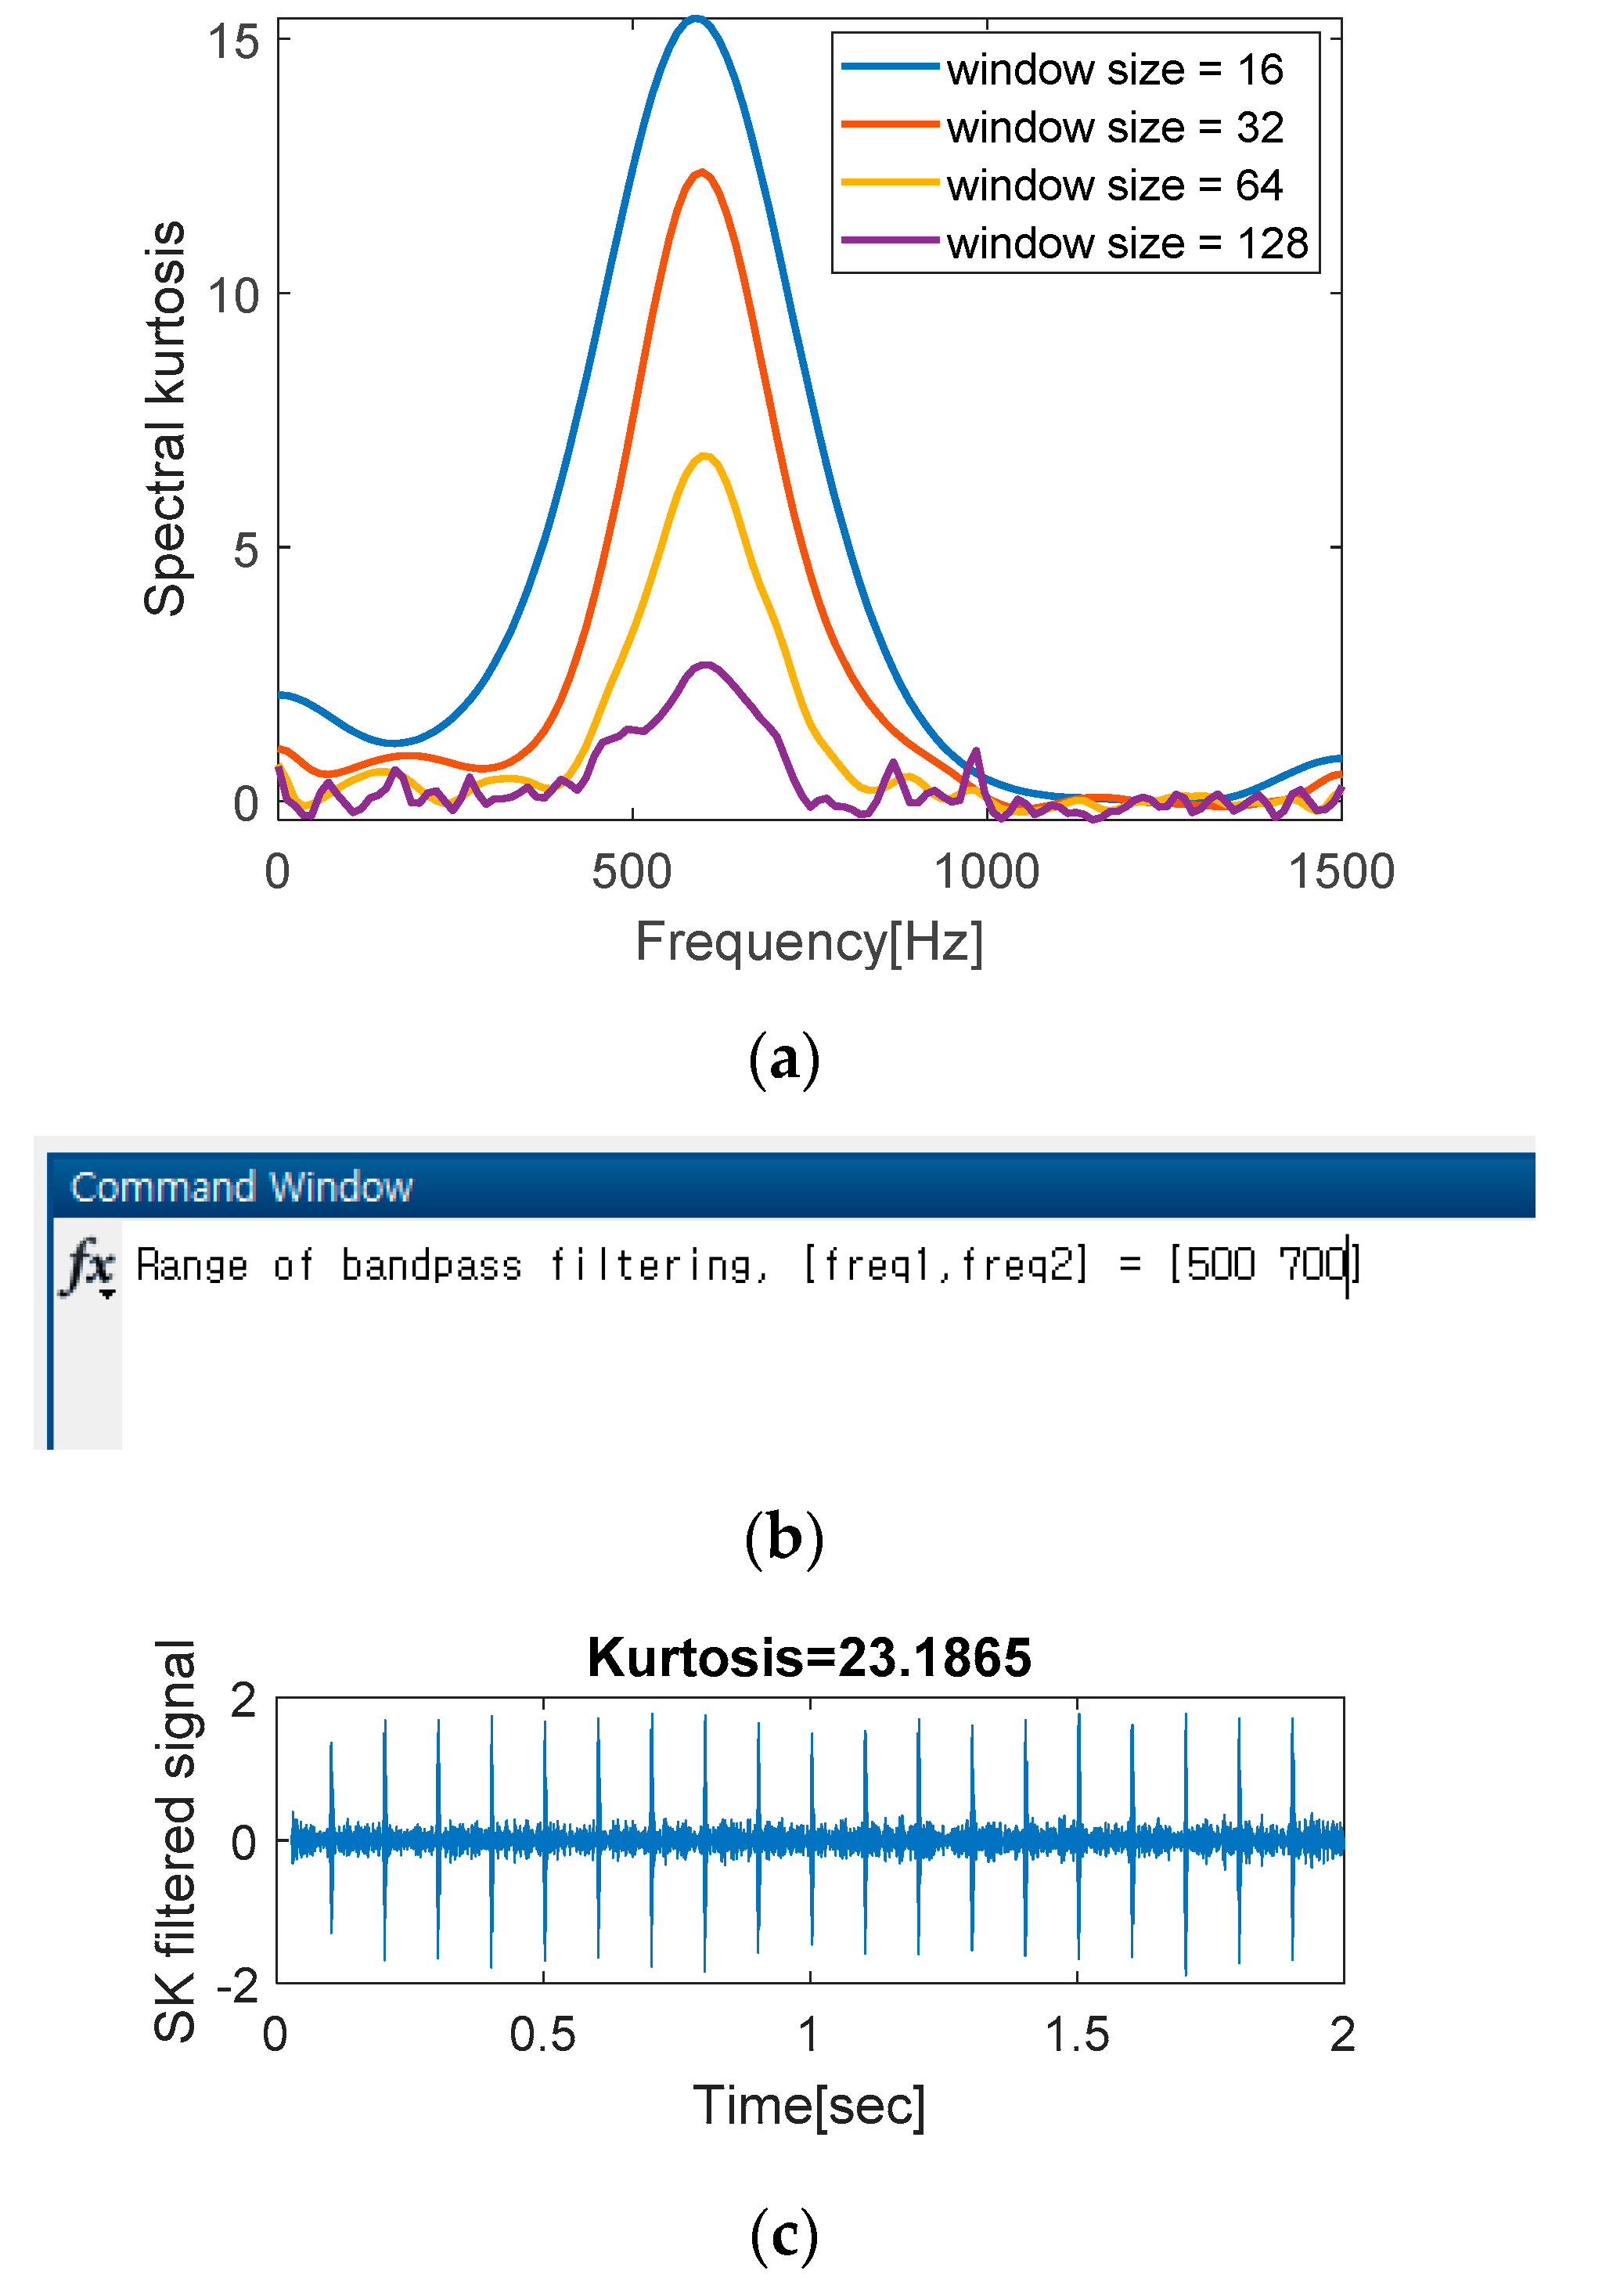
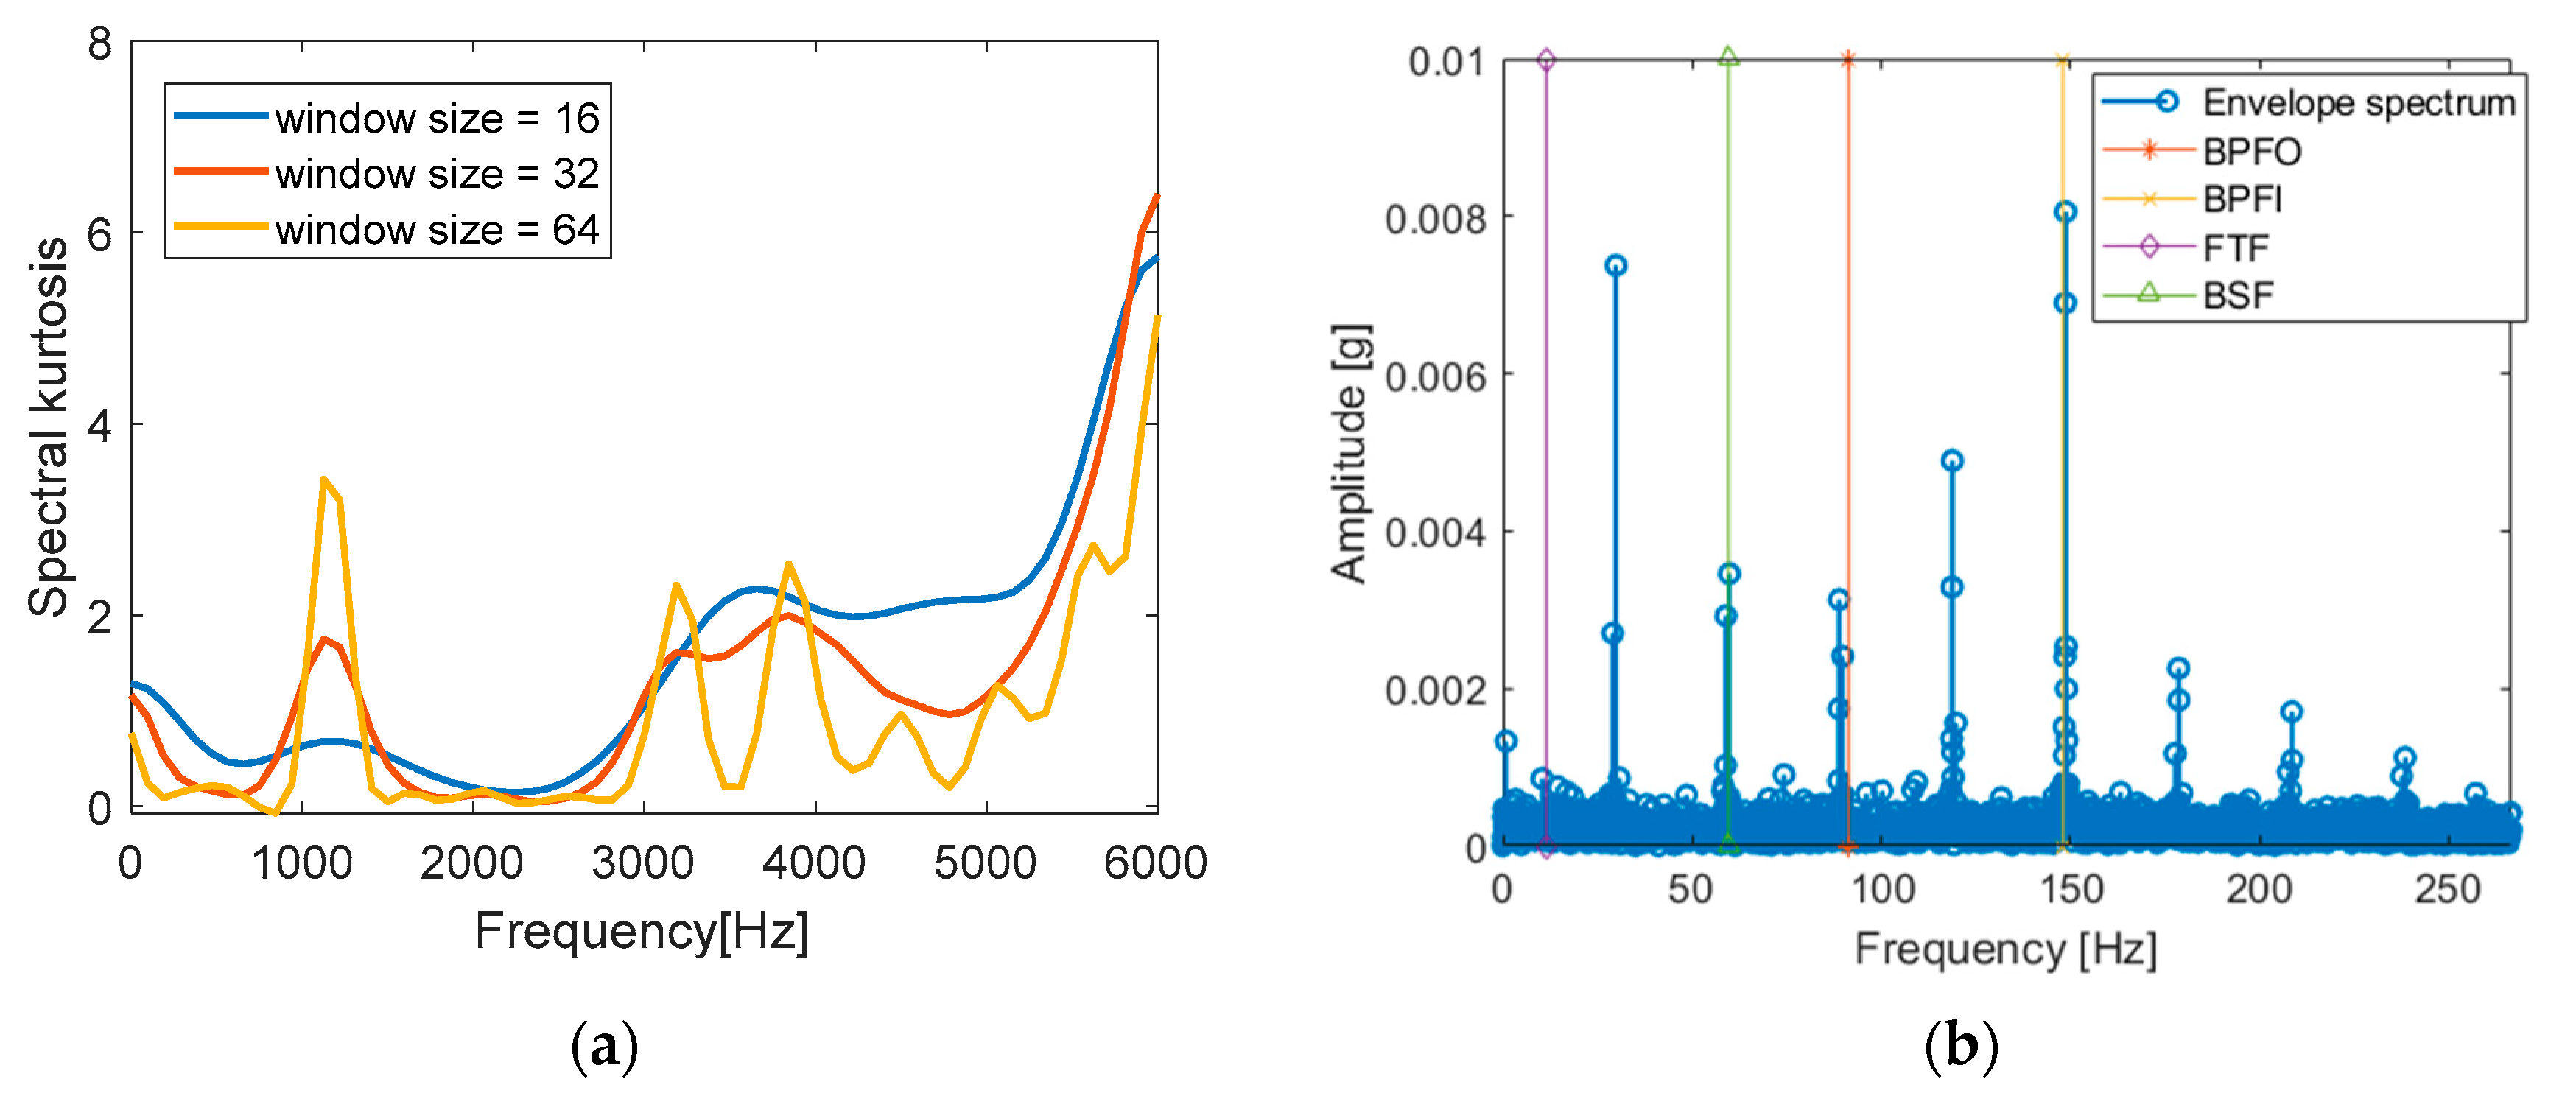
3.3. Demodulation Band Selection (Lines 23–49)
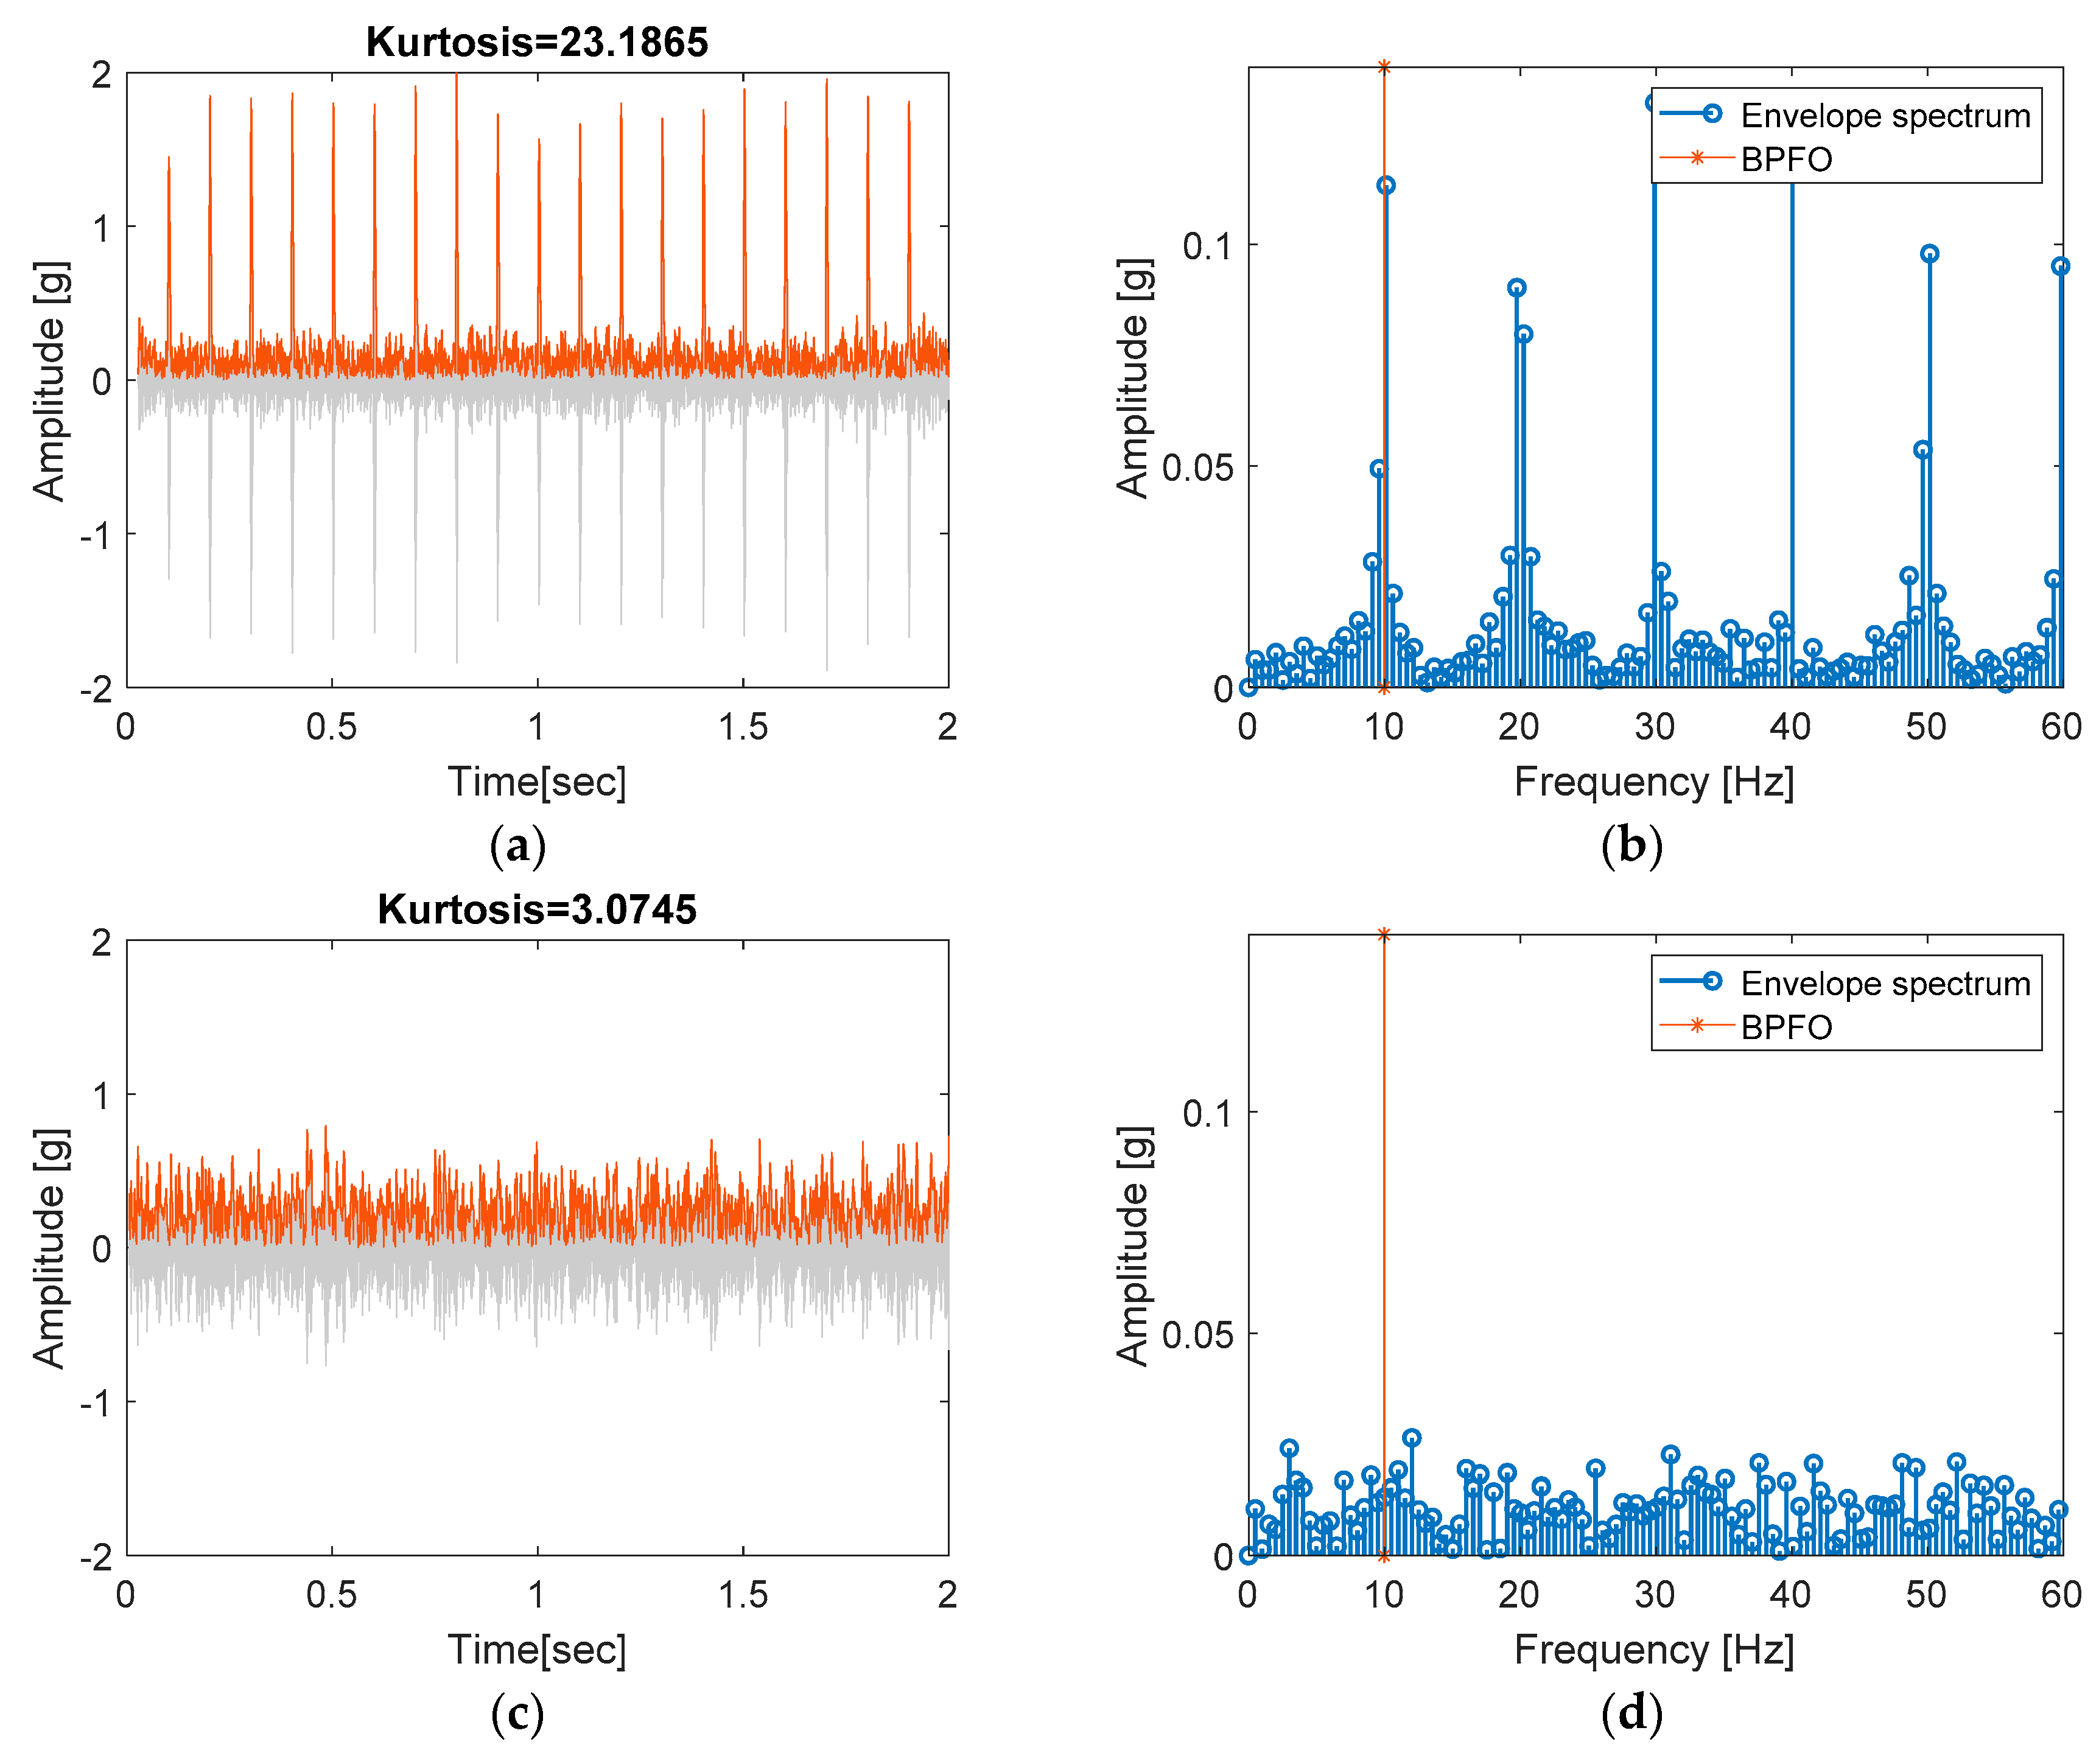
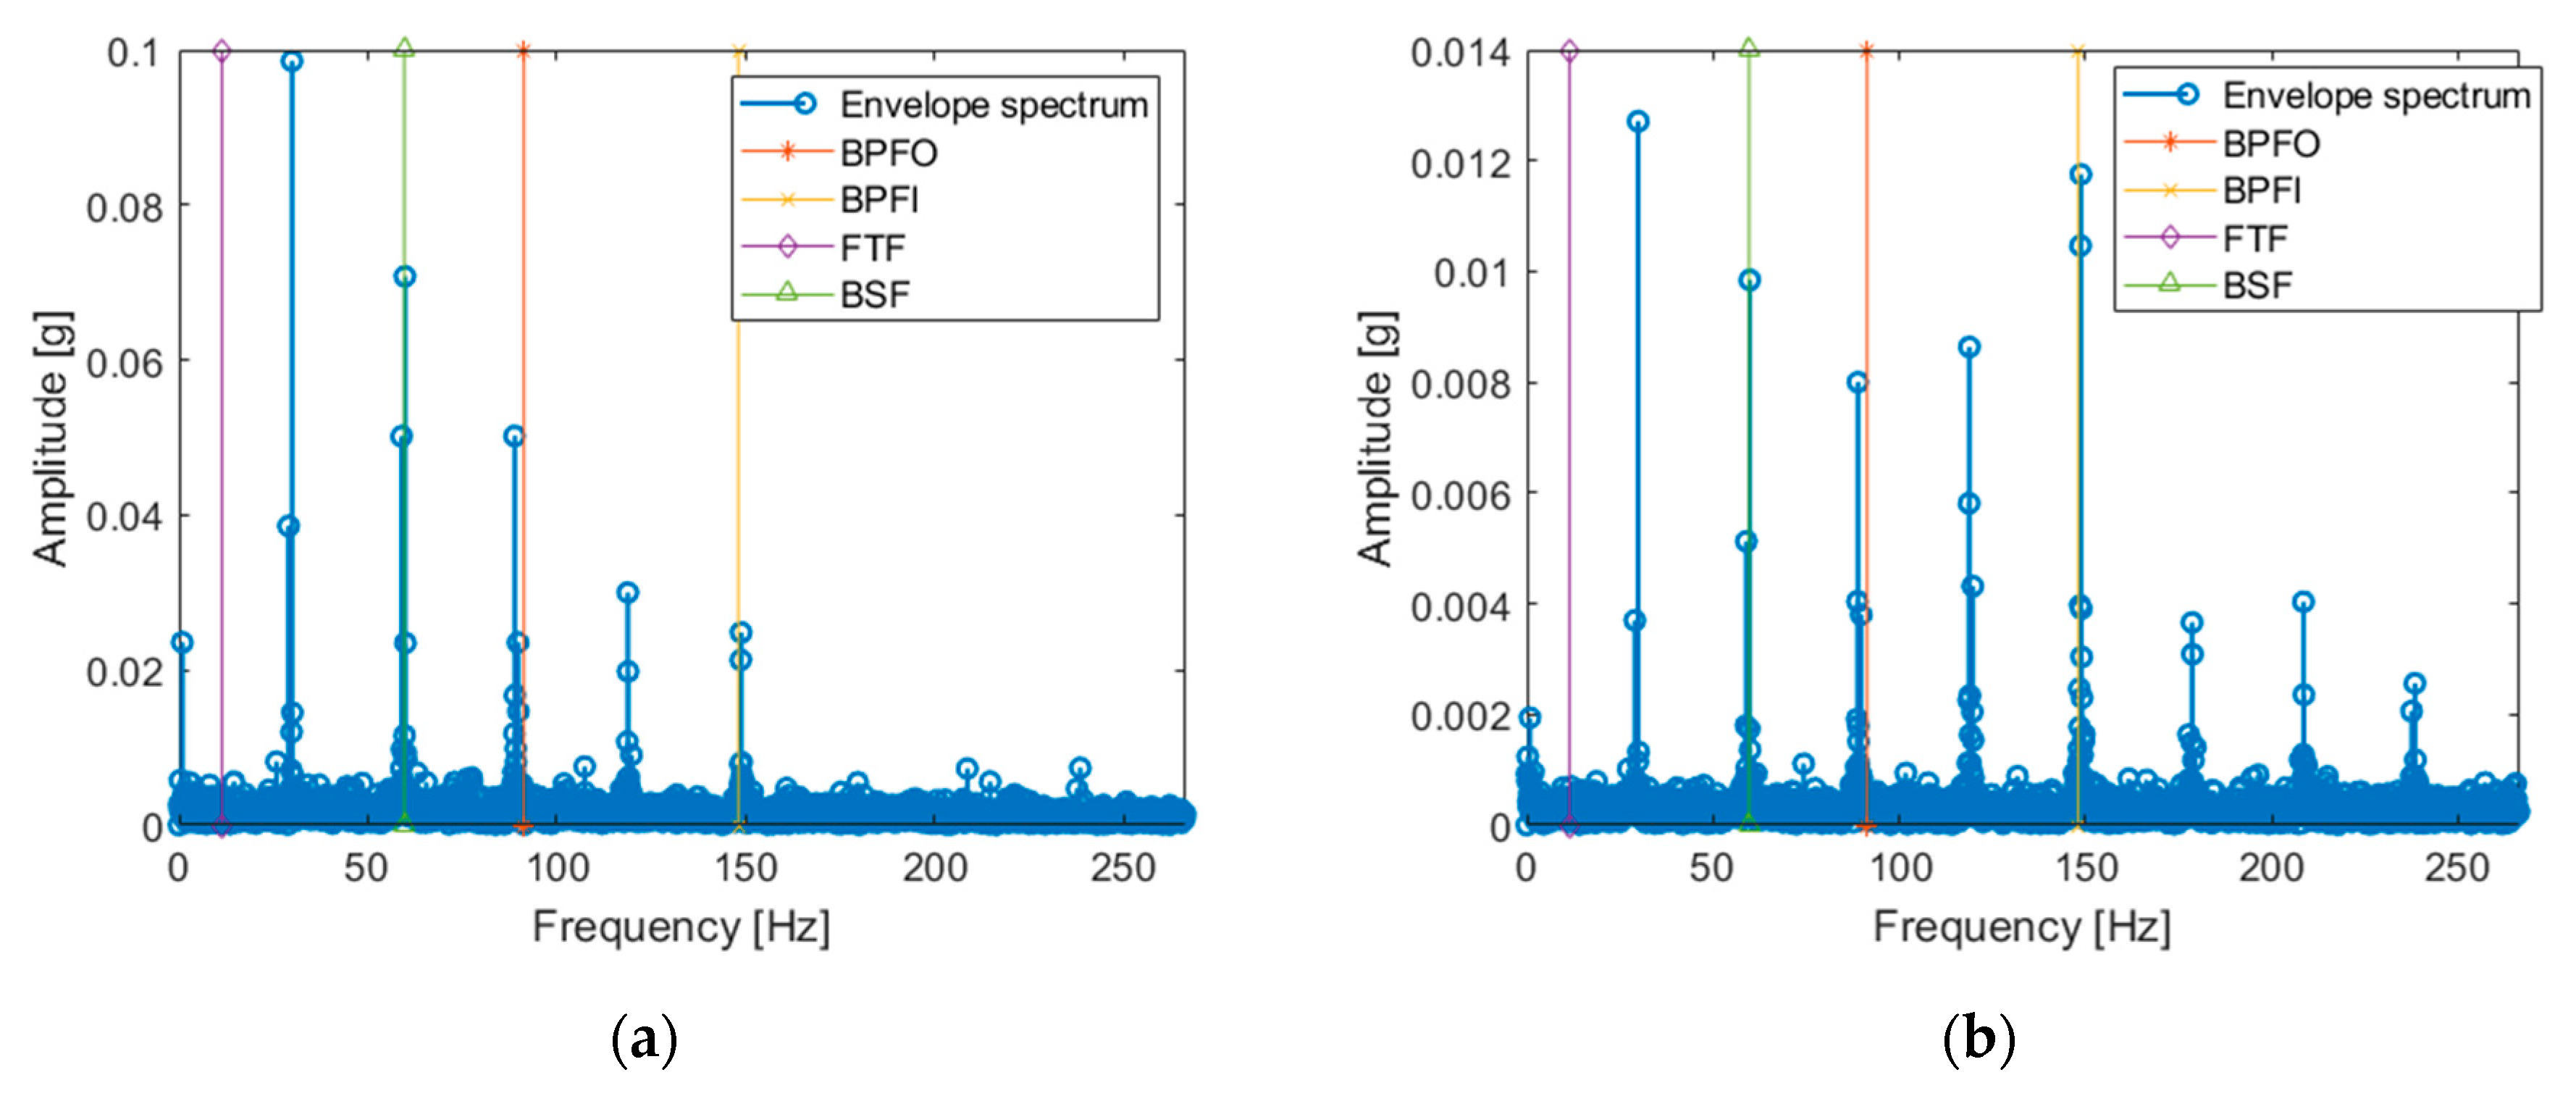
3.4. Envelope Analysis (Lines 50–64)
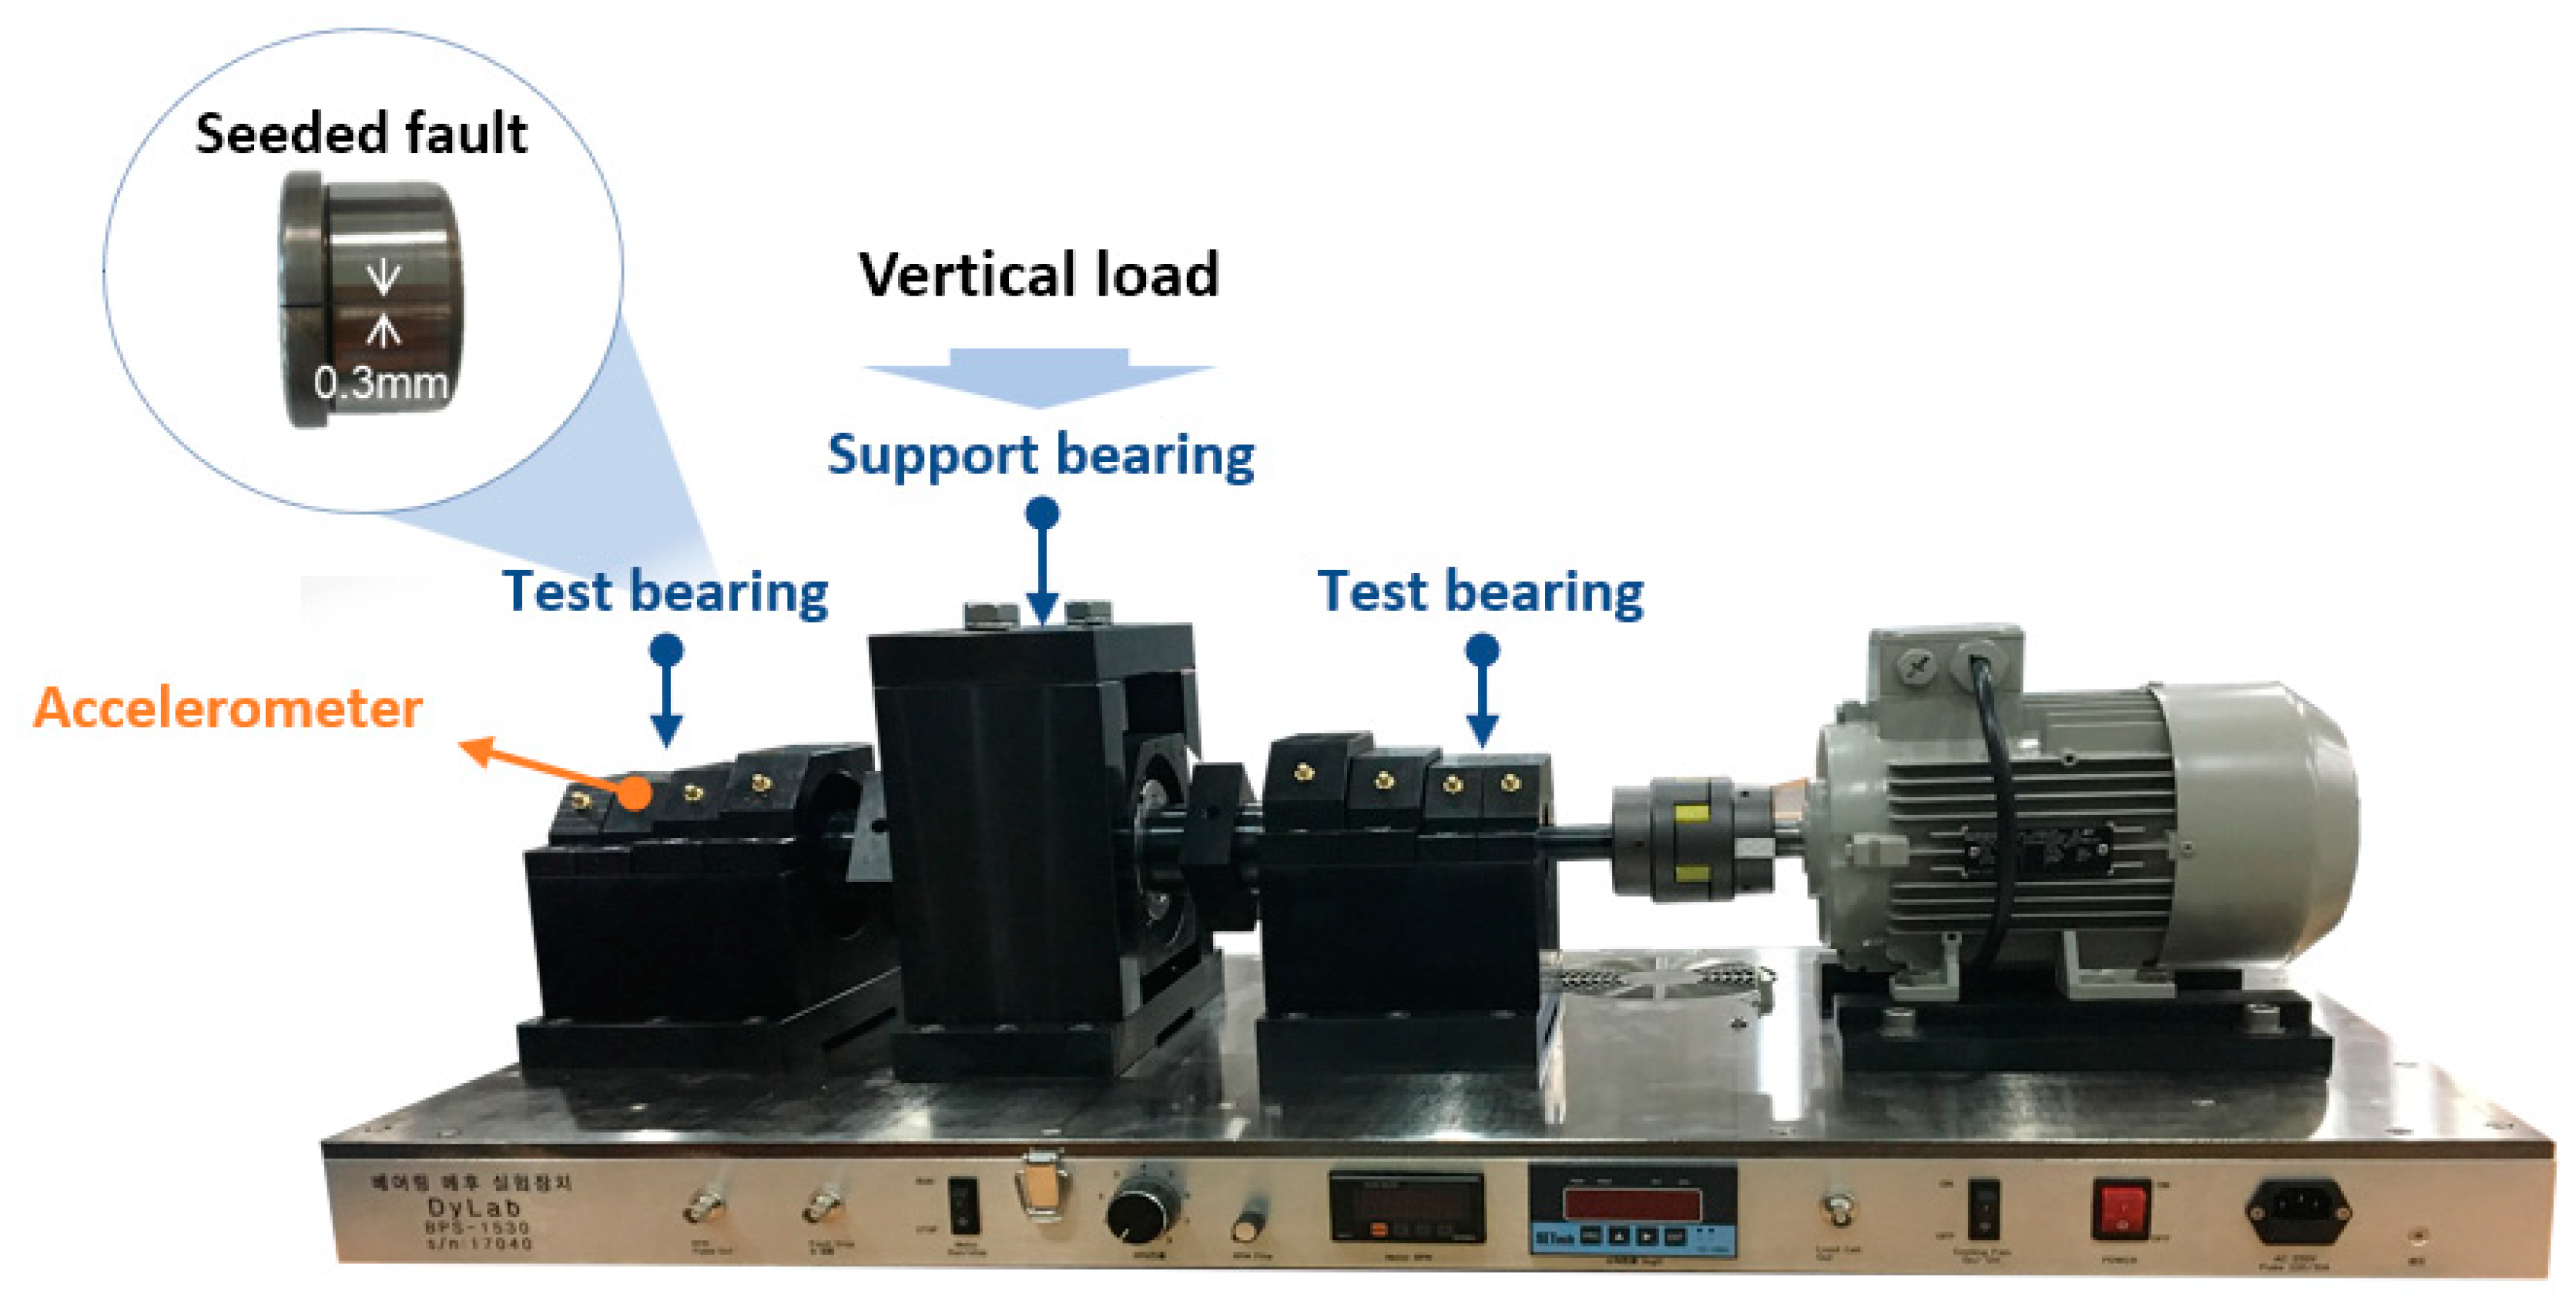
4. Diagnosis of Korea Aerospace University (KAU) Bearing Faults
- -
- Line 2: rawData = load('bearing1');
- -
- Line 3: sampRate = 51.2e3;
- -
- Line 4: rpm = 1200;
- -
- Line 5: bearFreq = [4.4423 6.5577 0.4038 5.0079]*rpm/60;
- -
- Line 6: maxP = 390;
- -
- Line 7: windLeng = [2^4 2^5 2^6 2^7 2^8].
5. Diagnosis of CWRU Bearing Faults
- -
- Line 2: rawData = load (‘bearing270’);
- -
- Line 3: sampRate = 12e3;
- -
- Line 4: rpm = 1796;
- -
- Line 5: bearFreq = [3.053 4.947 0.382 1.994]*rpm/60;
- -
- Line 6: maxP = 82;
- -
- Line 7: windLeng = [2^4 2^5 2^6].
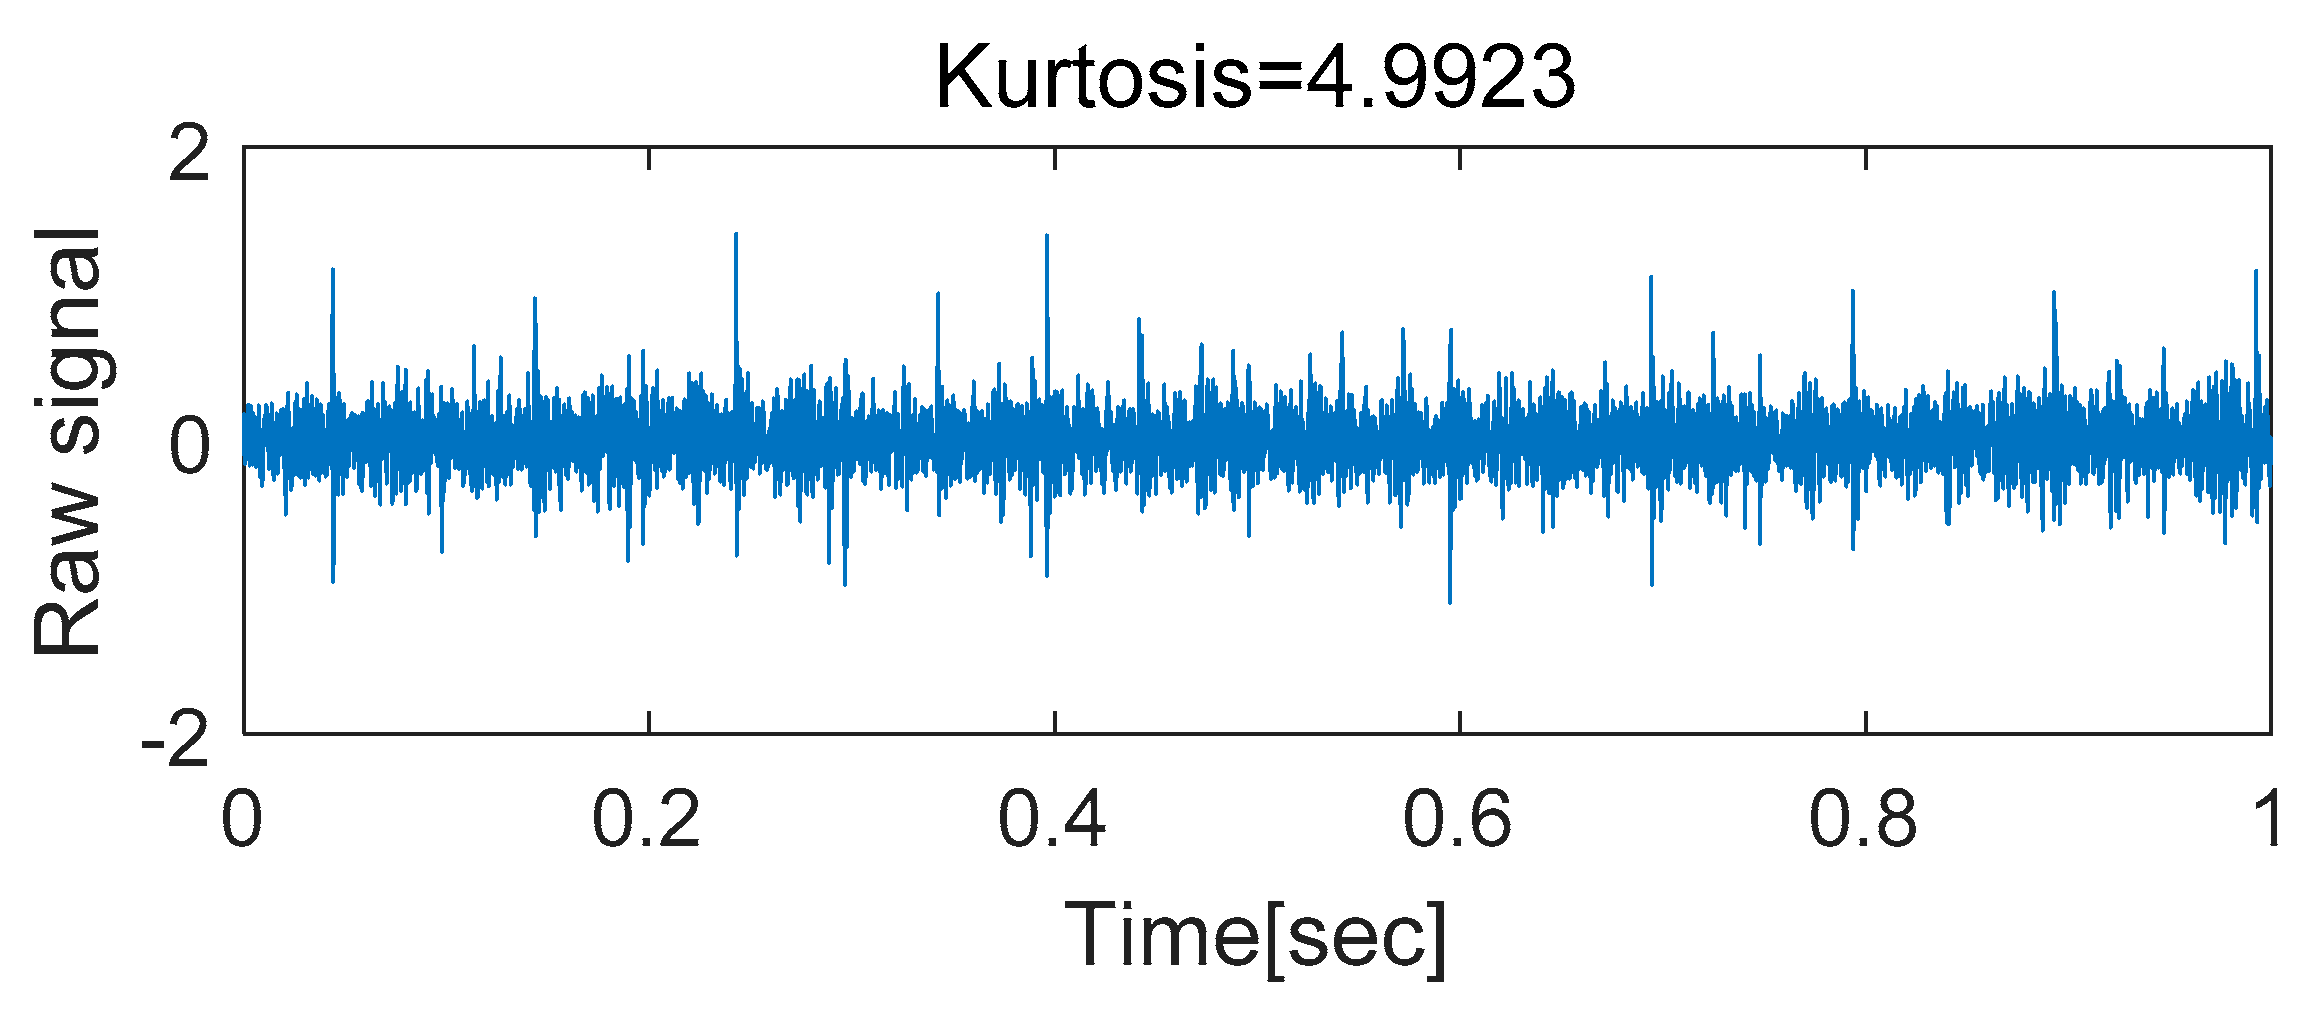
- aX = hilbert(rawData.vib); %=== (a) Raw signal
- envel = abs(aX);
- envel = envel-mean(envel);
- fftEnvel = abs(fft(envel))/Ne*2;
- fftEnvel = fftEnvel(1:ceil(N/2));
- freq = (0:Ne-1)/Ne*sampRate;
- freq = freq(1:ceil(N/2));
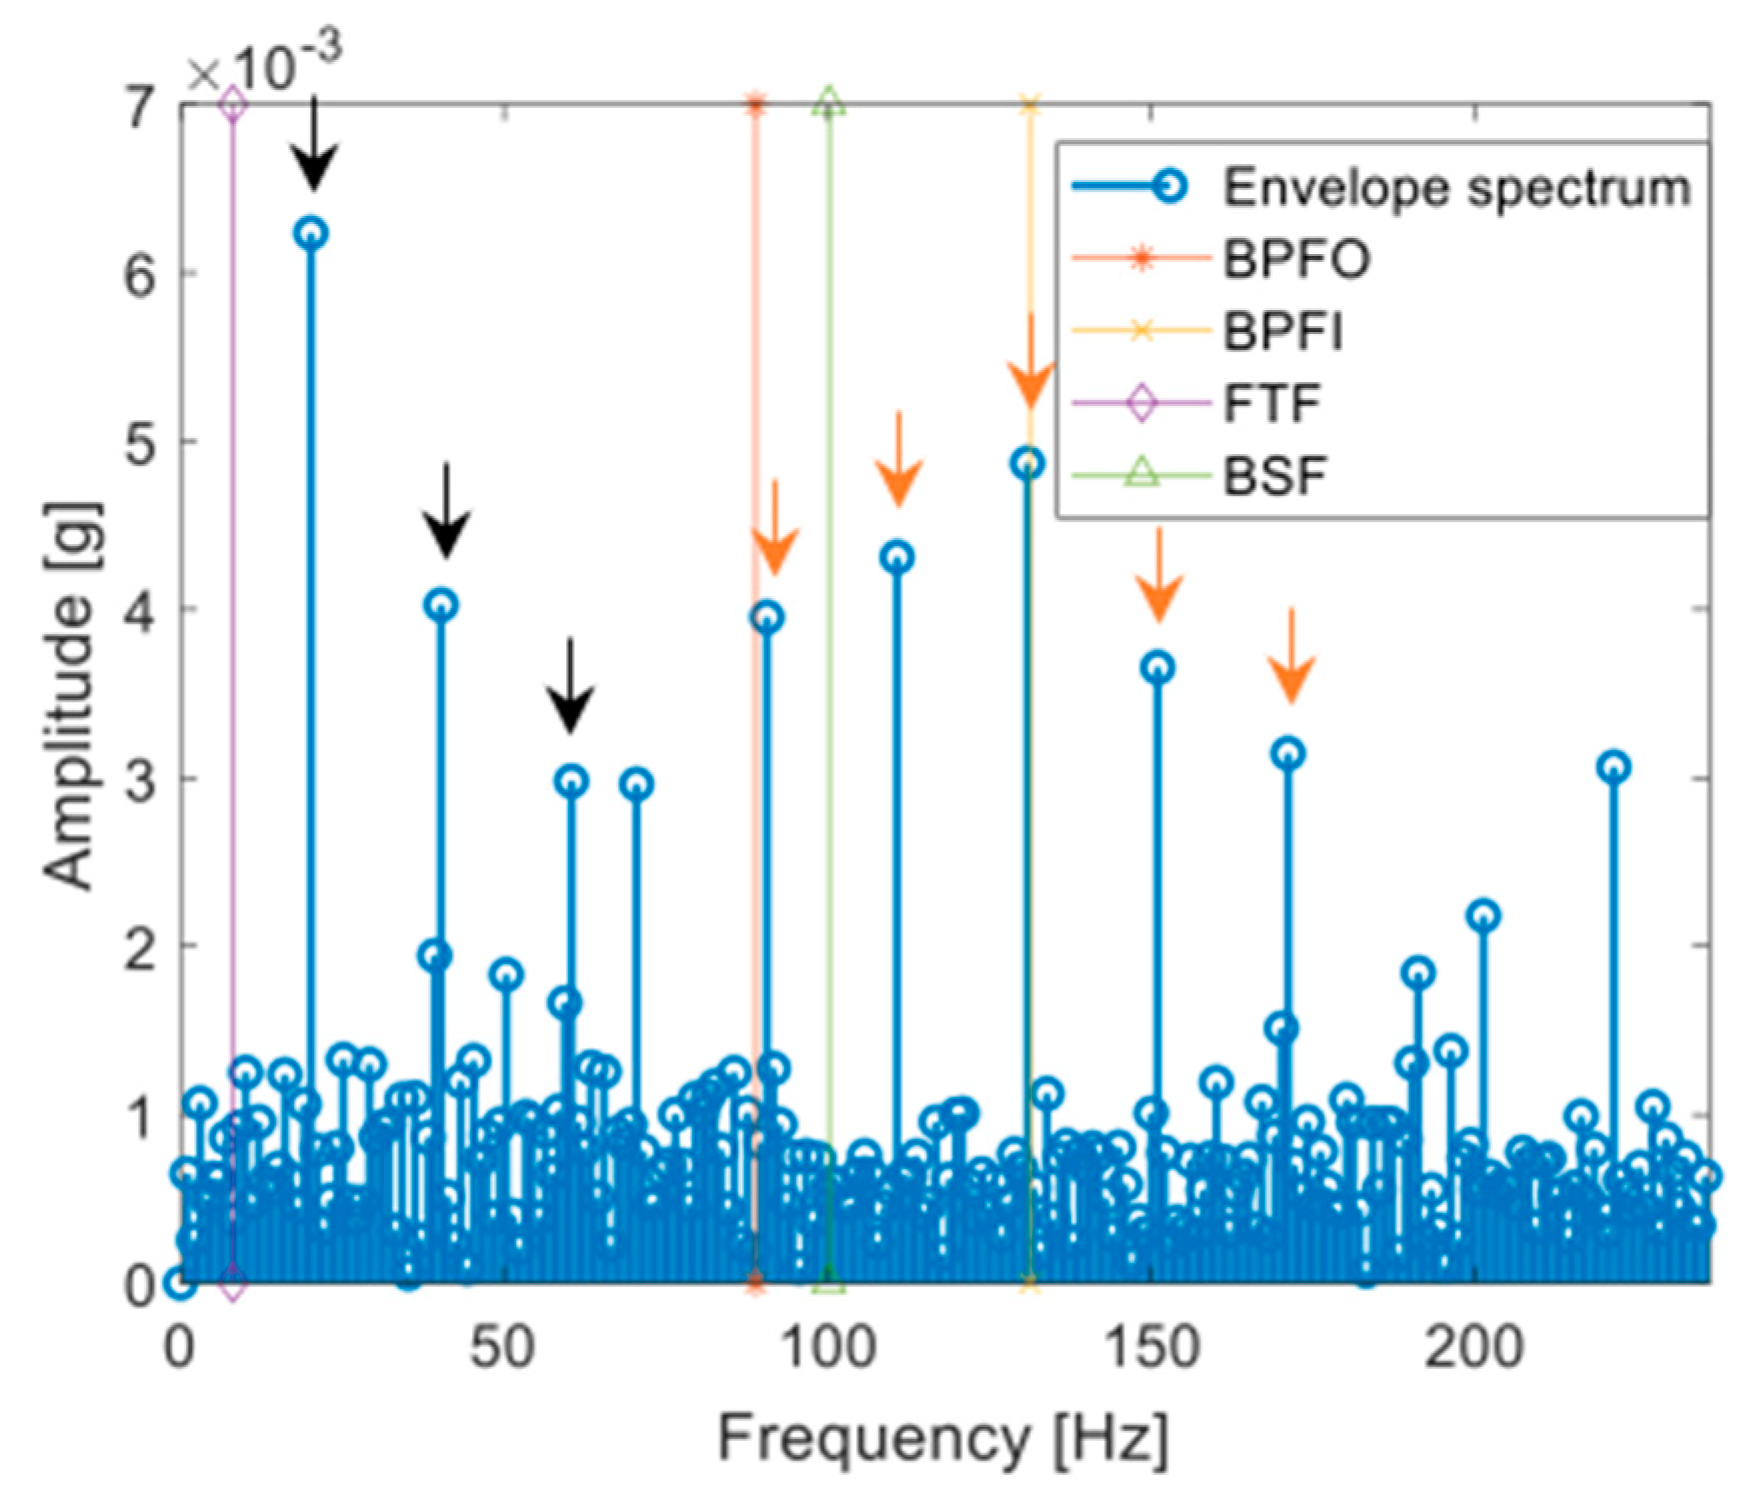
- figure(3)
- stem(freq,fftEnvel,’LineWidth’,1.5); hold on;
- [xx,yy] = meshgrid(bearFreq,ylim);
- plot(xx(:,1),yy(:,1),’*-’,xx(:,2),yy(:,2),’x-’,xx(:,3),yy(:,3),’d-’,xx(:,4),yy(:,4),’^-’)
- legend(‘Envelope spectrum’,’BPFO’,’BPFI’,’FTF’,’BSF’);
- xlabel(‘Frequency [Hz]’); ylabel(‘Amplitude[g]’); xlim([0 max(bearFreq)*1.8])
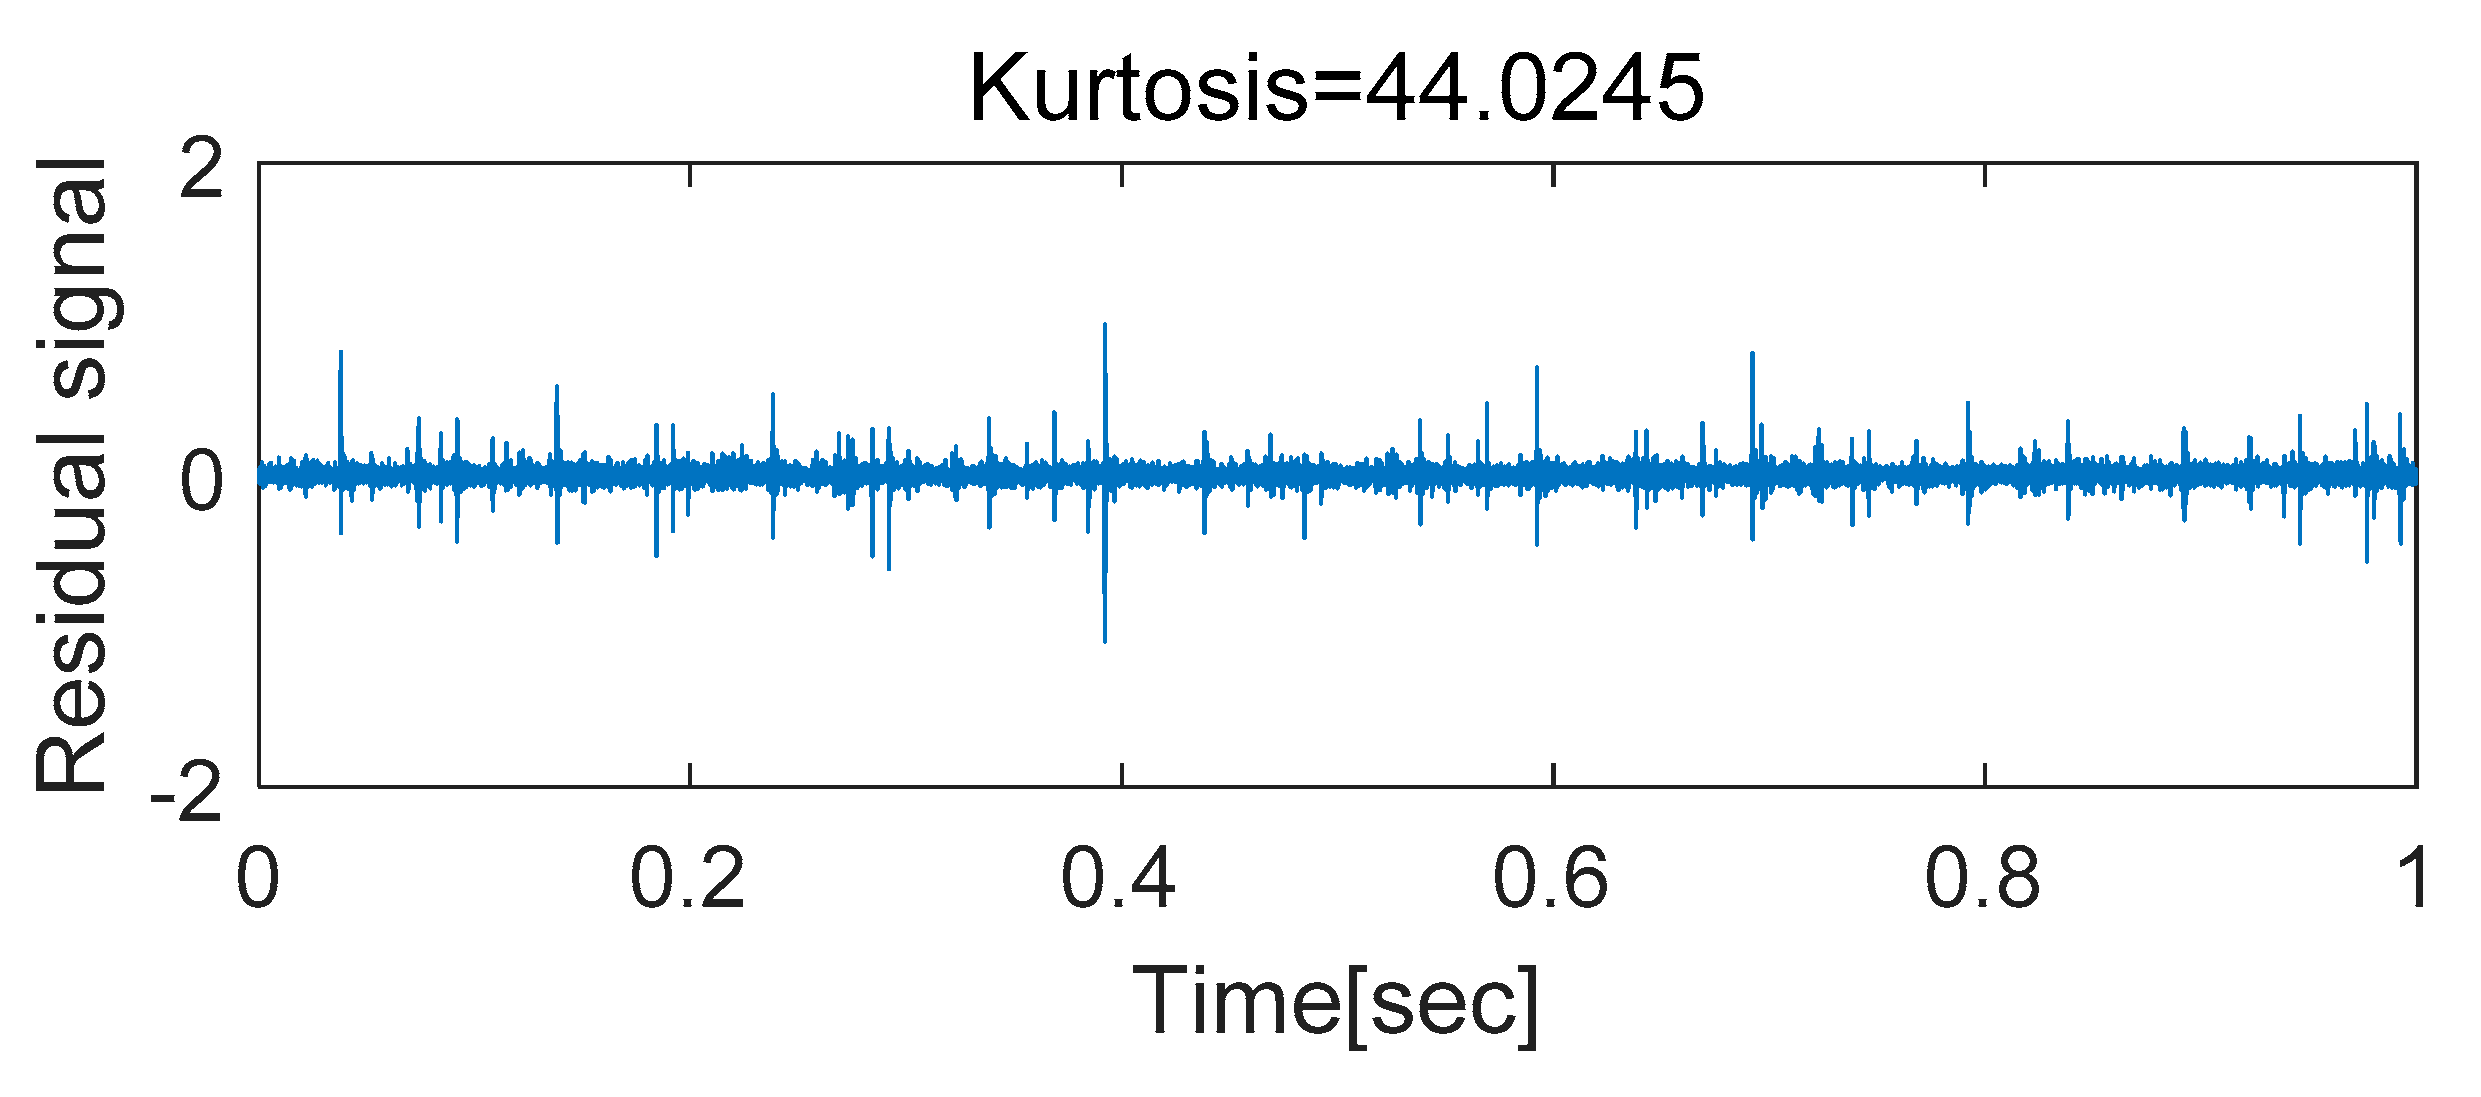
- aX = hilbert(e); %=== (b) Residual signal
- envel = abs(aX);
- envel = envel-mean(envel);
- fftEnvel = abs(fft(envel))/Ne*2;
- fftEnvel = fftEnvel(1:ceil(N/2));
- figure(4)
- stem(freq,fftEnvel,’LineWidth’,1.5); hold on;
- [xx,yy] = meshgrid(bearFreq,ylim);
- plot(xx(:,1),yy(:,1),’*-’,xx(:,2),yy(:,2),’x-’,xx(:,3),yy(:,3),’d-’,xx(:,4),yy(:,4),’^-’)
- legend(‘Envelope spectrum’,’BPFO’,’BPFI’,’FTF’,’BSF’);
- xlabel(‘Frequency [Hz]’); ylabel(‘Amplitude [g]’); xlim([0 max(bearFreq)*1.8])
6. Conclusions
Author Contributions
Funding
Acknowledgments
Conflicts of Interest
Appendix A. Bearing Fault Simulation
        %% Bearing fault simulation signal
        % Parameter setting ===================================================
        fr = 600; % Carrier signal
        fd = 13; % discrete signal
        ff = 10; % Characteristic frequency(Modulating signal)
        a = 0.02; % Damping ratio
        T = 1/ff; % Cyclic period
        fs = 3e3; % Sampling rate
        K = 50; % Number of impulse signal
        t = 1/fs:1/fs:2; % Time
        A=5; % Maximum amplitude
        noise = 0.5;
        %=====================================================================
        for k = 0 : K-1
           for i = 1 : length(t)
                  if t(i)-k*T>=0
                  x1(i) = A*exp(-a*2*pi*fr.*(t(i)-k*T));
                  x2(i) = sin(2*pi*fr.*(t(i)-k*T));
                       x3(i) = x1(i).*x2(i);
        end;end;end
        x5 = normrnd(0,noise,1,length(x3));
        x4 = 2*sin(2*pi.*t.*fd);
        vib = x3 + x4 + x5;
        save(‘Simulation’,’vib’,’t’)
Appendix B. Bearing Fault Diagnosis
        1 %======================PROBLEM DEFINITION ===========================
        2 rawData = load(‘Simulation’); % Data load
        3 sampRate = 3e3; % Sampling rate (Hz)
        4 rpm = 60; % Shaft rotating speed
        5 bearFreq = [10]*rpm/60; % BPFO, BPFI, FTF, BSF
        6 maxP = 300; % Maximum order of AR model
        7 windLeng = [2^4 2^5 2^6 2^7]; % Window length of STFT
        8 %==============Discrete signal separation (AR model) ==================
        9 x=rawData.vib(:); N=length(x);
        10 for p = 1 : maxP
        11    if rem(p,50)==0; disp([‘p=‘ num2str(p)]); end
        12    a = aryule(x,p); % aryule returns the AR model parameter, a(k)
        13    X = zeros(N,p);
        14    for i = 1 : p; X(i+1:end,i) = x(1:N-i); end
        15    xp = -X*a(2:end)’;
        16    e = x-xp;
        17    tempKurt(p,1) = kurtosis(e(p+1:end));
        18 end
        19 optP = find(tempKurt==max(tempKurt)); %==== Optimum solution
        20 optA = aryule(x,optP);
        21 xp = filter([0 -optA(2:end)],1,x);
        22 e = x(optP+1:end) - xp(optP+1:end); % residual signal
        23 %============Demodulation band selection (STFT & SK) =================
        24 Ne = length(e);
        25 numFreq = max(windLeng)+1;
        26 for i = 1 : length(windLeng)
        27    windFunc = hann(windLeng(i )); %==== Short Time Fourier Transform
        28    numOverlap = fix(windLeng(i)/2);
        29    numWind = fix((Ne-numOverlap)/(windLeng(i)-numOverlap));
        30    n = 1:windLeng(i);
        31    STFT=zeros(numWind,numFreq);
        32    for t = 1 : numWind
        33        stft = fft(e(n).*windFunc, 2*(numFreq-1));
        34        stft = abs(stft(1:numFreq))/windLeng(i)/sqrt(mean(windFunc.^2))*2;
        35     STFT(t,:) = stft’;
        36     n = n + (windLeng(i)-numOverlap);
        37    end
        38    for j = 1 : numFreq %==== Spectral Kurtosis
        39        specKurt(i,j) = mean(abs(STFT(:,j)).^4)./mean(abs(STFT(:,j)).^2).^2-2;
        40    end
        41    lgd{i} = [‘window size = ‘,num2str(windLeng(i))];
        42 end
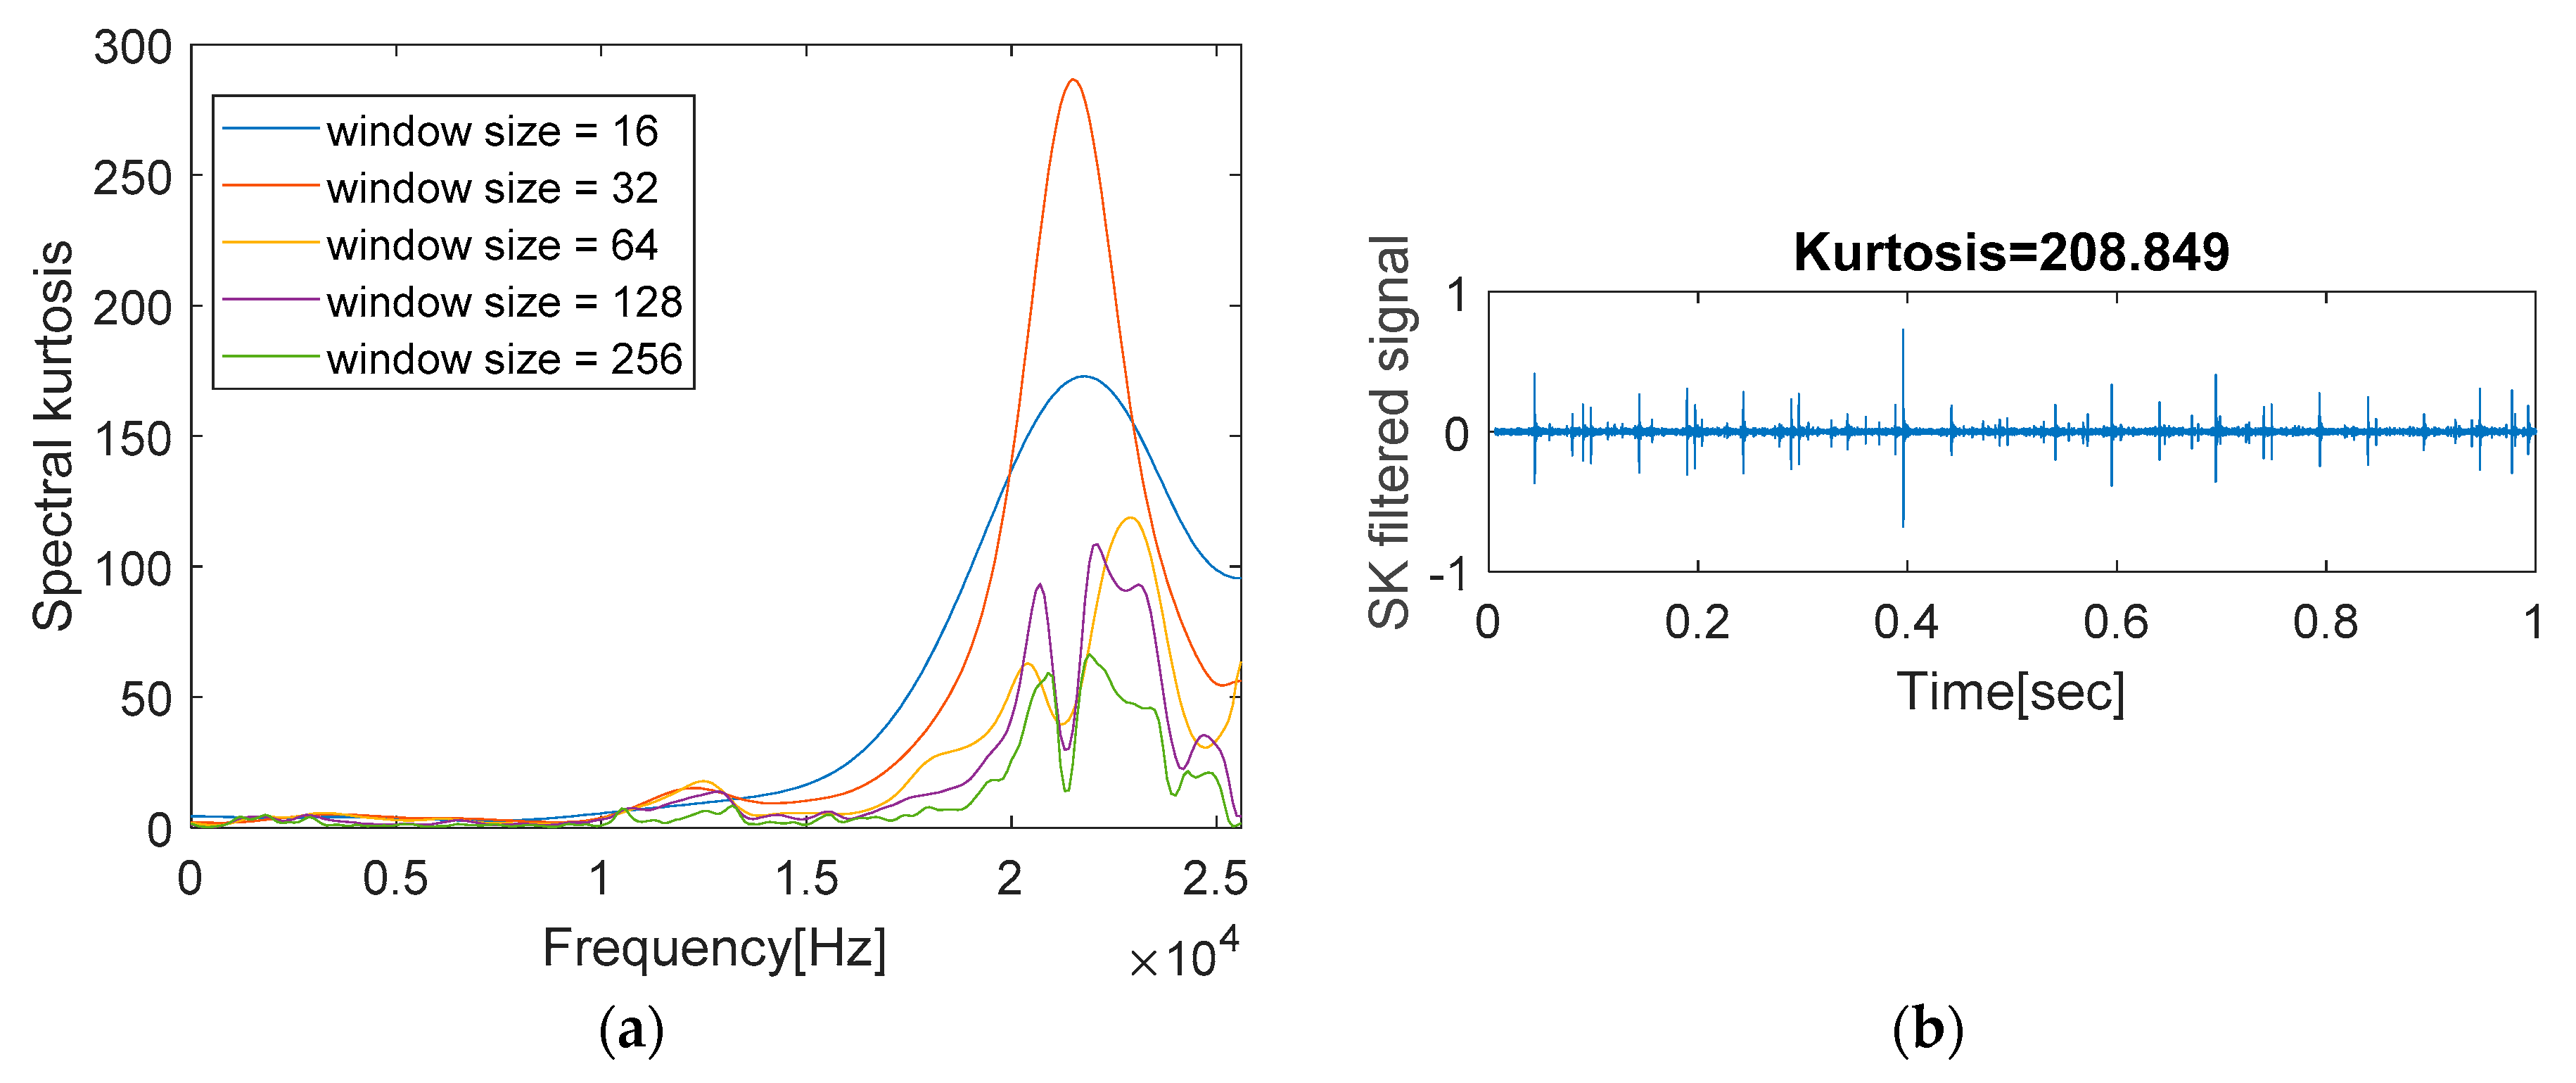
        43 figure(1) %==== Results
        44 freq = (0:numFreq-1)/(2*(numFreq-1))*sampRate;
        45 plot(freq,specKurt); legend(lgd,’location’,’best’)
        46 xlabel(‘Frequency[Hz]’); ylabel(‘Spectral kurtosis’); xlim([0 sampRate/2]);
        47 [freqRang] = input(‘Range of bandpass filtering, [freq1,freq2] = ‘);
        48 [b,a] = butter(2,[freqRang(1) freqRang(2)]/(sampRate/2),’bandpass’);
        49 X = filter(b,a,e); % band-passed signal
        50 %=======================Envelope analysis ============================
        51 aX = hilbert(X); % hilbert(x) returns an analytic signal of x
        52 envel = abs(aX);
        53 envel=envel-mean(envel); % envelope signal
        54 fftEnvel = abs(fft(envel))/Ne*2;
        55 fftEnvel = fftEnvel(1:ceil(N/2));
        56 figure(2) %==== Result plot
        57 freq = (0:Ne-1)/Ne*sampRate;
        58 freq = freq(1:ceil(N/2));
        59 stem(freq,fftEnvel,’LineWidth’,1.5); hold on;
        60 [xx,yy]=meshgrid(bearFreq,ylim);
        61 plot(xx(:,1),yy(:,1),’*-’)
        62 % ,xx(:,2),yy(:,2),’x-’,xx(:,3),yy(:,3),’d-’,xx(:,4),yy(:,4),’^-’)
        63 legend(‘Envelope spectrum’,’BPFO’,’BPFI’,’FTF’,’BSF’);
        64 xlabel(‘Frequency [Hz]’); ylabel(‘Amplitude [g]’); xlim([0 max(bearFreq)*1.8])
References
- He, D.; Bechhoefer, E.; Ma, J.; Zhu, J. A particle filtering based approach for gear prognostics. In Diagnostics and Prognostics of Engineering Systems: Methods and Techniques; IGI Global: Hershey, PA, USA, 2013; pp. 257–266. [Google Scholar]
- Kim, S.; Choi, J.H. Convolutional neural network for gear fault diagnosis based on signal segmentation approach. Struct. Health Monit. 2019, 18, 1401–1415. [Google Scholar] [CrossRef]
- An, D.; Choi, J.H.; Kim, N.H. Remaining useful life prediction of rolling element bearings using degradation feature based on amplitude decrease at specific frequencies. Struct. Health Monit. 2018, 17, 1095–1109. [Google Scholar] [CrossRef]
- Siegel, D.; Ly, C.; Lee, J. Methodology and framework for predicting helicopter rolling element bearing failure. IEEE Trans. Reliab. 2012, 61, 846–857. [Google Scholar] [CrossRef]
- Kim, S.; Park, S.; Kim, J.W.; Han, J.; An, D.; Kim, N.H.; Choi, J.H. A new prognostics approach for bearing based on entropy decrease and comparison with existing methods. In Proceedings of the Annual Conference of the Prognostics and Health management Society, Denver, CO, USA, 3–6 October 2016. [Google Scholar]
- Lim, C.; Kim, S.; Seo, Y.H.; Choi, J.H. Feature extraction for bearing prognostics using weighted correlation of fault frequencies over cycles. Struct. Health Monit. 2020, 22, 1475921719900917. [Google Scholar] [CrossRef]
- Lee, J.; Wu, F.; Zhao, W.; Ghaffari, M.; Liao, L.; Siegel, D. Prognostics and health management design for rotary machinery systems—Reviews, methodology and applications. Mech. Syst. Signal Process. 2014, 42, 314–334. [Google Scholar] [CrossRef]
- Wang, D.; Tsui, K.L.; Miao, Q. Prognostics and health management: A review of vibration based bearing and gear health indicators. IEEE Access. 2017, 6, 665–676. [Google Scholar] [CrossRef]
- De Azevedo, H.D.M.; Araújo, A.M.; Bouchonneau, N. A review of wind turbine bearing condition monitoring: State of the art and challenges. Renew. Sustain. Energy Rev. 2016, 56, 368–379. [Google Scholar] [CrossRef]
- Rai, A.; Upadhyay, S.H. A review on signal processing techniques utilized in the fault diagnosis of rolling element bearings. Tribol. Int. 2016, 96, 289–306. [Google Scholar] [CrossRef]
- Cerrada, M.; Sánchez, R.V.; Li, C.; Pachecod, F.; Cabreraa, D.; de Oliveirae, J.V.; Vásquezf, R.E. A review on data-driven fault severity assessment in rolling bearings. Mech. Syst. Signal Process. 2018, 99, 169–196. [Google Scholar] [CrossRef]
- Hamadache, M.; Jung, J.H.; Park, J.; Youn, B.D. A comprehensive review of artificial intelligence-based approaches for rolling element bearing PHM: Shallow and deep learning. JMST Adv. 2019, 1, 125–151. [Google Scholar] [CrossRef]
- Caesarendra, W.; Tjahjowidodo, T. A review of feature extraction methods in vibration-based condition monitoring and its application for degradation trend estimation of low-speed slew bearing. Machines 2017, 5, 21. [Google Scholar] [CrossRef]
- Randall, R.B.; Antoni, J. Rolling element bearing diagnostics—A tutorial. Mech. Syst. Signal Process. 2011, 25, 485–520. [Google Scholar] [CrossRef]
- Bechhoefer, E.; Kingsley, M.; Menon, P. Bearing envelope analysis window selection using spectral kurtosis techniques. In Proceedings of the 2011 IEEE International Conference on Prognostics and Health Management, PHM 2011, Denver, CO, USA, 20–23 June 2011. [Google Scholar] [CrossRef]
- Nikolaou, N.G.; Antoniadis, I.A. Rolling element bearing fault diagnosis using wavelet packets. NDT E Int. 2002, 35, 197–205. [Google Scholar] [CrossRef]
- McInerny, S.A.; Dai, Y. Basic vibration signal processing for bearing fault detection. IEEE Trans. Educ. 2003, 46, 149–156. [Google Scholar] [CrossRef]
- Shin, K.; Hammond, J. Fundamentals of Signal Processing for Sound and Vibration Engineers; John Wiley & Sons: Hoboken, NJ, USA, 2008. [Google Scholar]
- Kedadouche, M.; Liu, Z.; Vu, V.H. A new approach based on OMA-empirical wavelet transforms for bearing fault diagnosis. Measurement 2016, 90, 292–308. [Google Scholar] [CrossRef]
- Zhang, X.; Kang, J.; Zhao, J.; Teng, H. Bearing run-to-failure data simulation for condition based maintenance. TELKOMNIKA Indonezian J. Electr. Eng. 2014, 12, 514–519. [Google Scholar] [CrossRef]
- Bechhoefer, E. A Quick Introduction to Bearing Envelope Analysis; Green Power Monitoring Systems: Cornwall, VT, USA, 2016. [Google Scholar]
- Randall, R.B. Vibration-Based Condition Monitoring: Industrial, Aerospace and Automotive Applications; Wiley: Hoboken, HJ, USA, 2010. [Google Scholar] [CrossRef]
- Sawalhi, N.; Randall, R.B.; Endo, H. The enhancement of fault detection and diagnosis in rolling element bearings using minimum entropy deconvolution combined with spectral kurtosis. Mech. Syst. Signal Process. 2007, 21, 2616–2633. [Google Scholar] [CrossRef]
- Sawalhi, N.; Randall, R.B. The application of spectral kurtosis to bearing diagnostics. In Proceedings of the ACOUSTICS, Gold Coast, Australia, 3–5 November 2004. [Google Scholar]
- Ayaz, E. Autoregressive modeling based bearing fault detection in induction motors. In Proceedings of the 9th International Symposium on Industrial Electronics, Banja Luka, Bosnia and Herzegovina, 1–3 November 2012; pp. 99–102. [Google Scholar]
- Akaike, H. Information theory and an extension of the maximum likelihood principle. In Selected Papers of Hirotugu Akaike; Springer: New York, NY, USA, 1998; pp. 199–213. [Google Scholar]
- AR Order Selection with Partial Autocorrelation Sequence. Available online: https://www.mathworks.com/help/signal/ug/ar-order-selection-with-partial-autocorrelation-sequence.html (accessed on 9 October 2020).
- Vrieze, S.I. Model selection and psychological theory: A discussion of the differences between the Akaike information criterion (AIC) and the Bayesian information criterion (BIC). Psychol. Methods 2012, 17, 228. [Google Scholar] [CrossRef] [PubMed]
- Schwarz, G. Estimating the dimension of a model. Ann. Stat. 1978, 6, 461–464. [Google Scholar] [CrossRef]
- Grünwald, P.D.; Grunwald, A. The Minimum Description Length Principle; MIT Press: Cambridge, MA, USA, 2007. [Google Scholar]
- Ramsey, F.L. Characterization of the partial autocorrelation function. Ann. Stat. 1974, 2, 1296–1301. [Google Scholar] [CrossRef]
- Vrabie, V.; Granjon, P.; Serviere, C. Spectral kurtosis: From definition to application. In Proceedings of the 6th IEEE International Workshop on Nonlinear Signal and Image Processing (NSIP 2003), Grado, Italy, 8–11 June 2003. [Google Scholar]
- NSK Technical Calculations. Available online: http://www.jp.nsk.com/app02/BearingGuide/m/html/en/TopS.html (accessed on 9 October 2020).
- Ehrich, F.F. Handbook of Rotordynamics; Krieger: Malabar, FL, USA, 1999. [Google Scholar]
- Wang, Y.F.; Kootsookos, P.J. Modeling of low shaft speed bearing faults for condition monitoring. Mech. Syst. Signal Process. 1998, 12, 415–426. [Google Scholar] [CrossRef][Green Version]
- Bearing Data Center. Case Western Reserve University Seeded Fault Test Data; Case Western Reserve University: Cleveland, OH, USA, 2015. [Google Scholar]
- Smith, W.A.; Randall, R.B. Rolling element bearing diagnostics using the Case Western Reserve University data: A benchmark study. Mech. Syst. Signal Process. 2015, 64–65, 100–131. [Google Scholar] [CrossRef]
- FEMTO-ST, IEEE PHM Data Challenge. 2012. Available online: http://www.femto-st.fr/en/Research-departments/AS2M/Researchgroups/PHM/IEEE-PHM-2012-Data-challenge (accessed on 9 October 2020).
- Mechanical Failures Prevention Group (MFPT) Society (a Division of the Vibration Institute), Brook, O., IL. Available online: http://www.mfpt.org/FaultData/FaultData.htm (accessed on 9 October 2020).
- Lee, J.; Qiu, H.; Yu, G.; Lin, J. Rexnord Technical Services: Bearing Data Set, Moffett Field, CA: IMS, Univ. Cincinnati; NASA Ames Prognostics Data Repository, NASA Ames: Washington, WA, USA, 2007. [Google Scholar]
- Bechhoefer, E.; Van Hecke, B.; He, D. Processing for improved spectral analysis. In Proceedings of the Annual Conference of the Prognostics and Health Management Society, New Orleans, LA, USA, 14–17 October 2013; pp. 14–17. [Google Scholar]
- Lessmeier, C.; Kimotho, J.K.; Zimmer, D.; Sextro, W. Condition monitoring of bearing damage in electromechanical drive systems by using motor current signals of electric motors: A Benchmark data set for data-driven classification. In Proceedings of the European Conference of the Prognostics and Health Management Society, Bilbao, Spain, 5–8 July 2016. [Google Scholar]
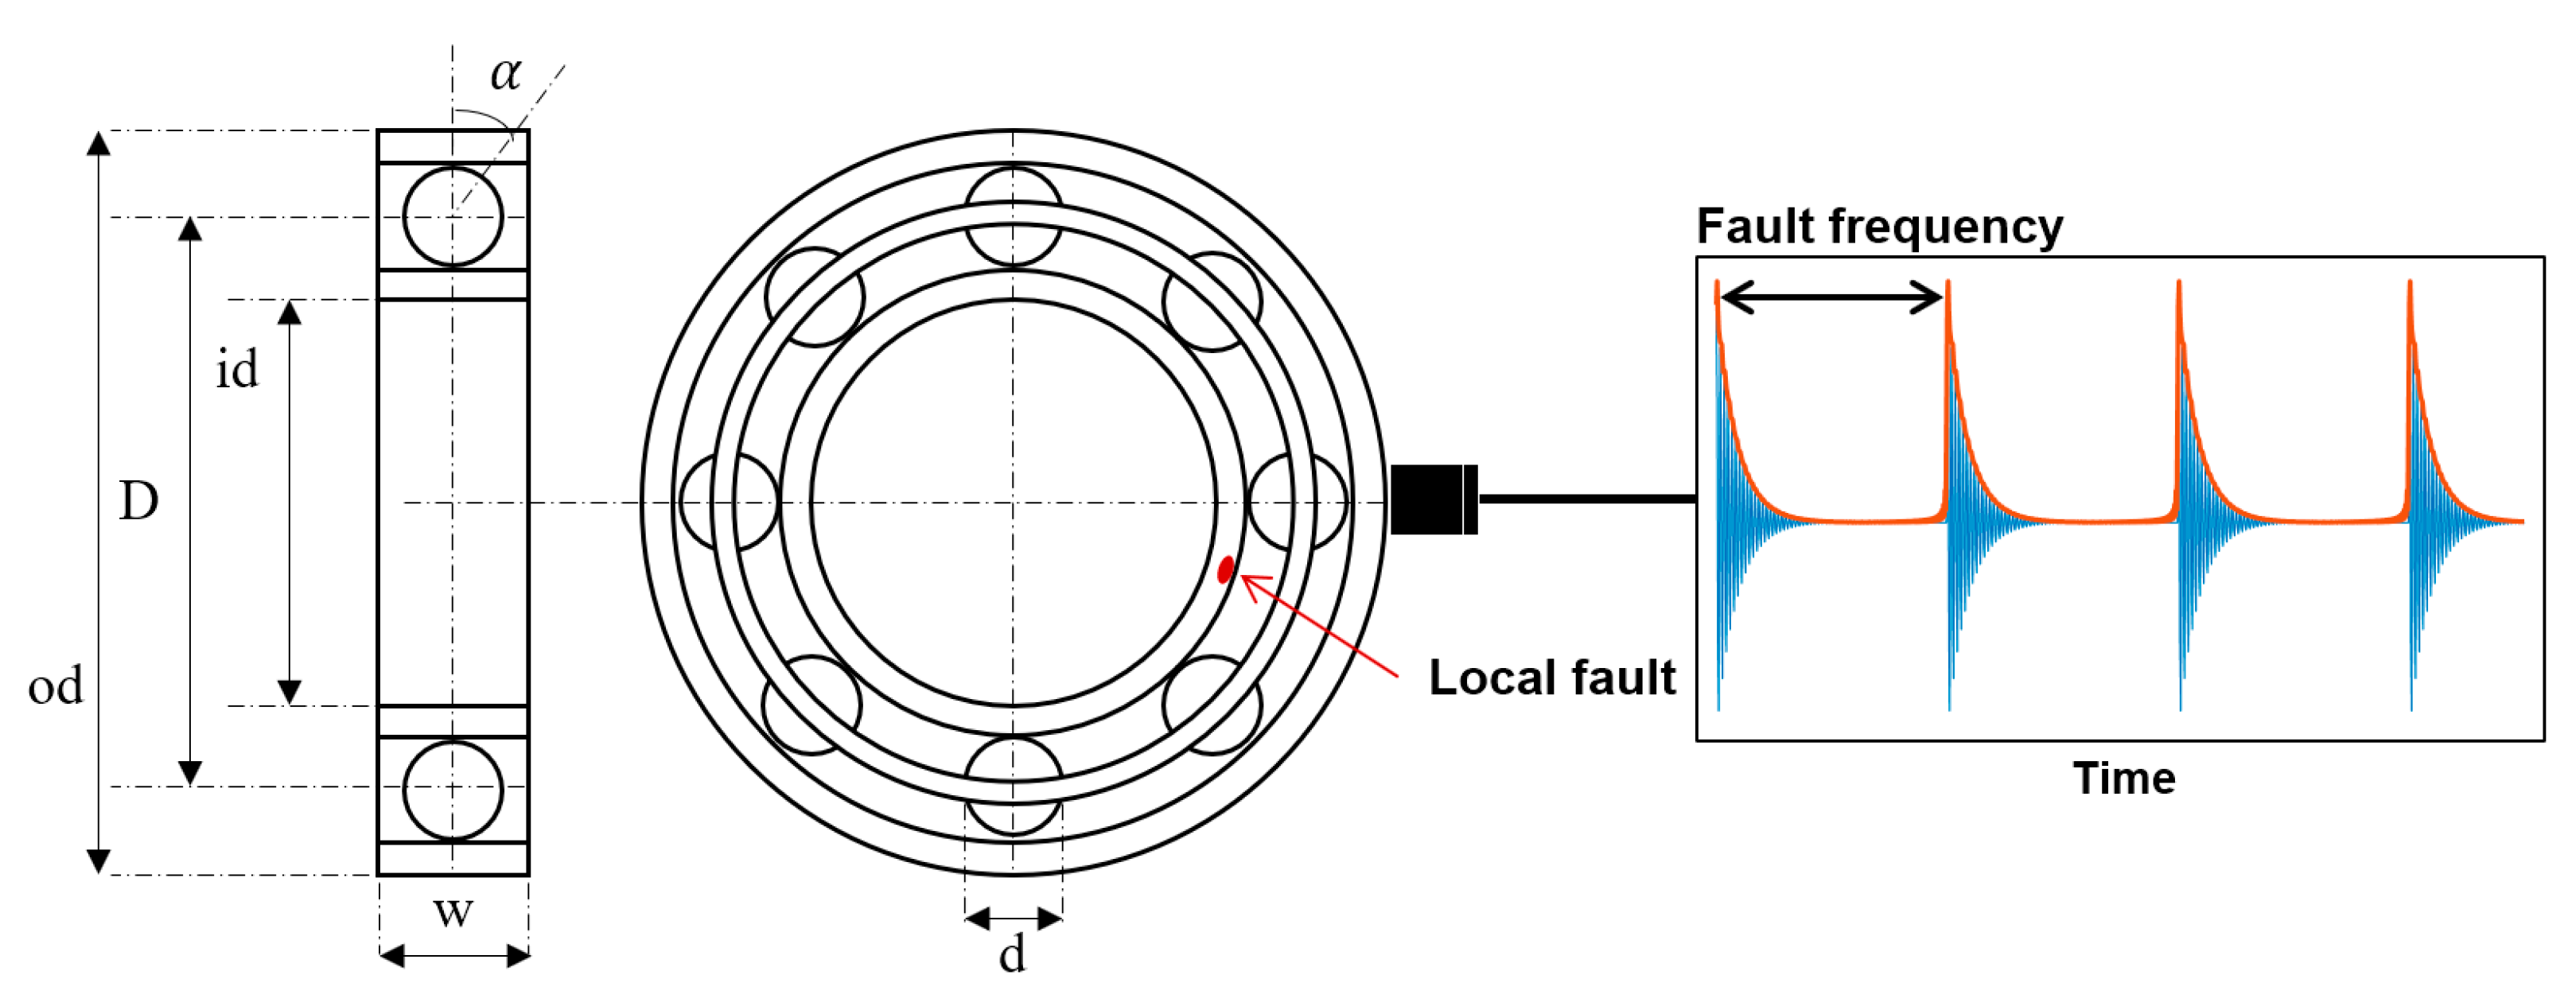
| Parameter Name | Value | Parameter Name | Value |
|---|---|---|---|
| Bearing type | NJ 2306 | Width (w) | 27 mm |
| Inner diameter (id) | 30 mm | Dynamic load rating | 51,500 N |
| Outer diameter (od) | 72 mm | Static load rating | 51,000 N |
| Number of rollers (n) | 11 |
| Data Name | RPM | LOAD |
|---|---|---|
| bearing 1 | 1200 rpm | 0 N |
| bearing 2 | 1200 rpm | 200 N |
| bearing 3 | 1000 rpm | 0 N |
| bearing 4 | 1000 rpm | 200 N |
| Frequency Name | Value | Frequency Name | Value |
|---|---|---|---|
| BPFO | FTF | ||
| BPFI | BSF |
| Parameter Name | Value | Parameter Name | Value |
|---|---|---|---|
| Pitch diameter (D) | 1.122 inch | BPFO | 3.0530 |
| Ball diameter (d) | 0.2656 inch | BPFI | 4.9469 |
| Number of rolling element (n) | 13 | FTF | 0.3817 |
| Contact angle () | 0 | BSF | 1.994 |
| Data Set Name | Diagnosis | Prognosis | Failure Type | Operating Condition |
|---|---|---|---|---|
| FEMTO [38] | X | O | Natural | Different load and speed |
| MFPT [39] | O | X | Artificial | Different load |
| IMS [40] | X | O | Natural | Single condition |
| WT [41] | X | O | Natural | Single Condition |
| Paderborn [42] | O | X | Artificial, Natural | Different operating condition |
Publisher’s Note: MDPI stays neutral with regard to jurisdictional claims in published maps and institutional affiliations. |
© 2020 by the authors. Licensee MDPI, Basel, Switzerland. This article is an open access article distributed under the terms and conditions of the Creative Commons Attribution (CC BY) license (http://creativecommons.org/licenses/by/4.0/).
Share and Cite
Kim, S.; An, D.; Choi, J.-H. Diagnostics 101: A Tutorial for Fault Diagnostics of Rolling Element Bearing Using Envelope Analysis in MATLAB. Appl. Sci. 2020, 10, 7302. https://doi.org/10.3390/app10207302
Kim S, An D, Choi J-H. Diagnostics 101: A Tutorial for Fault Diagnostics of Rolling Element Bearing Using Envelope Analysis in MATLAB. Applied Sciences. 2020; 10(20):7302. https://doi.org/10.3390/app10207302
Chicago/Turabian StyleKim, Seokgoo, Dawn An, and Joo-Ho Choi. 2020. "Diagnostics 101: A Tutorial for Fault Diagnostics of Rolling Element Bearing Using Envelope Analysis in MATLAB" Applied Sciences 10, no. 20: 7302. https://doi.org/10.3390/app10207302
APA StyleKim, S., An, D., & Choi, J.-H. (2020). Diagnostics 101: A Tutorial for Fault Diagnostics of Rolling Element Bearing Using Envelope Analysis in MATLAB. Applied Sciences, 10(20), 7302. https://doi.org/10.3390/app10207302


