1. Introduction
The Internet of Things (IoT) phenomenon plays an important role in many areas today. Every year, the number of devices that we could consider as elements of the Internet of Things is growing. The Internet of Things can be understood as a large network with different connected types of objects, able to communicate with each other and exchange information, regardless of whether they belong to the same group. The network creation consisting of mutually communicating devices provides the user with the possibility of more effective management of all connected devices. The Internet of Things allows objects to be captured and controlled remotely over existing network infrastructures, creating opportunities for further direct integration of the physical world into computer systems, resulting in increased efficiency, accuracy and economic benefits [
1]. IoT is augmented by sensors and actuators, making it a cyber-physical system that includes technologies such as smart grids, smart homes, intelligent transport, smart cities, and also smart education [
2,
3].
The choice of measurement methods and sensors is a complex process in which a large number of questions are asked. Physiological parameters can be measured in the same way as the physical principles of signal acquisition. The measurement technology in relation to the individual sensors creates a huge number of choices.
Common devices connected to the Internet provide us with a wealth of information and data. Such devices include, for example, ordinary smart wristbands, smart mobile devices, eye tracking cameras, etc. These devices were used to look for relationships between the physiological state of the student and the impact on his results.
The aim of the article is to point out the relationship between the concentration we measured with eye tracking technology and the excitement we measured with heart rate (HR) as a stress measurement tool and how it all affects the results of the study. We are looking for dependencies (connections) between physiological functions and students’ knowledge. In this article, we try to find the relationships between the values of test results in students and their heart rate during testing. We assume that during testing, the level of stress may increase and thus the heart rate will also increase. The dependence of heart rate and stress has already been studied by many authors [
4,
5,
6,
7,
8,
9]. We also reveal the dependence of the student’s heart rate before learning that they would be tested and during testing, and we monitored this change. We have formulated all these questions into research questions, which are defined in the article.
2. Related Work
Eye tracking has been used in the last decade, especially in the field of neuromarketing [
10,
11,
12,
13,
14,
15,
16]. Recently, research has emerged pointing to the possibilities of its application and use in the educational process [
17,
18,
19,
20] or virtual reality [
21]. In terms of using eye tracking, data about the so-called saccades and fixations, i.e., how long and where the person is looking, are important for researchers. In the case of neuromarketing, it is primarily about understanding human behavior through eye tracking studies related to recognizing the needs of consumers in marketing products [
22].
In the case of the educational process, the interest of researchers is focused primarily on understanding the internal experience of a particular situation and its impact on learning outcomes through a set of learning styles [
23].
The study of human behavior through eye tracking is a growing multidisciplinary field that combines electronics, psychology and cognitive sciences in connection with the study of human behavior, especially in problem solving or decision making and learning analytics [
22]. Nguyen [
24] describes that learning analytics (LA) involves the analysis of cognitive, social, and emotional processes in learning scenarios in order to make informed decisions about the design and provision of teaching.
According to Sharma [
25], the success of acquiring a wealth of knowledge and skills during the educational process is influenced by many factors. For example, students’ efforts to complete a task are often a manifestation not only of how they are assessed during the learning process but also of how actively they engage in individual learning activities based on different levels of motivation. It is possible (very difficult) for students’ efforts to be observed directly, for example in the case of an online learning environment. Multimodal data from online learning environments can provide further insight into learning processes and can estimate their efforts. Sharma explored various approaches to the classification of efforts in the context of adaptive assessment. Using the eye tracking method, he evaluated the behavior of 32 students during the adaptive self-assessment activity. Using this method, the author predicted the students’ effort to complete the upcoming task based on the discovered patterns of behavior using a combination of the hidden Markov model and the Viterbi algorithm. In his research, Sharma has shown that eye tracking and HMM can identify moments in providing preventive/normative feedback to students in real-time by building a relationship between patterns of behavior and the efforts of learners.
The use of eye tracking in the educational process is really broad-based. For example, Davis and Zhu [
26] used eye tracking to gain an overview of how future programmers learn to read and process code. According to Davis and Zhu, there is a significant need to improve methodologies with active practical training techniques for programmers to learn practical strategies to mitigate software vulnerabilities; for the protection of private data; and finally write the secure code in the first place. They recorded the eye movements of future programmers as they read the code, thus removing problem areas in the source code. The study involved 29 students mitigating (eliminating) software bugs using manual source code analysis. Eye tracking data allowed them to objectively study the behavior of future programmers and at the same time gain an overview of their knowledge. The analysis of the study suggests that there is a difference in the learning phase for students who answered correctly compared to students who did not provide the right mitigation strategy. In particular, research suggests that it is possible to use the eye tracking method to understand students’ behavior so that we are able to develop improved practical teaching materials.
Latini [
27], by deploying the eye tracking method, investigated the effects of the medium on reading (printed vs. digital) in the context of processing and understanding the illustrated text. The participants were 100 university students enrolled in natural science post-graduate programs. The results showed that participants who read the illustrated text on paper showed more integrated processing during reading than participants who read exactly the same text on a computer. Integrative processing had a positive effect on comprehension, resulting in a mediated effect of the reading medium on comprehension through integrative processing. The reading medium did not have a major impact on integrated comprehension.
According to Emerson [
28], a characteristic feature of online multimedia learning and game-based environments is the ability to create learning experiences that are effective and engaging. Advances in sensor-based technologies, such as facial expression analysis and vision tracking, have provided an opportunity over the last 10 years to use multimodal data streams to teach analytics. Teaching analytics works with multimodal data captured during students’ interactions with playful learning environments and is an important promise for developing a deeper understanding of game-based teaching, detecting online student behavior, and supporting individualized learning.
Therefore, together with the eye tracking method, other types of sensors for sensing student activity (EEG, ECG, HR, temperature, GSR, etc.) are also used for detailed learning analytics. Most often, such tools must meet strict conditions. One of them is that they must not under any circumstances restrict the movement of the student in any way, so they must be a natural (technical and technological) part of the educational process. One way to ensure this is to use a wristband.
Zhang [
29] explains that the rapid development of wristband has enabled the continuous recording of neurophysiological signals in natural environments, such as the classroom. The study conducted by Zhang aimed to examine the neurophysiological correlates of the academic results of high school students. The study used electrodermal signals (EDA) and heart rate (HR), which were collected through a wristband from 100 students during daily Chinese and math classes for 10 days over two weeks. Significant correlations were found between academic performance, reflected in students’ final examination scores, and EDA responses. A study conducted by Zhang provides evidence to support the feasibility of predicting learning outcomes using wristbands through neurophysiological records.
The results of the Zhang study are also confirmed by Fortenbacher [
30] which states that the latest advances in sensor technology make it possible to examine students’ emotional and cognitive states. Obtaining data from sensors is a complex effort, all the more so when considering physiological data to support learning. Fortenbacher has developed a comprehensive solution for an adaptive learning system using data from GSR and HR sensors. To obtain data, the author used a wristband, which obtains physiological and environmental data, for which he completed a tablet application (SmartMonitor) for monitoring and visualizing data from the wristband. For learning analytics, he created a learning analysis backend that processes, and stores sensor data obtained from SmartMonitor and learning applications using these features. During his research, Fortenbacher found that while the possibilities of using physiological data for learning analytics are very promising, their use in a real learning environment requires interdisciplinary research implying combination of pedagogy, psychology, and several areas of computer science.
Motivation
Early detection of students’ attention (concentration) can change the success (effectiveness) of studying and the way of teaching. For this reason, it is important to test the reliability (dependencies) of the procedures used to determine students’ attention and to measure the influence of external factors, such as stressful situations (filling in quiz questions over time), on changes in data collected from sensory networks [
31,
32]. Students are an interesting group to study the effects of stressful situations because they are faced with a variable number of stressful situations in their daily activities in a short time.
The research was also motivated by previously conducted experiments focusing on the use of commonly available devices to measure the physiological function of the heart rate in order to identify stress or other emotions.
Jha, Prakash and Sagar [
33] used a smart wristband and a sensory network to identify the emotion of anger. They used heart rate and body temperature sensors in the research. Prior to the research, both sensors were calibrated. Subsequently, they defined the limit values for heart rate and temperature, on the basis of which the anger scale could be determined. As a result of the testing, the authors found that the heart rate and also the skin temperature increased when the anger was manifested.
Several studies [
34,
35,
36,
37] used wristbands to measure heart rate during sports. Athletes wore wristbands and performed the assigned task. They created a comprehensive IoT system that was able to receive data from sensors and send it for evaluation.
These articles motivated us to test the sensory networks and to establish whether they are able to detect the presence of stress in any way and whether with the help of these devices it is possible to explore students’ attention, thus affecting their results.
3. Material and Methods
The aim of the article is to find connections between the possibilities of individual devices connected to the Internet (i.e., IoT, eye tracking technology) and the student’s concentration influenced by physiological conditions. The experiment was performed on a sample of students who had to answer as many questions as possible in 3 min. The time was set empirically so that the time quantum allocated to answer the questions evokes competition among students and thus indirectly the middle situation and the change (expected increase) of HR. The relationship between stress and HR has already been described by the authors in their research [
3,
4]. A smart wristband was used to monitor the participants’ physiological conditions, measuring their heart rate. Correct answers and overall control were indicated by using eye tracking technology. The task of the research was to find the dependence between physiological functions (with which we can identify stress and calm condition) and the results of students’ knowledge, i.e., how concentration and heart rate affect the overall result of students. We are looking for dependencies between the results of eye tracking technology, HR and their impact on students’ knowledge.
The testing methodology consisted of several steps:
Create a quiz—LMS Canvas was used to create the quiz activity;
Create a question bank in the quiz—The created question bank contained 40 questions, consisting of four categories, which are described in the continuation of the chapter;
Choosing a wristband capable of measuring heart rates—The choice of smart wristband consisted of a comparison of several manufacturers with a licensed device for use in medicine;
Smart Watch Sensor Setup—each student had a wristband calibrated according to the manufacturer’s recommendations;
Adjust the eye tracker sensor—calibration of the device on the Tobii EyeX Eye Tracker was performed for each student according to the manufacturer’s instructions;
Start quiz with a predefined time—The quiz time was set at 3 min, in order to indirectly induce stress and competition for students to achieve the highest possible rating. For time synchronization, the same times were set for both sensors, and at the same time after starting the quiz, heart rate measurement was started, as well as eye tracking. At the same time as quiz activity was stopped, heart rate measurement and eye tracking were stopped;
Quiz evaluation—A log from Canvas was used to evaluate the quiz, where the steps of completing the quiz were analyzed in detail;
Export the wristband data—The data obtained from the watch was automatically sent to the mobile device and then to the cloud;
Evaluation of exported data—the obtained data were synchronized with each other based on the setting of the same time for both sensors, while the heart rate is a connected function and eye tracking is a discrete or separate function. Before synchronization, the times were adjusted to Unix time for all sensors;
Interpretation of results—the results of the experiment are described in more detail in the Results chapter.
This section describes how the eye tracker can be connected with smartwatch from Apple (Apple Inc., Cupertino, CA, USA) for the purpose of analyzing students’ heart rate. Students from the University of Novi Sad did online quiz on Canvas.
Canvas is an online tool for teaching and learning. Instructors on Canvas can share course content, post assignments and grades, conduct quizzes and collect online submissions. It was developed by Instructure Inc. in order to support the continued development of a new learning management system (LMS).
The aim of this experiment was to measure and compare students’ heart rate, which were gained from Apple Watch devices. Students attempted to answer the quiz, and they needed to answer as many questions as they could in a period of 3 min. The purpose of the time limit was to put pressure on students in order to see from heart rate results if there was any difference between questions at the start and questions that were done in the last 30 s or so.
The first step was to create the quiz for the participants to take. LMS Canvas was used because of using detail logs for every student attempt, measured in seconds. Logs were important because the Apple Watch can generate a report based on measures every 2–3 s. Also, we could use Quiz Statistics to get some useful information. The quiz has 40 questions that represent different scientific areas, like mathematics, geography, biology, and informatics, i.e., Halley’s comet orbits the sun every 65, 75, or 85 years. Students answered different types of questions, such as multiple choice (one correct), true/false questions, and fill in the blank questions. For every correct answer, students earn one point. They needed to answer as many questions as they could within a time limit of 3 min. The test was set for three minutes in order to indirectly induce stress and competition in the students, as the goal was to get as many correct answers as possible. The time was also set to three minutes so that students would not go through all the questions even if they clicked through the quiz. The quiz had the shuffle answers option, which was enabled; thus, the questions were not repeated.
3.1. Eye Tracking Data
Eye tracking deals not only with the movement of the eye based on its physiology but also with a condition where the eye remains in one place for a certain period of time. Devices that detect the movements of the eye and its states monitor when the eye temporarily stops, e.g., on just a word while reading. This is called fixation: the eye is fixed at one point and stopped moving. Such a stop can last from 10s of milliseconds to several seconds or more. The length of fixation is influenced by many factors, including the size of the study area. Really fast eye movements between points are referred to as saccadic movements or saccades [
38].
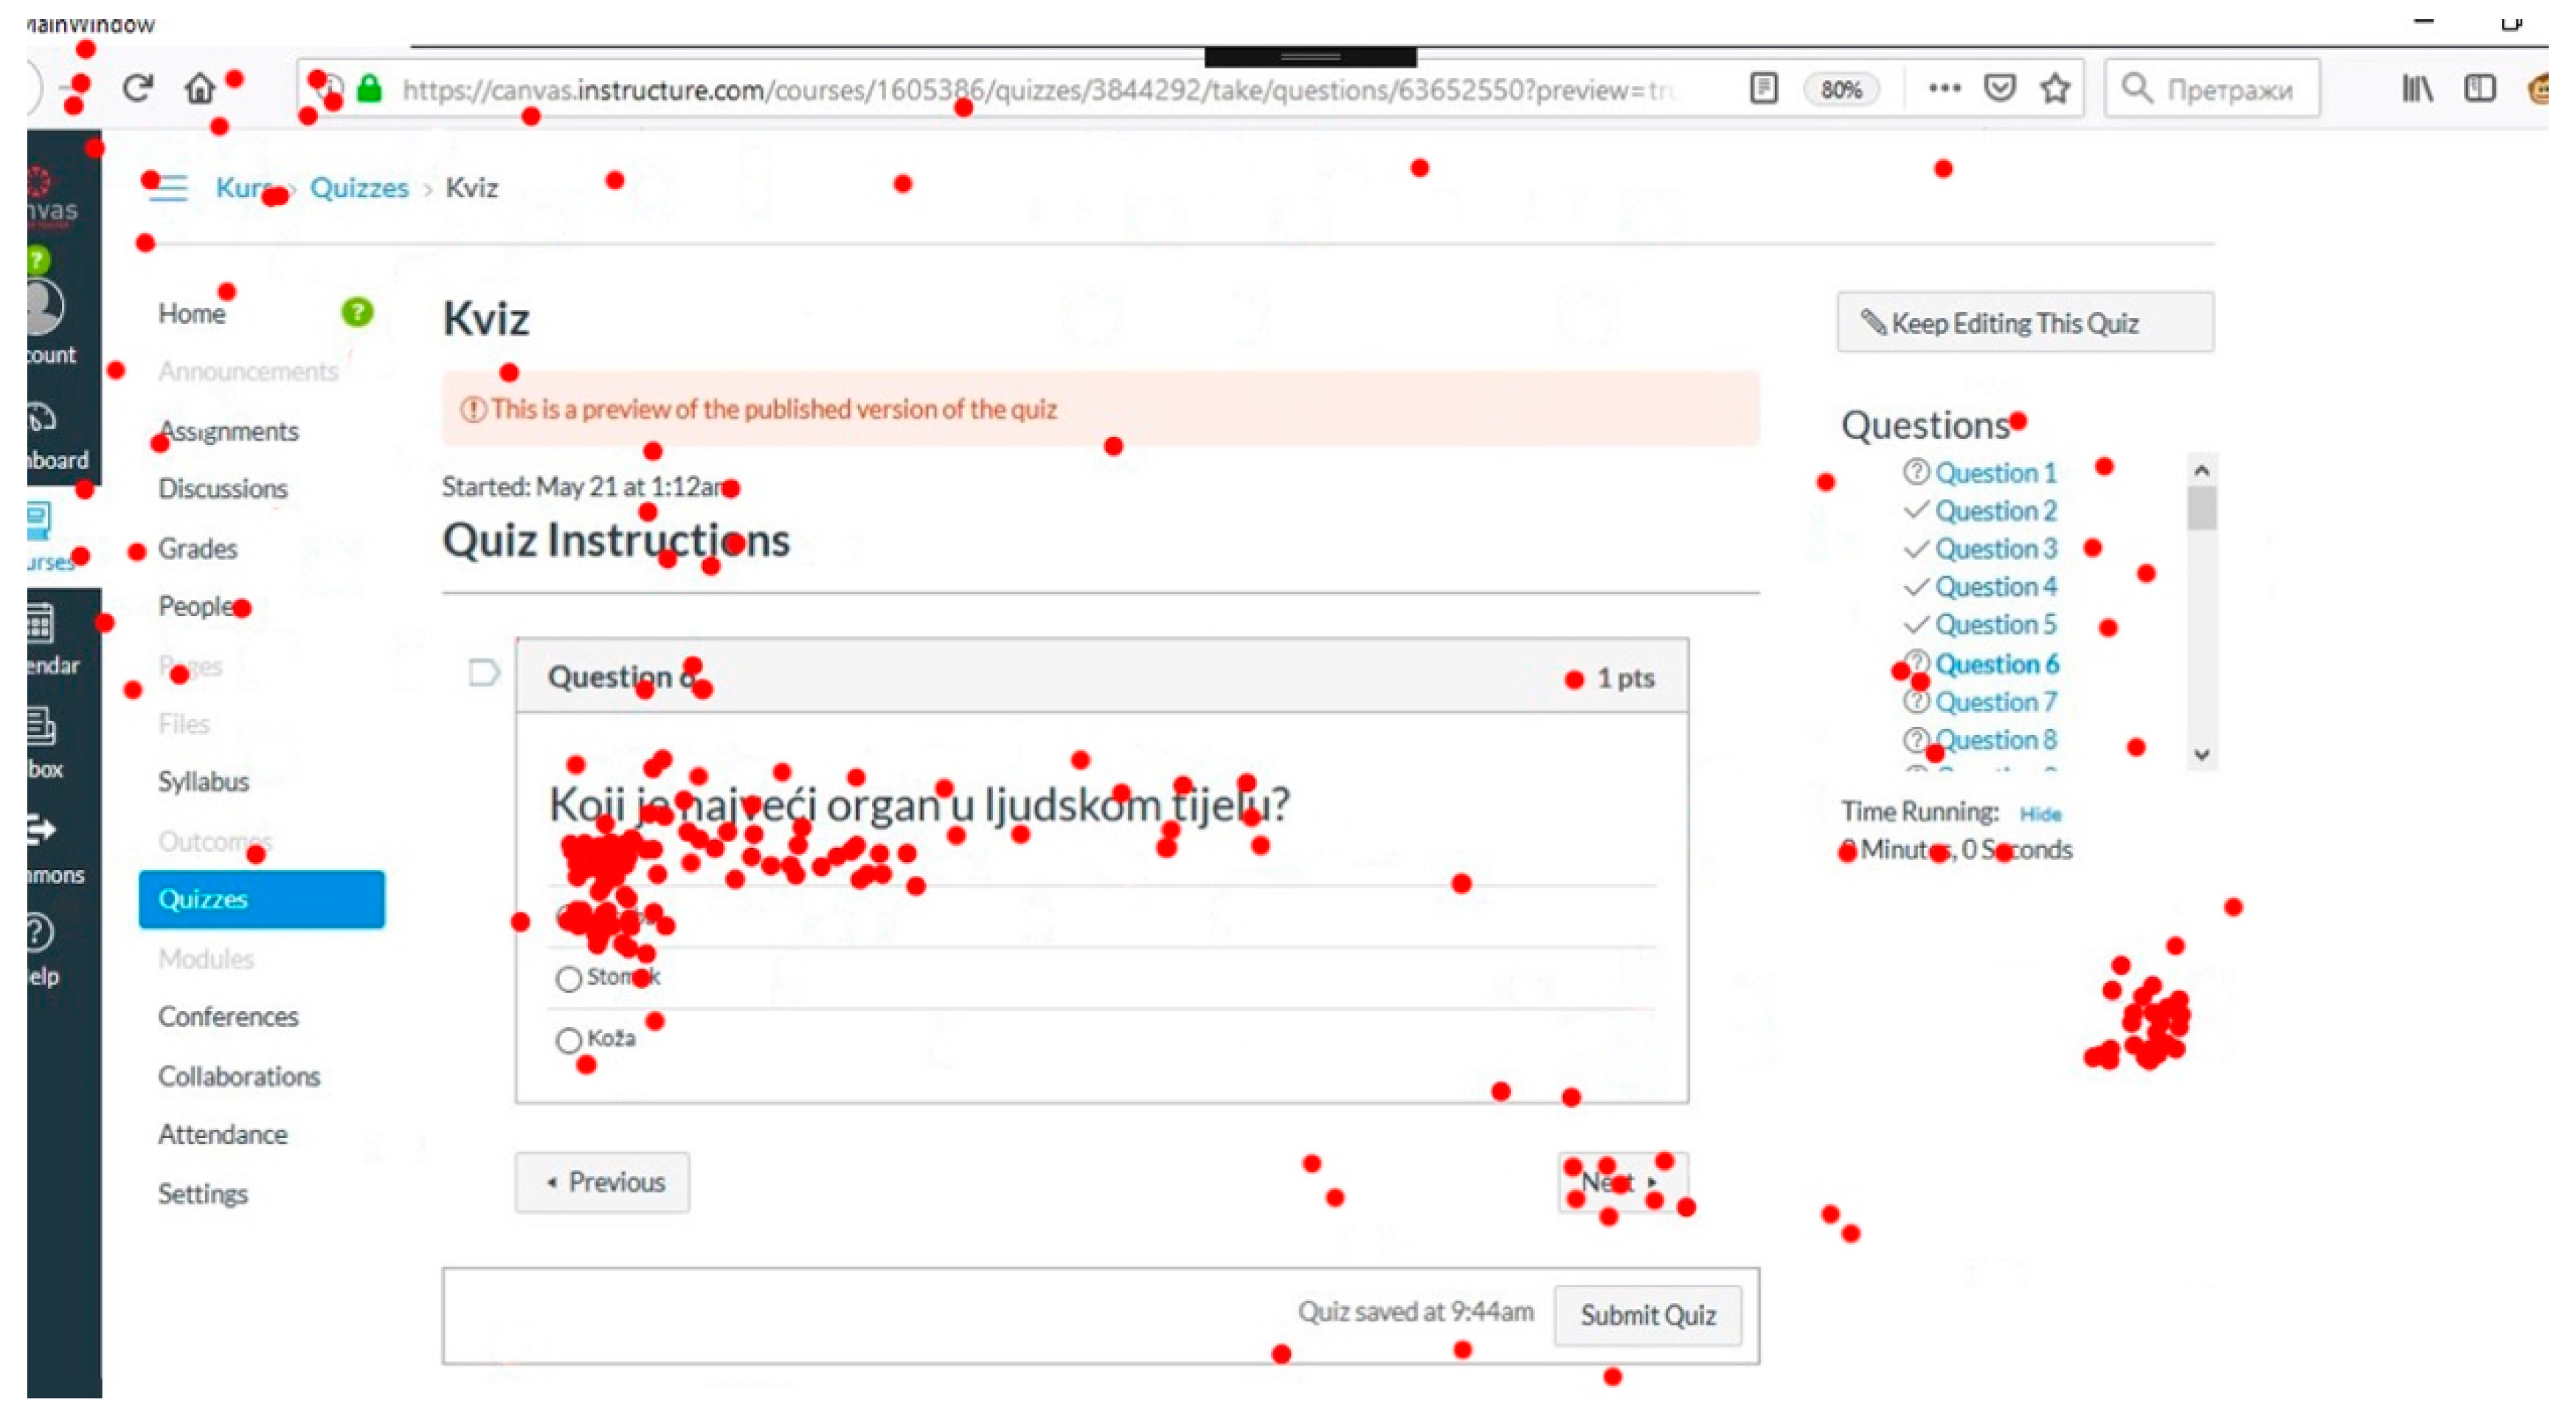
Students answered the questions while using the eye tracking device, Tobii EyeX. They needed to navigate with their eyes to answer questions. In the background, using Visual Studio, an application measured and converted the coordinates of student view into a red ellipse, which represents the students’ point of view, shown in
Figure 1.
Eye movement was recorded at intervals of an average of 1.5 recordings per second, so that 270 recordings could be obtained during the quiz, which lasted three minutes. Segmentation of images using the nearest squares method was used to determine which places the student was looking at during the quiz.
where
J is objective function,
k is number of clusters,
n is number of cases,
xi is
i-th case and
cj is centroid for cluster
j.
The method was created using the Python programming program using the OpenCV library. The individual records in the form of points were divided into several clusters based on the nearest squares’ method. In the research, we divided the records into several parts, the place of the question, the place of the “next” button and other records. The same method was repeated for each student [
39,
40,
41].
3.2. Heart Rate Measurement
As a sensor for measuring the heart rate of students, we have chosen a heart rate sensor built into the smartwatch from Apple. In order to get the most accurate data from the watch for setting the quiz time, we put the students a few minutes early so that they were not upset by the event. After a few minutes, the students could start the quiz and then we recorded the time when they started. On the watch, we have activated an activity application that allows them to measure heart activity at intervals of 3–6 s. The quiz itself was set to 3 min for each student. After the quiz time has expired, we stopped the app and recorded a quiz ending time according to the Canvas log to determine which final value of heart rate to include in the analysis for a particular student. We repeated the same procedure for each student.
3.3. Export Measured Data
The measured data was stored in the Health application on the mobile device paired with the watches. The Health application allows us to view measured data as well as export it in csv format. With the function export health data, we exported all data to a computer, where they were subsequently processed. The exported file was opened with the Excel tool from Microsoft, which contained all the data that the watch records (image).
The data we needed for research was written under the record type HK Quantity Type Identifier Heart Rate. As all the data were together in one column, the data had to be cleaned. We performed the cleaning function by changing the text to columns and we received the data in the table. Subsequently, we removed unnecessary listings, such as the date (as we did the experiment on the same day), as well as the end time, because heart rate measurements were made in one second. We also removed the word parts of the notation to leave only numeric values. The heart rate measurement time was formatted as time type.
3.4. Data Analysis
After cleaning the data,
Table 1 contained the heart rate measurement time (Time in Sec) and heart rates per minute (Value).
The quiz was set to 3 min, and time for each student was recorded when the quiz started and finished. Based on the time of the beginning and ending quiz, we were able to assign which values belong to a particular student. Since the time was written in the form when a particular value was measured, it had to be recalculated. The new time was calculated as the time difference obtained from the watch and the time that was written to the table. Based on time calculation we got the opportunity to compare the heart rate for a particular time. The LMS Canvas for the quiz tool was used for test, and the logs contained details of the quiz’s progress. We could compare the watch data and the quiz that way. Since we recalculated the time set from zero to three minutes in the watch data table, we had the opportunity to analyze in more detail what the student was doing in the quiz when the heart rate value suddenly changed.
4. Results
During our experiment, we measured the heart rate of students before and during the quiz. Our goal was to verify whether a particular course activity would affect their heart rate. Fifteen students were tested. They dealt with a general knowledge quiz. We verified whether there was any dependence between the overall quiz result and
average heart rate during the quiz;
heart rate before testing;
heart rate at the start of testing.
Table 2 shows a sample of students who were tested.
Table 2 shows the measured values of AVG HR, which is the average value of the student’s heart rate during the test; Pretest HR, which is the heart rate before testing; Start HR, which is the heart rate at the start of testing, and Total score, which is the final score of the student from the test.
Indices numbered 1 and 2 have been omitted in order to test the correct operation of the wristband used to measure the heart rate, as well as the device for recording eye activity. Similarly, for index 12, the same device testing was performed.
The research aimed to verify whether there are significant dependencies between the results of these measurements (
Table 2) and the score obtained by the students. The research questions, which we verified during the experiment, were also based on this aim.
The research questions were based on the dependence between these values in relation to the score obtained by the student.
Research questions:
Q (1): Does the student’s test result depend on his/her average heart rate during the test?
Q (2): Does the student’s test result depend on the heart rate the student has before he/she learns that he/she will be tested?
Q (3): Does the student’s test result depend on the heart rate that the student has at the beginning of the test?
These research questions were converted into hypotheses, which were statistically verified in the analysis. We used correlation analysis to verify these dependencies. This dependence was verified by means of a correlation analysis that expresses the tightness of the statistical dependence between quantitative variables. It is the linear dependence rate of two variables. The correlation coefficient between two variables was calculated by the relation
where
σXY is covariance. By the ratio of covariance and standard deviations, we get a correlation coefficient between −1 and 1. Where −1 is indirect proportionality, 1 is direct proportionality and 0 is the independence of X and Y [
42].
By applying a correlation analysis using the Spearman correlation coefficient, we have obtained the results shown in
Table 3. Spearman’s rank correlation coefficient is calculated according to the formula:
where
Ri is the rank in the arrangement and
Qi is the rank of the values in an ordered arrangement. This coefficient is calculated from the rank of the ordered values.
This non-parametric statistical method was used because the variables AVG HR, Pretest HR, and Start HR contain relatively few values and do not have a normal distribution. We verified this based on the Lilliefors Test for Normality. In all three cases, the p-value was higher than 0.2. Based on these results, we can verify the null hypotheses, which were converted from research questions:
Hypothesis 1 (H1). There is no statistically significant correlation between the student’s average heart rate during the quiz and his/her score.
Hypothesis 2 (H2). There is no statistically significant correlation between the student’s heart rate before testing and his/her score.
Hypothesis 3 (H3). There is no statistically significant correlation between the student’s heart rate at the start of testing and his/her score.
From the above results, we can see that (H1) and (H3) are not rejected. Thus, there is no statistically significant relationship between the result score and the average heart rate or heart rate at the start of testing. However, we also see that based on the p-value for the hypothesis 2 (H2), we can reject (H2), which means that there is a statistically significant relationship between total scores and heart rate before testing. The correlation coefficient has a value of −0.52, i.e., a relatively high negative dependence. This means that if a student had a high heart rate before the quiz, then their score was low compared to a student who had a lower heart rate before testing. The dependence in the case of the variable Pretest HR against the Score is not very significant and we would classify it as a large dependence. It is also statistically significant at the 5% significance level.
Higher heart rate in this case probably means higher student stress. Stress may be due to the very fact that the student will be tested or if the student fails the quiz. The results show that if the heart rate before the quiz is higher, i.e., the student is under stress, the quiz result will be worse.
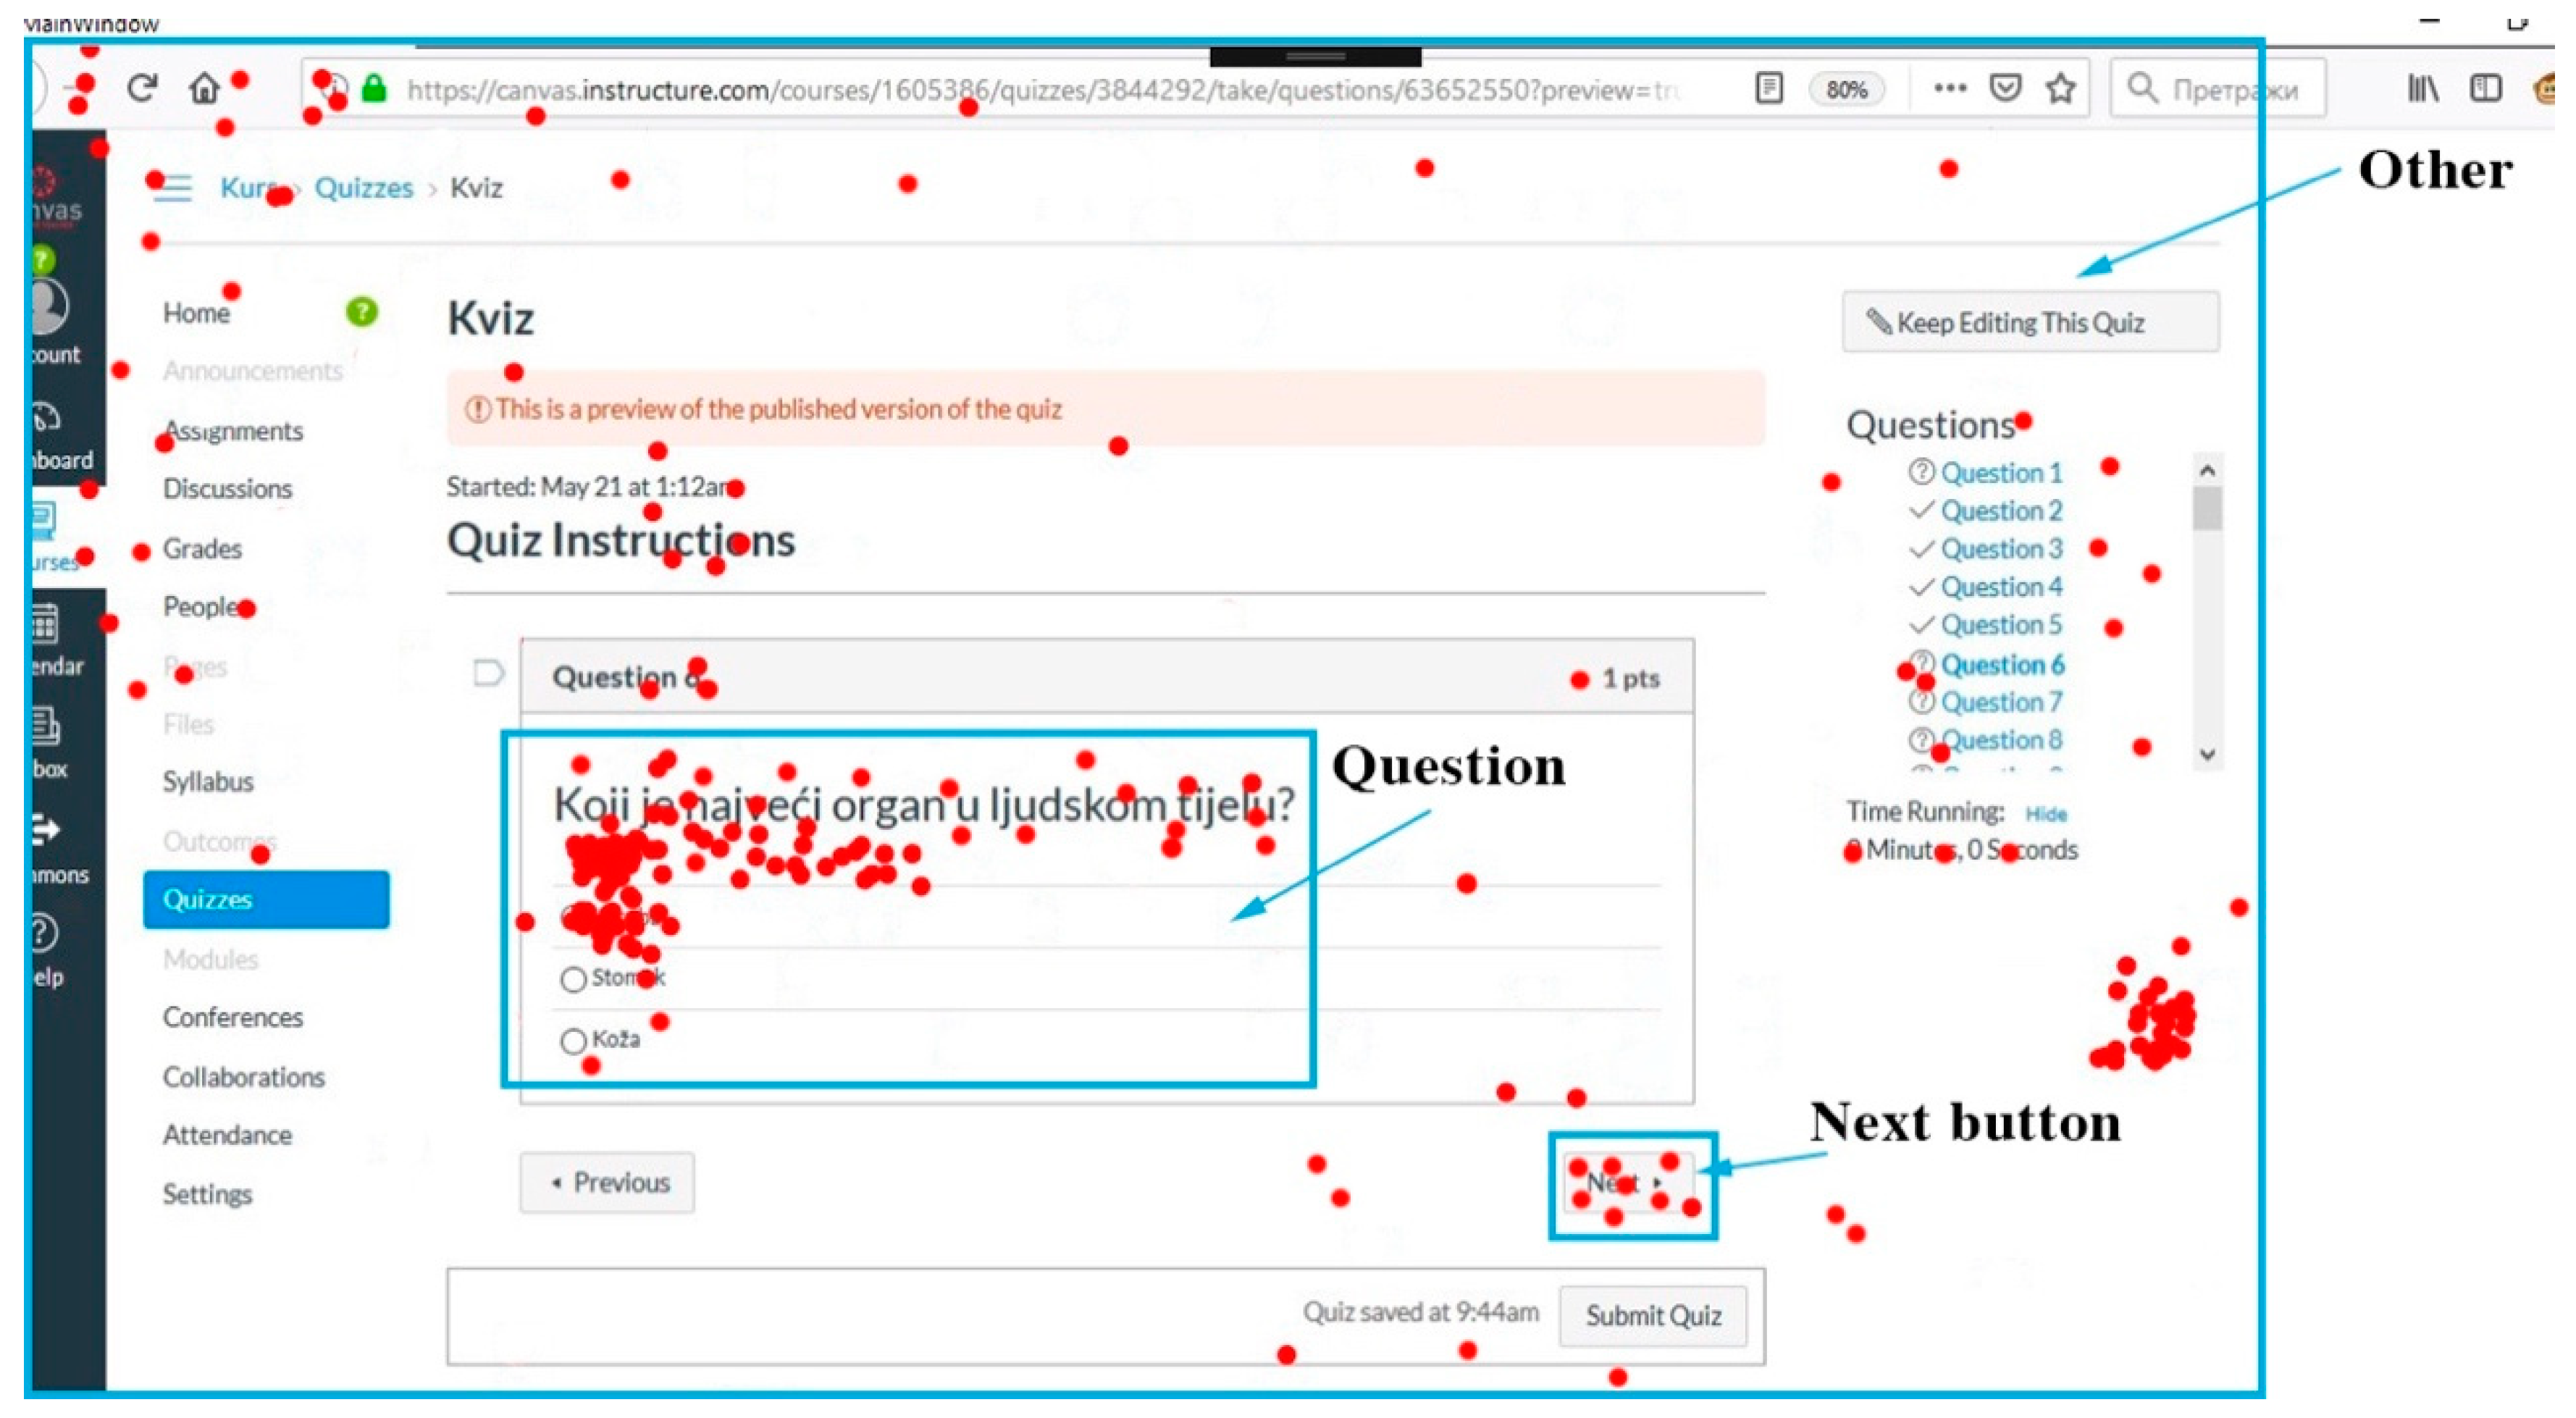
The data obtained from observing students’ eyes when solving quizzes can tell how much the students were focused on solving the given tasks. The system recorded the direction of the student’s gaze three times in 2 s. This can identify quite accurately how long the student watched which part of the screen. For this purpose, we divided the screen into zones shown in
Figure 2.
Question—the area of the screen where the text of the question and answer was located,
Next button—the area of the Next button that was used to switch the screen to the next question,
Other—the area outside the Question and Next button areas,
Out of screen—unrecorded points from eye tracking (since each student had 3 min to solve the question, which is 270 records, so this value was created by calculating 270—(Question + Next button + Other).
Table 4 contains the numbers of red dots (eye tracking records) that were included in the previously described zones. These values are listed for each student (
User ID) separately.
If the student focused mainly on the Question area, we assume that this student was more focused on solving the problem compared to a student whose value was lower. The values from the variable Other indicate a lower concentration rate. We assume that the Out of screen value, which speaks of how much time the student took his gaze off the screen, means the lowest level of concentration. We also judge this on the basis that the students were under time pressure and therefore did not have too much time to look around. The variable Next button was created so that we could also identify how much time students spent switching between questions. This information is not very revealing, as it focuses on an activity that the student has to perform but does not indicate concentration or non-concentration. However, the Next button was needed, for example, to more accurately determine the Out of screen values.
Using the above data, we determined whether there is a relationship between concentration (based on the above interpretation of eye tracking data) and Start HR. Specifically, we determined whether the degree of correlation between the variables Out of screen and Start HR is statistically significant. Since the variable Out of screen does not have a normal distribution and we work with a relatively small sample, it was necessary to use a nonparametric statistical method to evaluate the correlation.
The Kendall coefficient tau expresses the difference between the probability that the values of two variables are in the same order compared to the probability that the values are not in the same order [
42]:
where
nc is the number of matching pairs and
nd is the number of mismatched pairs. Pair (
xi, yi) and (
xj, yj), where
i, j = 1, ..., n and
i ≠ j is concordant if
xi > xj and
yi > yj or
xi < xj and
yi < yj. A pair is discordant if
xi > xj and
yi < yj or
xi < xj and
yi > yj. A pair is indecisive if
xi = xj or
yi = yj.
The variables Out of screen and Start HR have a statistically significant correlation, as Kendall tau came out to 0.39, which in this case is a statistically significant dependence on the level of statistical significance of 0.05.
Based on the above, we can say that the heart rate that the student had at the beginning of the quiz had a statistically significant effect on its concentration during the quiz. The correlation turned out to be positive, which means that if the student had a higher HR, he often looked around and was not focused on solving the assigned tasks.
5. Discussion
When evaluating the relationship of the student’s final score to heart rate at different stages of testing, we found an indirect dependence. Correlation coefficients expressing the relationships between heart rate and
Score were in the range from −0.37 to −0.52. In any case, the variables
AVG HR and
Start HR are moderately correlated according to Cohen [
43]. For the variable Pretest HR, this correlation is −0.52, which we consider being a large correlation and, based on our results, also statistically significant. Therefore, we can say that the result of the test largely depends on the heart rate of the student, but mostly on the student’s heart rate before the test. The student’s heart rate is a consequence of other physiological phenomena in the student, such as stress. However, the heart rate as an indicator of these changes and processes helps us to identify the student who will be able to pass the test successfully or unsuccessfully.
The knowledge we gained from the analysis of eye tracking in connection with the heart rate could be used in teaching to identify students who do not sufficiently concentrate on the lesson. If such students can be identified and that information can be passed on to the teacher, the teacher can adapt his or her teaching to increase the concentration of the group of students. These systems can also be deployed in real time.
6. Conclusions
In this article, we focused on commonly available IoT devices, which can be used to collect valuable information about the student’s condition in a non-invasive way. This information has some revelatory value, enabling us to set up the next steps and procedures. Our experiment was performed on respondents (students) who passed the test in the specified time span (interval).
The research was divided into several stages described in the Materials and Methods section. Prior to the research itself, it was necessary to set up devices that were used as sensors to measure heart rate and eye activity. It was also necessary to set up a quiz through which the research was carried out. Based on the analysis of the results, it was found that students who achieved higher heart rate values before the quiz did not fully concentrate during the quiz, which indicated that, in addition to looking at the screen, they were looking outside and therefore achieved weaker quiz results. On the other hand, students who were calmer before taking the quiz had a higher level of concentration, looked at the screen longer, and achieved higher quiz results.
Using the data obtained from eye tracking and HR, we found out whether there is a dependence between the concentration on solving the problem of students and their HR. Based on the performed experiment, we can conclude that the heart rate that the student had at the beginning of testing had a statistically significant effect on his concentration during the test. The correlation turned out to be positive, which means that if a student had a higher HR, he often looked around and was not focused on solving the assigned tasks. In the future, we plan to create a comprehensive sensory system (IoT), with which we will be able to obtain and evaluate results in real time. These results will help students to adapt their studies and thus streamline the learning process. It will be possible to use the methodology in other areas as well, such as industry, smart homes, the automotive industry, etc.

 ,
, 


