Article

Quantum Eigenstates of Curved and Varying Cross-Sectional Waveguides

by
Jens Gravesen
1 and
Morten Willatzen
2,3,4,*
1
DTU Compute, Technical University of Denmark, Kongens Lyngby, DK-2800 Lyngby, Denmark
2
CAS Center for Excellence in Nanoscience, Beijing Key Laboratory of Micro-Nano Energy and Sensor, Beijing Institute of Nanoenergy and Nanosystems, Chinese Academy of Sciences, Beijing 100083, China
3
School of Nanoscience and Technology, University of Chinese Academy of Sciences, Beijing 100049, China
4
DTU Fotonik, Technical University of Denmark, Kongens Lyngby, DK-2800 Lyngby, Denmark
*
Author to whom correspondence should be addressed.
Appl. Sci. 2020, 10(20), 7240; https://doi.org/10.3390/app10207240
Submission received: 18 September 2020 / Revised: 6 October 2020 / Accepted: 7 October 2020 / Published: 16 October 2020

Abstract

:
A simple one-dimensional differential equation in the centerline coordinate of an arbitrarily curved quantum waveguide with a varying cross section is derived using a combination of differential geometry and perturbation theory. The model can tackle curved quantum waveguides with a cross-sectional shape and dimensions that vary along the axis. The present analysis generalizes previous models that are restricted to either straight waveguides with a varying cross-section or curved waveguides, where the shape and dimensions of the cross section are fixed. We carry out full 2D wave simulations on a number of complex waveguide geometries and demonstrate excellent agreement with the eigenstates and energies obtained using our present 1D model. It is shown that the computational benefit in using the present 1D model to calculate both 2D and 3D wave solutions is significant and allows for the fast optimization of complex quantum waveguide design. The derived 1D model renders direct access as to how quantum waveguide eigenstates depend on varying cross-sectional dimensions, the waveguide curvature, and rotation of the cross-sectional frame. In particular, a gauge transformation reveals that the individual effects of curvature, thickness variation, and frame rotation correspond to separate terms in a geometric potential only. Generalization of the present formalism to electromagnetics and acoustics, accounting appropriately for the relevant boundary conditions, is anticipated.

1. Introduction

With the vast possibilities to manufacture complex topological structures in quantum technology, it becomes increasingly important to address how physical properties change due to shape, size etc. Nanowire technology provides a rich platform to discover novel physical properties related to curvature effects such as flexible electronics [1], battery [2] and nanoelectromechanical sensors and generators [3,4,5,6,7]. A selection of recent nanoarchitecture work [8] includes the influence of a varying thickness of 2D WS 2 nanolayers [9], the role of topology of the thermopower of six-terminal Andreev interferometers [10], the voltage induced by moving vortices as a function of transport and magnetic fields for rolled-up nanostructured nanotubes [11], topological transitions in superconducting structures [12,13], etc. Recently, the present authors [14] derived the first four-band spinless k · p model in curved coordinates using Kane’s model. In Ref. [15], a detailed discussion of the combined influence of curvature, torsion, and cross-sectional rotation of a nanostructure for electron eigenstates and symmetry properties in nanowires was presented based on a one-dimensional effective mass equation. Evidently, the use of curved coordinates is effective to recast computationally intensive 3D wave problems of complex nanoarchitectures into lower-dimensional problems; examples include the well-known cases of a torus, a helix, and a Möbius structure [16,17,18,19,20,21,22,23,24].
The use of analytical or numerical methods to determine 3D waveguide eigenstates and eigenfrequencies in acoustics and electromagnetics has a long history and is of high importance for applications. Webster’s horn model in acoustics provides a simple, accurate one-dimensional approximation for the estimation of the sound field in waveguides of varying thickness that otherwise requires a full 3D analysis [25,26]. Stevenson [27,28] derived a set of coupled ordinary differential equations for the varying thickness waveguide. In the latter case, even a small number of coupled equations was shown to provide an accurate description of the groundstate, the first excited states and their frequencies. Both methods [25,27,28], however, assumed a straight centerline (cylinder structures) and therefore cannot be applied to a more general class of nanowire geometries characterized by, simultaneously, a curved axis and a varying cross section.
In this work, we present a new method using differential geometry and perturbation theory to determine eigenstates to the Schrödinger equation of a quantum-mechanical particle confined to a curved, varying-thickness waveguide with small cross-sectional dimensions relative to the waveguide length. The cross-sectional geometry can be arbitrary and may rotate along the waveguide axis. We examine the influence of all geometry parameters and compare with accurate full-wave numerical solutions. For the waveguide structures analyzed, excellent accuracy is demonstrated for the first several eigenstates. The developed model provides insight into the influence of waveguide curvature, cross-sectional thickness variation and frame rotation for eigenstate energies and symmetry properties. In particular, the present method sheds new light on resonance phenomena as a result of coupling between geometry parameters that is not attainable from a standard complex full-wave problem. Besides the insight that can be gained from the 1D equations, there is also significant computational advantages, as discussed in Appendix A.

2. The General Equations

The goal is to express the Laplace operator in tubular coordinates in a thin neighbourhood of a curve. The normal cross sections of the structure we consider (the neighbourhood) are assumed to have the same shape, but the size and orientation in the normal plane are allowed to be arbitrary, see Figure 1, where the shapes of the normal intersections are disks.
Nevertheless, it is advantageous to first consider the case where the orientation of the cross sections relative to a minimal rotating frame is constant.

2.1. Constant Orientation

We assume that we have a curve r parametrised by arc length with tangent t = r . We first choose a minimal rotating frame, i.e., an orthonormal frame t , p , q (see Figure 1) along the curve satisfying,
d d s t p q = 0 κ 1 κ 2 κ 1 0 0 κ 2 0 0 t p q .
Then, the curvature of the curve is κ = κ 1 2 + κ 2 2 and the torsion is τ = κ 1 κ 2 κ 1 κ 2 κ 1 2 + κ 2 2 . We now consider the following parametrisation of a neighbourhood of r , see Figure 1:
x ( s , v , w ) = r ( s ) + ϵ h ( s ) ( v p ( s ) + w q ( s ) ) , s [ 0 , L ] , ( v , w ) Ω 0 R 2 ,
where ( v , w ) belongs to a fixed domain Ω 0 in the v w -plane and L is the length of the curve. If we fix s then we obtain a scaled (by ϵ h ( s ) ) and rotated copy of Ω 0 , in Figure 1 it is the unit disk. The scale is allowed to vary from point to point, this is encoded in the function h and the overall scaling is given by the positive number ϵ . We will expand the Laplace operator in powers of ϵ and as we consider ϵ as a small number we will disregard terms in ϵ of degree one or higher.
The partial derivatives are
x s = r + ϵ h ( v p + w q ) + h ( v p + w q )
= ( 1 ϵ h ( κ 1 v + κ 2 w ) ) t + ϵ h ( v p + w q ) ,
x v = ϵ h p ,
x w = ϵ h q .
We let
F = 1 ϵ h ( κ 1 v + κ 2 w ) ,
and find the metric tensor by taking the inner products between the partial derivatives,
G k = F 2 + ( ϵ h ) 2 ( v 2 + w 2 ) ϵ 2 h h v ϵ 2 h h w ϵ 2 h h v ϵ 2 h 2 0 ϵ 2 h h w 0 ϵ 2 h 2 .
The determinant is
G = ϵ 4 h 4 F 2 ,
and the inverse is
G k l = 1 F 2 h v h F 2 h w h F 2 h v h F 2 1 ϵ 2 h 2 + h v h F 2 ( h ) 2 v w h 2 F 2 h w h F 2 ( h ) 2 v w h 2 F 2 1 ϵ 2 h 2 + h w h F 2 .
We let
R = v v + w w = r r ,
where r = v 2 + w 2 . We furthermore have that
R 2 = v 2 2 v 2 + 2 v w 2 v w + w 2 2 w 2 + v v + w w , s h h R 2 = 2 s 2 2 h h R s + h h 2 ( R 2 + R ) h h R .
Denoting the coordinates ( s , v , w ) by ( u 1 , u 2 , u 3 ) we can now write the Laplace operator as
Δ = G k u k u + G k 2 G G u k + G k u k u = 1 ϵ 2 h 2 2 v 2 + 2 w 2 + 1 F 2 s h h R 2 1 ϵ h F κ 1 v + κ 2 w + ϵ h ( κ 1 v + κ 2 w ) F 3 s h h R .
As usual [15], we let χ = F ψ and have that
Ω ψ 1 ψ 2 d x d y d z = Ω 0 0 L ψ 1 ψ 2 F d s d v d w = Ω 0 1 0 L χ 1 χ 2 d s d v d w ,
such that the Helmholtz equation reads
Δ ψ = λ ψ Δ χ F = λ χ F F Δ χ F = λ χ .
Later, we shall exemplify the present analysis to the Schrödinger equation for a quantum-mechanical particle. For now, we focus on the Helmholtz equation. To zeroth order in ϵ , we have
F Δ χ F 1 ϵ 2 h 2 2 χ v 2 + 2 χ w 2 + s h h R 2 χ + κ 2 4 χ .
Unless h = 0 , i.e., the thickness is constant, we cannot separate the variables. Instead we will use perturbation theory. We have
s h h R 2 = 2 s 2 2 h h R s + h h 2 R 2 h h h h 2 R treated   as   a   perturbation .
The last three terms are considered as perturbations and first order perturbation theory yields
s h h R 2 2 s 2 2 h h R s + h h 2 R 2 h h h h 2 R = s h h R 2 + h h 2 R 2 R 2 ,
where R and R 2 are the expectation values of R and R 2 , respectively.
R n = Ω 0 ψ 0 ( v , w ) R n ψ 0 ( v , w ) ¯ d v d w ,
where ψ 0 is a transversal eigenstate. This procedure is easy in the case of non-degenerate transverse eigenstates such as for the transverse groundstate. However, in case of degenerate transverse eigenstates, standard degenerate perturbation theory must be used. We arrive at
F Δ χ F 1 ϵ 2 h 2 2 χ v 2 + 2 χ w 2 + s h h R 2 χ + h h 2 R 2 R 2 + κ 2 4 χ .
After multiplication with ϵ 2 h 2 , Helmholtz equation Δ ψ = λ ψ reads
2 χ v 2 + 2 χ w 2 ϵ 2 h 2 s h h R 2 χ + h h 2 R 2 R 2 + κ 2 4 + λ χ = 0 .
We can now separate the variables, χ = χ 0 ( v , w ) ϕ ( s ) , and if χ 0 is a solution to the 2D Helmholtz equation, i.e.,
2 χ 0 v 2 + 2 χ 0 w 2 = λ 0 χ 0 ,
then we finally have the 1D eigenvalue problem
d d s h h R 2 ϕ h h 2 R 2 R 2 + κ 2 4 λ 0 ϵ 2 h 2 ϕ = λ ϕ .

2.2. Variable Orientation

We now allow the orientation of the cross section to vary relative to the minimal rotating frame. More precisely, consider a general frame t , n 1 , n 2 where
d d s t n 1 n 2 = 0 κ 1 κ 2 κ 1 0 ω κ 2 ω 0 t n 1 n 2 .
We then have
n 1 = cos ϑ p + sin ϑ q , n 2 = sin ϑ p + cos ϑ q ,
where ω = ϑ . By following steps similar to the analysis in Refs. [15,19], the resulting 1D equation, accounting for a varying thickness and curvature effects, becomes,
d d s h h R i ω L 2 ϕ h h 2 R 2 R 2 ω 2 L 2 L 2 + κ 2 4 λ 0 ϵ 2 h 2 ϕ = λ ϕ ,
where L is the θ -component of the orbital angular moment operator, i.e.,
L = i v w w v = i θ ,
and θ is the polar angle.
Let us perform a gauge transformation, ϕ φ ,
ϕ ( s ) = e g ( s ) φ ( s ) , where g ( s ) = R log h ( s ) + i L ϑ ( s ) .
Then
d d s h h R i ω L = d d s g ,
and
d d s h h R i ω L ϕ = d d s g e g ( s ) φ ( s ) = g ( s ) e g ( s ) φ ( s ) + e g ( s ) φ ( s ) g ( s ) e g ( s ) φ ( s ) = e g ( s ) φ ( s ) .
Hence, Equation (18) is equivalent to
d 2 φ d s 2 h h 2 R 2 R 2 ω 2 L 2 L 2 + κ 2 4 λ 0 ϵ 2 h 2 φ = λ φ .
A similar transformation was used in Ref. [15] in the case without a thickness variation.
We see that all geometric effects: curvature, thickness variation, and frame rotation appear in the form of a geometric potential only. It is hard to say something general about the significance, except that the last term λ 0 / ( ϵ h ) 2 dominates when ϵ 0 and unless h is constant the eigenstates will concentrate at the maxima of h. In Appendix B, we examine examples where either the first or the last term is most important.

2.3. Non Arc Length Parametrisation

So far we have assumed that the curve is parametrized by arc length, but even though it is always possible theoretically, it is more often than not impractical. Thus, we will here give the 1D approximative equation for a general parametrisation. Observe that
d d s = d u d s d d u = 1 r d d u , and hence d h d s = h r ,
where prime ( ) now denotes differentation with respect to a general parameter u. Then, Equation (18) becomes
1 r d d u h r h R i ω L 2 ϕ h r h 2 R 2 R 2 ω 2 L 2 L 2 + κ 2 4 λ 0 ϵ 2 h 2 ϕ = λ ϕ .
and Equation (21) becomes
1 r d d u 2 φ h r h 2 R 2 R 2 ω 2 L 2 L 2 + κ 2 4 λ 0 ϵ 2 h 2 φ = λ φ .
It must be pointed out that the above analysis and reduction of a 3D problem to an effective 1D model does not impose restrictions on the form of the boundary conditions at the waveguide ends. Hence, the boundary conditions in the u coordinate can be arbitrary.

2.4. 2D Problems

The analysis above obviously carries over to 2D problems. The only difference is that we now have a unique frame and the terms involving ω and L disappears. The domain Ω 0 is now an interval on the v-line. In Appendix A, we will validate the method by comparing 1D calculations with full 2D calculations.
It can also be relevant for 3D problems where one variable can be separated away exactly, cf. Section 3.

2.5. Schrödinger Equation

The Schrödinger equation reads
2 2 m 2 ψ = E ψ ,
where m and E are the particle’s mass and energy, respectively, and ψ is the wavefunction. If 2 ψ = λ ψ and L 0 is the unit length then we have
E = 2 m 2 L 0 2 λ .

3. Transmission Studies through a Straight Waveguide with a Varying Thickness

In this section, we use the developed 1D model to compute transmission and reflection coefficients of a particle confined to a varying thickness quantum waveguide with a straight axis defined as the x axis. The waveguide cross-sectional dimension in one direction (z) is assumed to be much larger than the dimensions along the x , y directions. In this case, the 3D problem reduces to a 2D problem in the x y plane. In the region confined by the waveguide, the Schrödinger equation reads
2 2 m 2 ψ = E ψ ,
and the wavefunction satisfies ψ = 0 on the surface of the waveguide corresponding to infinite barriers.
We will attempt to compute the transmission and reflection coefficients for the case where the particle approaches the central region from the far left, and the waveguide thickness is assumed to vary in a continuous (and piecewise two times differentiable) manner. The waveguide thickness is considered constant to the left and the right of the central region (for simplicity, the same thickness h 0 and a zero curvature are assumed in the left and right regions). In this case the wavefunction part ϕ and its derivative d ϕ d s must be continuous everywhere, and we may write
ϕ ( s ) = exp i α s + B exp i α s , to the left of the central region , ϕ ( s ) = C exp i α s , to the right of the central region ,
where
α = 2 m E 2 π 2 4 ϵ 2 h 0 2 > 0 .
The latter inequality guarantees that wave solutions are propagating in the left and right regions. We can now obtain the transmission T and reflection R coefficients as
T = C , R = B .
Evidently, since the wave problem is lossless, we must require
| T | 2 + | R | 2 = | C | 2 + | B | 2 = 1 .
In order to determine the coefficients B and C, Equation (15) must be solved in the central region by matching to the wave solutions in the left and right regions. This has been done numerically.
We shall consider the central region to have a trigonometrically varying thickness, i.e.,
h ( s ) = h 0 + b sin n π L m s , d h d s = b n π L m cos n π L m s , d 2 h d s 2 = b n π L m 2 sin n π L m u ,
where L m defines the size of the central region and n is an integer.
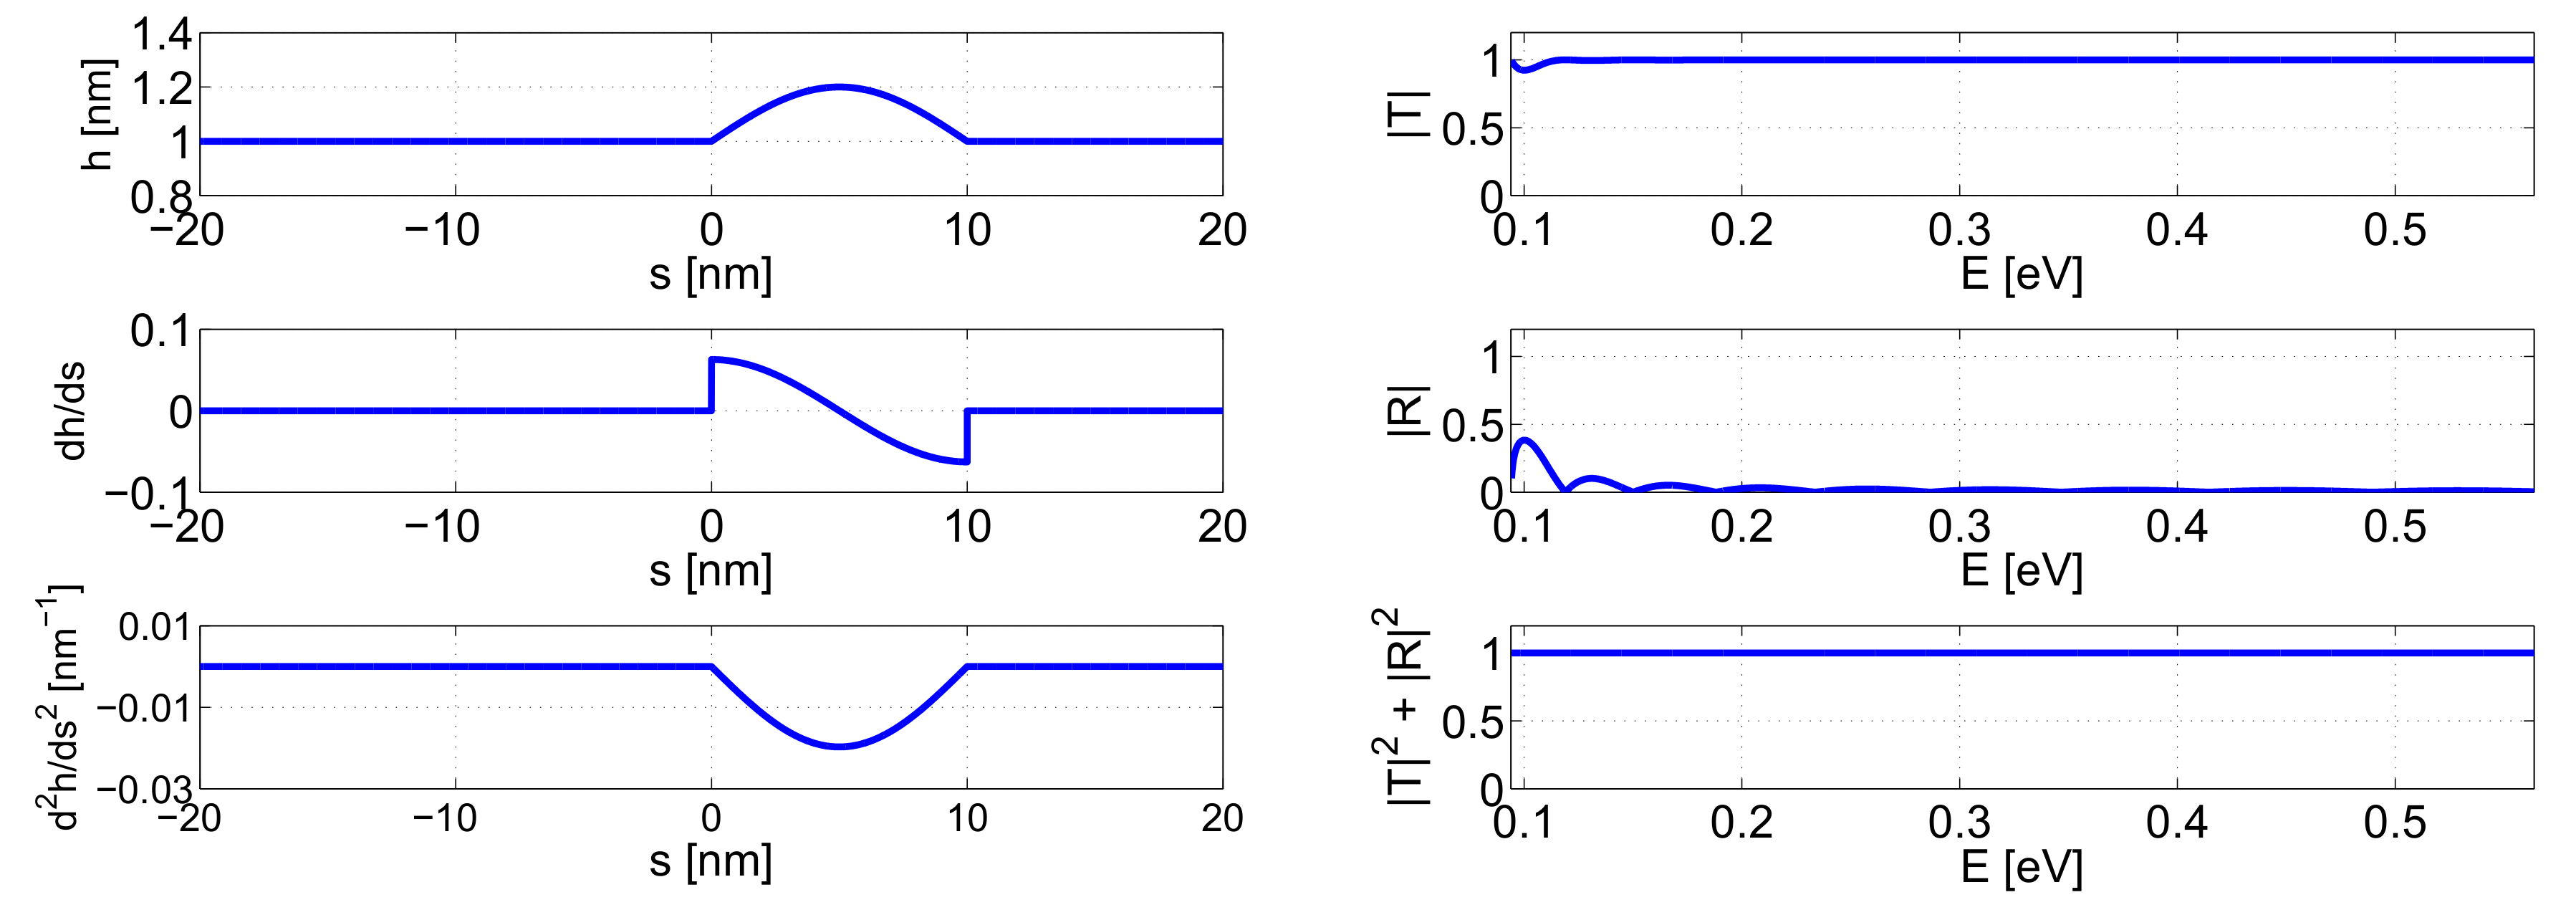
In Figure 2 (upper plot), we show the waveguide thickness and its first- and second-order derivatives as a function of the centerline coordinate u for the case where h 0 = 1   n m , b = 2   Å , L m = 10   n m , and n = 1 , ϵ = 1 .
In Figure 2 (lower plot), the transmission and reflection curves as a function of the energy of the quantum-mechanical particle are shown.
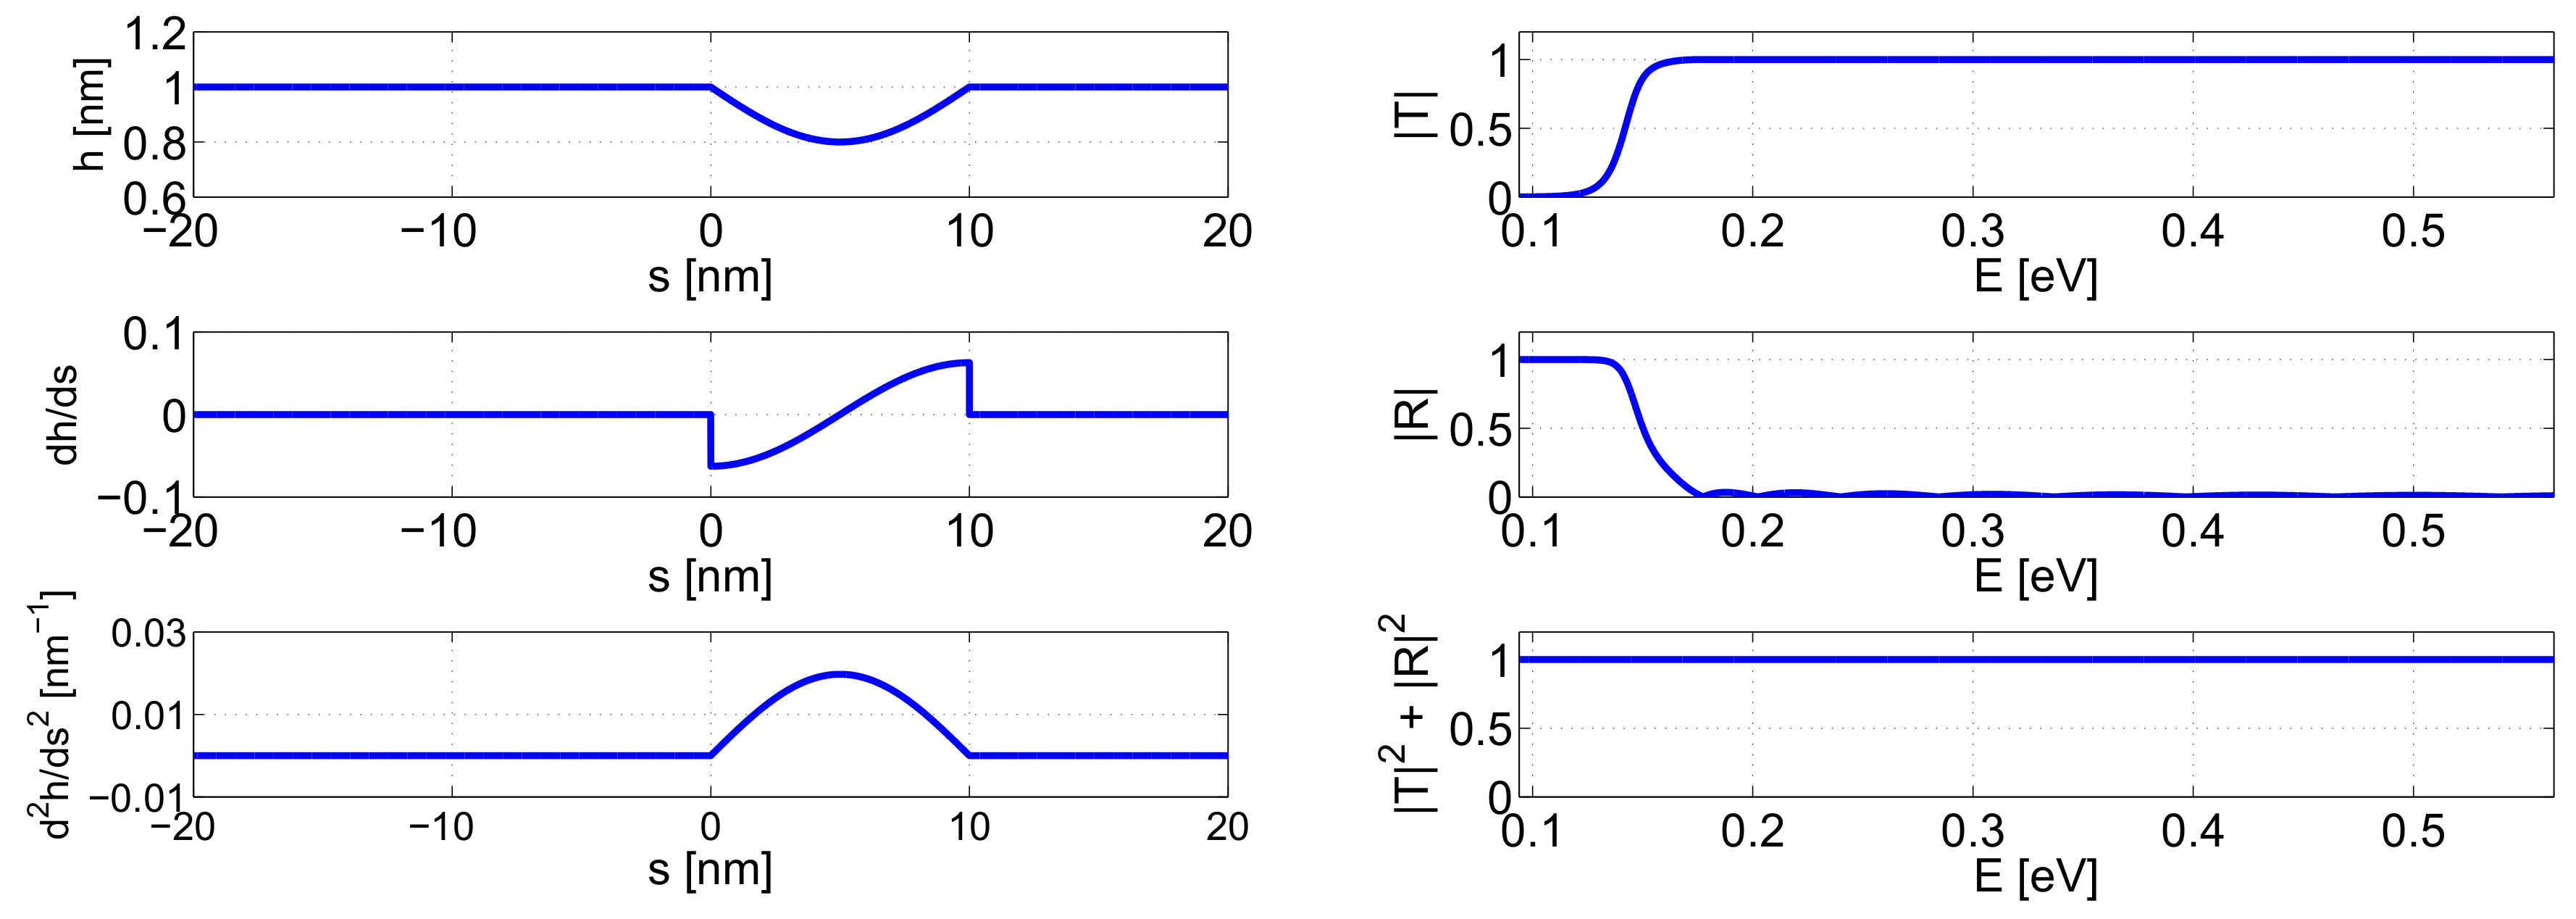
In Figure 3 (upper plot), we show the waveguide thickness and its first- and second-order derivatives as a function of the centerline coordinate u for the case where h 0 = 1   n m , b = 2   Å , L m = 10   n m , and n = 1 , ϵ = 1 .
In Figure 3 (lower plot), the transmission and reflection curves as a function of the energy of the quantum-mechanical particle are shown. The mass of the particle is the free-electron mass.
Note that a threshold energy is required for the particle to be transmitted to the right. This comes about as the thickness in the central region is lower than the thickness to the far left and right. Hence, the particle will essentially only propagate to the right if its energy is higher than the energy associated with the smallest thickness h min = h 0 b in the central region. Otherwise, if its energy is lower than 2 2 m π 2 4 ϵ 2 h min 2 , transmission can only take place by virtue of tunneling, i.e., with a small probability.
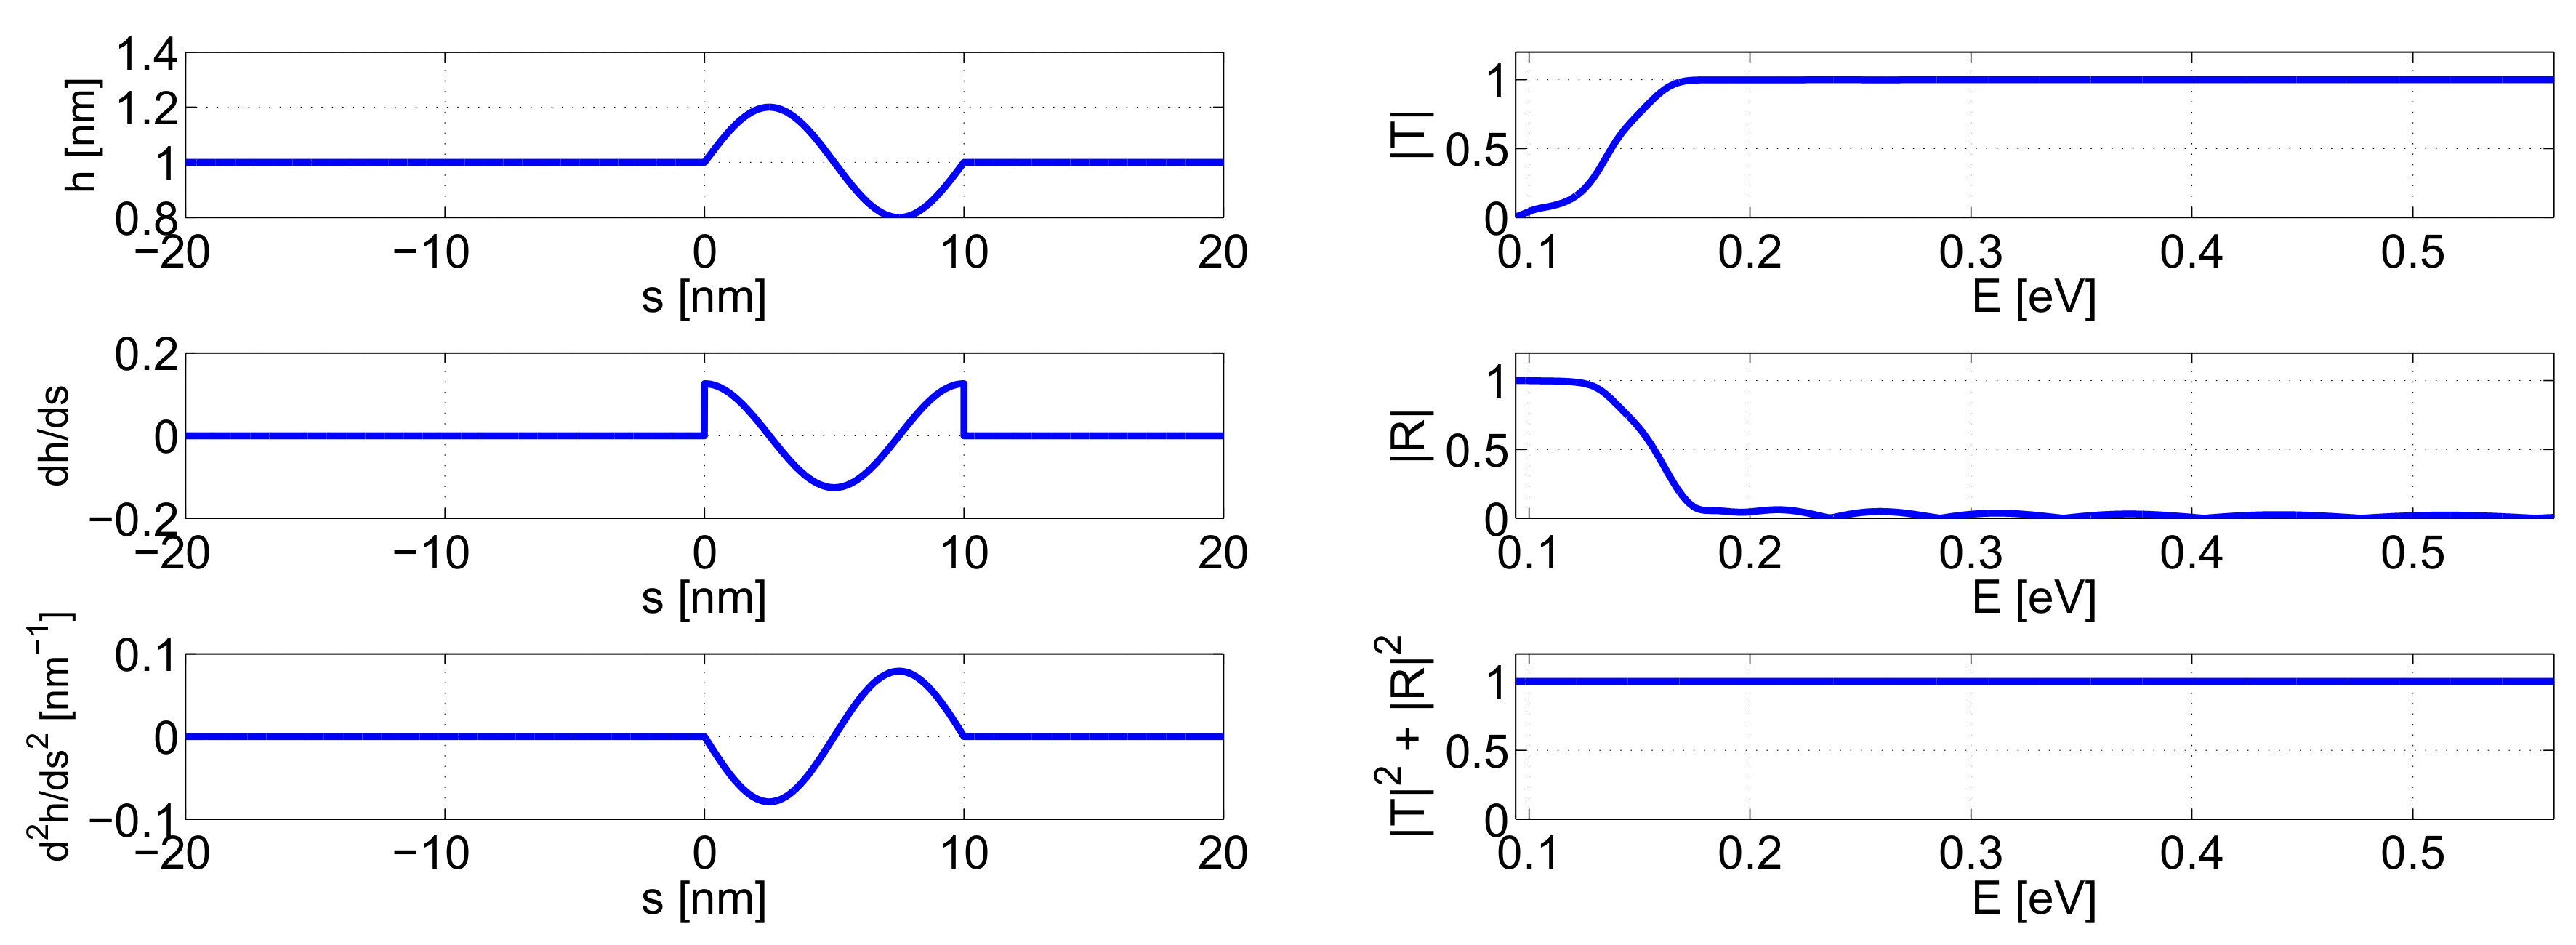
In Figure 4 (upper plot), we show the waveguide thickness and its first- and second-order derivatives as a function of the centerline coordinate u for the case where h 0 = 1   n m , b = 2   Å , L m = 10   n m , and n = 2 , ϵ = 1 .
In Figure 4 (lower plot), the transmission and reflection curves as a function of the energy of the quantum-mechanical particle are shown.
In this case, where h ( s ) follows a full period of a sine curve, the thickness is smaller than the thickness h 0 to the far left and right, for one half of the central region. Hence, again, a threshold is needed for the quantum-mechanical particle to be transmitted to the far right.
We point to that the 1D model can be used in a completely analogous way to calculate transmission properties of an arbitrarily curved quantum waveguide.

4. 3D Eigenstate Problems

We will first consider 3D curves with constant curvature, e.g., a straight line, a helix, and a circle. Moreover, we will consider quantum waveguides with two thickness variations: a linear (with varying slope) and a trigonometric (with varying amplitude, frequency, and phase).
Note that, for all curves with constant curvature, the 1D equation Equation (18) can be treated on equal footings, since in this case, the only effect of curvature is a shift in the energy E by m κ 2 2 2 L 0 2 .
We will, in all cases, consider a circular cross section. We choose the unit disk as our 2D parameter space and the first step is to calculate the first eigenvalue λ 0 and the expectation values R , R 2 , L , and L 2 . Using polar coordinates ( r , θ ) in the unit disk the ground state does not depend on the angle θ , so we have immediately that L = L 2 = 0 . As a function of the radius r we have a Bessel function J 0 ( j 0 , 1 r ) , where j 0 , 1 2.4 is the first zero of J 0 and λ 0 = j 0 , 1 2 5.78 . We have
J 0 = J 1 , J 1 = J 0 J 1 r , J 0 = J 1 = J 0 + J 1 r ,
and hence
R J 0 ( j 0 , 1 r ) = r j 0 , 1 J 0 ( j 0 , 1 r ) = r j 0 , 1 J 1 ( j 0 , 1 r ) , R 2 J 0 ( j 0 , 1 r ) = r j 0 , 1 J 0 ( j 0 , 1 r ) + r 2 j 0 , 1 2 J 0 ( j 0 , 1 r ) = r 2 j 0 , 1 2 J 0 ( j 0 , 1 r ) .
So
R = 0 j 0 , 1 J 1 ( t ) J 0 ( t ) t 2 d t / 0 j 0 , 1 J 0 ( t ) 2 t d t 1.00 ,
R 2 = 0 j 0 , 1 J 0 ( t ) 2 t 3 d t / 0 j 0 , 1 J 0 ( t ) 2 t d t 1.26 .

4.1. Line with Circular Cross Section

We will consider trigonometric variations
h ( s ) = 1 + α 2 sin ( β s ψ 0 ) ,
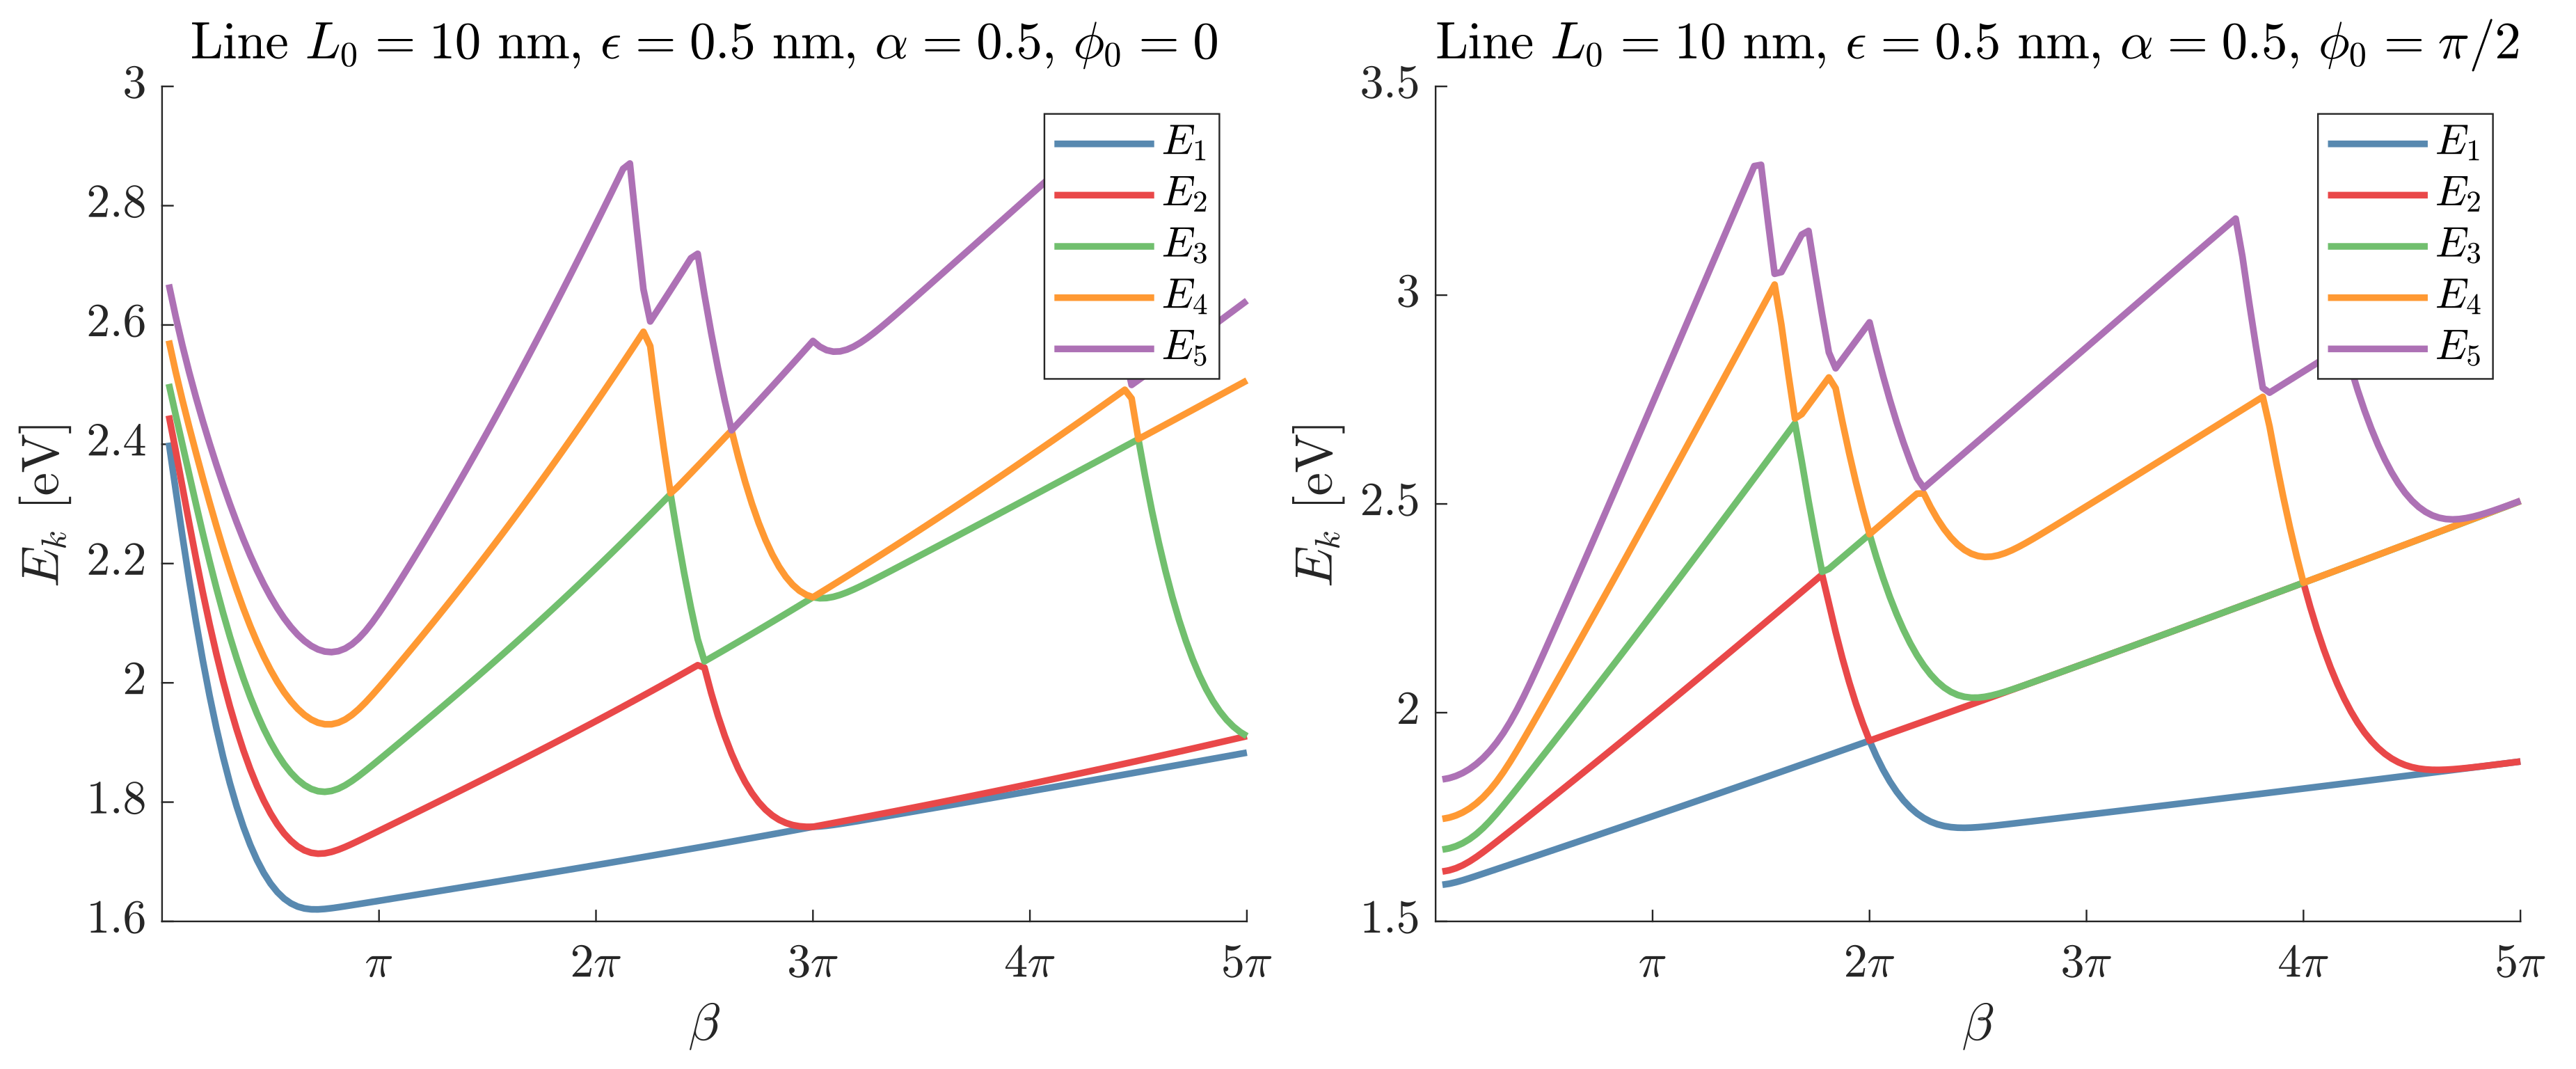
of the thickness along the line segment (of length L 0 = 10   n m and average thickness 1   n m ). More specifically, we have ϵ = 0.5   n m , α = 0.5 , and consider the cases ψ 0 = 0 , π / 2 and β [ π / 32 , 5 π ] . The result can be seen in Figure 5.
As mentioned before, any curve with constant curvature has essentially the same spectrum. The only difference from the straight line is a shift of the whole spectrum by m κ 2 2 2 L 0 2 .

4.2. Elliptic Helix with Circular Cross Section

By an elliptic helix, we mean a geodesic on an elliptic cylinder. That is, it can be parametrised as
r ( t ) = L 0 L a cos t , b sin t , c 0 t a 2 sin 2 τ + b 2 cos 2 τ d τ , t [ 0 , T ] ,
where L 0 is the required length and L = 0 T 1 + c 2 a 2 sin 2 t + b 2 cos 2 t d t . Notice that the third coordinate is arc length on the ellipse. We consider the case a , b > 0 and find that the speed and curvature is given by
r = L 0 L 1 + c 2 a 2 sin 2 t + b 2 cos 2 t ,
κ = L L 0 a b 1 + c 2 a 2 sin 2 t + b 2 cos 2 t 3 2 .
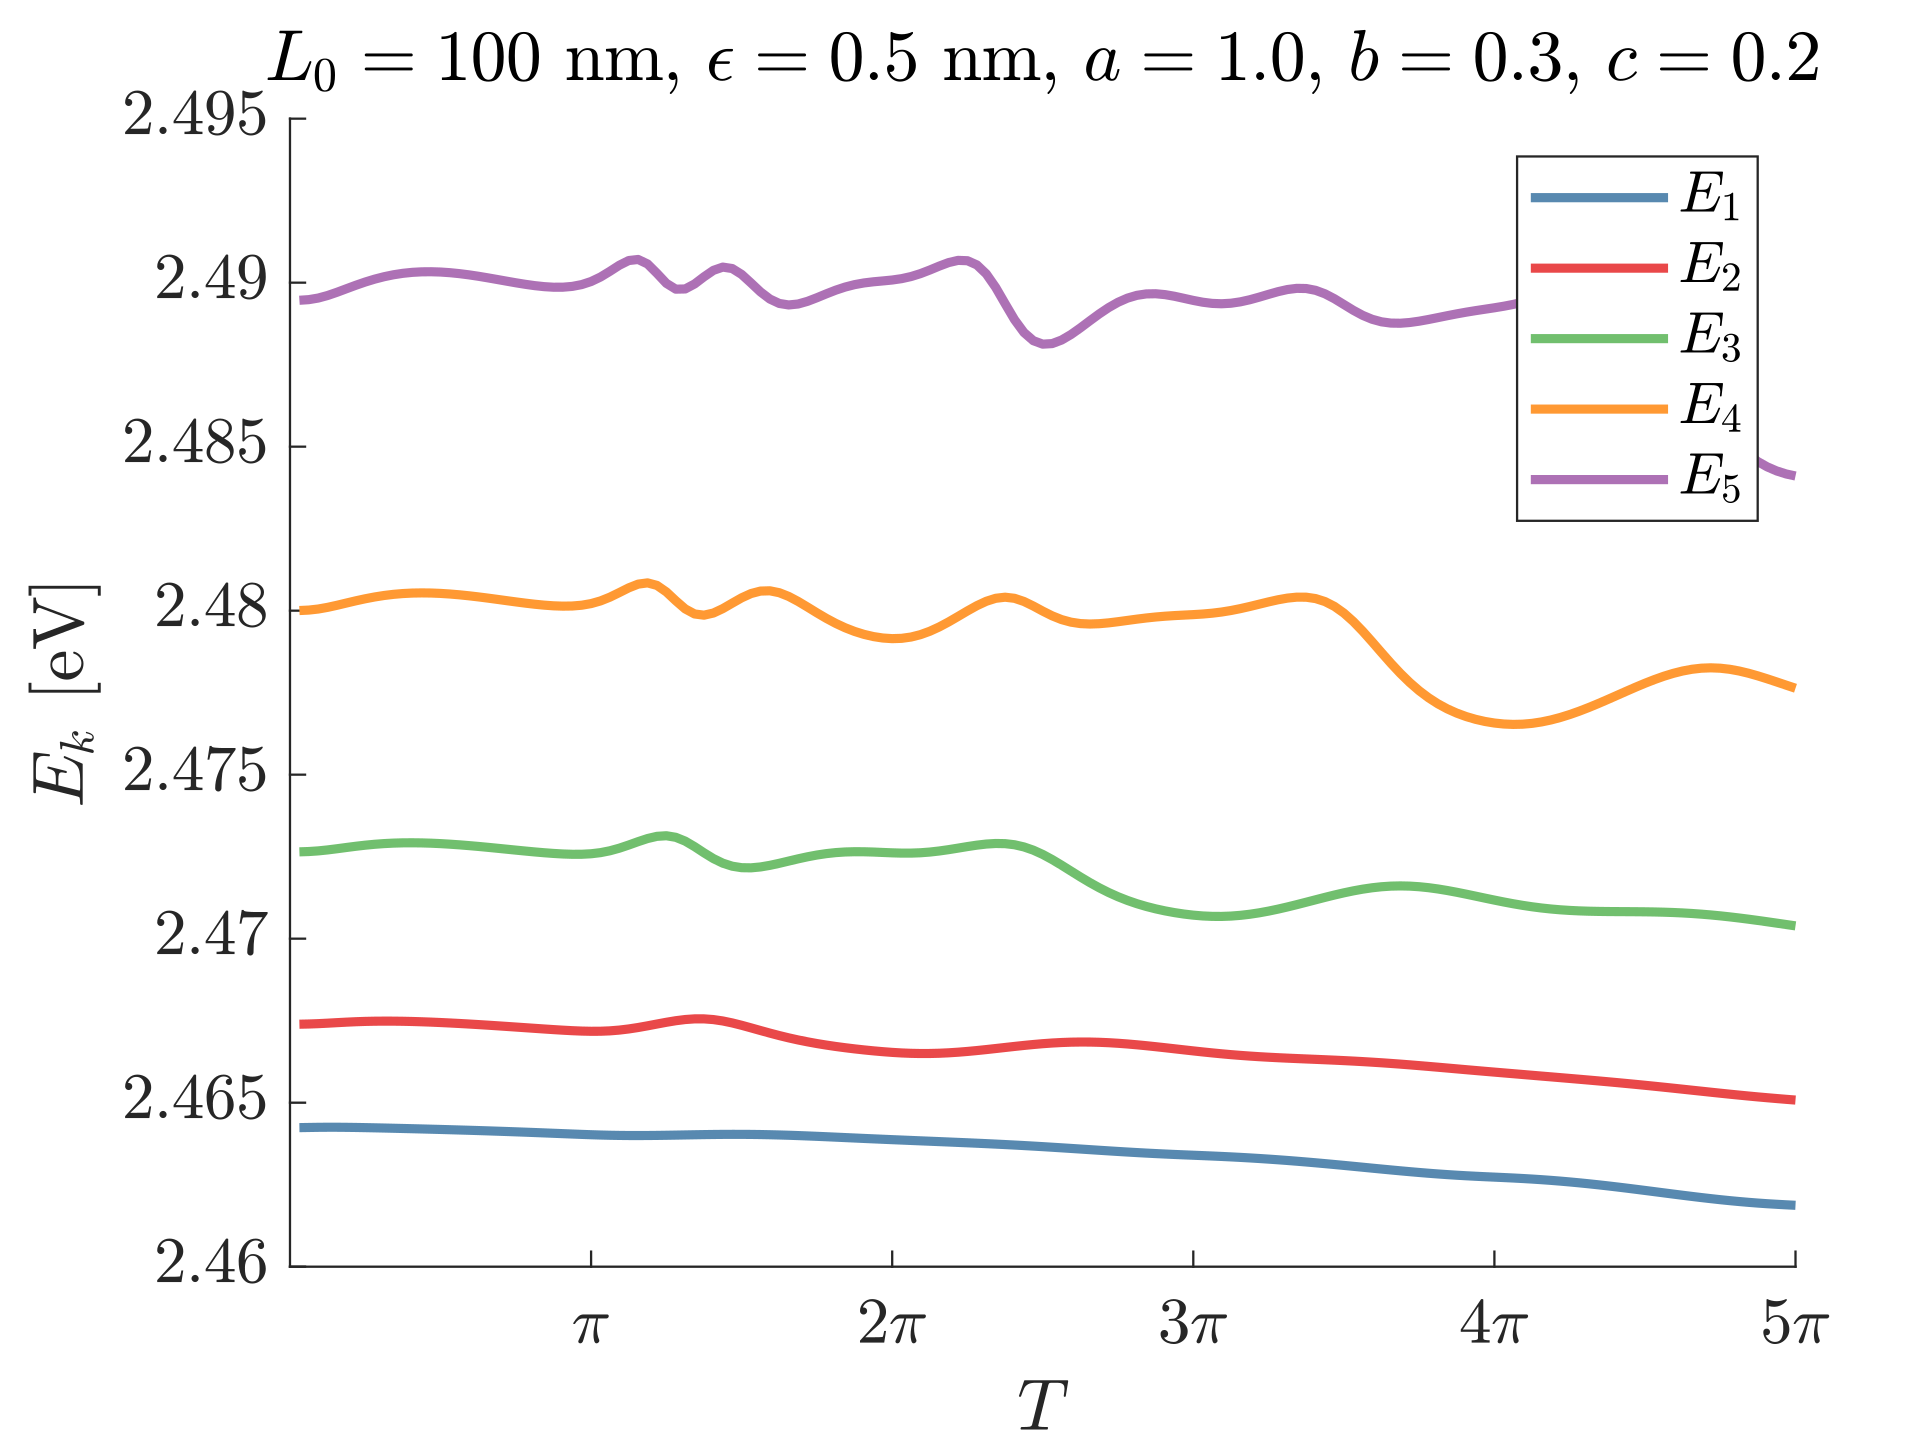
If a > b , then the maximal curvature is L L 0 a b 2 ( 1 + c 2 ) . We let T [ π / 32 , 5 π ] and have length L 0 = 100   n m and average thickness 1   n m . The energies of the first five states are shown in Figure 6.
We clearly have an effect, but not nearly as strong as when we vary the thickness.

4.3. Closed Ellipse with Circular Cross Section

We now consider a closed ellipse parametrised as
r ( t ) = L 0 L a cos t , b sin t , 0 , t [ 0 , 2 π ] ,
where L is a scaling such that the length is L 0 , i.e.,
L = 0 2 π a 2 sin 2 t + b 2 cos 2 t d t .
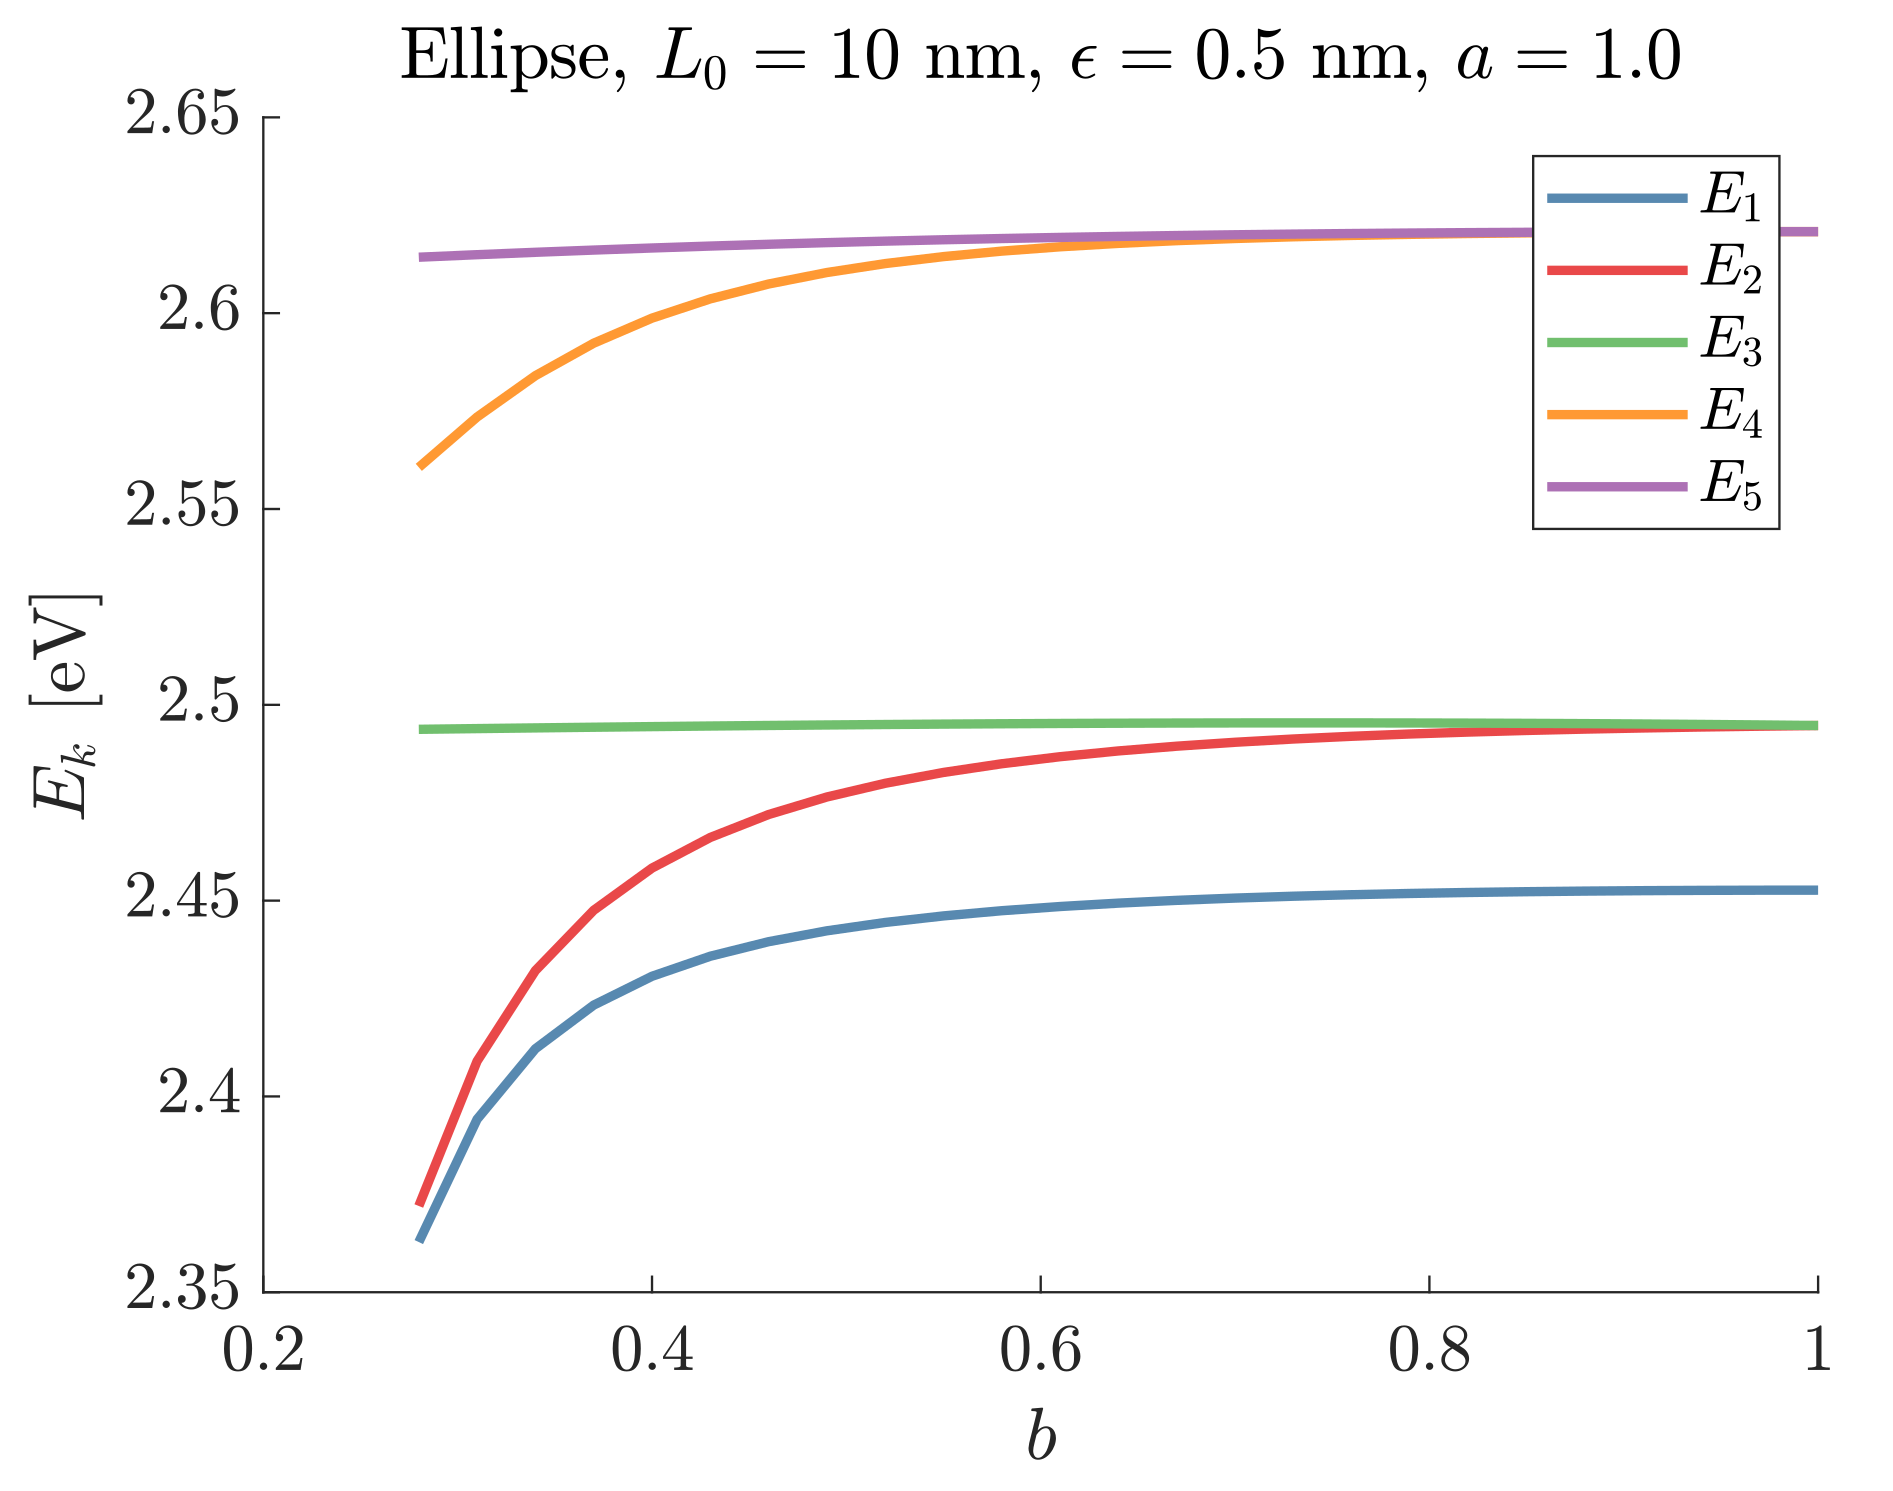
With length L 0 = 10   n m , constant width 1   n m , letting a = 1 , and considering b [ 0.25 , 1 ] we obtain the energies of the first five states shown in Figure 7.

4.4. Tennis Ball Curve with a Square Cross Section

The curve
r ( t ) = ( a cos t + b cos ( 3 t ) , a sin t b sin ( 3 t ) , 2 a b sin 2 t ) , t [ 0 , 2 π ] ,
is a closed curve on the sphere with radius a + b resembling the seam of a tennis ball. When a and b are positive, the length of the curve is L = 4 ( a + 3 b ) E 2 i a b a + 3 b where E is the complete elliptic integral of the second kind. Since the curve is a spherical curve, it is easy to find a minimal rotating frame. We can choose the surface normal as one of the basis vectors, i.e., a minimal rotating frame is obtained by
t = r r , p = r r = r a + b , q = t × p .
The minimal rotating frame obviously closes up, but by choosing a constant ω = n π 2 L , where L is the length of the curve, we can twist the tube n quarters. We let b = a 20 and choose a, such that the length of the curve is 25   n m .
We now consider a square cross section, i.e., Ω 0 = [ 1 , 1 ] × [ 1 , 1 ] . The result from letting n = 0 , 1 , 2 is shown in Figure 8.
The ground state is χ 0 = cos π 2 v cos π 2 w , the eigenvalue is λ 0 = π 2 2 , and we obviously have
R χ 0 = v π 2 sin π 2 v cos π 2 w w π 2 cos π 2 v sin π 2 w , R 2 χ 0 = v π 2 sin π 2 v cos π 2 w w π 2 cos π 2 v sin π 2 w v 2 π 2 4 cos π 2 v cos π 2 w + v w π 2 2 sin π 2 v sin π 2 w w 2 π 2 4 cos π 2 v cos π 2 w , L χ 0 = i v π 2 cos π 2 v sin π 2 w + i w π 2 sin π 2 v cos π 2 w , L 2 χ 0 = v π 2 sin π 2 v cos π 2 w w π 2 cos π 2 v sin π 2 w + v 2 π 2 4 cos π 2 v cos π 2 w + v w π 2 2 sin π 2 v sin π 2 w + w 2 π 2 4 cos π 2 v cos π 2 w .
As χ 0 2 = 1 1 1 1 cos 2 π 2 v cos 2 π 2 w d v d w = 1 ,
R = 1 1 1 1 ( R χ 0 ) χ 0 d v d w = 1 , R 2 = 1 1 1 1 ( R 2 χ 0 ) χ 0 d v d w = 1 2 π 2 6 1.145 , L = 1 1 1 1 ( L χ 0 ) χ 0 d v d w = 0 , L 2 = 1 1 1 1 ( L 2 χ 0 ) χ 0 d v d w = 1408 81 π 2 16 9 0.0165 .
Consider a trigonometric variation, Equation (34), of the thickness. As a closed structure is considered, we need to have β L = 2 π m . In Table 1,
The first five eigenvalues in the case of no turn, α = 0.5 , ψ 0 = 0 , L = 25   n m , and ϵ = 0.5   n m are listed. The cases of a quarter turn and a half turn yield the same eigenvalues to four digits precision. This is due to the fact that the term ω 2 ( L 2 L 2 ) is much smaller than the term h r h 2 R 2 R 2 .

5. Conclusions

A numerically effective 1D model describing eigenstates and energies of an arbitrarily complex quantum waveguide geometry is presented. A combination of differential geometry and perturbation theory is used to derive a 1D model describing the added effects of waveguide curvature, varying cross-sectional dimensions and frame rotation along the waveguide. A detailed comparison of the present 1D model with full wave simulations is carried out and excellent agreement is demonstrated for a number of complex waveguide geometries, many of which cannot be tackled using earlier 1D models. The only significant assumption of the present 1D model is that the cross-sectional dimensions are significantly smaller than the waveguide length, although experience has shown this restriction is not a severe one. A main new result is that the individual effects of curvature, thickness variation, and frame orientation enter as separate terms in a geometric potential only.

Author Contributions

Conceptualization, J.G. and M.W.; methodology, J.G. and M.W.; software, J.G. and M.W.; validation, J.G.; formal analysis, J.G. and M.W.; writing—original draft preparation, J.G. and M.W. All authors have read and agreed to the published version of the manuscript.

Funding

This research received no external funding.

Acknowledgments

J.G. is grateful for hospitality and financial support during his stay at the Beijing Institute of Nanoenergy and Nanosciences, Chinese Academy of Sciences, Beijing, China.

Conflicts of Interest

The authors declare no conflict of interest.

Appendix A. Validation

In this section, we will validate the 1D equation by comparing it to accurate full 2D calculations. The reason we consider 2D examples is that it would be very expensive (in terms of computer power and time) to obtain the required accuracy for full 3D calculations.
In 2D, we have κ 1 = κ and κ 2 = ω = 0 . We let v [ 1 , 1 ] . Then, the transversal ground state is cos π 2 v , λ 0 = π 2 4 , and if we let R = v v act on it, we obtain
v v cos π 2 v = π 2 v sin π 2 v , v v 2 cos π 2 v = π 2 v sin π 2 v π 2 4 v 2 cos π 2 v ,
and hence
R = π 2 1 1 v sin π 2 v cos π 2 v d v = 1 2 , R 2 = R π 2 4 1 1 v 2 cos 2 π 2 v d v = π 2 12 .
The approximative 1D equation Equation (15) then reads
d d u + 1 2 h h 2 χ + 1 4 h h 2 1 + π 2 3 κ 2 + π 2 ϵ 2 h 2 χ = λ χ .

Appendix A.1. Logarithmic Spiral

We now consider a logarithmic spiral. In polar coordinates ( r , θ ) it is given by r = c e b θ . Letting b = cot μ , we have
d r d θ = b r , d s d θ = r sin μ , s = r r 0 cos μ , κ = sin μ r .
Furthermore, t = e ( θ + μ ) and n = e θ + μ + π 2 , where e ( θ ) = ( cos θ , sin θ ) . We have
s = r c cos μ r = c + s cos μ θ = 1 b log c + s cos μ c .
If we let c = R sin μ , then
r = R sin μ + s cos μ , θ = 1 b log r R sin μ = sin μ cos μ log R + s cot μ R , κ = sin μ r = 1 R + s cot μ .
We have, in particular, the arc length parametrisation
r ( θ ) e ( θ ) = ( R sin μ + s cos μ ) e sin μ cos μ log R + s cot μ R .
We consider the case R = 1 and μ = π / 4 and an exponential varying thickness, h = α e α u e α 1 .
Figure A1. The six different cases in Table A1.
Applsci 10 07240 g0a1
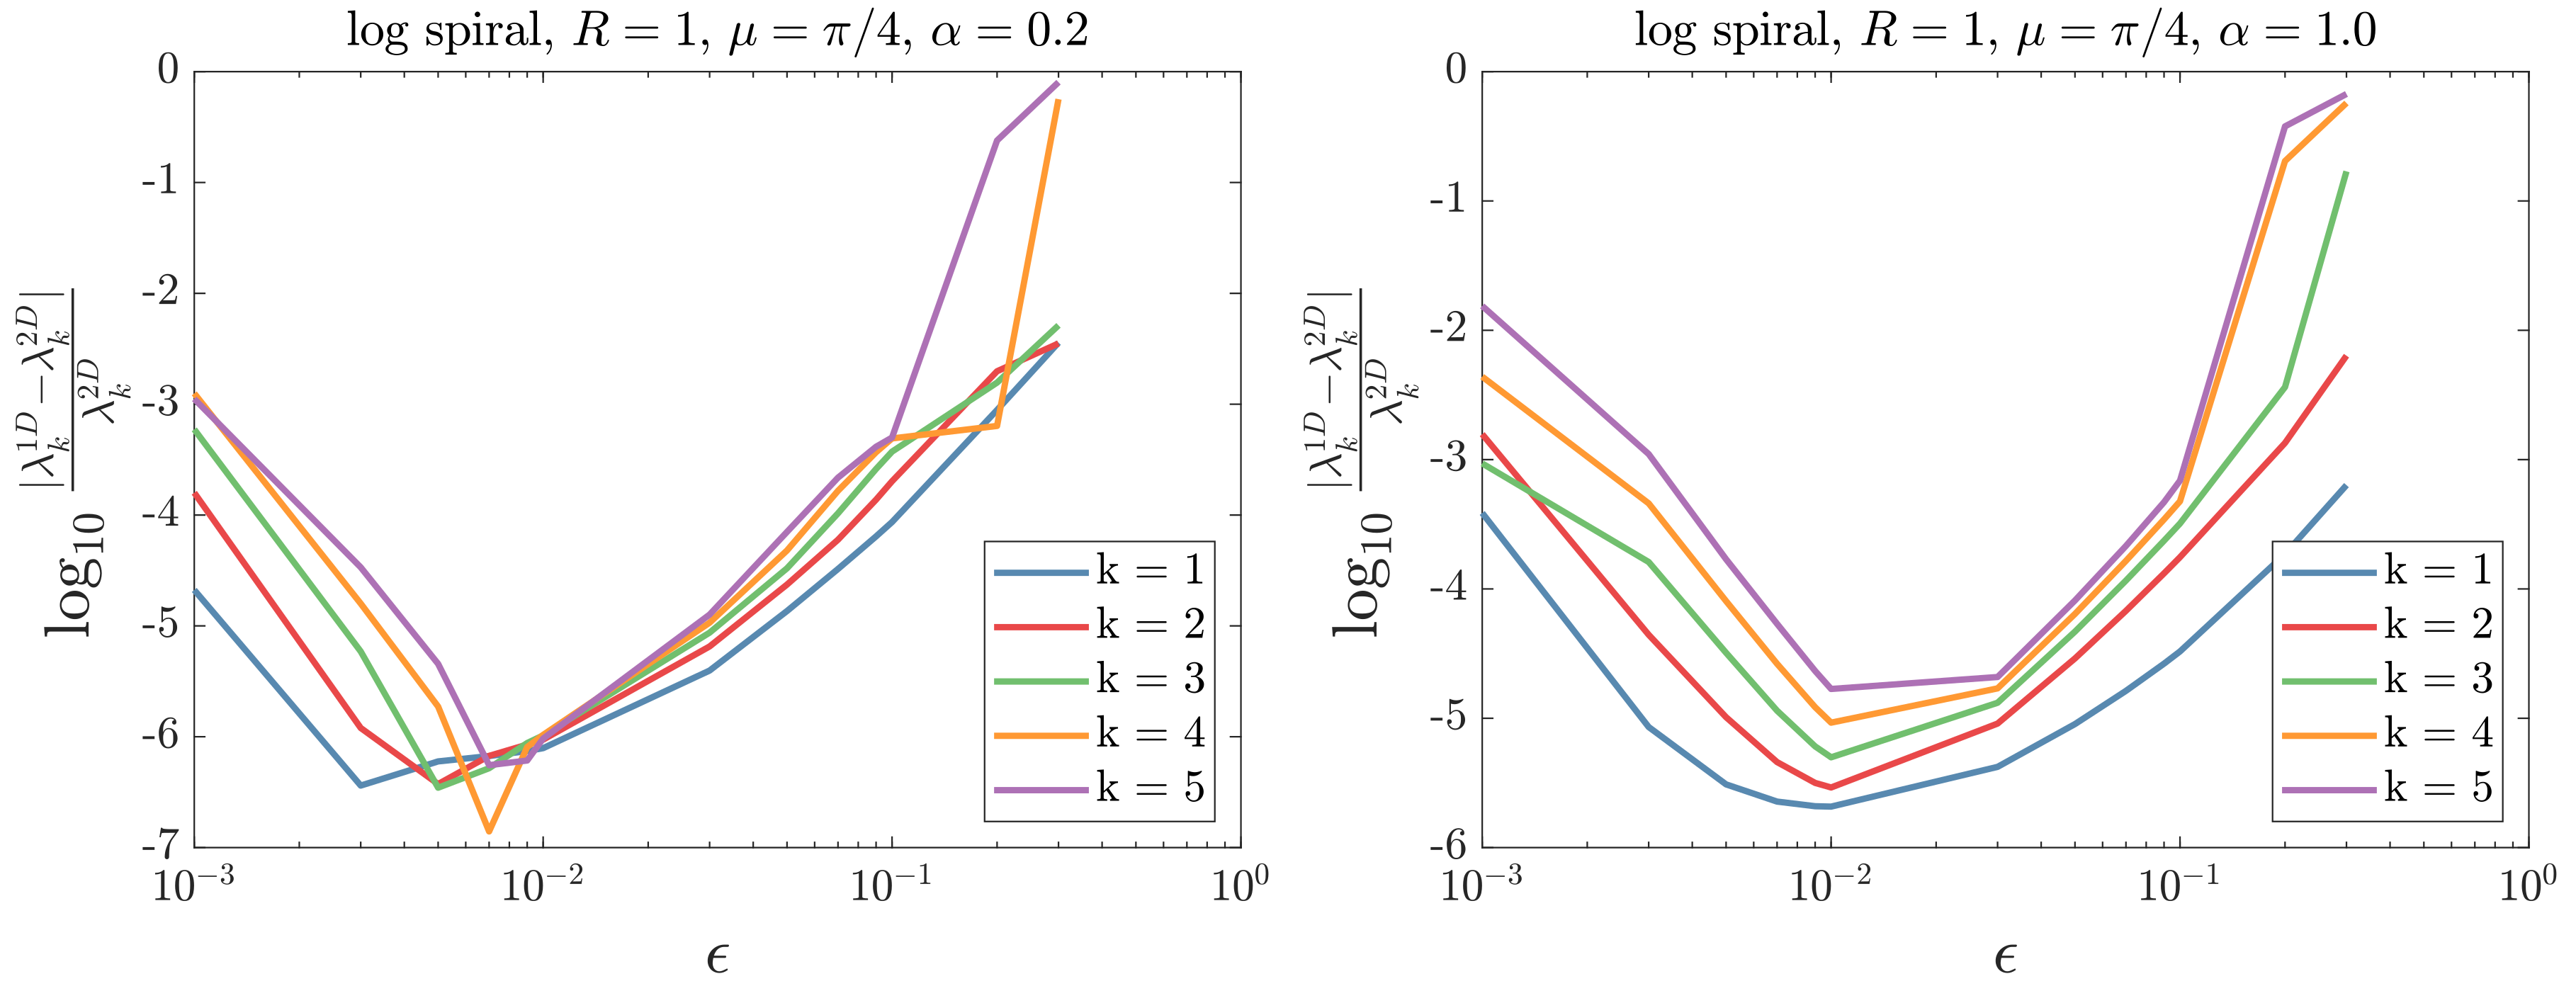
In Figure A3, we plot the difference between the 1D and 2D calculations as a function of ϵ for different values of α .
When ϵ is very small, the difference is seen to increase instead of decrease. This is due to an increase in the discretisation error from solving the exact 2D equation.
For the 1D-equation, we used B-splines of degree 3 and 64 knot intervals. That leads to a system matrix of size 65 × 65 . For the 2D calculations we used standard finite element analysis on a mesh of size 256 × 256 and with basis functions of degree 3. That leads to a system matrix of size more than 10 6 × 10 6 (in 3D we would have a size greater than 2 × 10 9 × 2 × 10 9 . The reason we need higher resolution for the 2D calculation is that we are interested in the differences λ n λ 0 and using the 1D model we calculate this quantity directly, while in the 2D case we calculate λ n and as the difference is small we need a very high precision. Even if we had used a mesh of size 65 in all directions we would have a system matrix of size more than 8 × 10 4 × 8 × 10 4 in 2D and 4 × 10 7 × 4 × 10 7 in 3D.
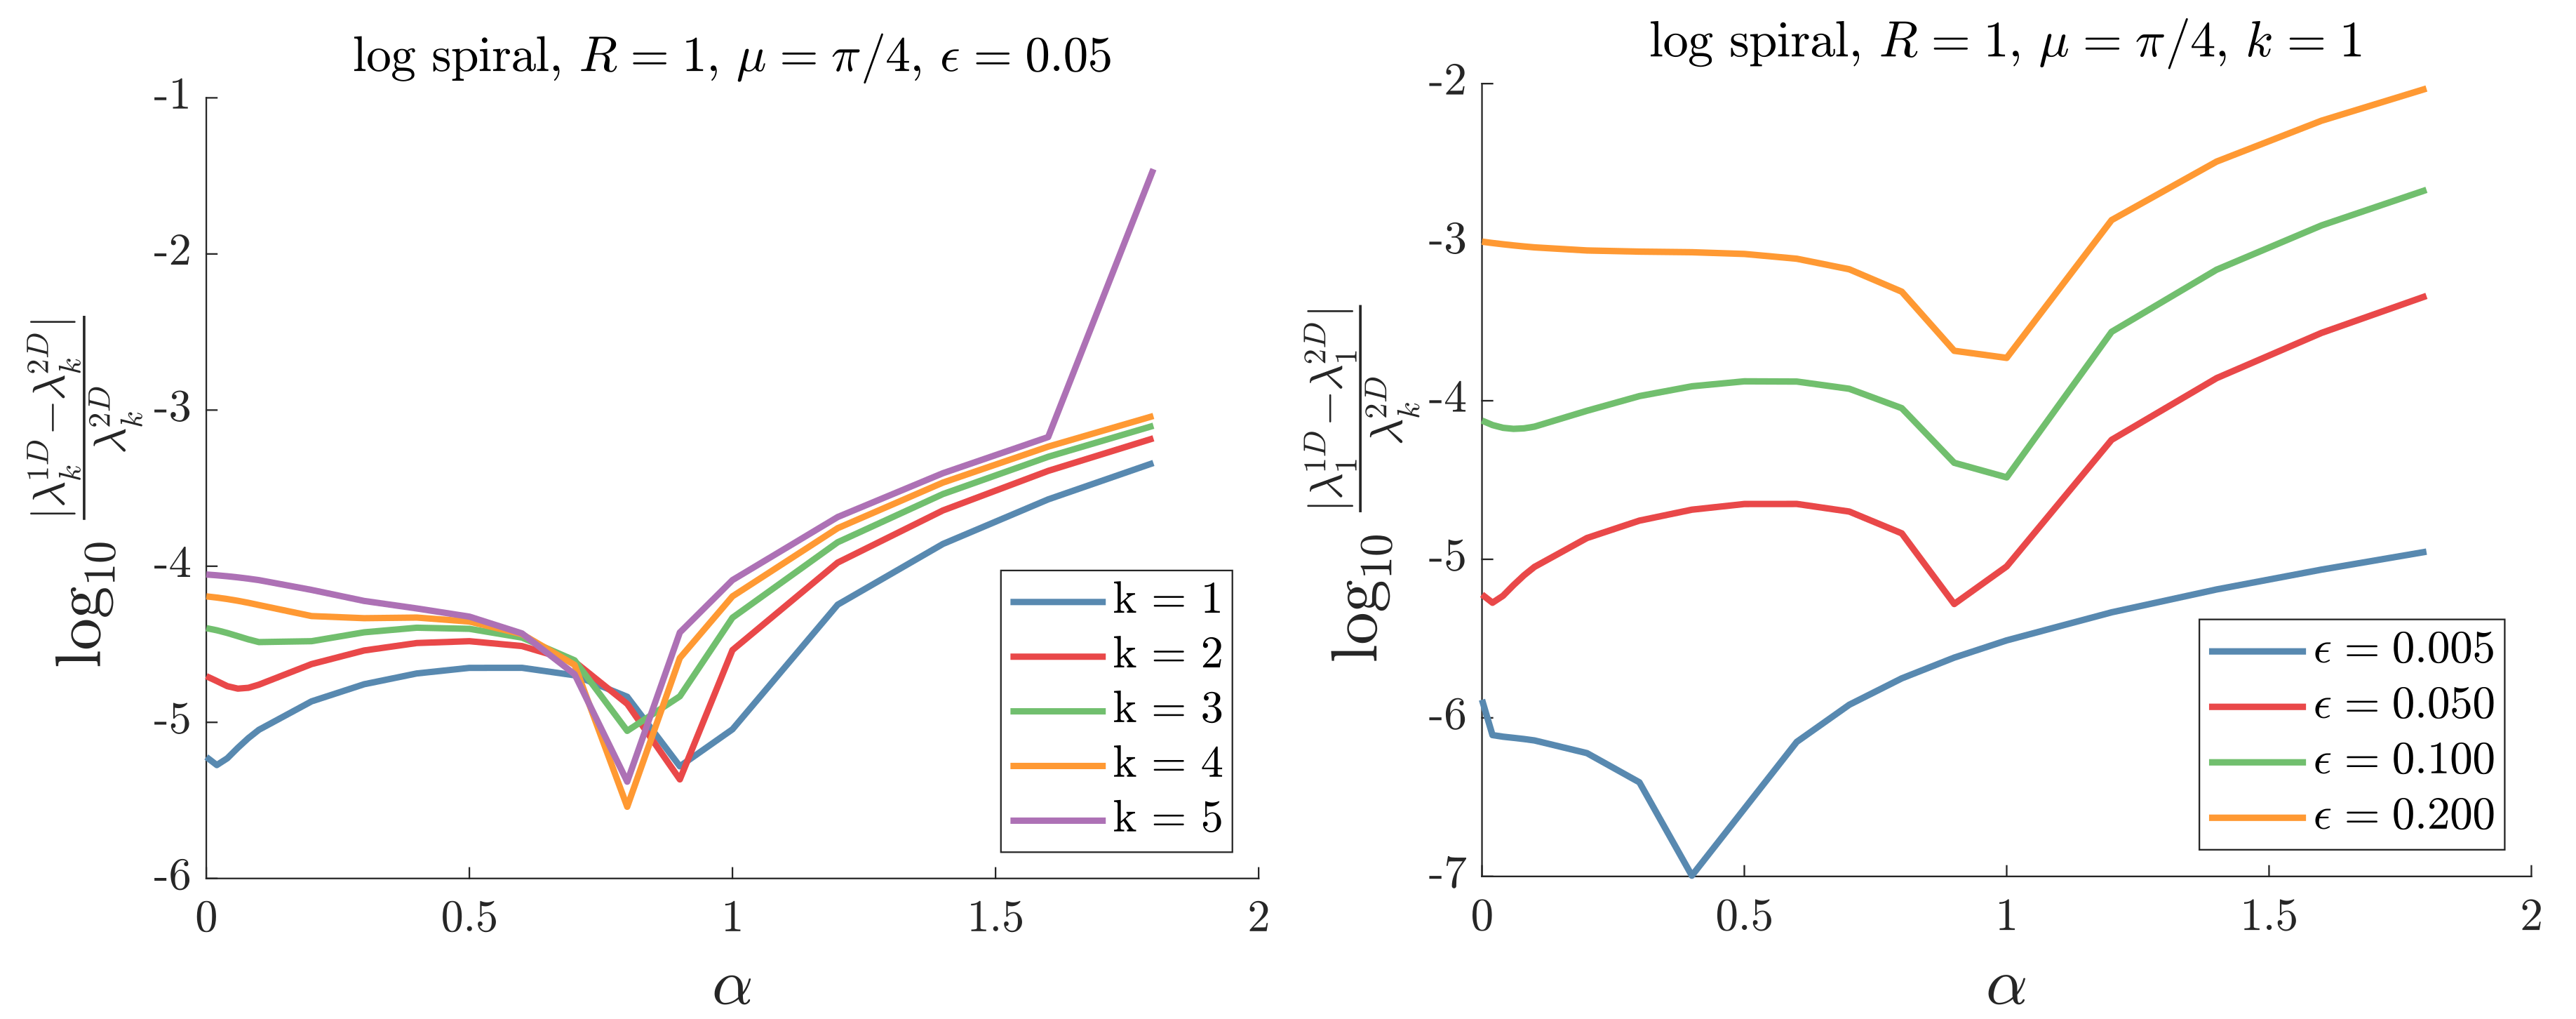
Table A1. The first five eigenvalues for the case h = α e α u e α 1 , ϵ = 0.05 . Calculated using both 1D and 2D equations.
α λ 1 λ 2 λ 3 λ 4 λ 5
0.01D996.711026.321075.661144.751233.58
2D996.721026.341075.711144.821233.69
0.21D925.101015.991094.111169.731255.79
2D925.121016.021094.151169.781255.88
0.41D834.43969.691088.591199.901307.49
2D834.45969.721088.641199.951307.56
0.61D752.84918.861068.121210.191348.52
2D752.86918.891068.161210.241348.57
0.81D682.39871.211044.481211.891376.83
2D682.39871.221044.491211.891376.82
1.01D622.31828.741021.791210.851399.10
2D622.31828.721021.741210.771398.99
Figure A2. The relative difference between 1D and 2D calculations as a function of α . (left) The first five eigenvalues in the case ϵ = 0.05 . (right) The first eigenvalue for different values of ϵ .
Applsci 10 07240 g0a2
Figure A3. The relative difference between 1D and 2D calculations as a function of ϵ .
Applsci 10 07240 g0a3
Numerical analyses of the logarithmic spiral in cases with a linearly or a trigonometrically varying thickness were also carried out. Compared to the exponentially varying thickness case, the error analysis gives approximately the same good result for the trigonometric case, while even smaller errors are found for the linearly varying thickness case. Similar conclusions are found for the cases with straight and circular-arc waveguides.
We now consider the case R = 1 , μ = 0.45 π , with θ [ 0 , 3 π ] for a linearly varying thickness h = 1 + α ( s β ) , with α = ± 0.8 / L and β = L / 2 , where L = R tan μ ( e 3 π cot μ 1 ) is the length of the arc. The two cases are depicted in Figure A4.
Figure A4. The two cases R = 1 , μ = 0.45 π , ϵ = 0.3 , and α = ± 0.8 / L , in Table A2. The colours represent the fifth eigenfunction calculated based on the 2D equation.
Applsci 10 07240 g0a4
In Table A2, we have listed the first five eigenvalues.
Table A2. Eigenvalues for the longer spirals.
α L λ 1 λ 2 λ 3 λ 4 λ 5
−0.81D15.9917.6419.0920.4421.75
2D15.8817.5819.0620.4321.75
0.81D16.0017.6519.0920.4521.75
2D15.9917.6419.0820.4421.75
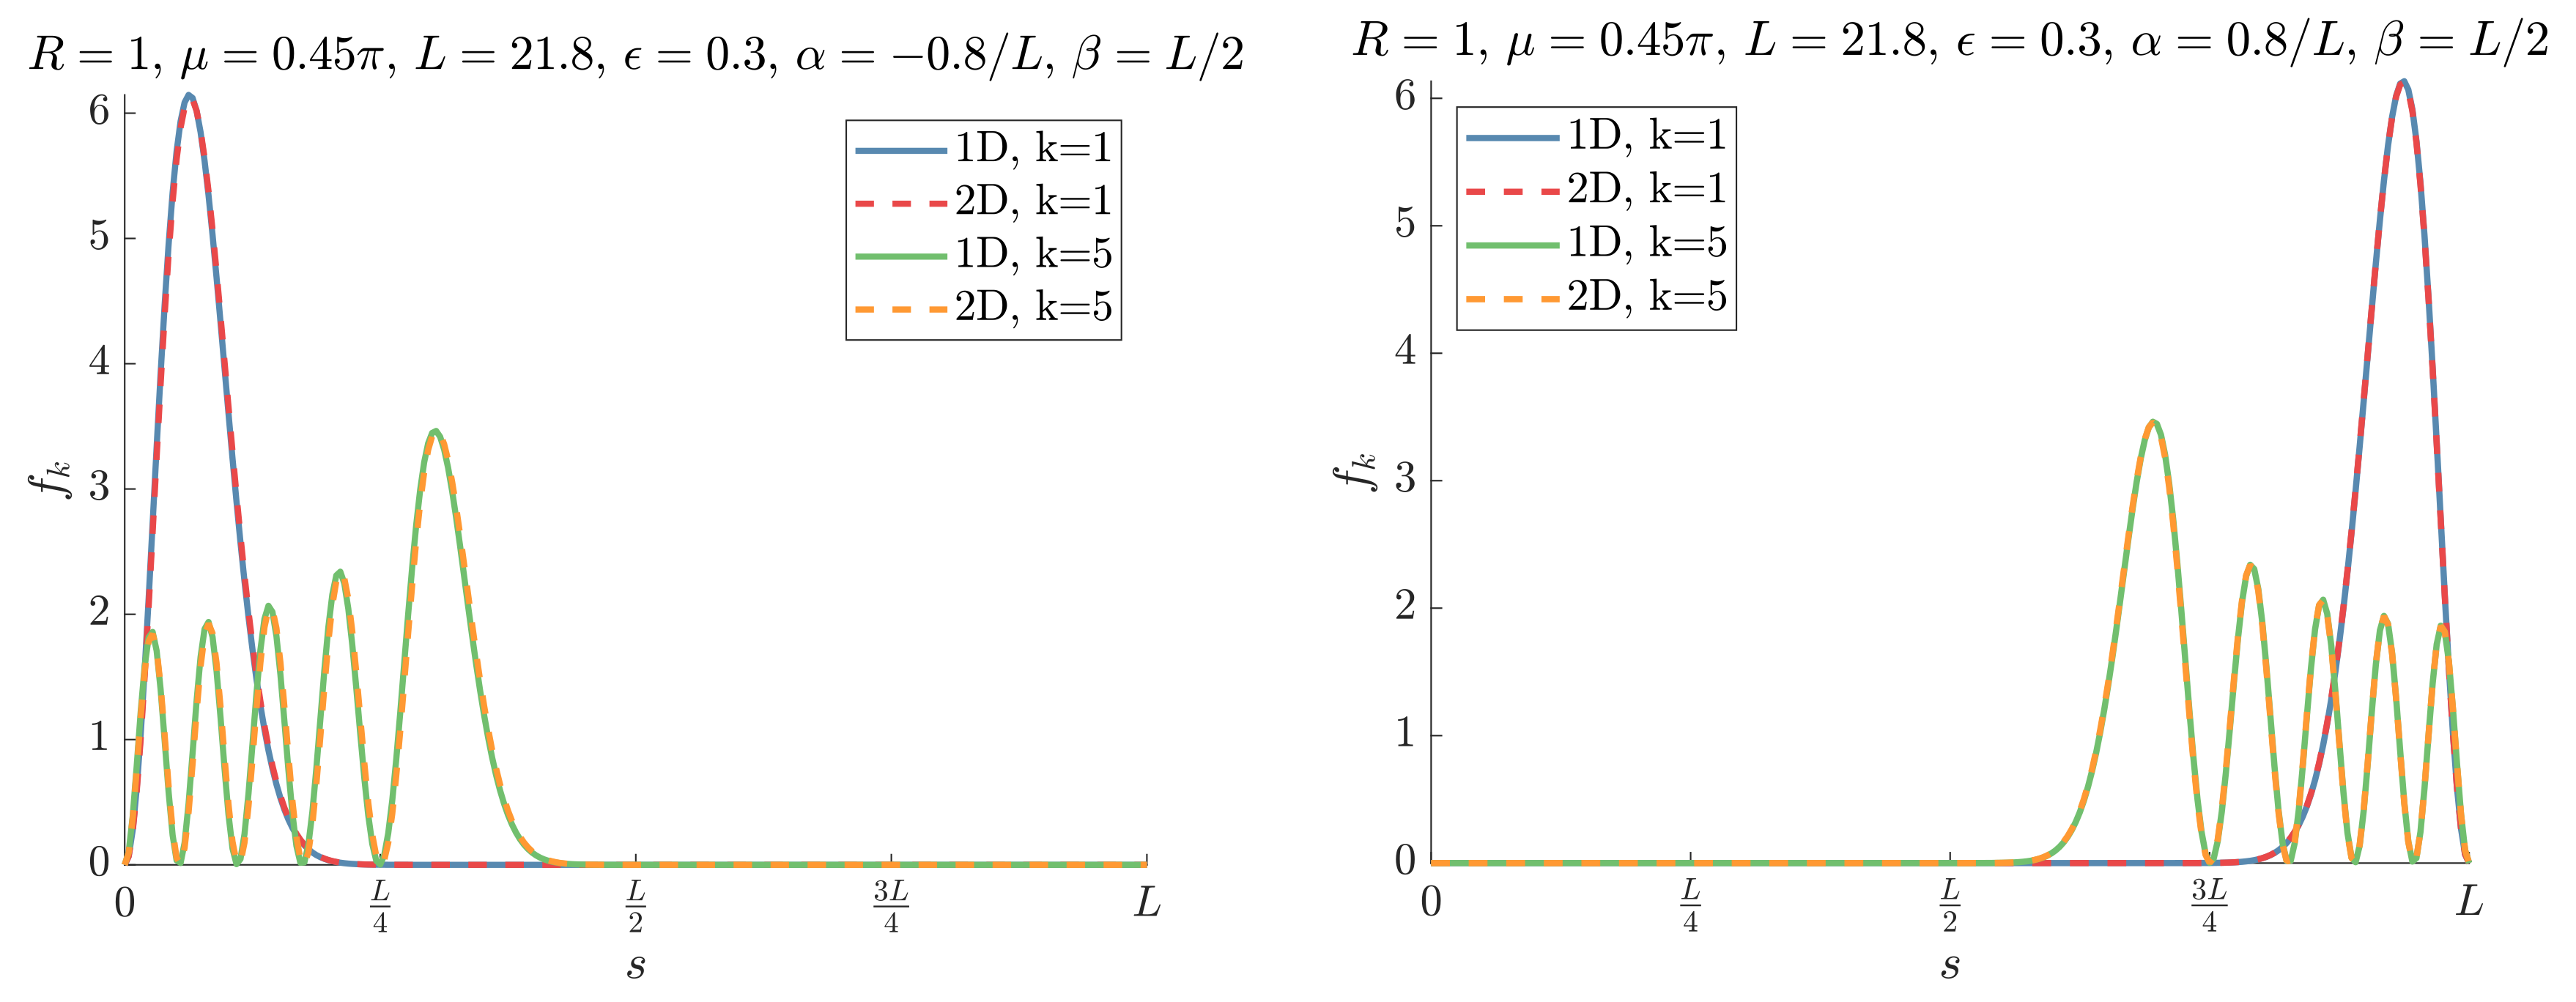
In order to compare the eigenfunctions obtained from the 2D and 1D calculations, respectively, we calculate the probability density along the curve. The determinant of the metric tensor is G ( s , v ) = ϵ 2 h ( s ) 2 F ( s , v ) hence for the 2D calculation the probability density along the curve is
f 2 , k ( s ) = h ( s ) 2 1 1 | ψ k ( s , v ) | 2 F ( s , v ) d v 0 L h ( s ) 2 1 1 | ψ k ( s , v ) | 2 F ( s , v ) d v d s ,
while for the 1D calulation it is
f 1 , k ( s ) = h ( s ) 2 | χ u , k ( s ) | 2 0 L h ( s ) 2 | χ u , k ( s ) | 2 d s .
In Figure A5, we have plotted the probability density for the first and fifth state using the 1D and 2D equations. We have only shown the cases of the first and the fifth eigenfunction, but the good agreement between probability densities obtained from the 1D and 2D equations applies to the other cases as well.
Figure A5. The probability density for the first and the fifth state.
Applsci 10 07240 g0a5

Appendix B. Significance of the Different Terms

We consider the case of a line with length L = 1 and no rotation, that is we have the 1D equation Equation (15) with κ = 0 . In order to examine the significance of the different terms we will consider the eigenvalue problem
d d s h h R 2 ϕ + V ϕ = λ ϕ , = 1 , 2 , 3 , 4 ,
where the potential V is given by
V 1 ( s ) = λ 0 ϵ 2 , [ 0 ]
V 2 ( s ) = h ( s ) h ( s ) R 2 R 2 + λ 0 ϵ 2 , [ 0 ]
V 3 ( s ) = λ 0 ϵ 2 h ( s ) 2 , [ 0 ]
V 4 ( s ) = h ( s ) h ( s ) 2 R 2 R 2 + λ 0 ϵ 2 h ( s ) 2 .
Observe that case (A4) gives the full 1D equation. It is clear that the different geometric potentials lead to pronounced differences in the eigenvalues. We furthermore consider ϵ = 0.03 and
h ( s ) = 1 + e β ( s 1 / 2 ) 1 + 0 1 e β ( s 1 / 2 ) d s ,
with β = 20 and 1000. In Table A3 we have listed the first five eigenvalues
Table A3. Eigenvalues for β = 20 and β = 1000 .
Case λ 1 λ 2 λ 3 λ 4 λ 5
(A1)74.13103.74153.08222.17311.00
(A2)81.25112.16157.22228.03316.90
(A3)57.48110.62167.66236.54324.39
(A4)63.80120.12173.19241.69330.02
Case λ 1 λ 2 λ 3 λ 4 λ 5
(A1)74.13103.74153.08222.17311.00
(A2)101.52105.88210.91230.51385.76
(A3)72.45110.92153.34228.77311.94
(A4)108.18113.17215.24237.46386.54
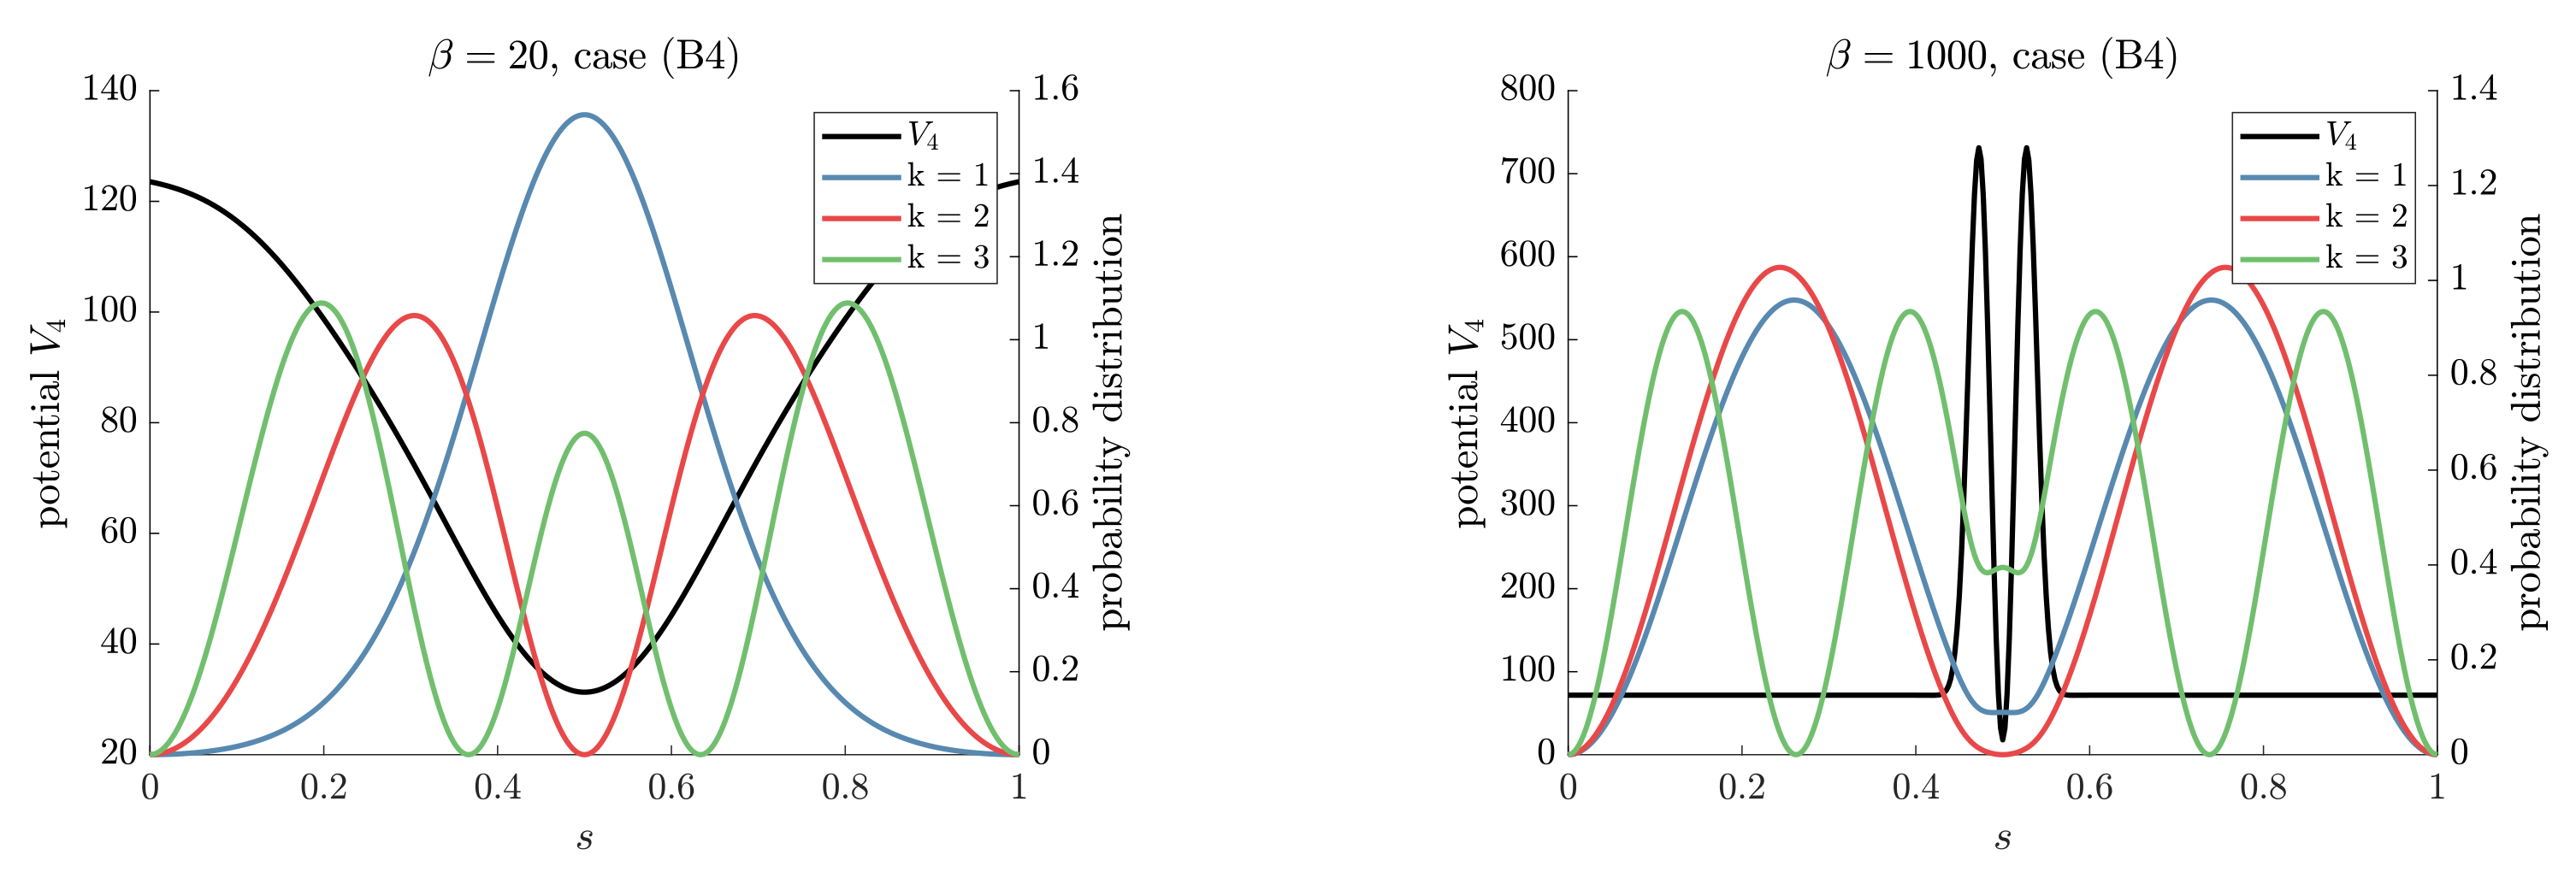
And in Figure A6 we have plotted the probability distributions for the first three states together with the full geometric potential V 4 .
Figure A6. The probability distributions for the full equation (case A4) for β = 20 and β = 1000 .
Applsci 10 07240 g0a6

References

  1. Varnava, C. Nanowire networks crack on. Varnava. Nat. Electron. 2018, 1, 326. [Google Scholar] [CrossRef]
  2. Chan, C.K.; Peng, H.; Liu, G.; Mcllwrath, K.; Zhang, X.F.; Huggins, R.A.; Cui, Y. High-performance lithium battery anodes using silicon nanowires. Nat. Nanotechnol. 2018, 3, 31–35. [Google Scholar] [CrossRef] [PubMed]
  3. Patolsky, F.; Zheng, G.; Lieber, C.M. Fabrication of silicon nanowire devices for ultrasensitive, label-free, real-time detection of biological and chemical species. Nat. Protoc. 2006, 1, 1711–1724. [Google Scholar] [CrossRef]
  4. Takei, K.; Takahashi, T.; Ho, J.C.; Ko, H.; Gillies, A.G.; Leu, P.W.; Fearing, R.S.; Javey, A. Nanowire active-matrix circuitry for low-voltage macroscale artificial skin. Nat. Mater. 2010, 9, 821–826. [Google Scholar] [CrossRef] [PubMed]
  5. Ramezany, A.; Mahdavi, M.; Pourkamali, S. Nanoelectromechanical resonant narrow-band amplifiers. Microsyst. Nanoeng. 2016, 2, 16004. [Google Scholar] [CrossRef] [PubMed] [Green Version]
  6. Feng, X.L.; He, R.; Yang, P.; Roukes, M.L. Very high frequency silicon nanowire electromechanical resonators. Nano Lett. 2007, 7, 1953–1959. [Google Scholar] [CrossRef] [Green Version]
  7. Liu, X.; Zhou, H.; Zhang, G.; Zhang, Y.-W. The effects of curvature on the thermal conduction of bent silicon nanowire. J. Appl. Phys. 2019, 125, 082505. [Google Scholar] [CrossRef]
  8. Fomin, V.M. Topology and geometry controlled properties of nanoarchitectures. Phys. Status Solidi RRL 2019, 13, 1800595. [Google Scholar] [CrossRef] [Green Version]
  9. Bocharov, D.; Piskunov, S.; Zhukovskii, Y.F.; Evarestov, R.A. Ab initio calculations on the electronic structure and photocatalytic properties of two-dimensional WS2 (0001) nanolayers of varying thickness. Phys. Status Solidi RRL 2018, 13, 1800253. [Google Scholar] [CrossRef] [Green Version]
  10. Dolgirev, P.E.; Kalenkov, M.S.; Zaikin, A.D. Topology-controlled thermopower oscillations in multiterminal Andreev interferometers. Phys. Status Solidi RRL 2019, 13, 1800252. [Google Scholar] [CrossRef]
  11. Rezaev, R.; Posenitskiy, E.; Smirnova, E.; Levchenko, E.; Schmidt, O.G.; Fomin, V.M. Voltage induced by superconducting vortices in open nanostructured microtubes. Phys. Status Solidi RRL 2019, 13, 1800251. [Google Scholar] [CrossRef] [Green Version]
  12. Córdoba, R.; Mailly, D.; Rezaev, R.O.; Smirnova, E.I.; Schmidt, O.G.; Fomin, V.M.; Zeitler, U.; Guillamón, I.; Suderow, H.; de Teresa, J.M. Three-Dimensional Superconducting Nanohelices Grown by He+-Focused-Ion-Beam Direct Writing. Nano Lett. 2019, 19, 8597–8604. [Google Scholar] [CrossRef] [PubMed] [Green Version]
  13. Rezaev, R.O.; Smirnova, E.I.; Schmidt, O.G.; Fomin, V.M. Topological transitions in superconductor nanomembranes under a strong transport current. Commun. Phys. 2020, 3, 144. [Google Scholar] [CrossRef]
  14. Gravesen, J.; Willatzen, M. The four-band spin-less Kane model in curvilinear coordinates. Phys. Status Solidi RRL 2019, 13, 1800305. [Google Scholar] [CrossRef] [Green Version]
  15. Gravesen, J.; Willatzen, M. On the geometry of nanowires and the role of torsion. Phys. Status Solidi RRL 2019, 13, 1800357. [Google Scholar] [CrossRef] [Green Version]
  16. Jensen, H.; Koppe, H. Quantum mechanics with constraints. Ann. Phys. 1971, 63, 586–591. [Google Scholar] [CrossRef]
  17. Da Costa, R.C.T. Quantum mechanics of a constrained particle. Phys. Rev. A 1981, 23, 1982. [Google Scholar] [CrossRef]
  18. Da Costa, R.C.T. Constraints in quantum mechanics. Phys. Rev. A 1982, 25, 2893. [Google Scholar] [CrossRef]
  19. Takagi, S.; Tanzawa, T. Quantum mechanics of a particle confined to a twisted ring. Prog. Theor. Phys. 1992, 87, 561–568. [Google Scholar] [CrossRef]
  20. Goldstone, J.; Jaffe, R.L. Bound states in twisting tubes. Phys. Rev. B 1992, 45, 14100. [Google Scholar] [CrossRef]
  21. Exner, P.; Seba, P. Bound states in curved quantum waveguides. J. Math. Phys. 1989, 30, 2574. [Google Scholar] [CrossRef]
  22. Gravesen, J.; Willatzen, M. Eigenstates of Möbius nanostructures including curvature effects. Phys. Rev. A 2005, 72, 32108. [Google Scholar] [CrossRef]
  23. Starostin, E.L.; van der Heijden, G.H.M. Tension-induced multistability in inextensible helical ribbons. Phys. Rev. Lett. 2008, 101, 84301. [Google Scholar] [CrossRef] [Green Version]
  24. Encinosa, M.; Eternadi, B. Energy shifts resulting from surface curvature of quantum nanostructures. Phys. Rev. A 1998, 58, 77. [Google Scholar] [CrossRef]
  25. Webster, A.G. Acoustical impedance and the theory of horns and of the phonograph. Proc. Natl. Acad. Sci. USA 1919, 5, 275. [Google Scholar] [CrossRef] [PubMed] [Green Version]
  26. Pierce, A.D. Acoustics—An Introduction to Its Physical Principles and Applications; Springer: Cham, Switzerland, 2019. [Google Scholar]
  27. Stevenson, A.F. General theory of electromagnetic horns. J. Appl. Phys. 1951, 22, 1447. [Google Scholar] [CrossRef]
  28. Stevenson, A.F. Exact and approximate equations for wave propagation in acoustic horns. J. Appl. Phys. 1951, 22, 1461. [Google Scholar] [CrossRef]
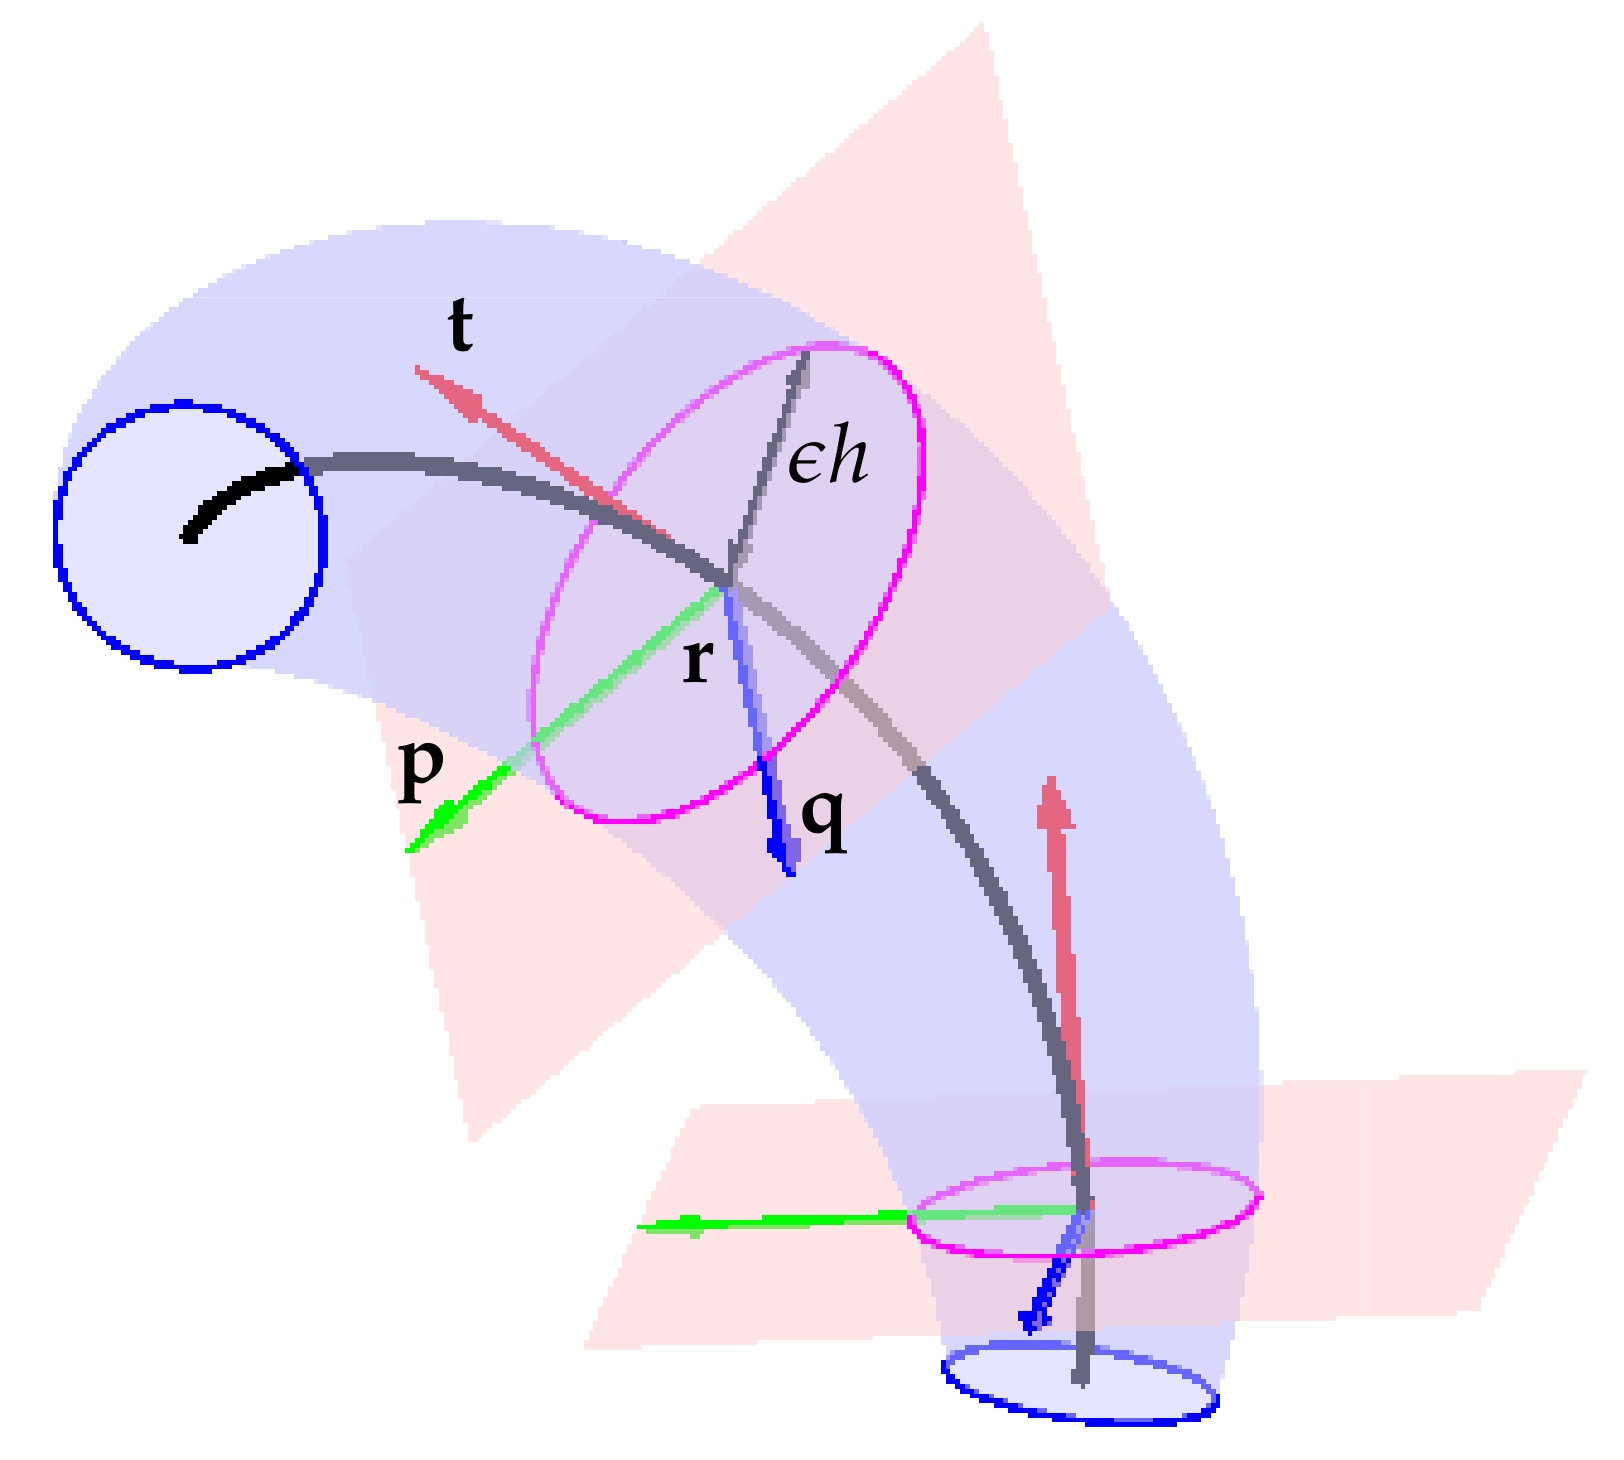
Figure 1. The physical domain. We consider a neighbourhood of a curve r (in black). The tangent vectors t (in red) are orthogonal to the normal planes (in pink). They intersect in this case the neighbourhood in disks of varying radius ϵ h centered at the curve. The vectors p and q , in green and blue respectively, give an orthonormal basis for the normal plane.
Applsci 10 07240 g001
Figure 2. The case h 0 = 1   n m , b = 2   Å , L m = 10   n m , and n = 1 , ϵ = 1 .
Applsci 10 07240 g002
Figure 3. The case h 0 = 1   n m , b = 2   Å , L m = 10   n m , and n = 1 , ϵ = 1 .
Applsci 10 07240 g003
Figure 4. The case h 0 = 1   n m , b = 2   Å , L m = 10   n m , and n = 2 , ϵ = 1 .
Applsci 10 07240 g004
Figure 5. Energies for a tube around a straight line of length L 0 = 10   n m , average width 1   n m ( ϵ = 0.5   n m ), and with trigonometric variation of the width, h ( s ) = 1 + α 2 sin ( β s ψ 0 ) and α = 0.5 .
Applsci 10 07240 g005
Figure 6. Energies for the elliptic helix with length 10   n m and constant width 1   n m .
Applsci 10 07240 g006
Figure 7. Eigenvalues for the closed ellipse with length 10   n m and constant with 1   n m .
Applsci 10 07240 g007
Figure 8. Three square tubes with length 25   n m and constant thickness 1   n m around a tennis ball curve with b = a / 20 . In the middle plot, the case with one quarter turn is shown. To the right with one half turn.
Applsci 10 07240 g008
Table 1. The first five eigenvalues for the tennis ball curve with b = a / 20 , length 25   n m , average width 1   n m ( ϵ = 0.5   n m ), no turn, and trigonometric variation of width h = 1 + α 2 sin ( β s ψ 0 ) , α = 0.5 , ψ 0 = 0 .
β L E 1 [eV] E 2 [eV] E 3 [eV] E 4 [eV] E 5 [eV]
02.102.212.212.522.53
π 1.541.902.272.643.00
2 π 1.801.802.542.563.17
3 π 2.102.112.123.133.13
4 π 2.412.462.462.533.48
Publisher’s Note: MDPI stays neutral with regard to jurisdictional claims in published maps and institutional affiliations.