Article

Improvement of Aerodynamic Performance of Savonius Wind Rotor Using Straight-Arc Curtain

1
School of Civil Engineering, Northeast Forestry University, Harbin 150040, China
2
China Overseas Property Co., LTD. (Xi’an), Xi’an 710061, China
3
School of Civil Engineering, Harbin Institute of Technology, Harbin 150090, China
*
Author to whom correspondence should be addressed.
Appl. Sci. 2020, 10(20), 7216; https://doi.org/10.3390/app10207216
Submission received: 21 September 2020 / Revised: 12 October 2020 / Accepted: 14 October 2020 / Published: 16 October 2020
(This article belongs to the Special Issue Wind Power Technologies)

Abstract

:
A straight and an arc-shaped curtain are combined to enhance the aerodynamic performance of the Savonius wind rotor. The straight-arc curtain is placed in front of the Savonius wind rotor to reduce the negative moment on the convex blade and increase the positive moment on the concave blade. The static and dynamic performances of the Savonius wind rotor with and without the curtain are investigated based on the computational fluid dynamics method. The results show that the static torque is higher with the curtain than without it at the same angle-of-attack. The maximum mean power coefficient with the curtain is increased by about 50% compared with conventional Savonius wind rotor. Additionally, the flow field around the rotor with the straight-arc curtain is presented, and the flow control mechanics of the straight-arc curtain are discussed.

1. Introduction

Over the past few years, owing to the rapid development of the world economy and the increasing population, the demand for traditional energy sources-such as coal, oil, and natural gas has increased dramatically, making traditional energy reserves increasingly scarce. This has gradually become an important inhibiting factor for the sustainable development of society. Also, the excessive use of traditional energy sources has produced severe environmental pollution. Therefore, it is necessary to find renewable energy. As a renewable energy source, wind energy has many advantages. It is inexhaustible, widely distributed, clean, and pollution-free. The rapid improvement and considerable advancement of wind energy systems have made wind power an indispensable energy source [1,2]. Therefore, reasonable and efficient use of wind power is an effective way to ease the energy crisis. Wind turbines, the most important part of wind power stations, have gradually attracted the interest of many scholars.
According to the axis of rotation, wind turbines can be divided into two types: horizontal-axis wind turbines (HAWTs) and vertical-axis wind turbines (VAWTs). HAWTs are well known to have higher efficiency than VAWTs and have been mostly used for electricity production [3]. However, a HAWT farm is land-consuming and needs to be connected with an integrated power system, which limits its development to some extent. In contrast, VAWTs have lower installation and maintenance costs, less wear on the moving parts, and are independent of the wind direction. These advantages make their application more convenient and flexible [4,5,6]. Therefore, VAWT is considered as a better choice for meeting the requirements of the distributed energy strategy. The Savonius wind rotor is a kind of VAWT [7]. This rotor has a shape similar to an “S” and consists of two semi-cylindrical surfaces with a small overlap between them. Its main advantages are as follows:
  • It has the ability to accept wind from any direction;
  • It has good starting torque characteristics [8,9,10];
  • It can be operated in a wide range of wind conditions;
  • It has a simple and cheap construction as well as compact size;
  • The electrical equipment of this wind rotor can be placed at ground level and have low noise emission [11].
However, the power performance of Savonius wind rotors (Cp ≈ 15–19%) is rather low when compared with that of wind rotors with a horizontal axis (Cp ≈ 45%) and a Darrieus-type wind rotor with a vertical axis (Cp ≈ 35%) [12]. Therefore, it is necessary to improve the aerodynamic performance of Savonius wind rotors.
In recent years, many studies have been carried out to improve the performance of Savonius wind rotors. The improvement mainly relies on optimizing the basic design parameters of wind rotors, changing the shape of wi nd rotor blades, or adding some deflectors. Fujisawa (1992) found that the optimum size of the bucket overlap is around 15% of the size of the bucket chord by experiment [13]. Fujisawa and Gotoh (1994) studied the aerodynamic performance of a Savonius wind rotor by measuring the pressure distribution on the blade surfaces at various rotor angles and various tip-speed ratios (TSRs) [14]. Kamoji and Kedare (2008) carried out wind tunnel tests of Savonius wind rotor models in an open-jet wind tunnel to study the effect of the stage aspect ratio, the rotor aspect ratio, and the number of stages on the wind energy utilization rate [15]. They found that the performance of two stage and three stage rotors remains the same after increasing the stage aspect ratio and the rotor aspect ratio by a factor of two and three, respectively. Gupta, Biswas and Sharma (2008) studied the efficiency of a three-bucket Savonius-Darrieus wind turbine and a three-bucket Savonius wind turbine [16]. They found that the combined turbine has a high power coefficient. Altan and Atilgan (2008, 2010) used a curtain design to increase the performance of a conventional Savonius wind rotor [1,2]. This curtain has been placed in front of the rotor, designed to prevent the negative torque on the convex blade of the rotor, and experiments have been carried out to test its performance. The results show that a significant increase can be achieved in the rotor performance by means of the curtain design. Mahmoud et al. (2012) experimentally studied different geometries on the performance of Savonius wind turbine in order to determine the most effective operation parameters [17]. They found that the rotors without overlap ratio are better in operation than those with overlap; the power coefficient increases with rising the aspect ratio; the two-blades rotor is more efficient than the three and four ones. Wenehenubun, Saputra and Sutanto (2015) experimentally investigated the effect of number of blades on the performance of the model of Savonius-type wind turbine [18]. The results show that Savonius wind turbine with three blades has the best performance at high tip speed ratio. The highest tip speed ratio is 0.555 for wind speed of 7 m/s. Tartuferi et al. (2015) proposed two different approaches to enhance the performance: one is based on the development of innovative airfoil-shaped blades, the other one concerns the use of a new curtain system, self-orienting relative to the wind direction [19]. Both of the two methods work well. Lee and Lim (2016) studied the performance and shape characteristics of a helical Savonius wind turbine at various helical angles [6]. The maximum power coefficient (about 0.15) occurred at the twist angle of 45°, whereas it decreased by 25.5% at 90° and 135°. Regarding the torque coefficient values at various azimuths, they also found that the peak-to-peak values in the profiles for 90° and 135° were less than those for 0° and 45°. Youssef et al. (2019) introduced an upstream deflector and downstream baffle around a Savonius wind turbine and achieve a much higher power coefficient than the conventional Savonius turbine [20].
In the present study, a straight-arc curtain, placed in front of the Savonius wind rotor to improve its aerodynamic performance, is tested. The static torque, mean torque coefficients, and mean power coefficient are analyzed using numerical simulation.

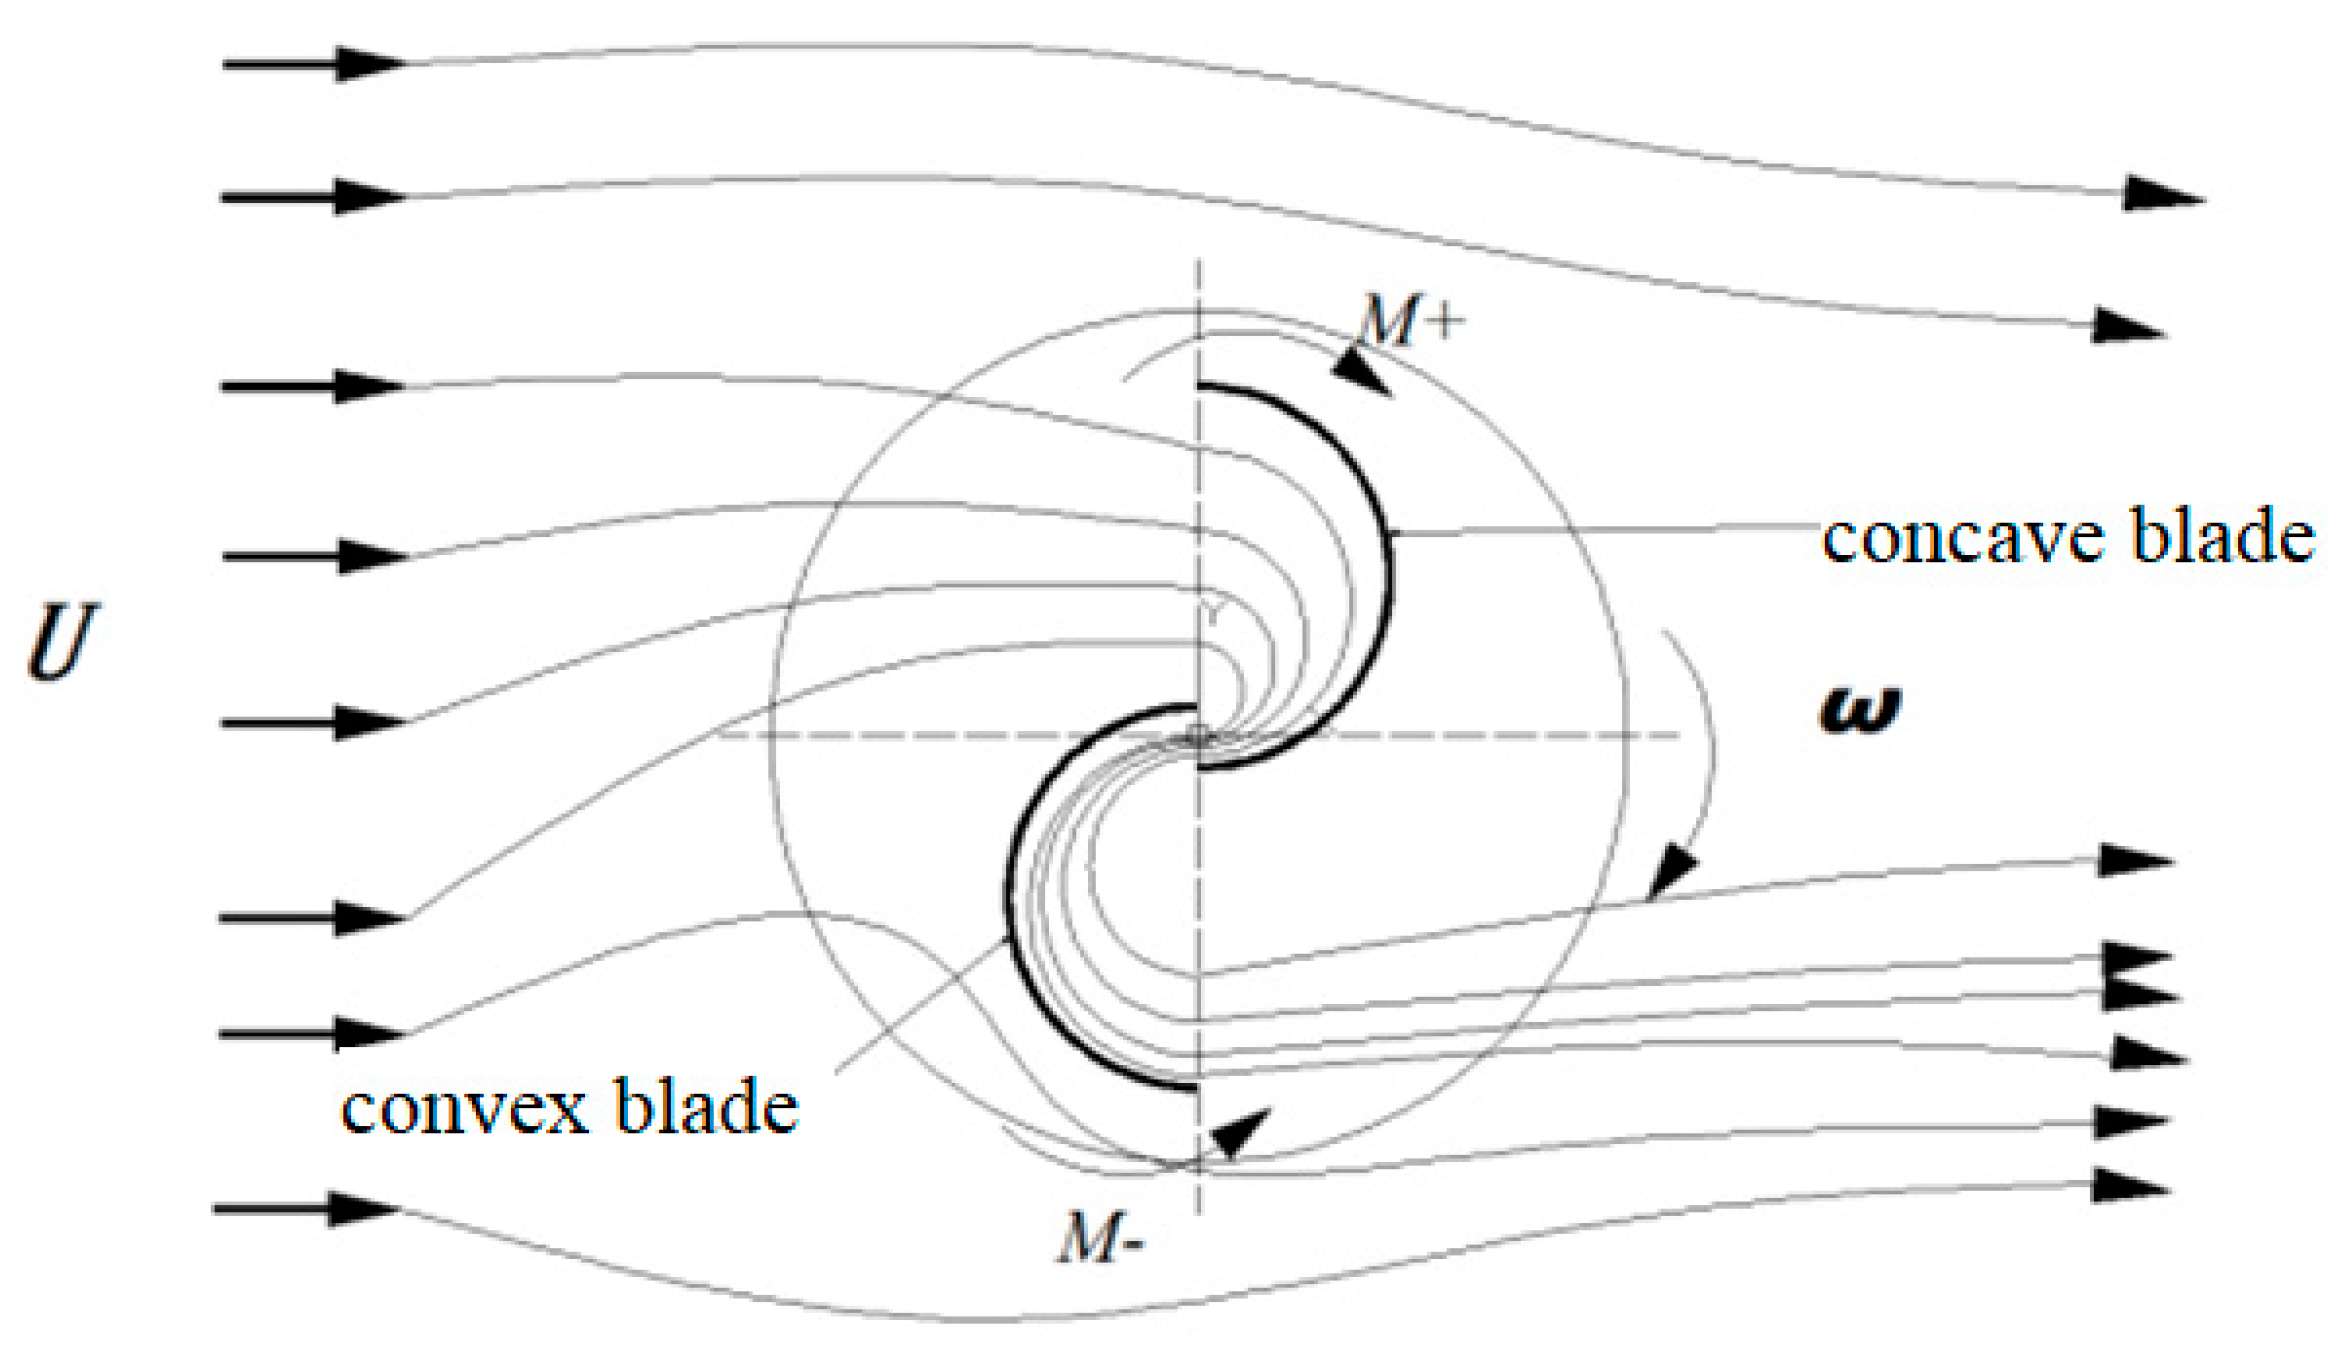
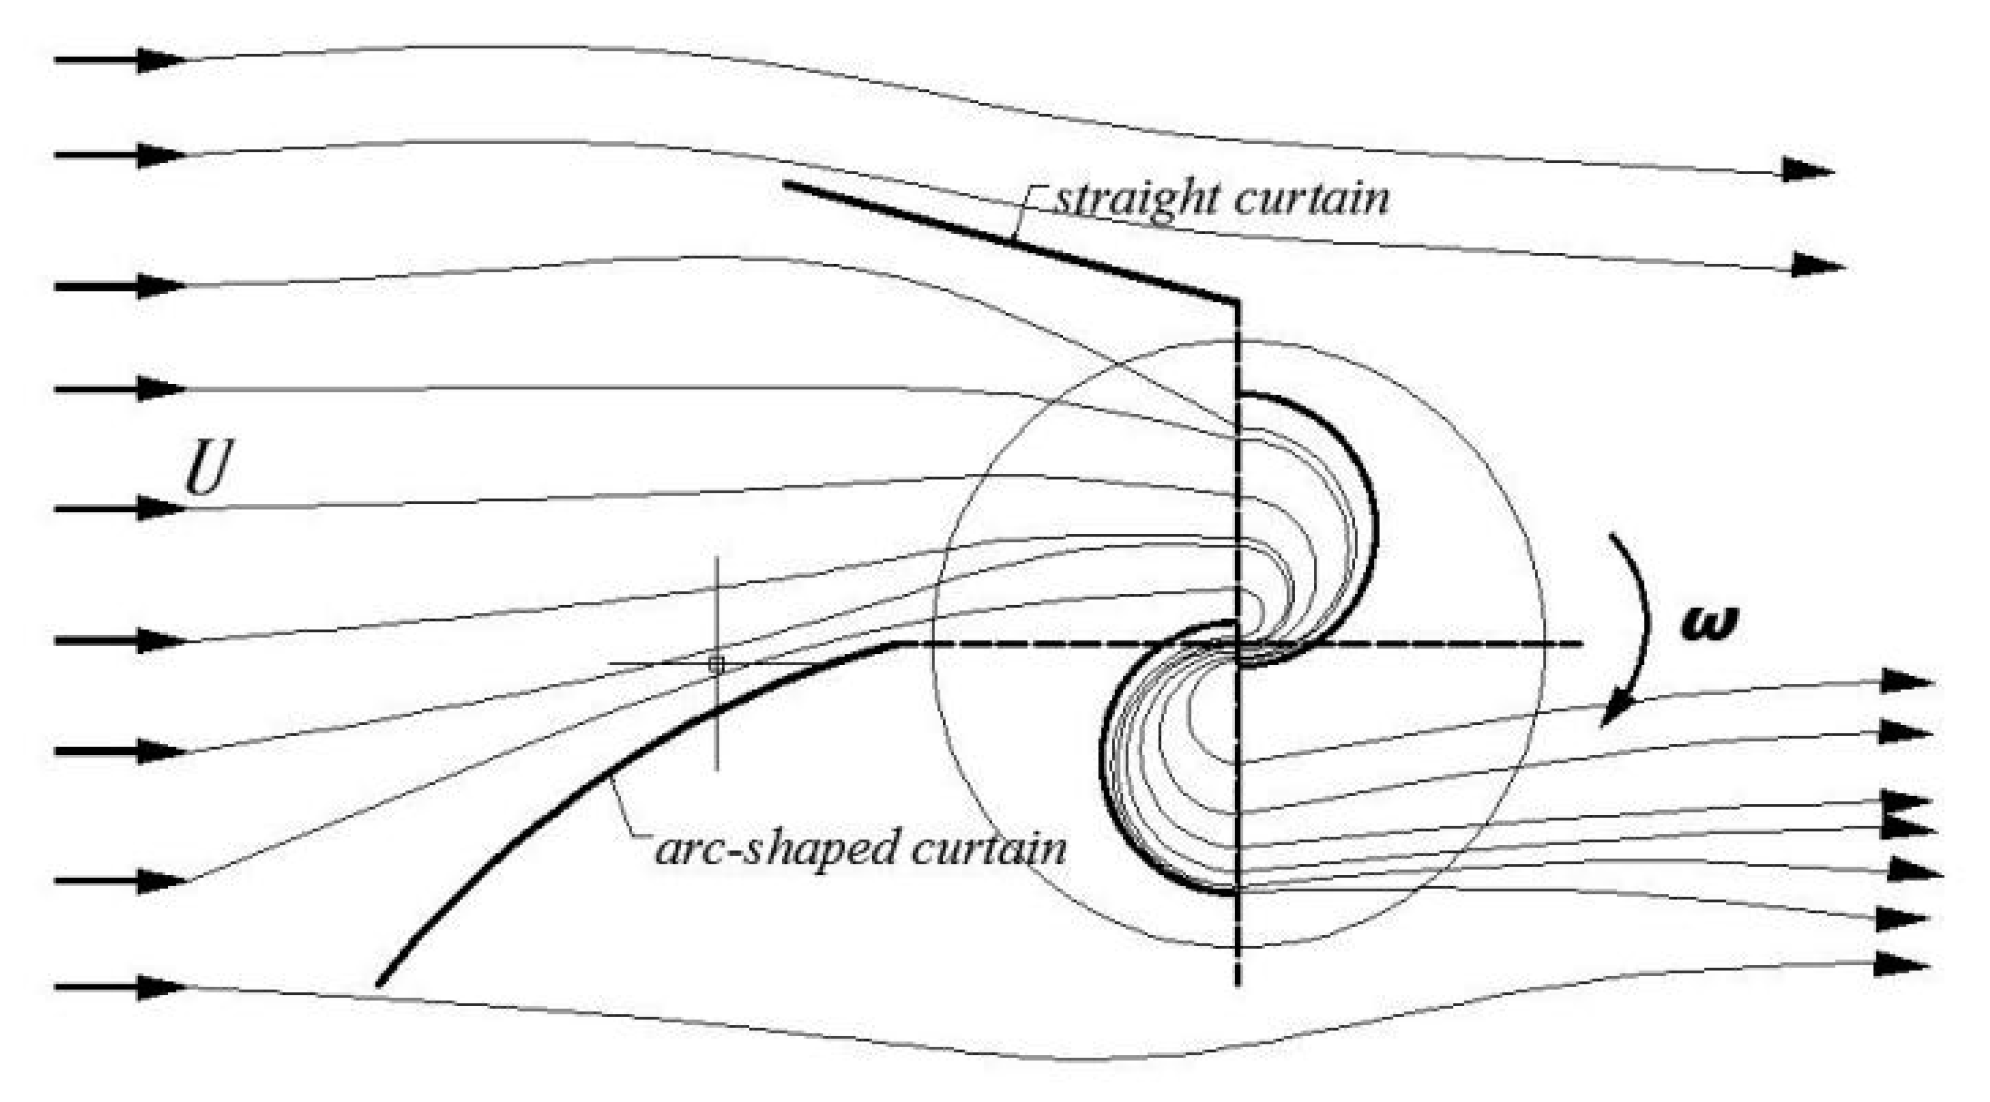
2. Principle of Increasing the Efficiency of the Straight-Arc Curtain

The conventional Savonius wind rotor consists of two semi-cylindrical surfaces with a small overlap between them. When the wind flow to the wind rotor has a certain velocity, the torque on the concave blade of the Savonius wind rotor is positive and the torque on the concave blade is negative. It seems that the positive moment is higher than the negative one, so the rotor rotates in the direction of the positive moment that forms on the concave blade. Below is a simple Figure illustrating the operating principle of the conventional Savonius wind rotor (Figure 1).
According to Figure 1, the existence of a negative moment inhibits the rotation of the rotor and thus reduces its aerodynamic performance. Based on this condition, the straight-arc curtain, which is arranged in front of the wind rotor, is designed to reduce the negative moment on the convex blade and increase the wind speed around the concave blade so as to improve the aerodynamic performance of the rotor. In addition, the curtain is used to change the direction of local oncoming flow and make more flux drive the wind rotor. The working principle of the straight-arc curtain is shown in Figure 2.

3. Numerical Simulation of the Straight-Arc Curtain

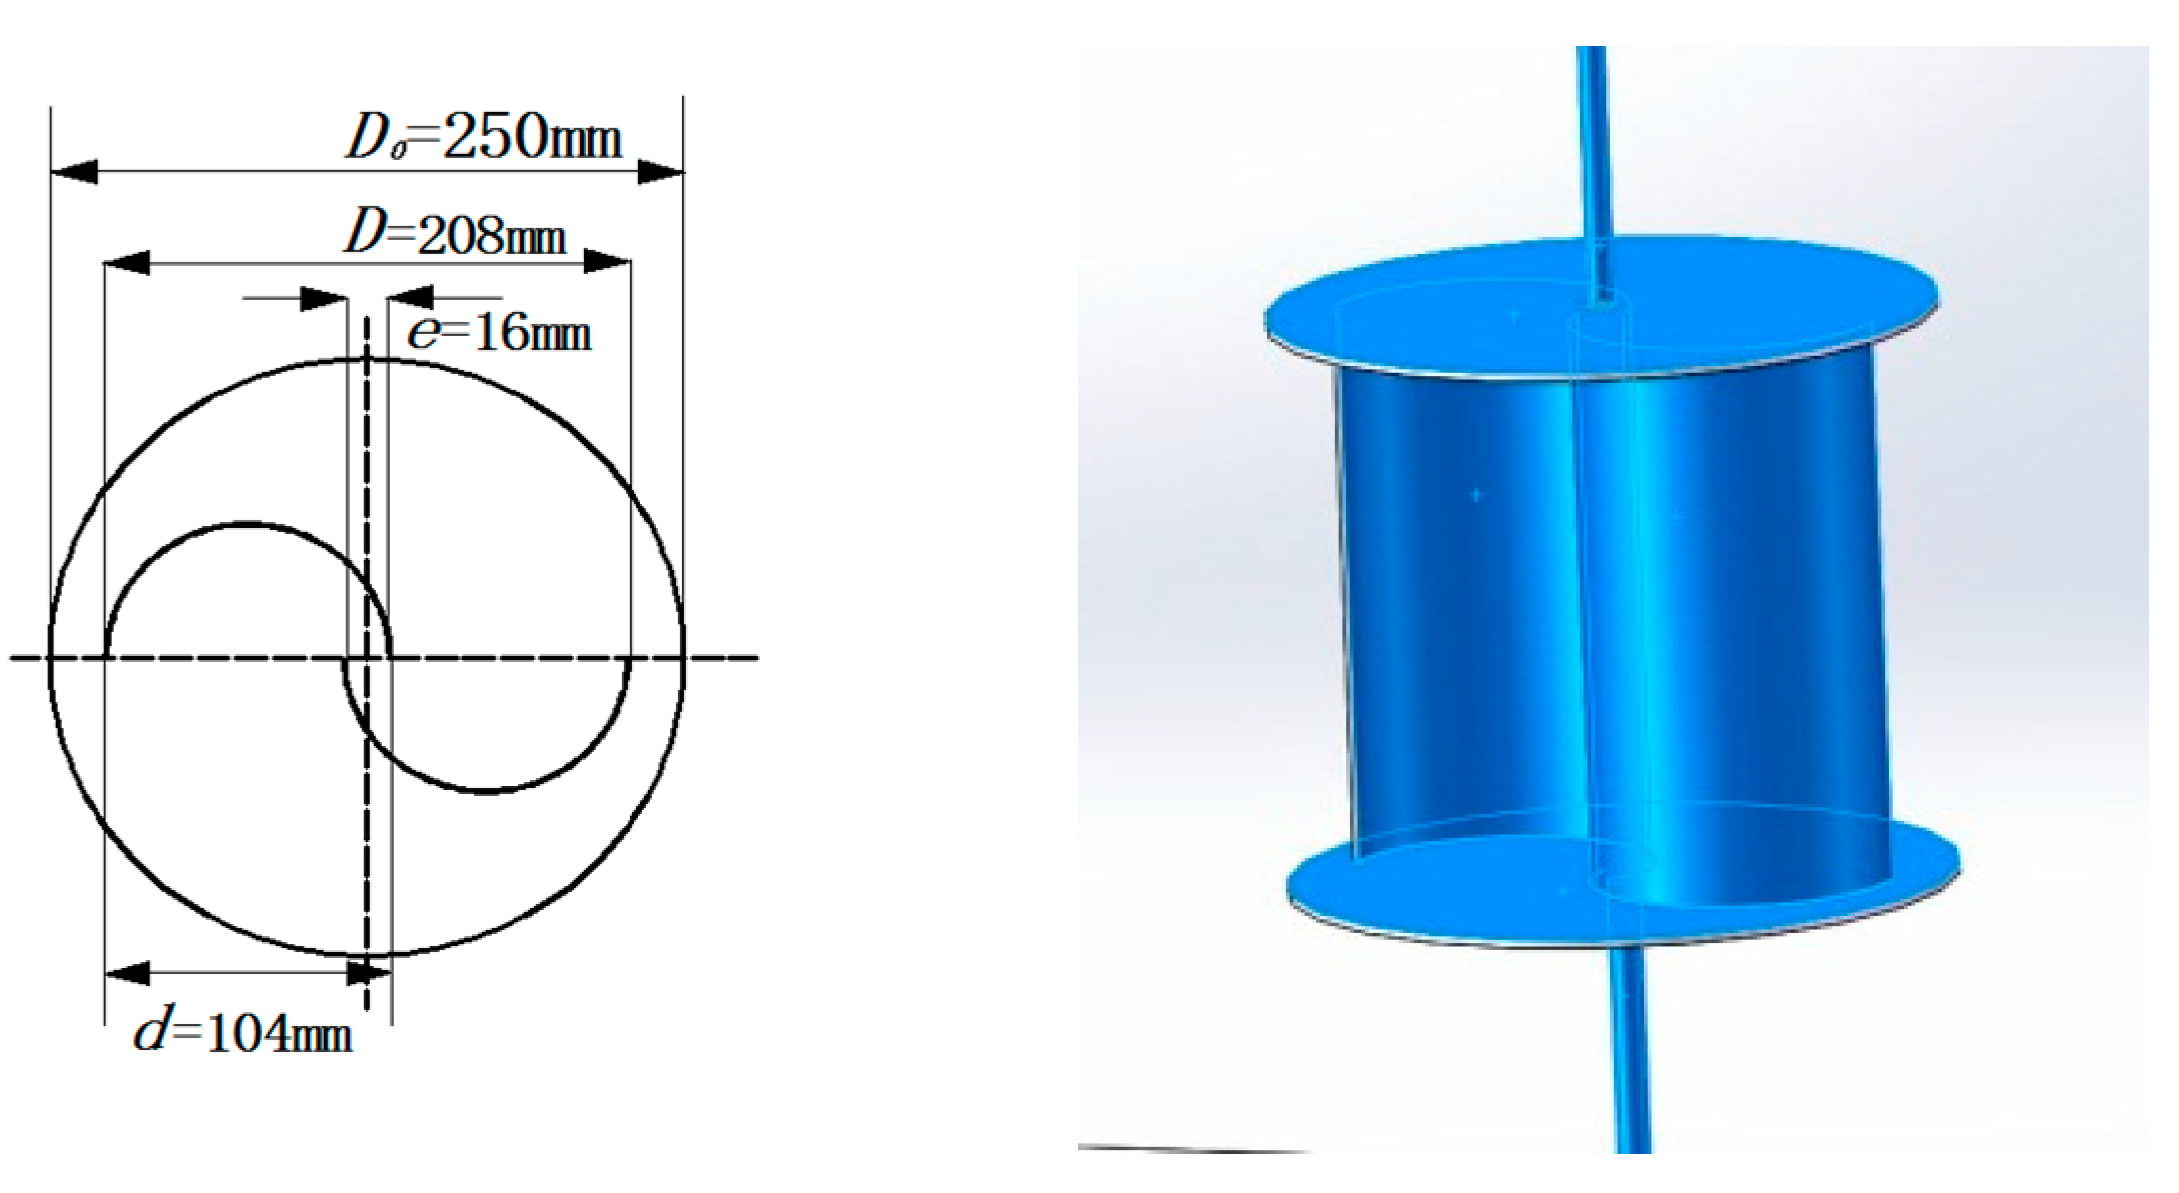
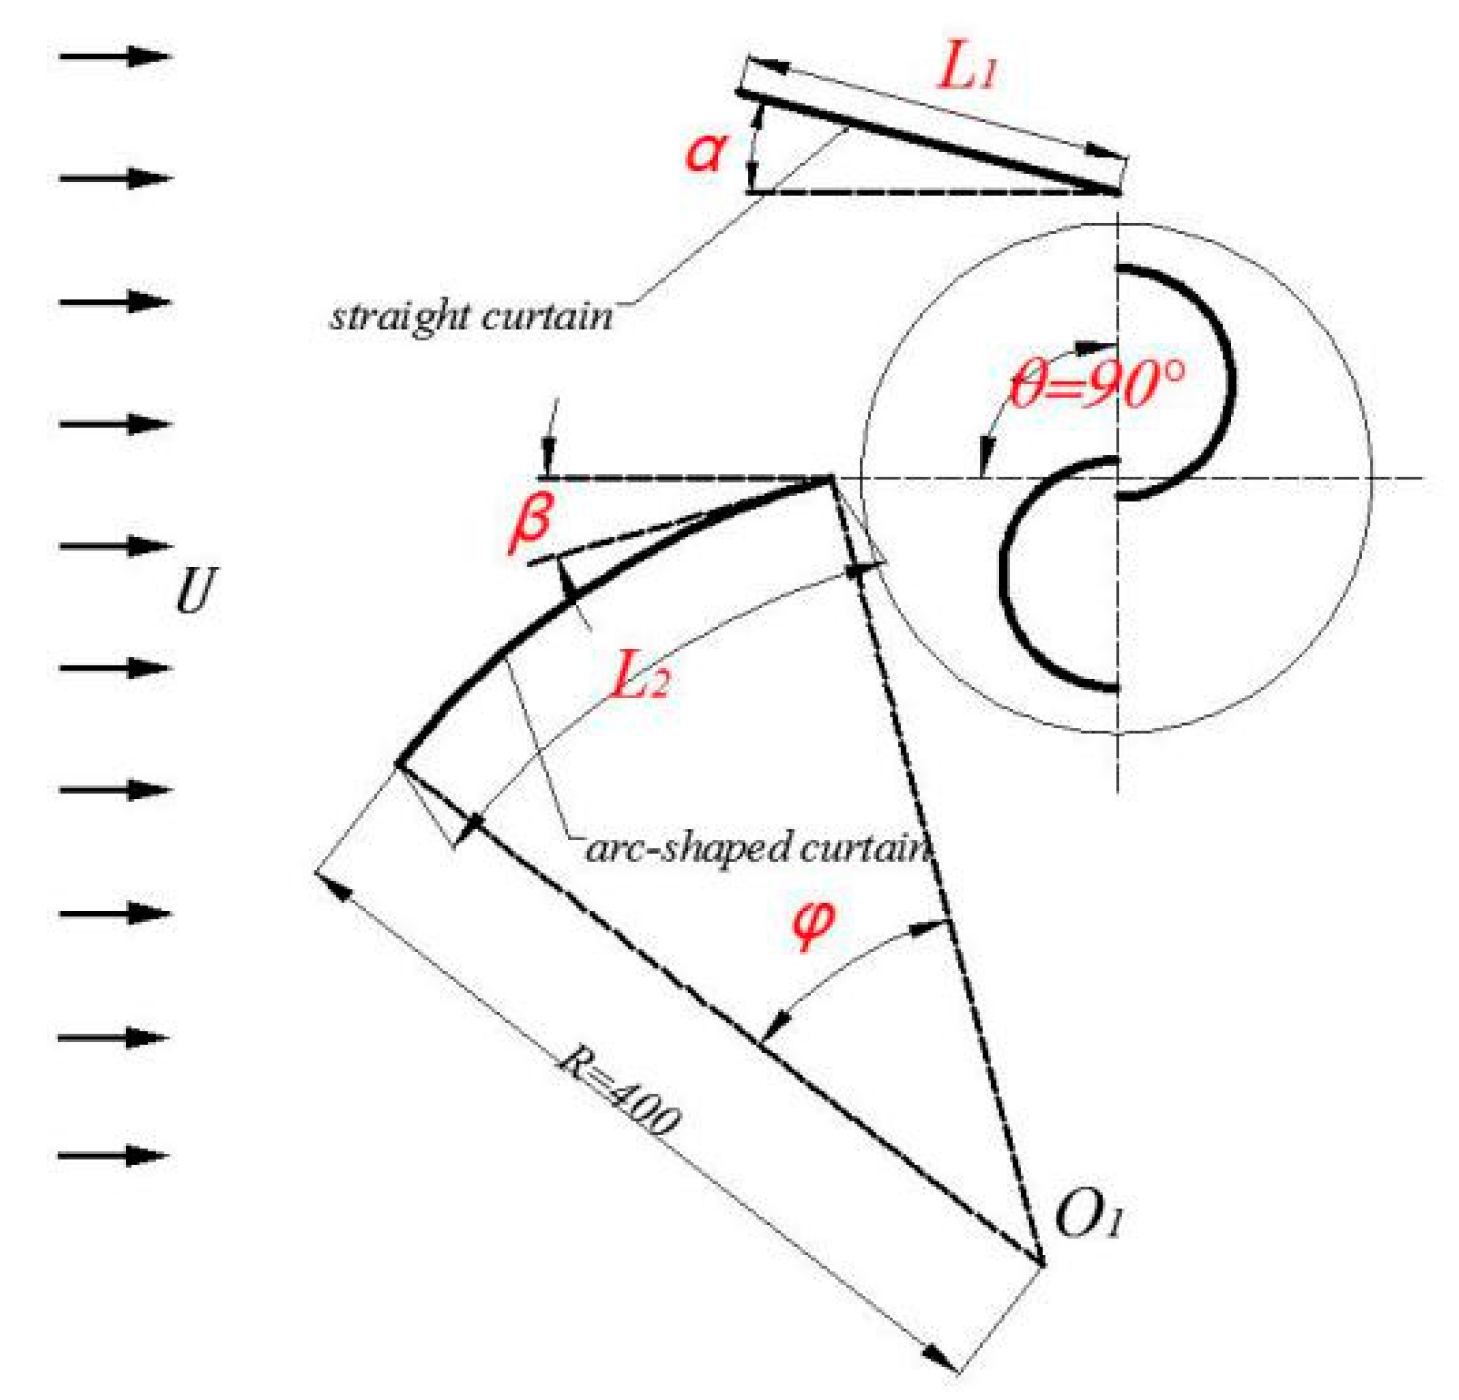
3.1. Geometric Model

Here, a conventional Savonius wind rotor model is adapted from [14]. The geometric parameters and a schematic of the adopted model are shown in Figure 3. The present Savonius wind rotor with two semi-cylinders blades is a conventional type wind rotor (Altan and Atilgan, 2008) [2]. Although there are many other shapes of the blades, the semi-cylinders-type is always applied for its simple shape and it is also easy to be made. The rotor model height (H) and diameter (D) are both 208 mm, the diameter of the upper- and lower-blade end plates (D0) is 250 mm, the gap distance (e) is 16 mm, and the overlap ratio (e/d) is about 0.15.
According to the experimental data, the variation of the static torque coefficient is periodic, the maximum value of the static torque is obtained at rotor angles in the range 40–45°, and the minimum value is obtained at rotor angles in the range 160–165° [15]. In addition, the wind rotor exhibits a negative static torque coefficient at rotor angles in the range 150–165°. Based on the above analysis, four representative rotor angles (45°, 90°, 150°, and 165°) are selected to study the effect of the straight-arc curtain on the static performance of the rotor.
The shape and the geometric parameters of the straight-arc curtain are shown in Figure 4. Four geometric parameters are selected on the curtain arrangement: the length of the straight curtain (L1), the length of the arc-shaped curtain (L2 = R·φ, R = 400 mm), and the curtain angles (α and β). To investigate the effect of the length of the arc-shaped curtain and the curtain angles on the aerodynamic performance of the rotor, the length of the straight curtain used in this study is fixed. The arc-shaped curtain has three different lengths. In addition, the value of α is increased from 0° to 20° by 5° increments and β is increased from 0° to 45° in 15° steps. Detailed information on the curtain parameters is given in Table 1. The simulated operating points are listed in Table 2.

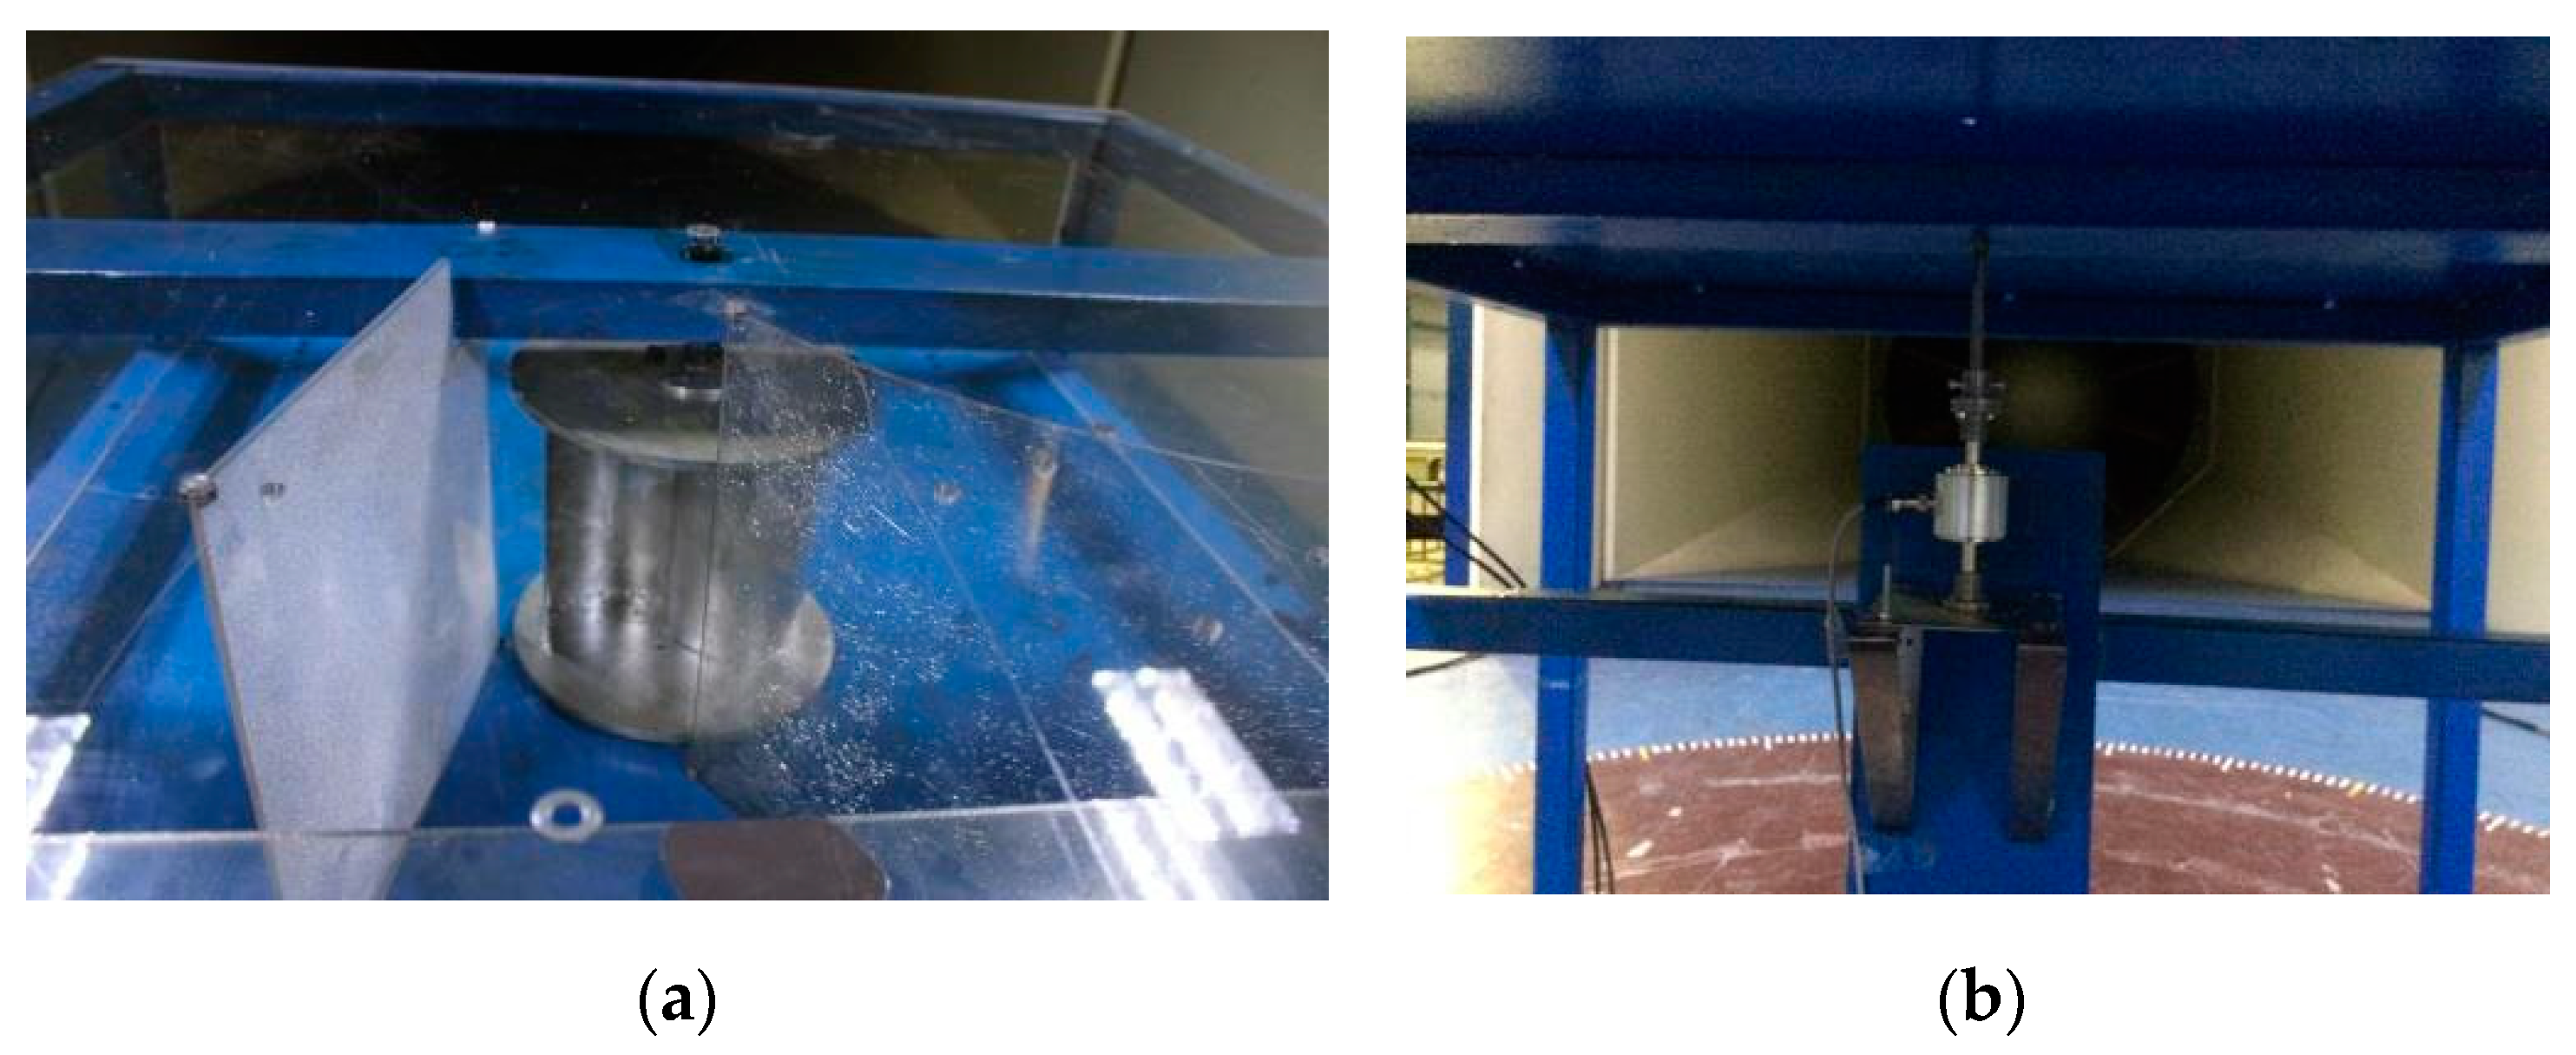
3.2. Experimental Set-up

The experiments were carried out in the wind tunnel of the Harbin Institute of Technology in China, which has a rectangle working test section that is 4 m wide, 3 m high and 25 m long. In the working test section, the maximum wind velocity was 45 m/s, the turbulence intensity of the free stream was less than 0.5%, and the non-uniformity of free-stream was less than 1%. In this study, the oncoming flow in the tested cases was uniform and smooth, and the free-stream velocity was 8–10 m/s.
Hot-film probes (Dantec55P11) were used to measure the wind velocity, and the sampling frequency was set to 1000 Hz. The wind rotor was made of steel sheet and the curtains were made of plastic sheet. The torque force of the rotor model was measured by using a torque meter (LDN-08AE) installed below the turbine model, which is shown in Figure 5, the sampling frequency was also set to 1000 Hz.

3.3. Numerical Simulation Method

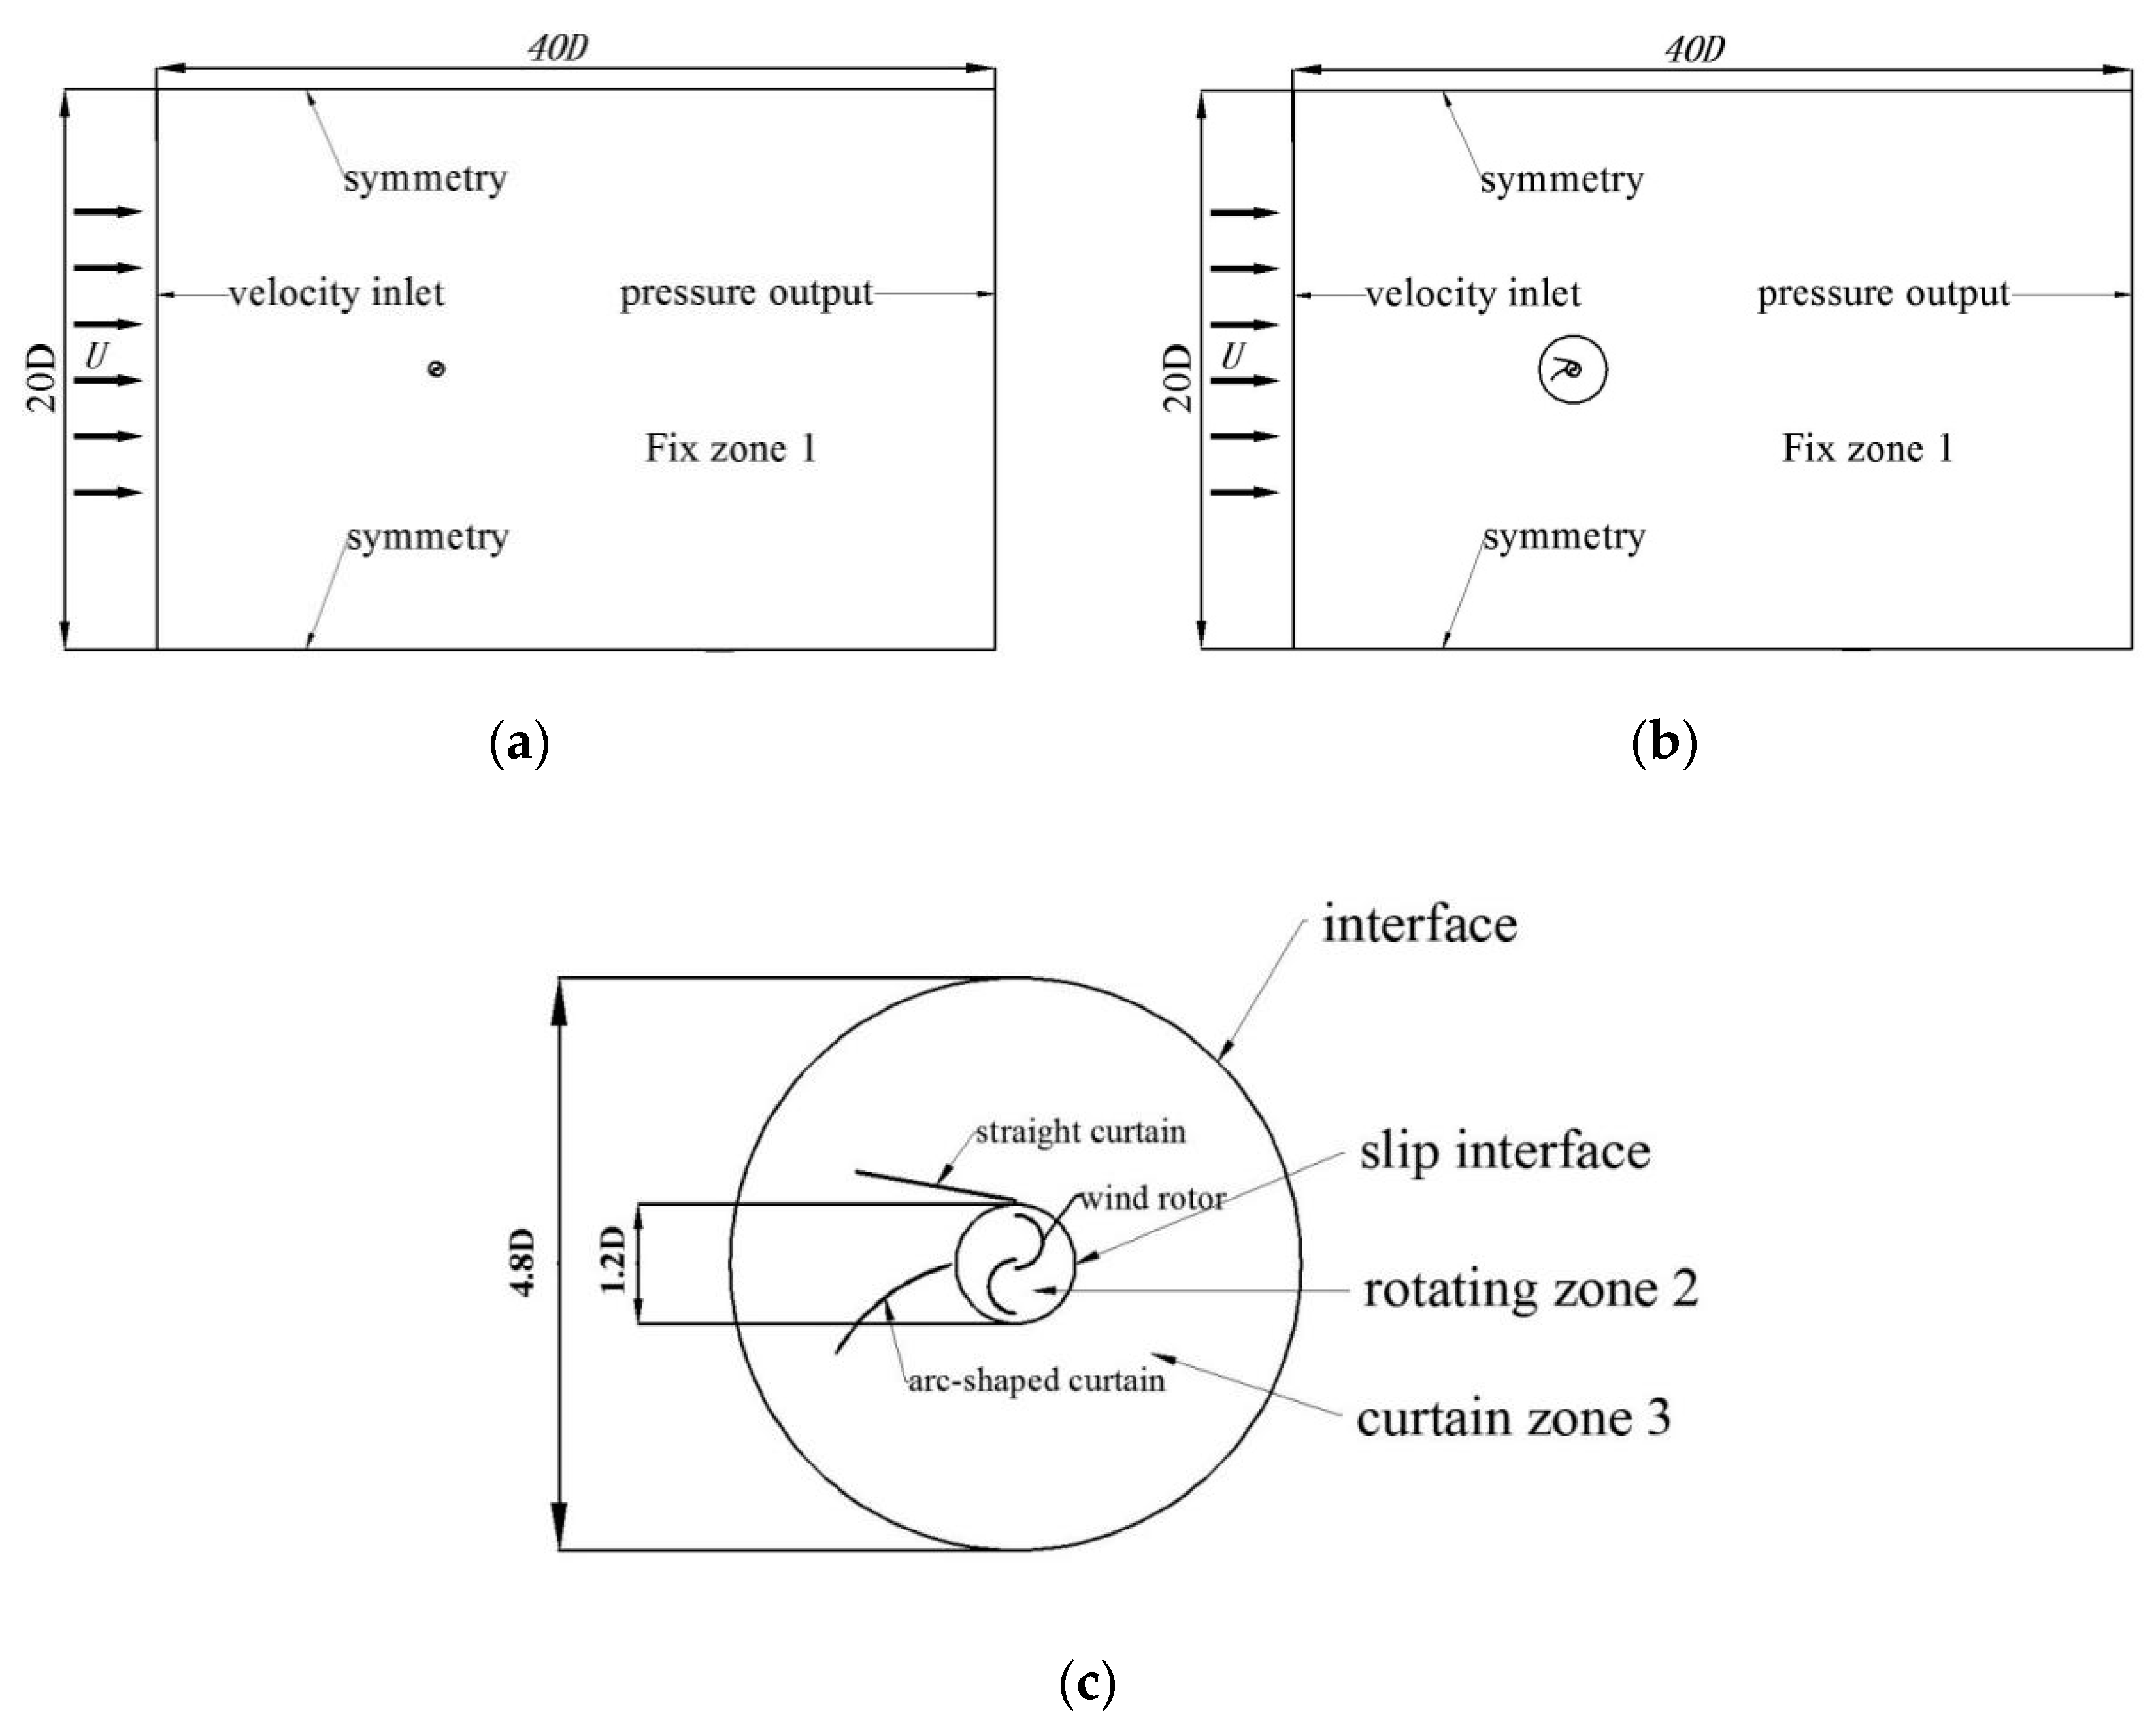
3.3.1. Computational Domain of the Numerical Simulation

The computational domain is built using the ANSYS Design Modeler and it has to be large enough so that the boundaries are far from the turbine rotor. The calculation domain without and with the straight-arc curtain have some differences. The former includes two parts: one is a fixed zone and the other is a rotating zone. The latter includes three parts: The first part is a fixed zone, the second is a rotating zone, and the third is a curtain zone. In addition, several tests are performed to achieve the optimal domain shown in Figure 6. The size of the calculation domain is designed as 20D × 40D (D is the wind rotor diameter), the rotating zone has a diameter equivalent to 1.20 times the rotor diameter, and the curtain region has four times the diameter of the rotating zone.
The boundary conditions at the top and bottom of the domain are defined as symmetry. For the boundary condition of the inlet, the inlet is defined as a free-stream velocity entrance. On the surface of the curtain and the rotor, non-slip wall conditions are considered, and the common surface between the two zones is considered as an interface. The definition of the boundary conditions is shown in Figure 6.

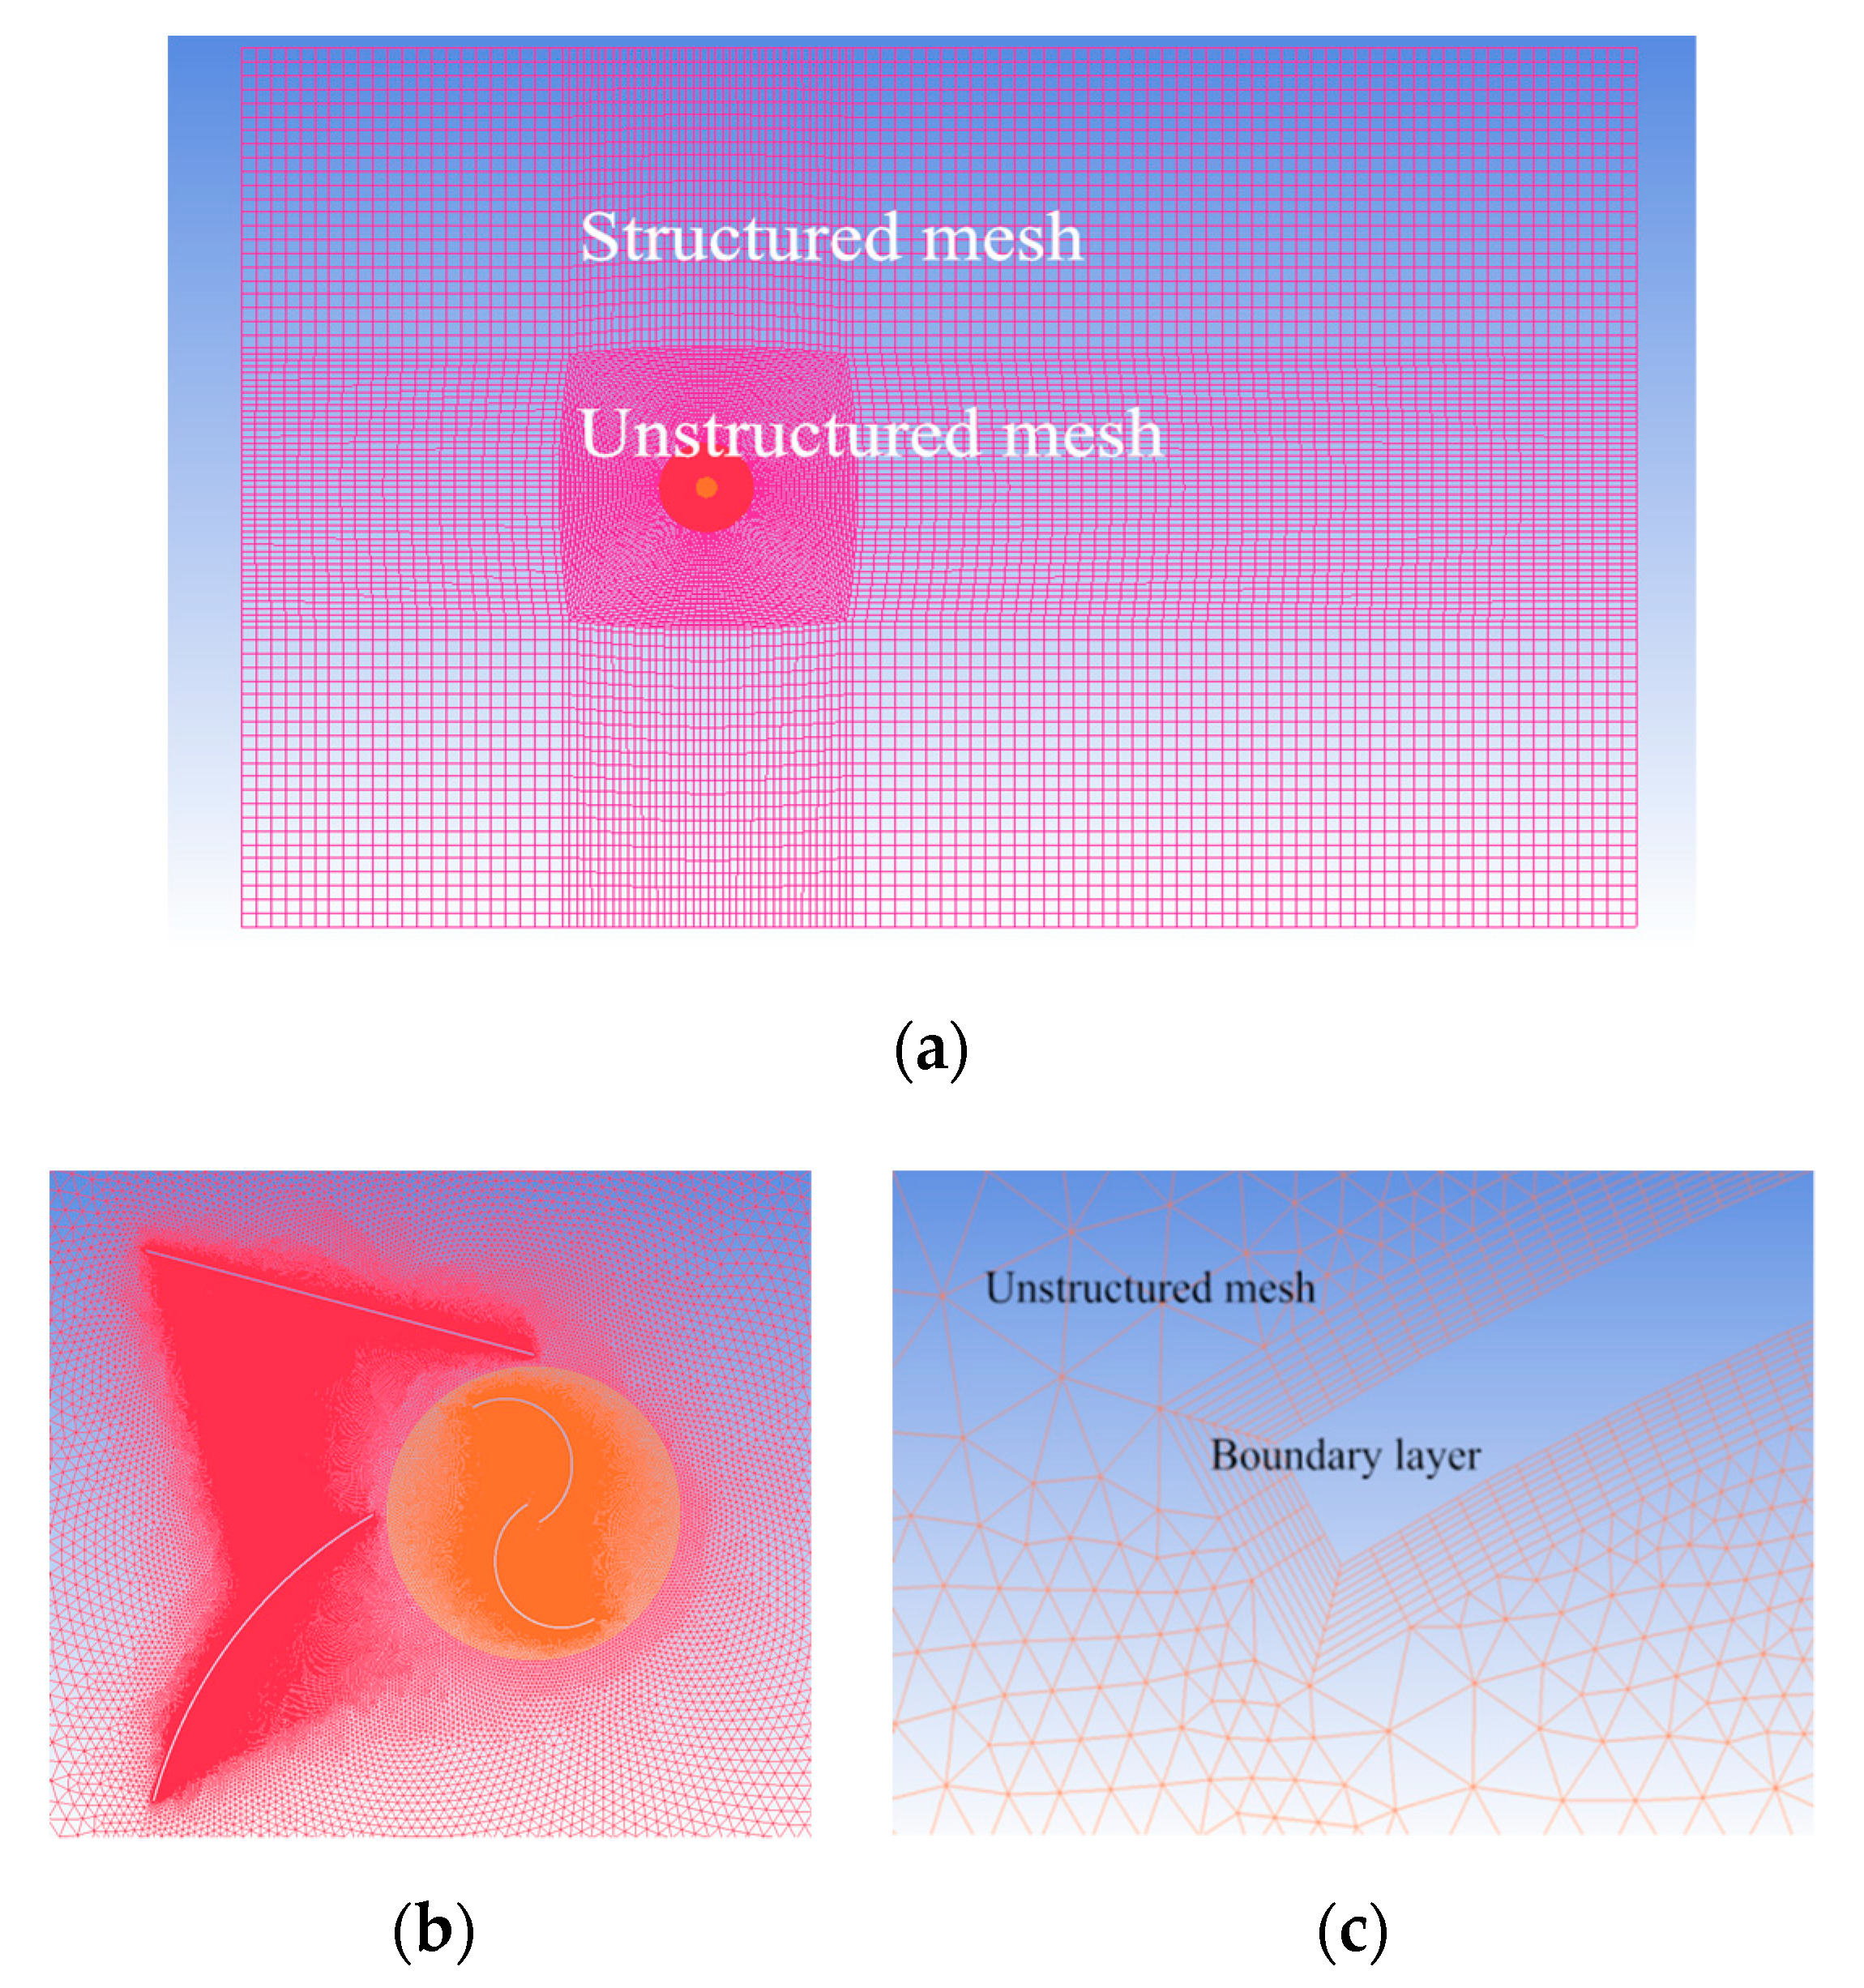
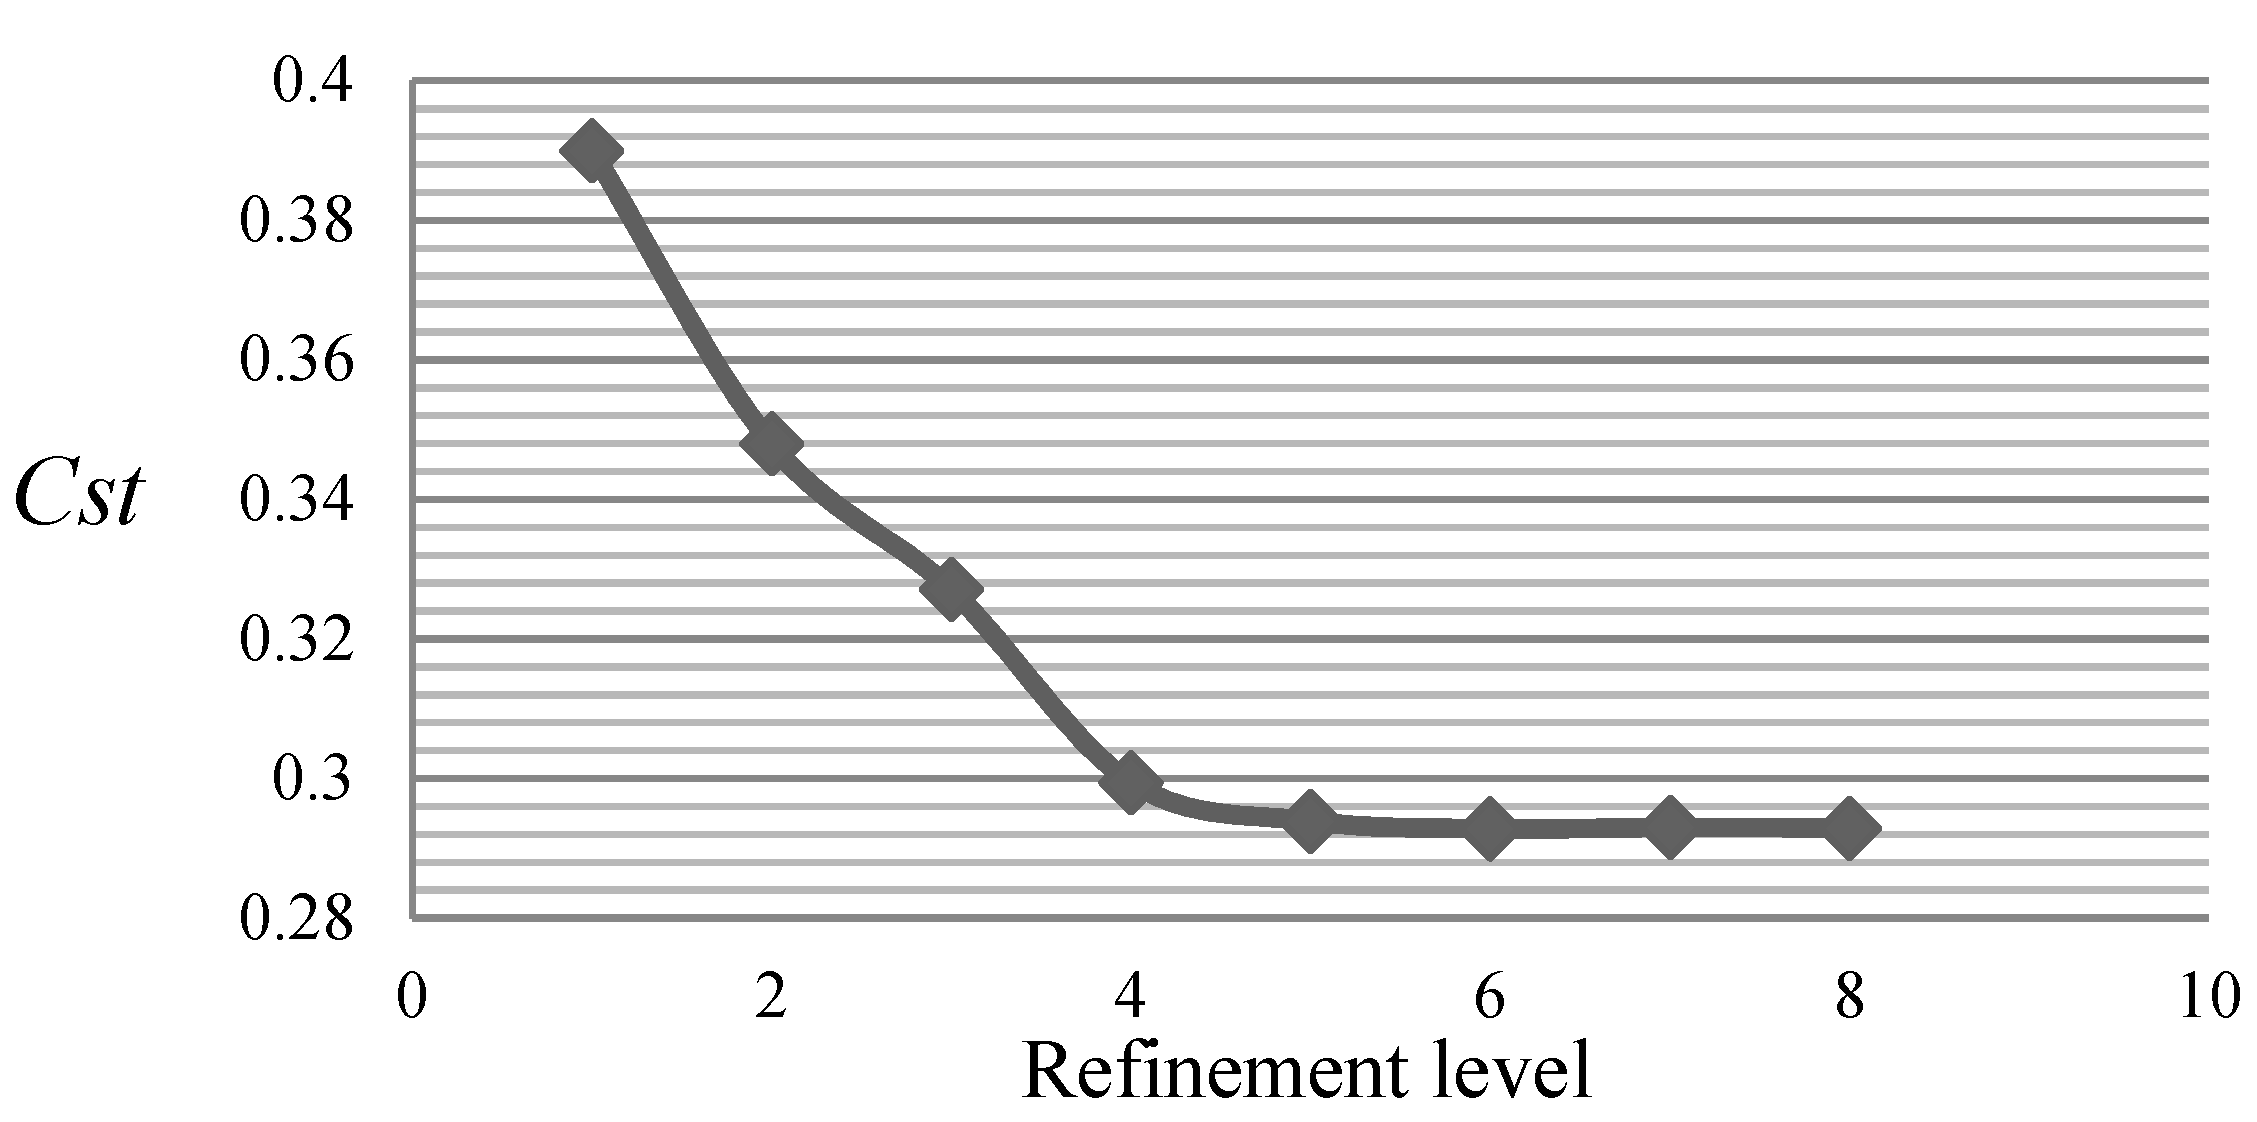
3.3.2. Mesh Generation

The computational domain is divided into a quadrilateral and a triangular grid. The fixed zone is composed of a quadrilateral grid. The rotating zone and the curtain zone are composed of triangular elements, which have a better ability to adapt to complex geometries. The grid around the wind rotor and the curtain are refined to improve the accuracy of the numerical simulation. In addition, a boundary layer with 10 levels of quadrangular cells is imposed on the wind rotor blade to ensure a value of y+ lower than 1, which is required by turbulence models. The grid is shown in Figure 7.

3.3.3. Solver Settings and Turbulence Model

ANSYS FLUENT is used to perform the numerical simulation. The momentum-conservation equation and the continuity equation are divided into algebraic equations using second-order up-wind interpolation. The SIMPLEC (Semi Implicit Linked Equations Consistent) algorithm is used to couple the pressure and velocity calculations. In order to deduce the link between the pressure and velocity in the calculation domain, we implemented a second-order upwind Scheme. A very small time step used in the calculation was 105 s, which makes sure that the CFL number is less than 1.0. The least-squares cell-based scheme was applied to manipulate the gradient. The sliding mesh method was used to mimic the rotation of the rotor, and the blades were rotated with the given frequency.
The most widely used turbulence viscosity model with good accuracy is Wilcox’s K-ω model. It is successfully employed to give highly accurate predictions of flow separation under adverse pressure gradients by the implementation of transport effects in the formulation of eddy viscosity [21]. The K-ω shear-stress transport (SST) turbulence model can provide highly accurate boundary layers simulation when investigating the flow field around the wind rotor. The K-ω SST model is suitable when considering the sub-layer of the boundary layer. In addition, Akwa et al. (2012) and El-Askary et al. (2015) found that the SST k-ω turbulence model is capable of simulating Savonius rotor [22,23]. Therefore, the K-ω SST turbulence model is used for the numerical simulation.

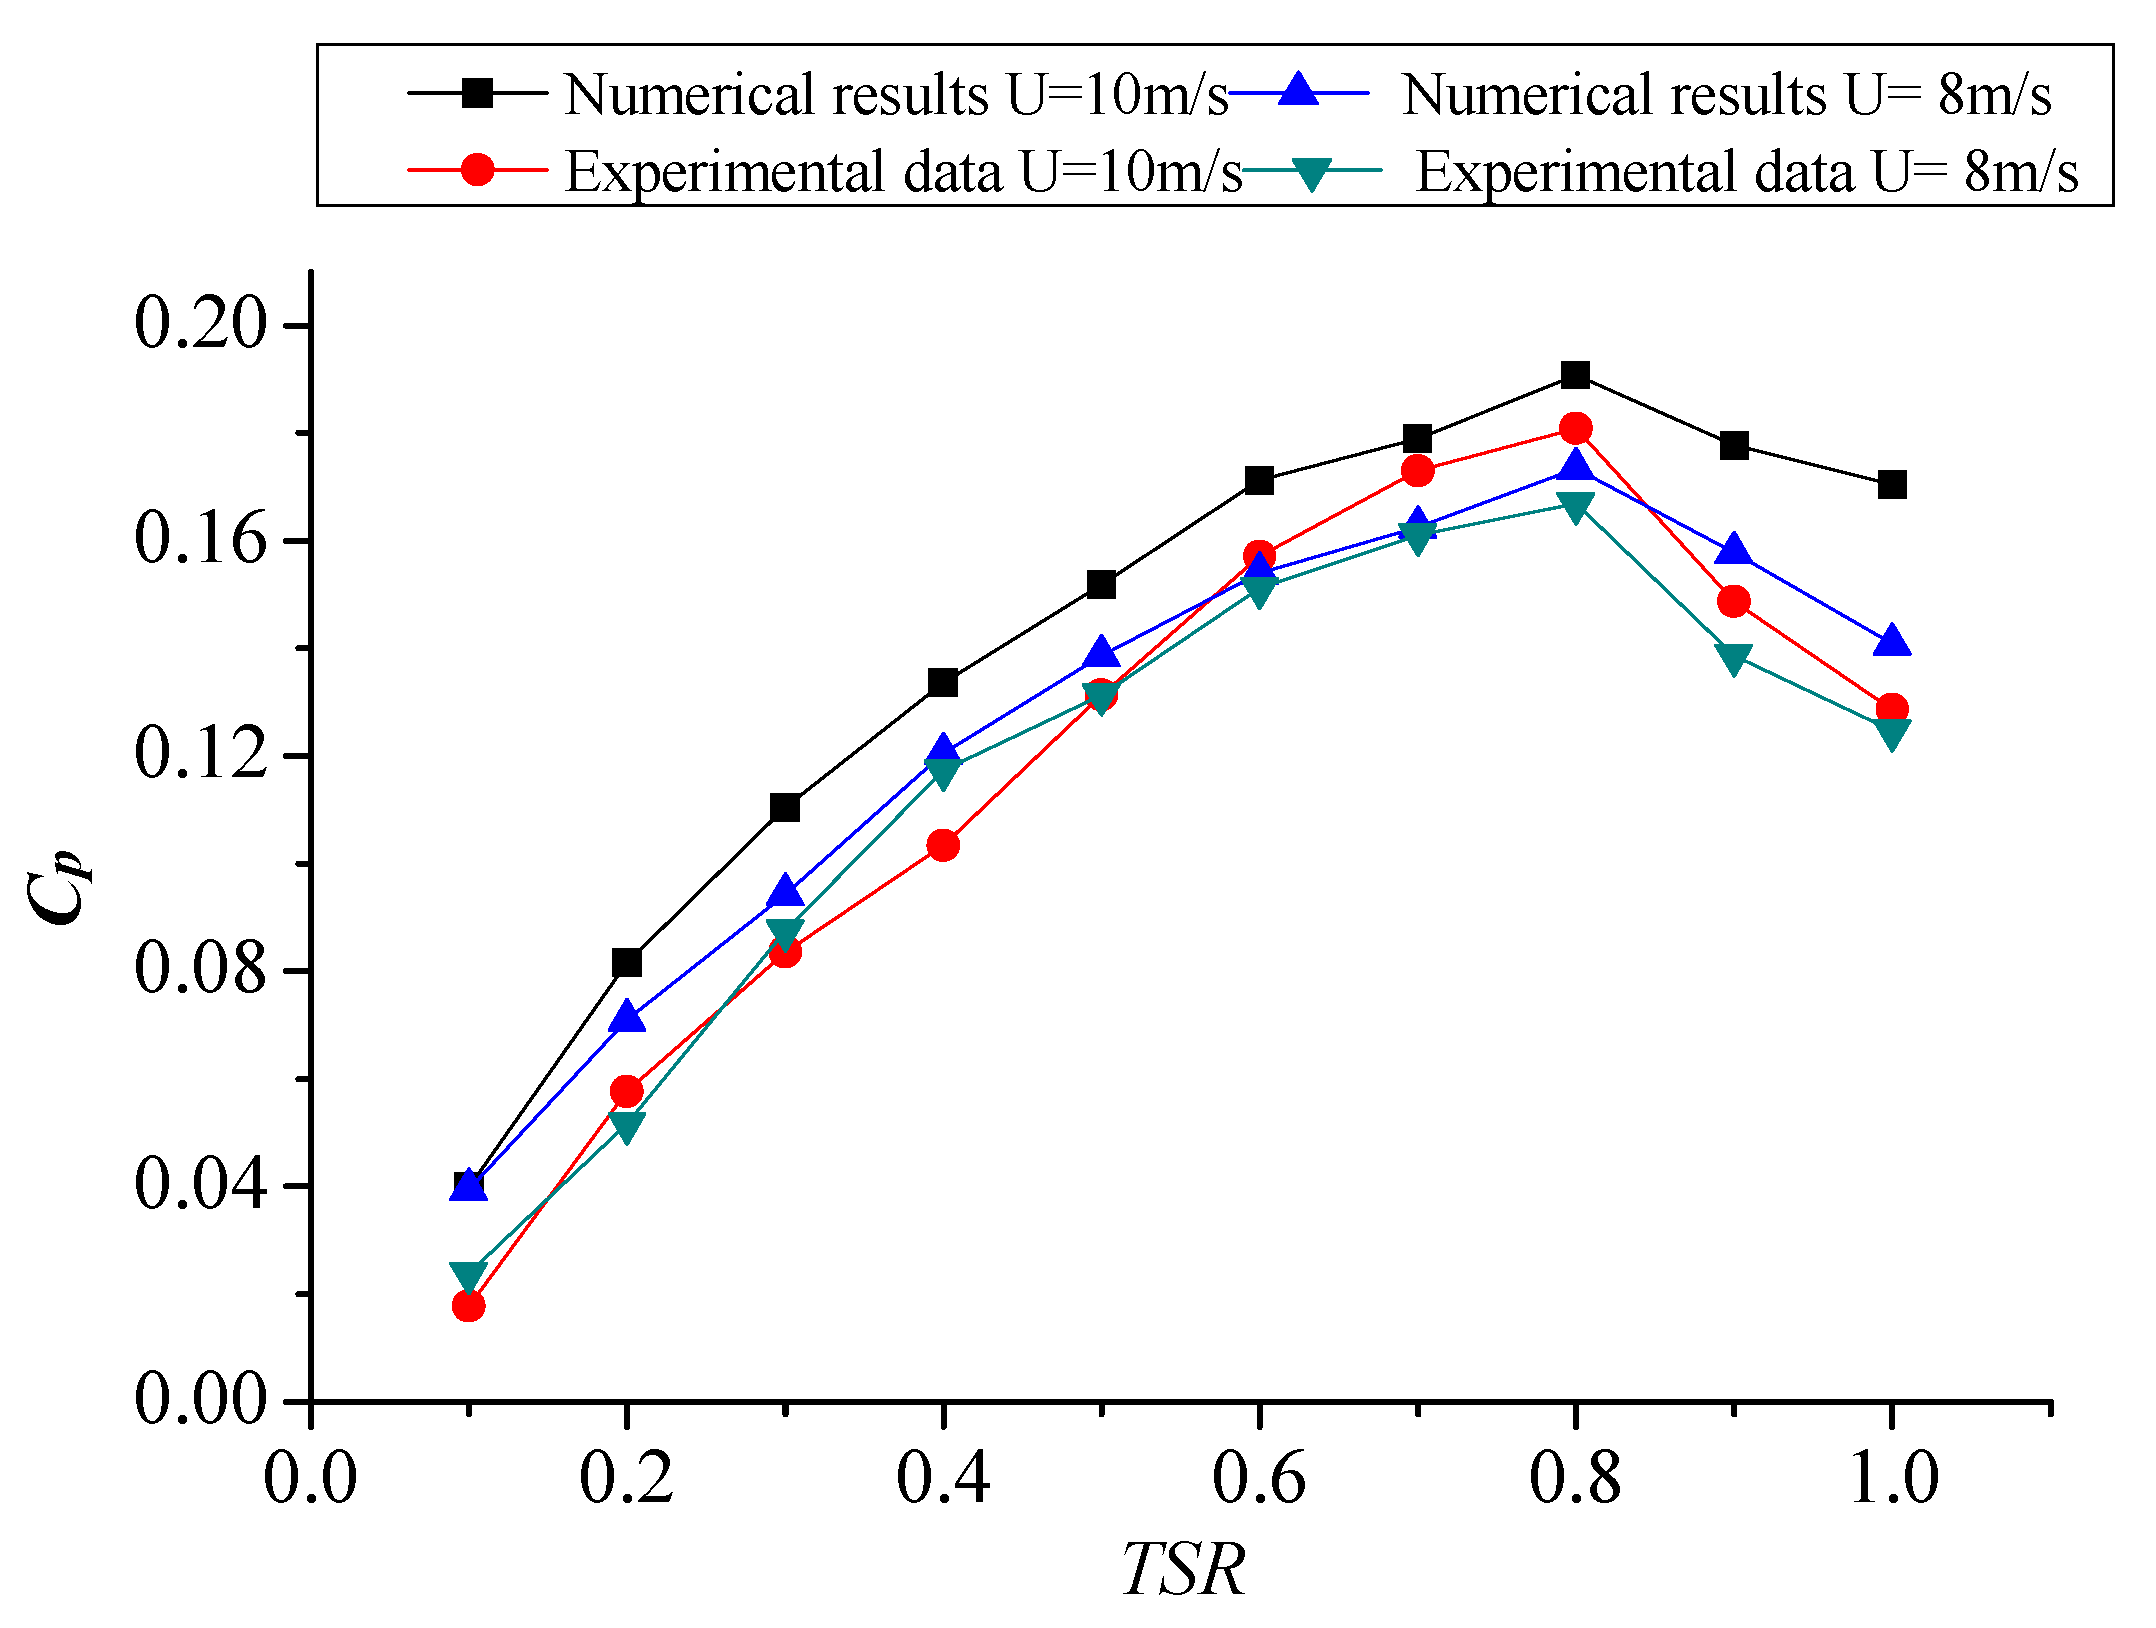
3.3.4. Validation of the Numerical Simulation Method

The feasibility of the numerical simulation method is always validated through a comparison between the numerical results and the experimental data. In the grid independence test, the angle-of-attack is set to 60° and the wind velocity is set to 10 m/s. The model is calculated with different grids until the value of the static torque coefficient does not change significantly. The results are shown in Figure 8. The static torque coefficient Cst of a wind turbine is defined by:
C s t = T s 0.5 ρ V 2 A R ,
In Equation (1), Ts is the net aerodynamic torque acting on the rotor, V the free-stream wind velocity, u the angular velocity vector, R the rotor radius, and A the the swept area (A = HD, H is the rotor height, D = 2R).
The tip-speed ratio TSR and power coefficient Cp is defined as:
T S R = ω R V ,
C p = P 0.5 ρ V 3 A ,
where ω is the angular velocity; P is the extracted power.
The specifics of the grid number are shown in Table 3. Note that the value Error at the last row of Table 3 represents the deviation of the calculated static torque coefficient (Cst) with the experimental value (0.28). In Figure 8 and Table 3, there is little change in the static torque coefficient when the grid number is higher than 274,076 and the Error is lower than 5%. Therefore, the dynamic performance of the model with refinement level 6 is adopted to perform the numerical simulation. A comparison between the numerical results and the experimental data is shown in Figure 9.
Figure 9 shows that the mean power coefficients are related to the TSR as well as the wind velocity, and the numerical results compare very well with the experimental results. When the wind velocity is 8 m/s, the numerical simulation gives a maximum Cp of 0.191, corresponding to TSR ≈ 0.8, while that from the experimental data is found to be about 0.178, corresponding to a TSR approximately equal to 0.78. When the wind velocity is 10 m/s, the maximum value of Cp from the numerical simulation is found to be about 0.202, while that from the experimental data is found to be about 0.187. The deviation between the numerical results and the experimental data is very small. Therefore, the choices of turbulence model, method, and algorithm used for the numerical analysis are appropriate. Then, the same numerical simulation method is used to explore the effect of this straight-arc curtain on the aerodynamic performance of the wind rotor.

4. Results and Discussion

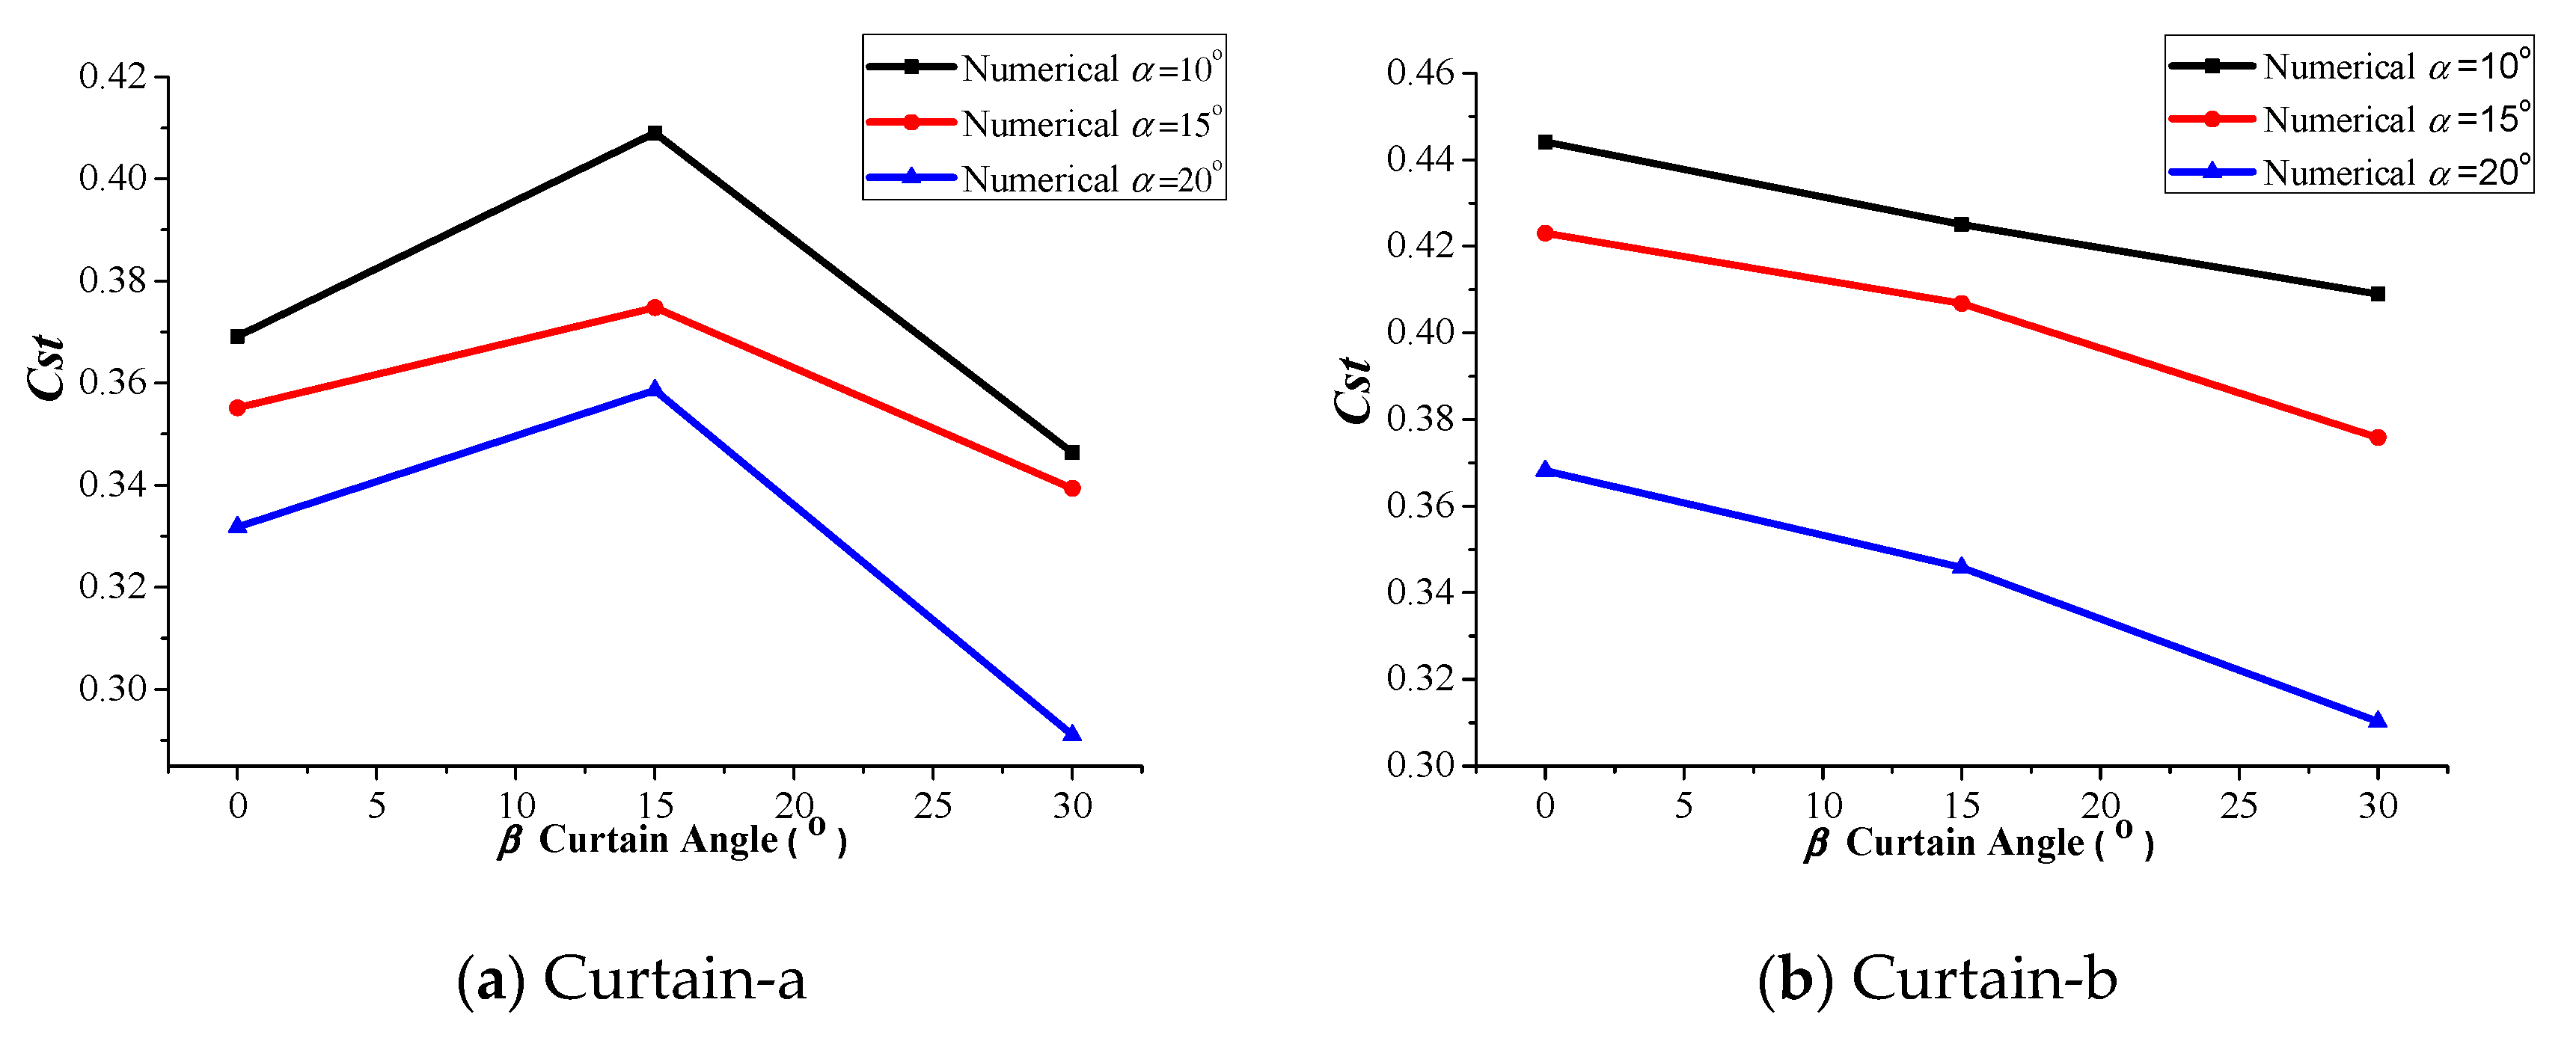
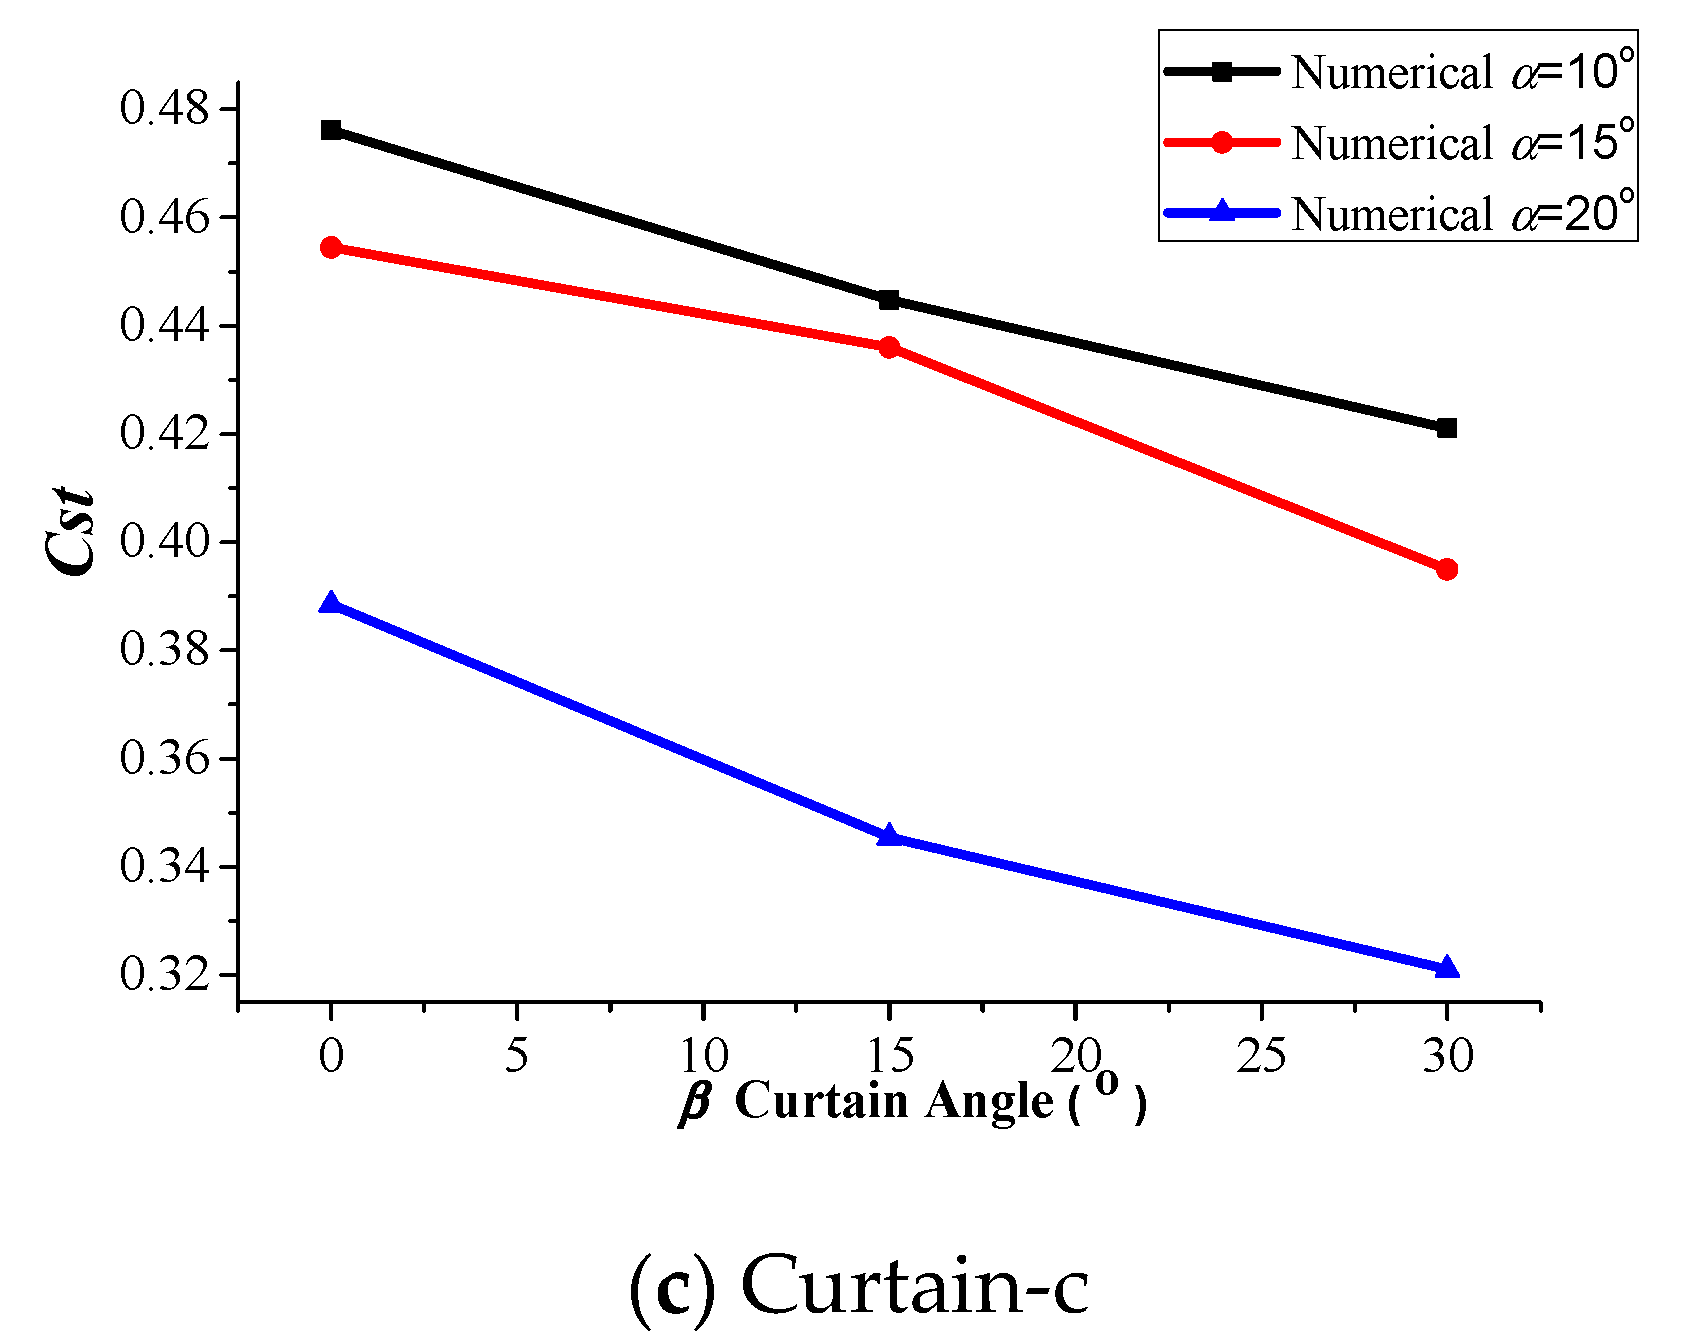
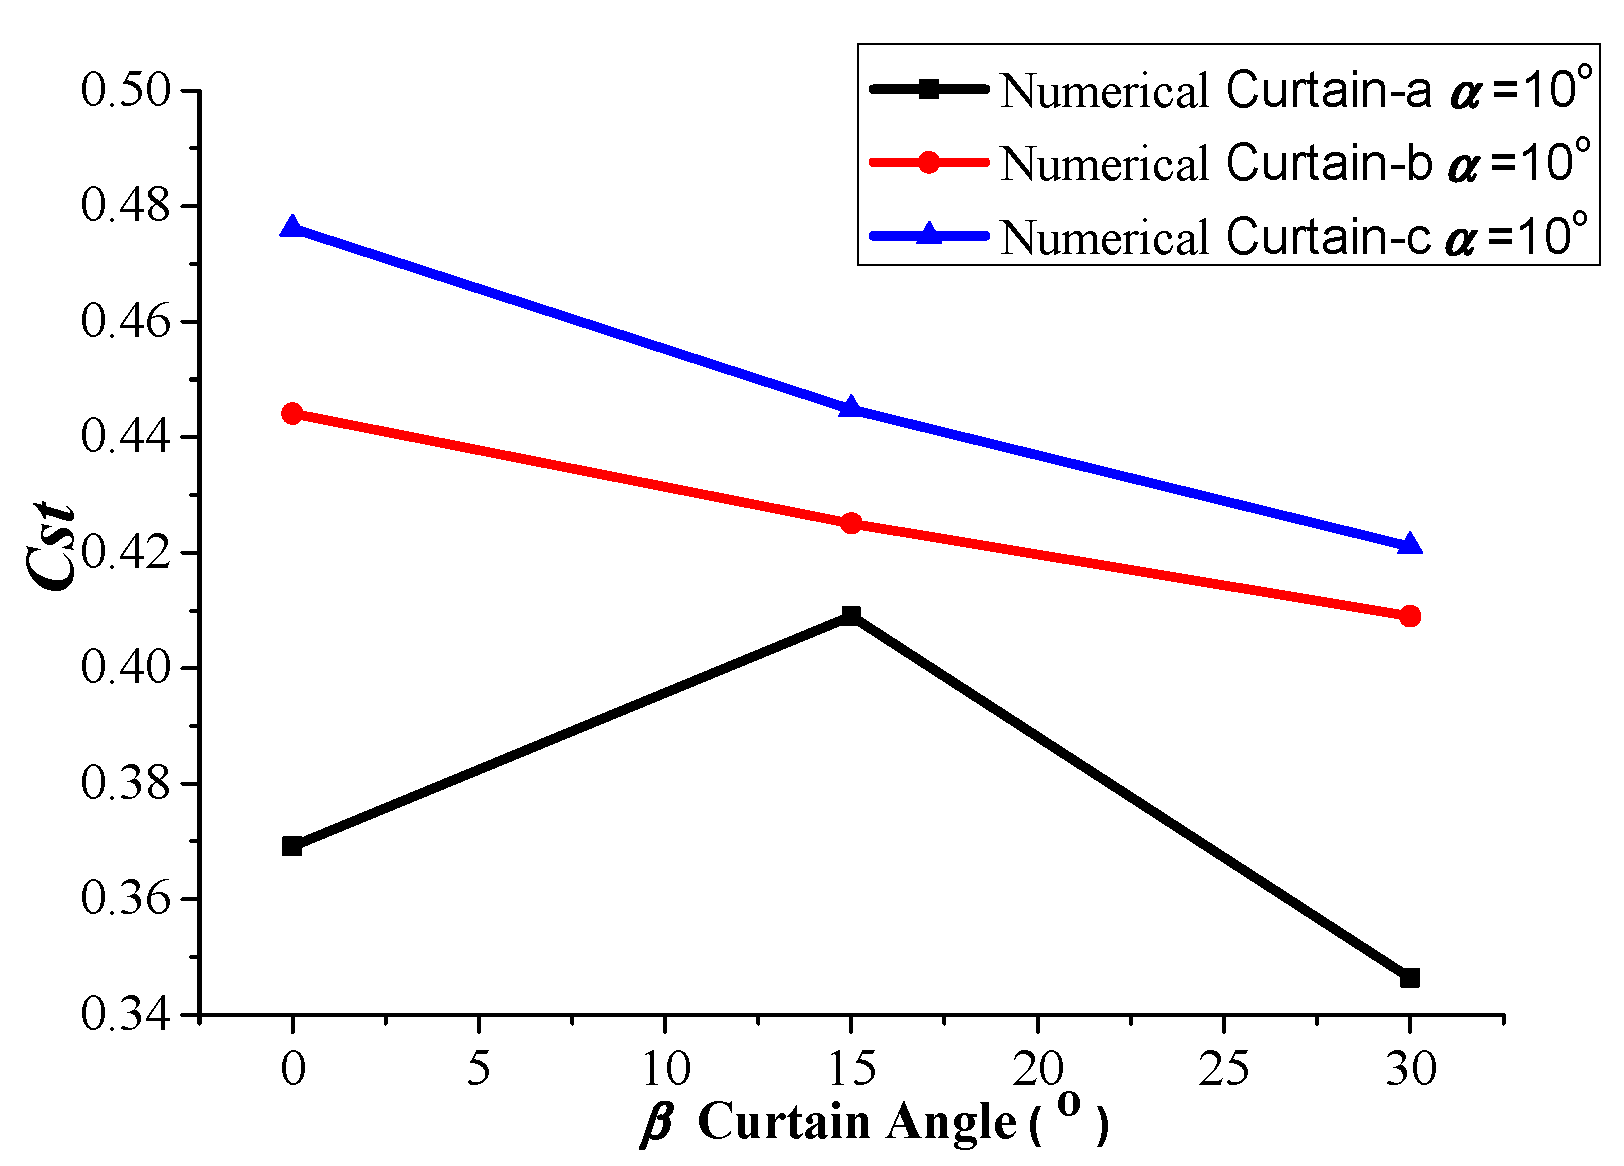
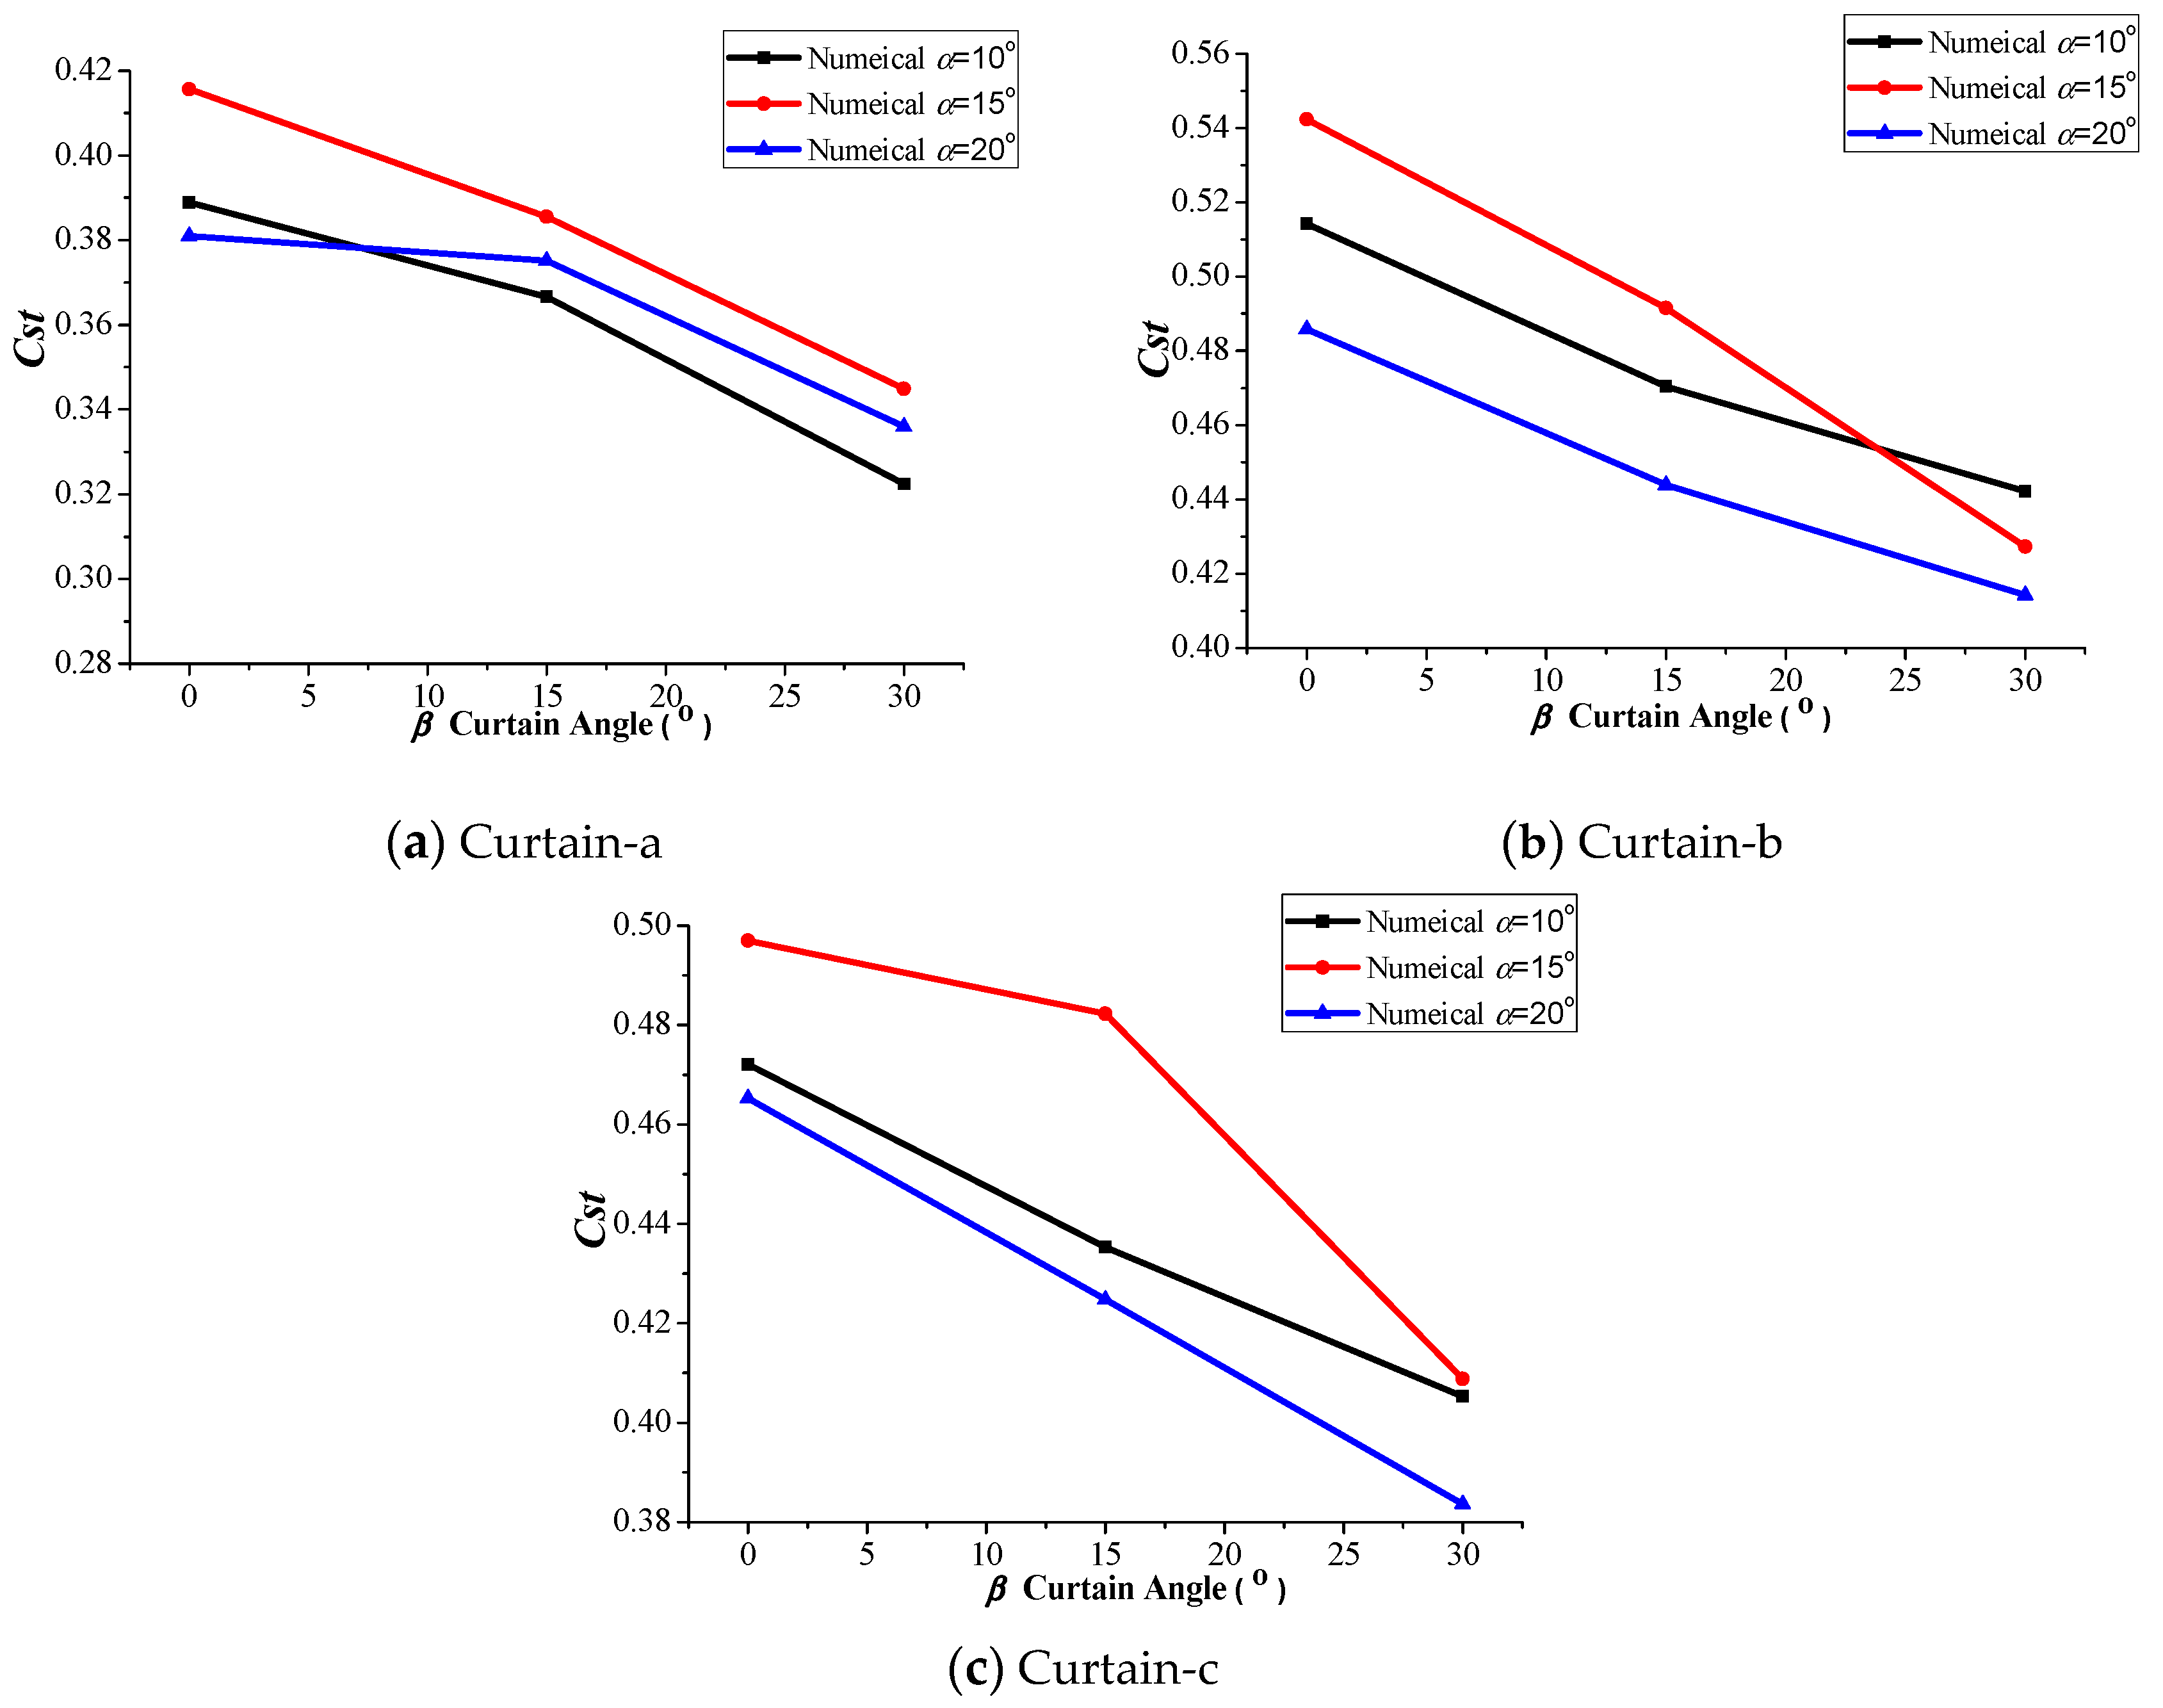
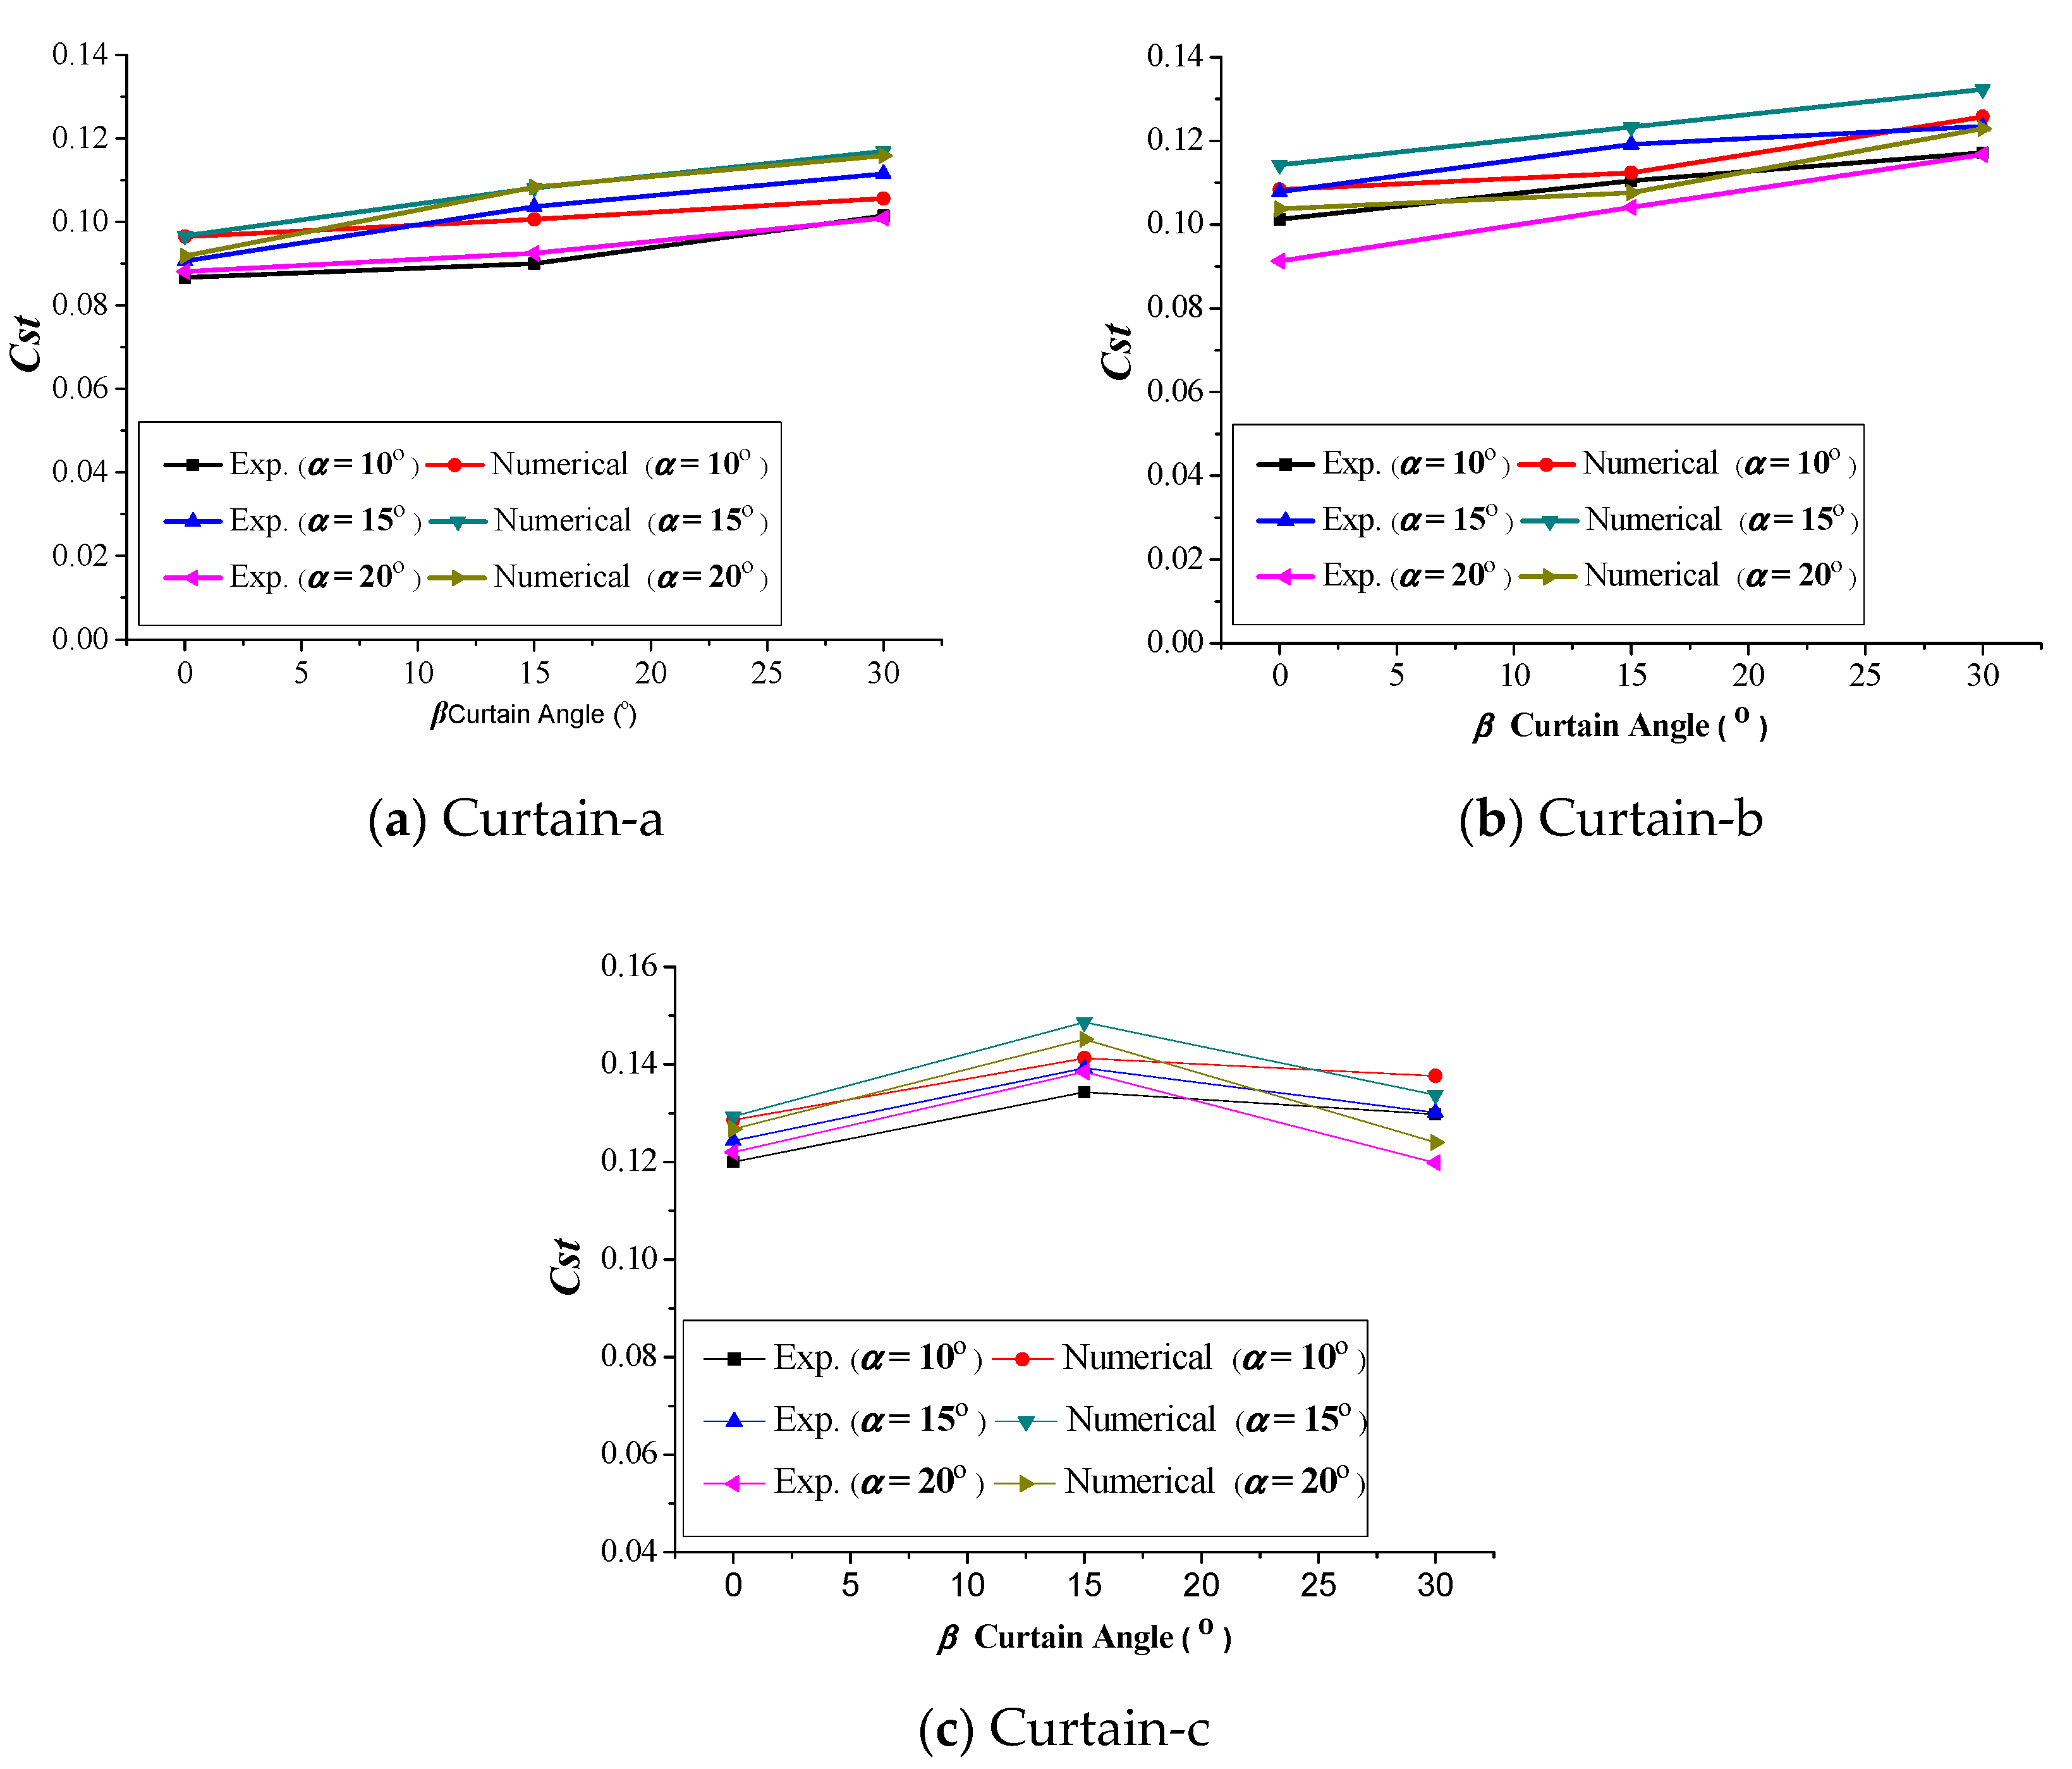
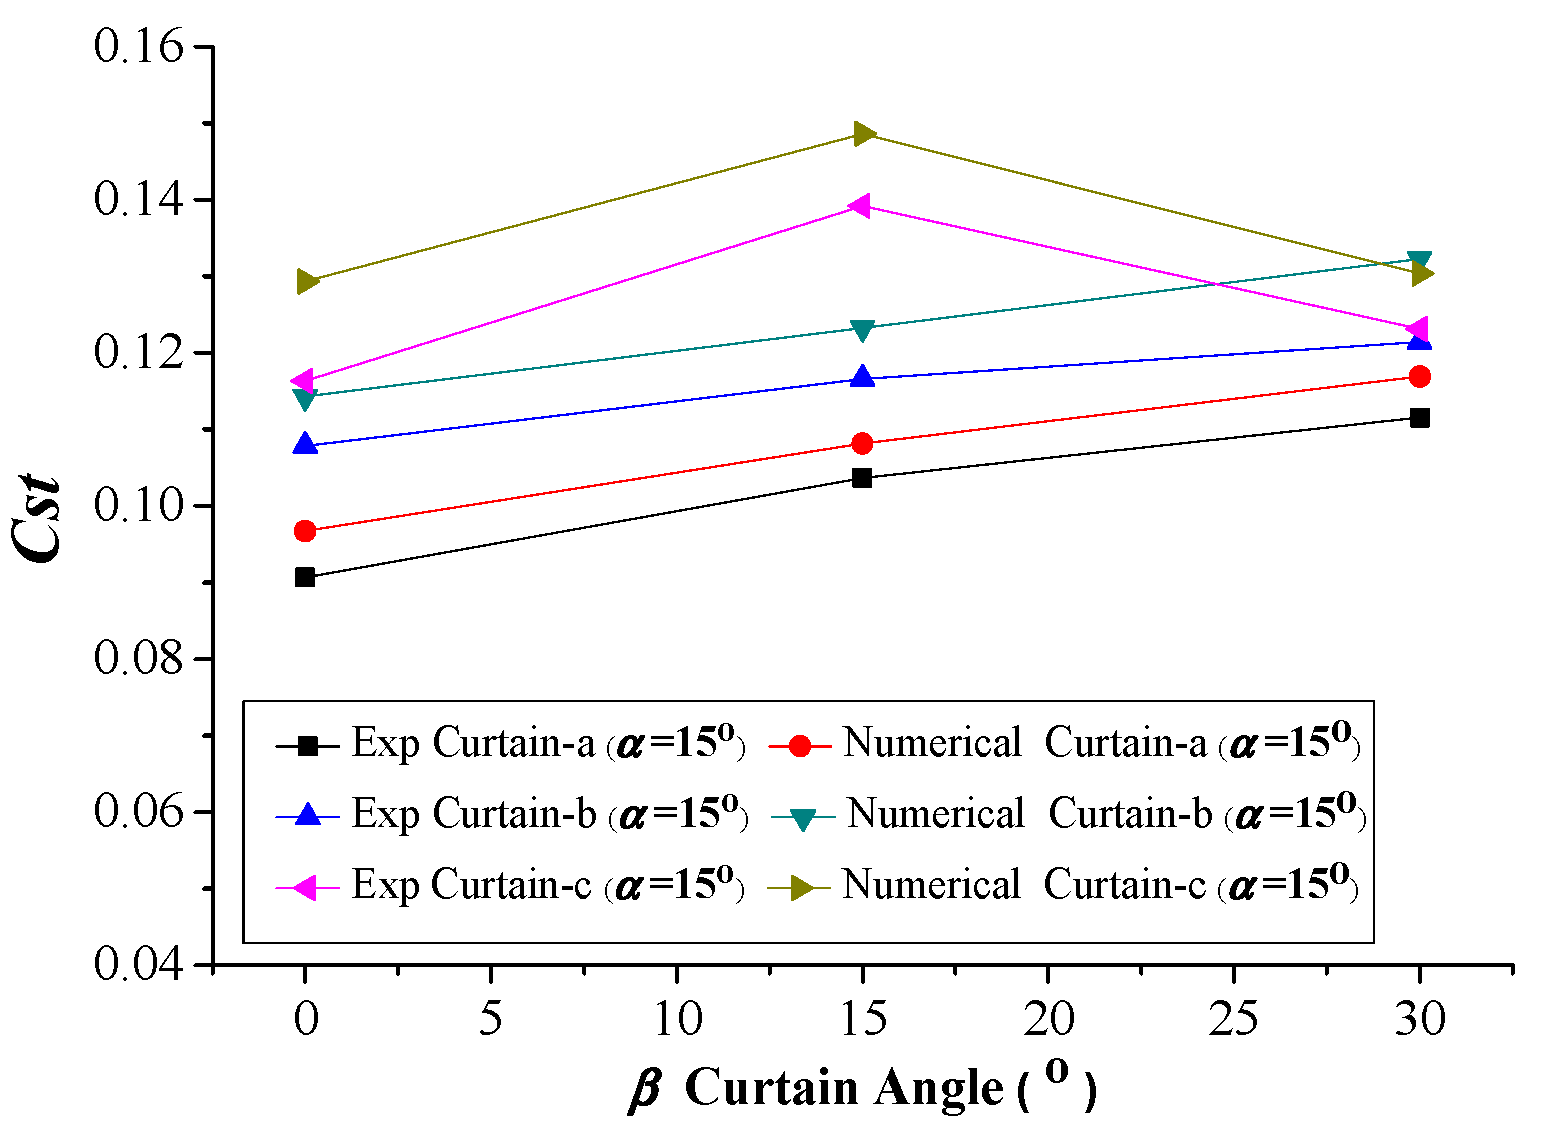
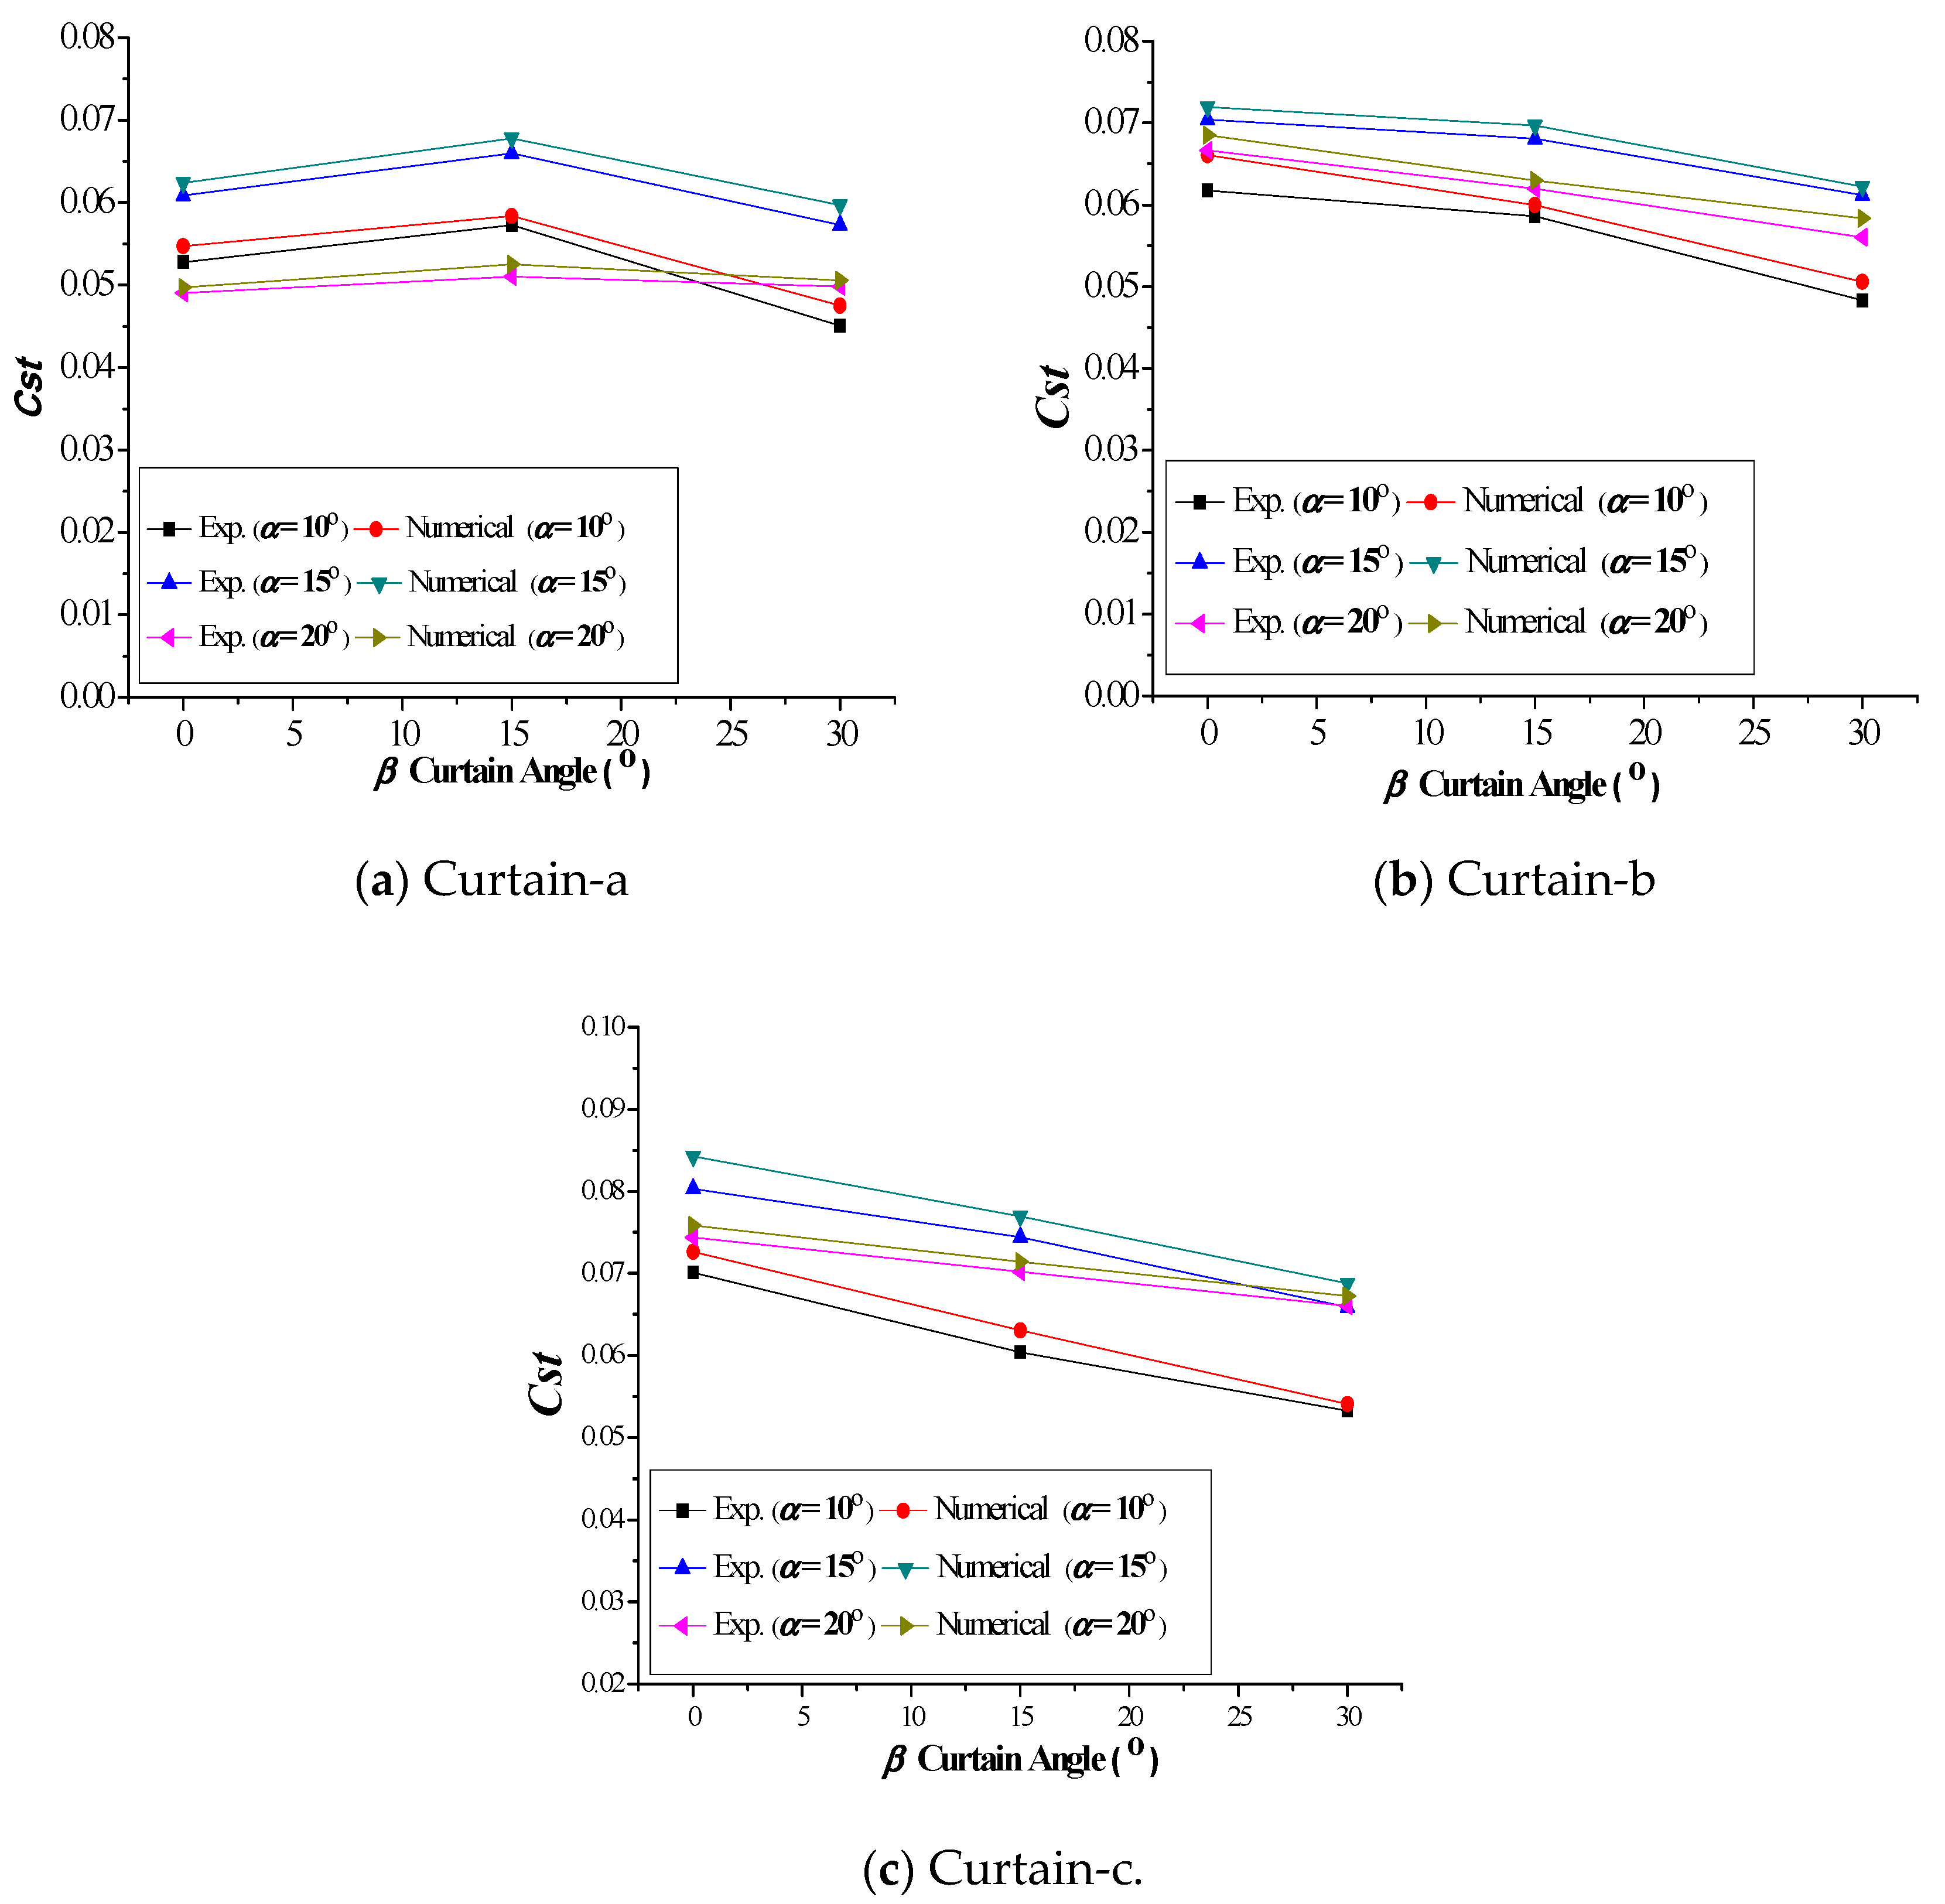
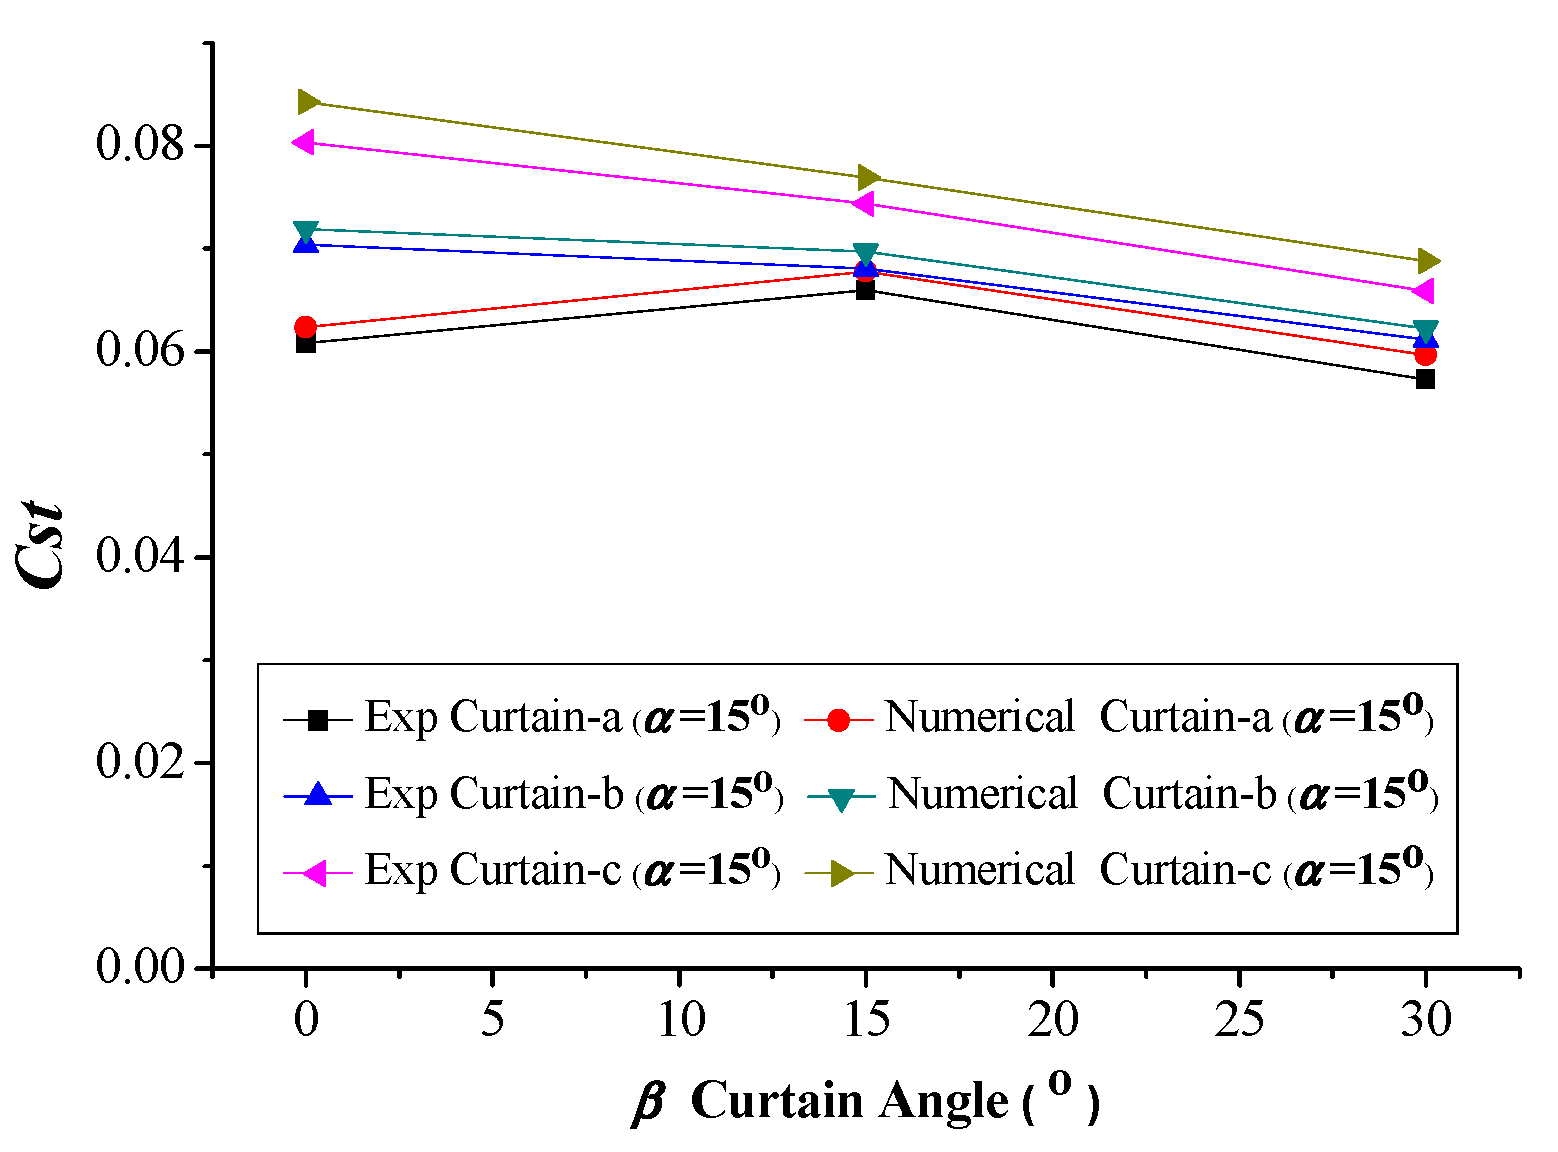
4.1. Static Performance

When the rotor position is θ = 45°, the static torque coefficient (Cst) of the traditional Savonius wind rotor is about 0.32. The Cst values of the wind rotor with the straight–arc curtain obtained from the numerical analysis are shown in Figure 10.
The results show that straight-arc curtains with different parameters can improve the Cst value of the wind rotor, and the extent of the enhancement relies on the geometric parameters of the straight-arc curtain. The Cst values obtained for Curtain-a, Curtain-b, and Curtain-c when α = 10° are higher than those obtained when α = 15° and α = 20°. This indicates that the best angle for the straight curtain is 10°. When α is fixed, Curtain-a with β = 15° has better performance than Curtain-a with β = 0° and β = 30°, and Curtain-b and Curtain-c with β = 0° have better performance than both curtains with β = 15° and β = 30°. Therefore, the best angle for the arc-shaped curtain of Curtain-a is 15°, and the best angle for the arc-shaped curtain of Curtain-b and Curtain-c is 0°. This result indicates that the effects of the angle and the length of the arc-shaped curtain on the performance of the rotor are not independent. Only when the angle and the length have their optimal values can the wind rotor have the best aerodynamic performance.
The Cst values obtained for Curtain-a, Curtain-b, and Curtain-c when the curtain angle α is 10° are shown in Figure 11.
Figure 11 shows that Curtain-c has a better performance than Curtain-a and Curtain-b under the same conditions. The maximum Cst values obtained for Curtain-a, Curtain-b, and Curtain-c are 0.421, 0.454, and 0.479, respectively. The maximum Cst value obtained for Curtain-c is about 50% higher than that of the rotor without the curtain.
When the rotor position is θ = 60°, the Cst value of the traditional Savonius wind rotor is about 0.28. The Cst values of the wind rotor with the straight-arc curtain obtained from the numerical analysis are shown in Figure 12.
Figure 12 shows that the Cst values of the rotor with the curtain are always higher than 0.28, which indicates that all of the straight-arc curtains can effectively improve the static performance of the rotor. It can also be seen that the variation trend of Cst for the rotor with the curtain angle is similar in the three Figures. The highest Cst values for the three curtain groups are found at around α = 15° and β = 0° and the lowest ones at around α = 20° and β = 30°. This indicates that the best angle for the arc-shaped curtains of Curtain-a, Curtain-b, and Curtain-c is 0° and the best angle for the straight curtains of Curtain-a, Curtain-b, and Curtain-c is 15°.
The Cst values obtained for Curtain-a, Curtain-b, and Curtain-c for a curtain angle α of 15° are shown in Figure 13.
As can be seen from Figure 13, Curtain-c still has a better performance than Curtain-a and Curtain-b under the same conditions. The maximum Cst values obtained for Curtain-a, Curtain-b, and Curtain-c are 0.415, 0.487, and 0.544 respectively. The maximum Cst obtained for Curtain-c is about 90% higher than that of the rotor without the curtain.
When the rotor position is θ = 150°, the Cst value of the traditional Savonius wind rotor is about 0.0. The Cst values of the wind rotor with the straight-arc curtain obtained from the numerical analysis are shown in Figure 14.
The results show that the Cst values of the rotor with the curtain are always higher than 0.0, which indicates that all of the straight-arc curtains can effectively improve the positive moment of the concave blade so as to improve the static performance of the rotor. It also can be found that the rotor has the best performance with Curtain-a for curtain angles α= 15° and β = 30°, with Curtain-b for α = 15° and β = 30°, and with Curtain-c for α = 15° and β = 15°. This result once again indicates that the effects of the curtain angle and the length of the arc-shaped curtain on the performance of the rotor are not independent.
The Cst values obtained for Curtain-a, Curtain-b and Curtain-c for a curtain angle α of 15° are shown in Figure 15.
In Figure 15, Curtain-c still has a better performance than Curtain-a and Curtain-b under the same conditions. The maximum Cst values obtained for Curtain-a, Curtain-b, and Curtain-c are 0.121, 0.132, and 0.148, respectively.
When the rotor position is θ = 165°, the Cst value of the traditional Savonius wind rotor is about −0.13. The Cst values of the wind rotor with the straight-arc curtain obtained from the numerical analysis are shown in Figure 16.
The results show that the Cst values obtained for the different curtains are always positive, which is not the case with the conventional rotor. This indicates that all of the straight-arc curtains can effectively decrease the negative moment of the convex blade and increase the positive moment of the concave blade. It can also be found that the best curtain angles for Curtain-a are α = 15° and β = 15° and for Curtain-b and Curtain-c are α = 15° and β = 0°.
The Cst values obtained for Curtain-a, Curtain-b, and Curtain-c for a curtain angle α of 15° are shown in Figure 17.
Figure 17 shows that the Cst values obtained for Curtain-c from the numerical analysis are higher than the experimental ones for Curtain-a, Curtain-b, and Curtain-c at the same curtain angles. The maximum Cst values obtained for Curtain-a, Curtain-b, and Curtain-c are 0.081, 0.086, and 0.101, respectively.
The above numerical analysis has shown that when the wind rotor is static, the straight-arc curtain can provide a better static performance than that achieved without the curtain. The extent of the enhancement is defined by the length of the arc-shaped curtain and the curtain angles. In addition, the effects of the curtain angle and the length of the arc-shaped curtain on the performance of the rotor are not independent. Only when the angle and the length have optimal values can the wind rotor have the best aerodynamic performance. In all cases, the rotor with Curtain-c has the best performance. Hence, Curtain-c with α = 15° and β = 15° is selected to explore the effect of the curtain on the dynamic performance of the Savonius wind rotor.

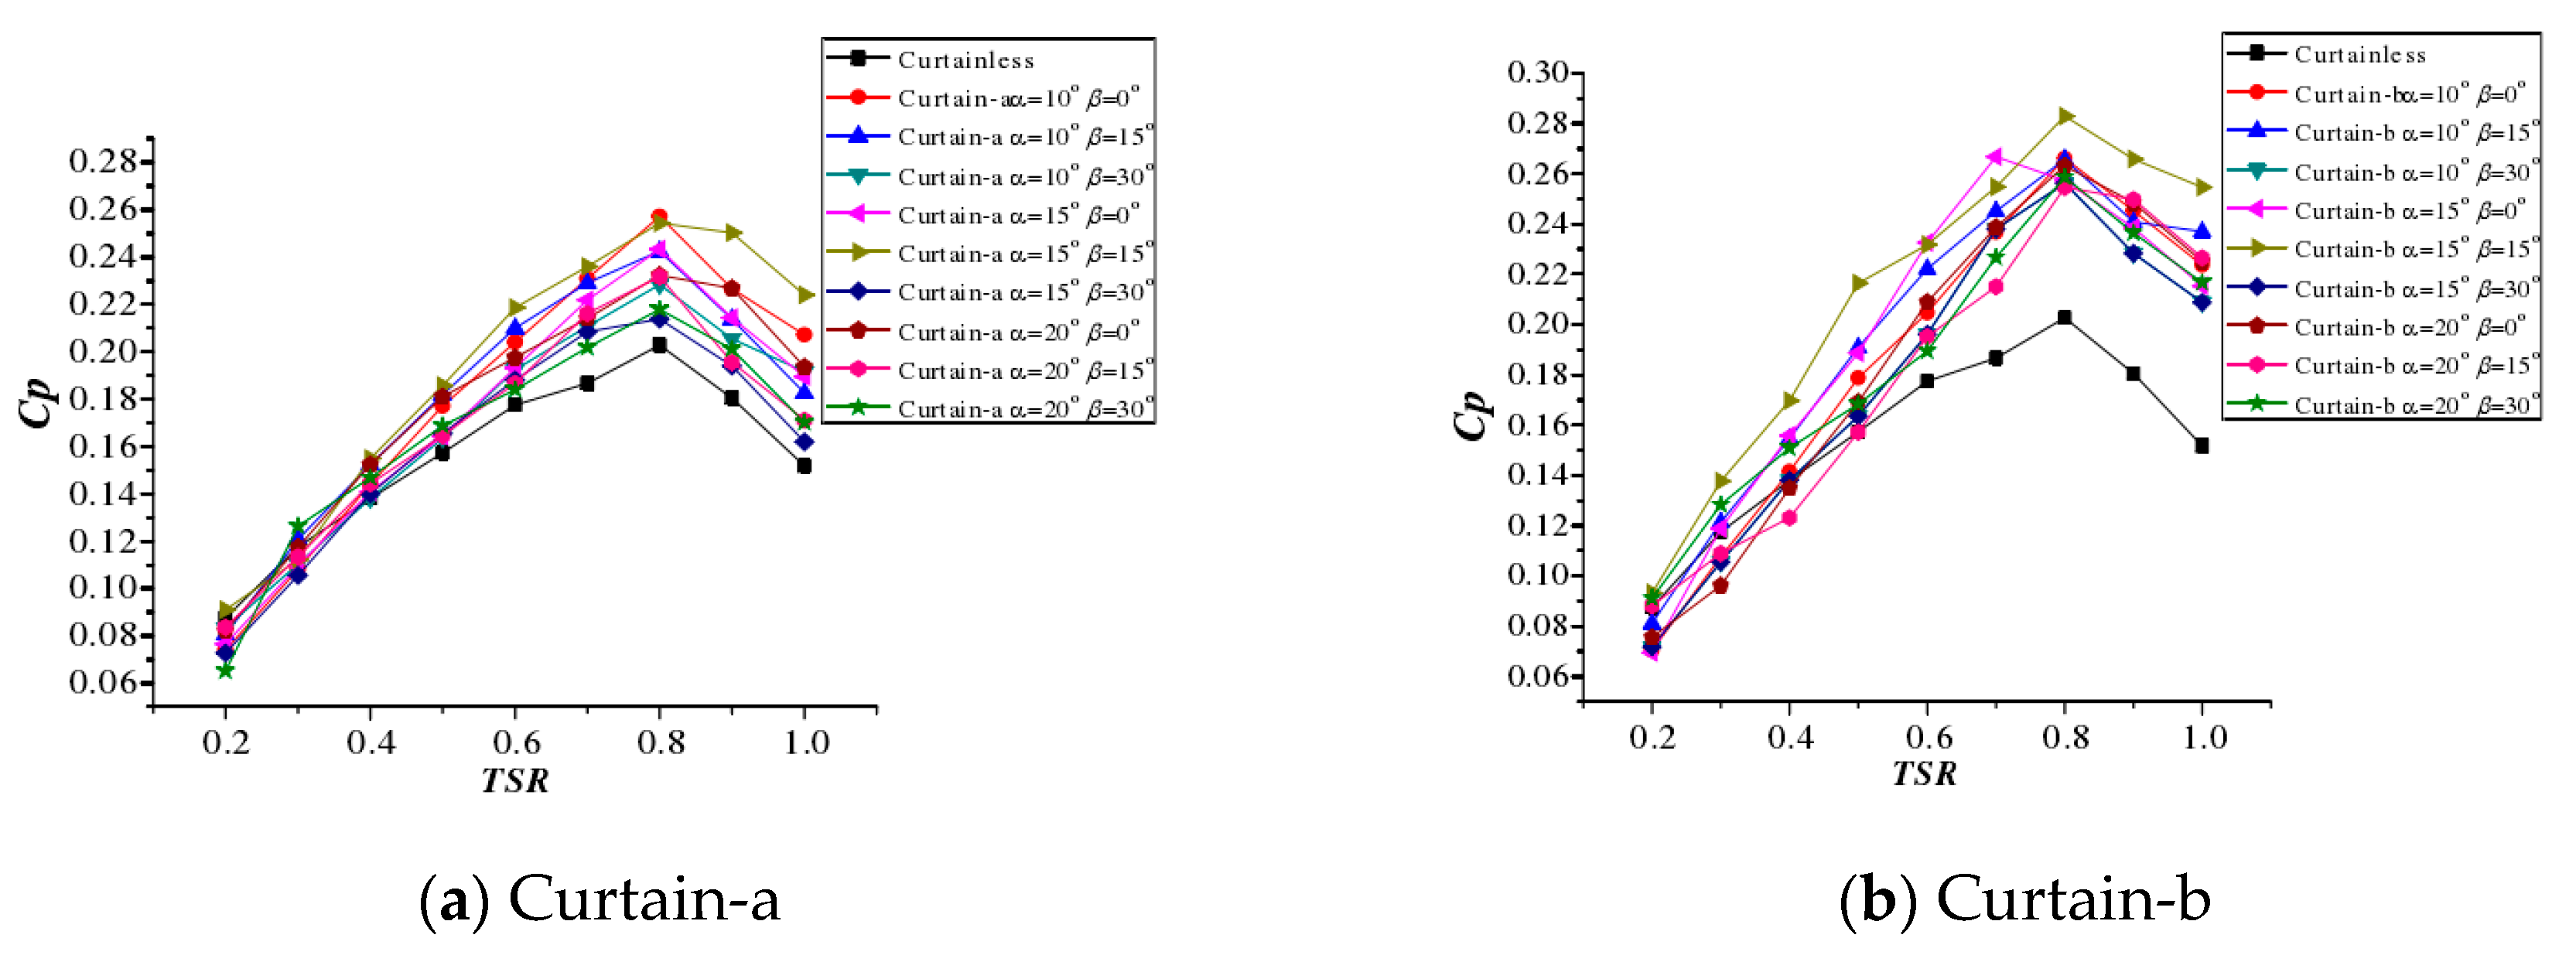
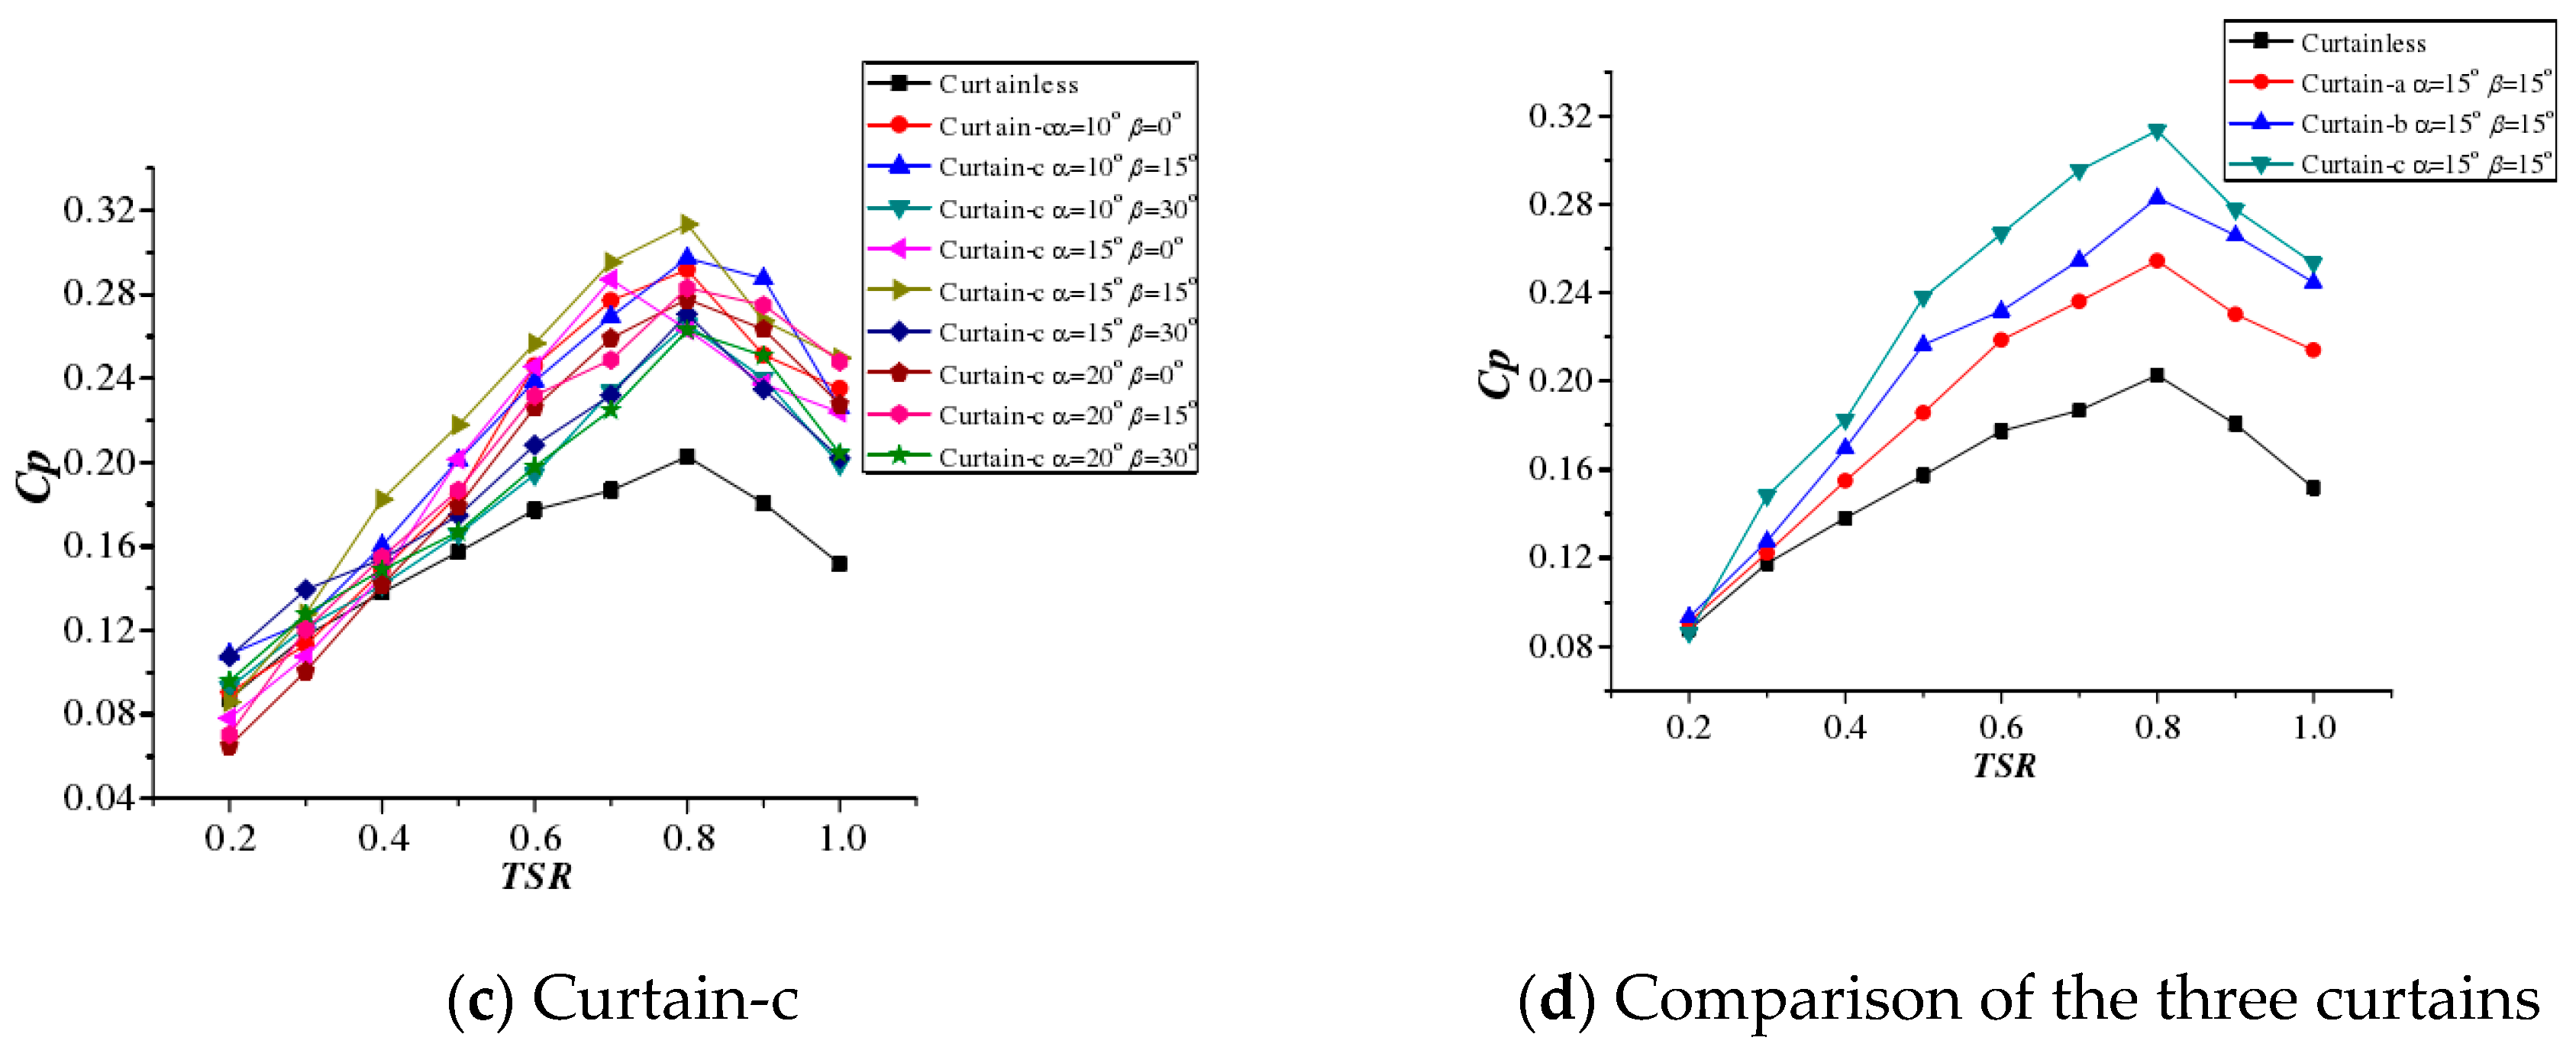
4.2. Dynamic Performance

To explore the effect of Curtain-c on the dynamic performance of the rotor, the same numerical method as that described in Section 4.1 is used to calculate the mean power coefficients of the wind rotor with and without Curtain-c. Then, the changes in the mean power with the TSR are used for their comparison. The numerical results are shown in Figure 18.
Figure 18 shows that the wind rotor with Curtain-c exhibits great improvement in the power coefficients compared with the conventional Savonius wind rotor. The power coefficients increase with increasing TSR up to a certain maximum value, beyond which they decrease with further increase in the TSR. In addition, the variation of the power coefficient is similar at different Reynolds numbers.
The Figure also shows that the maximum mean power coefficient obtained with the wind rotor with Curtain-c is about 0.303 at TSR = 0.8 and without curtains it is about 0.20 at TSR = 0.78 when the wind velocity is 10 m/s. The maximum power coefficient of the rotor with Curtain-c is approximately 1.5 times higher than that of the rotor without curtain. The results prove that the straight-arc curtain can effectively improve the dynamic performance of the rotor and increase the power coefficients.

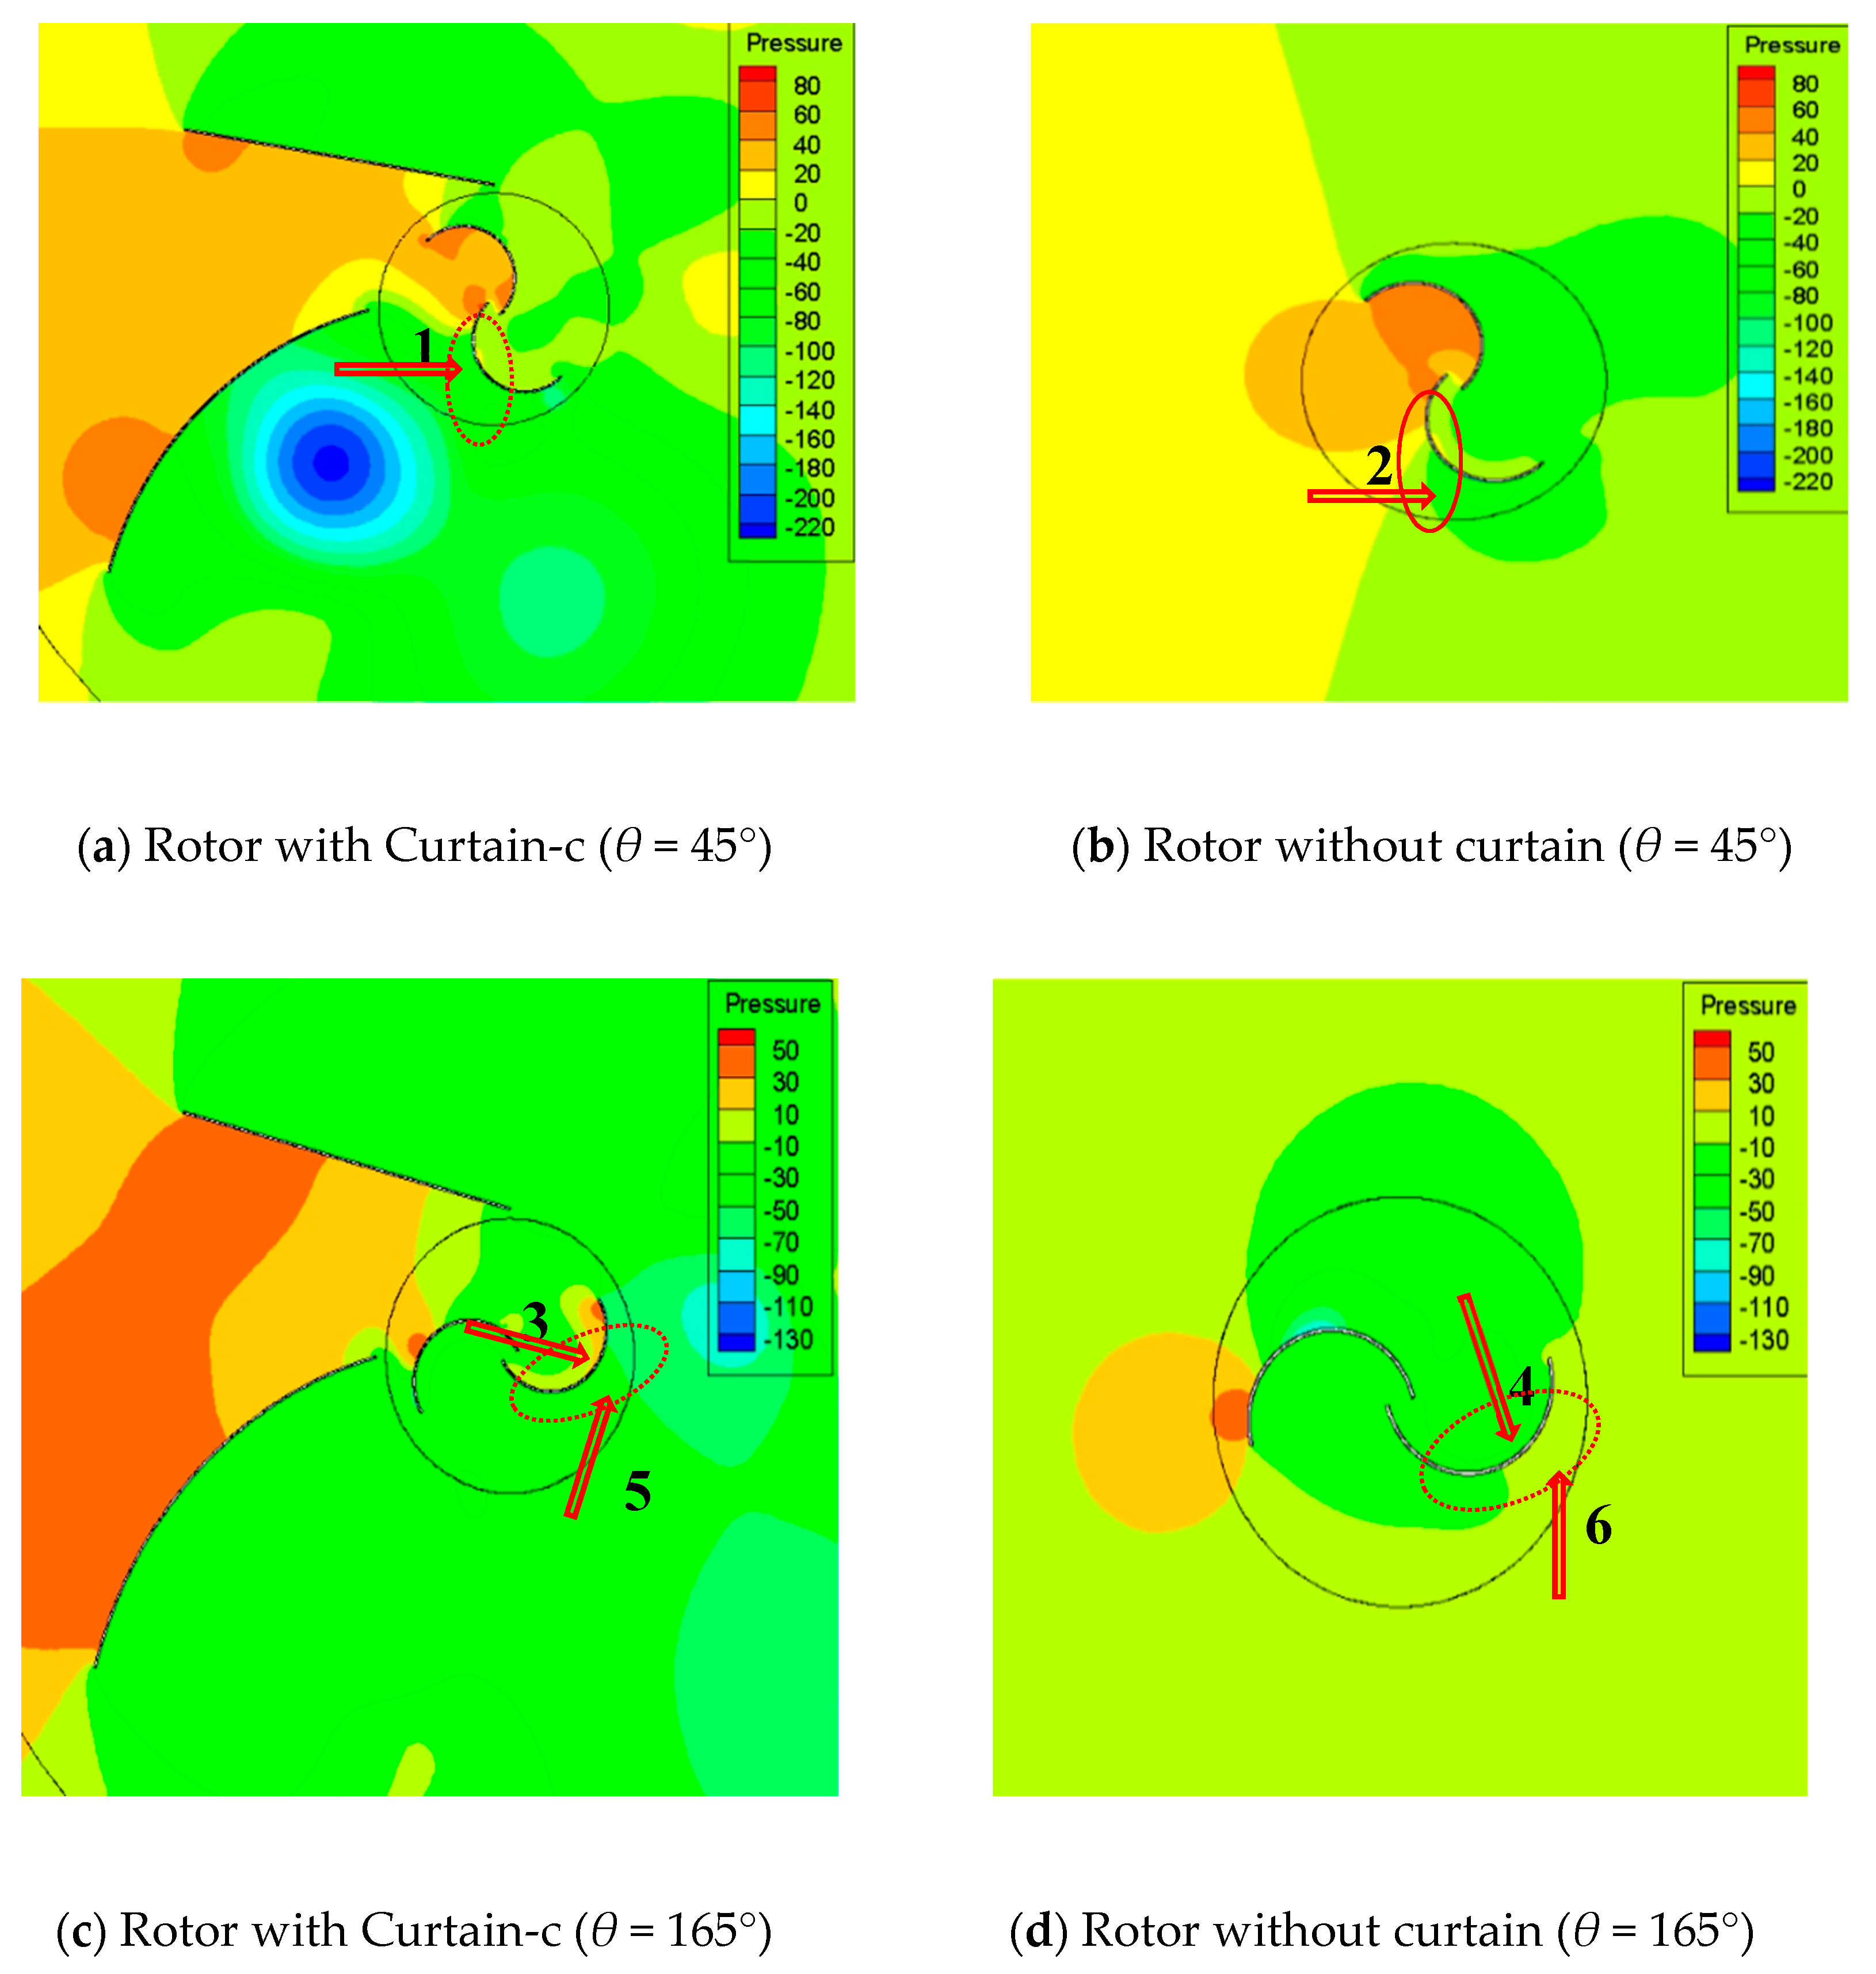
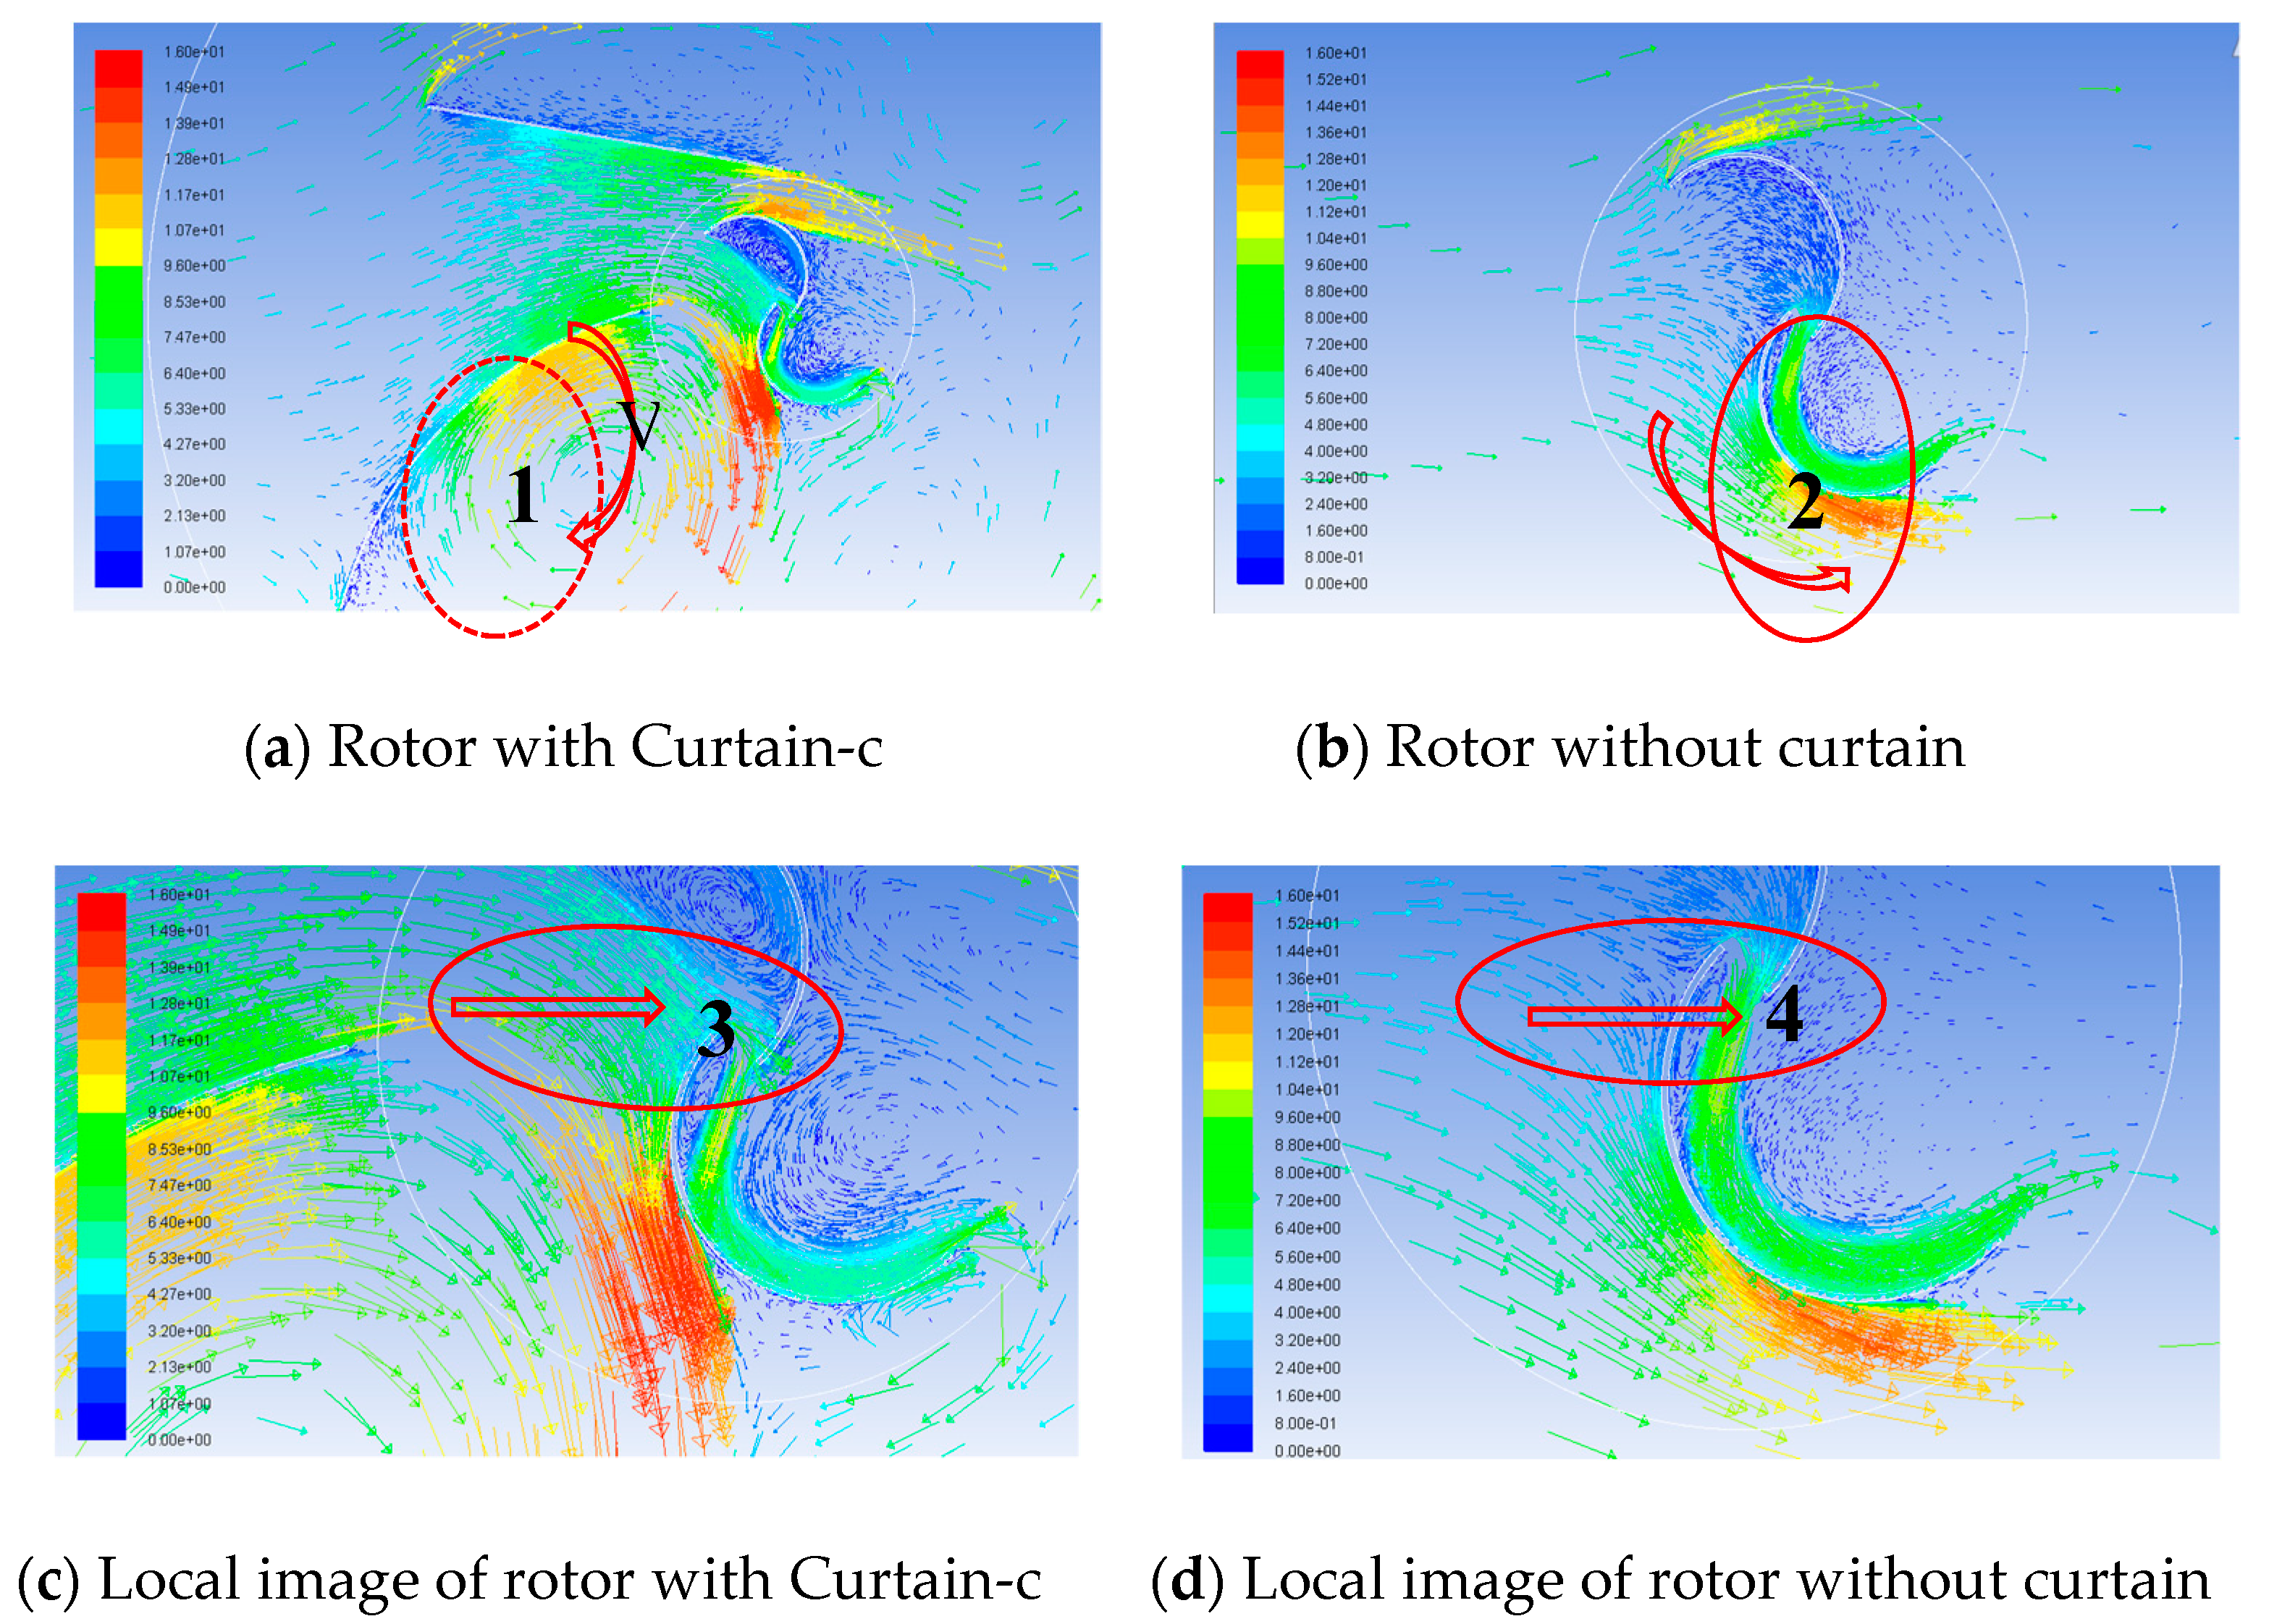
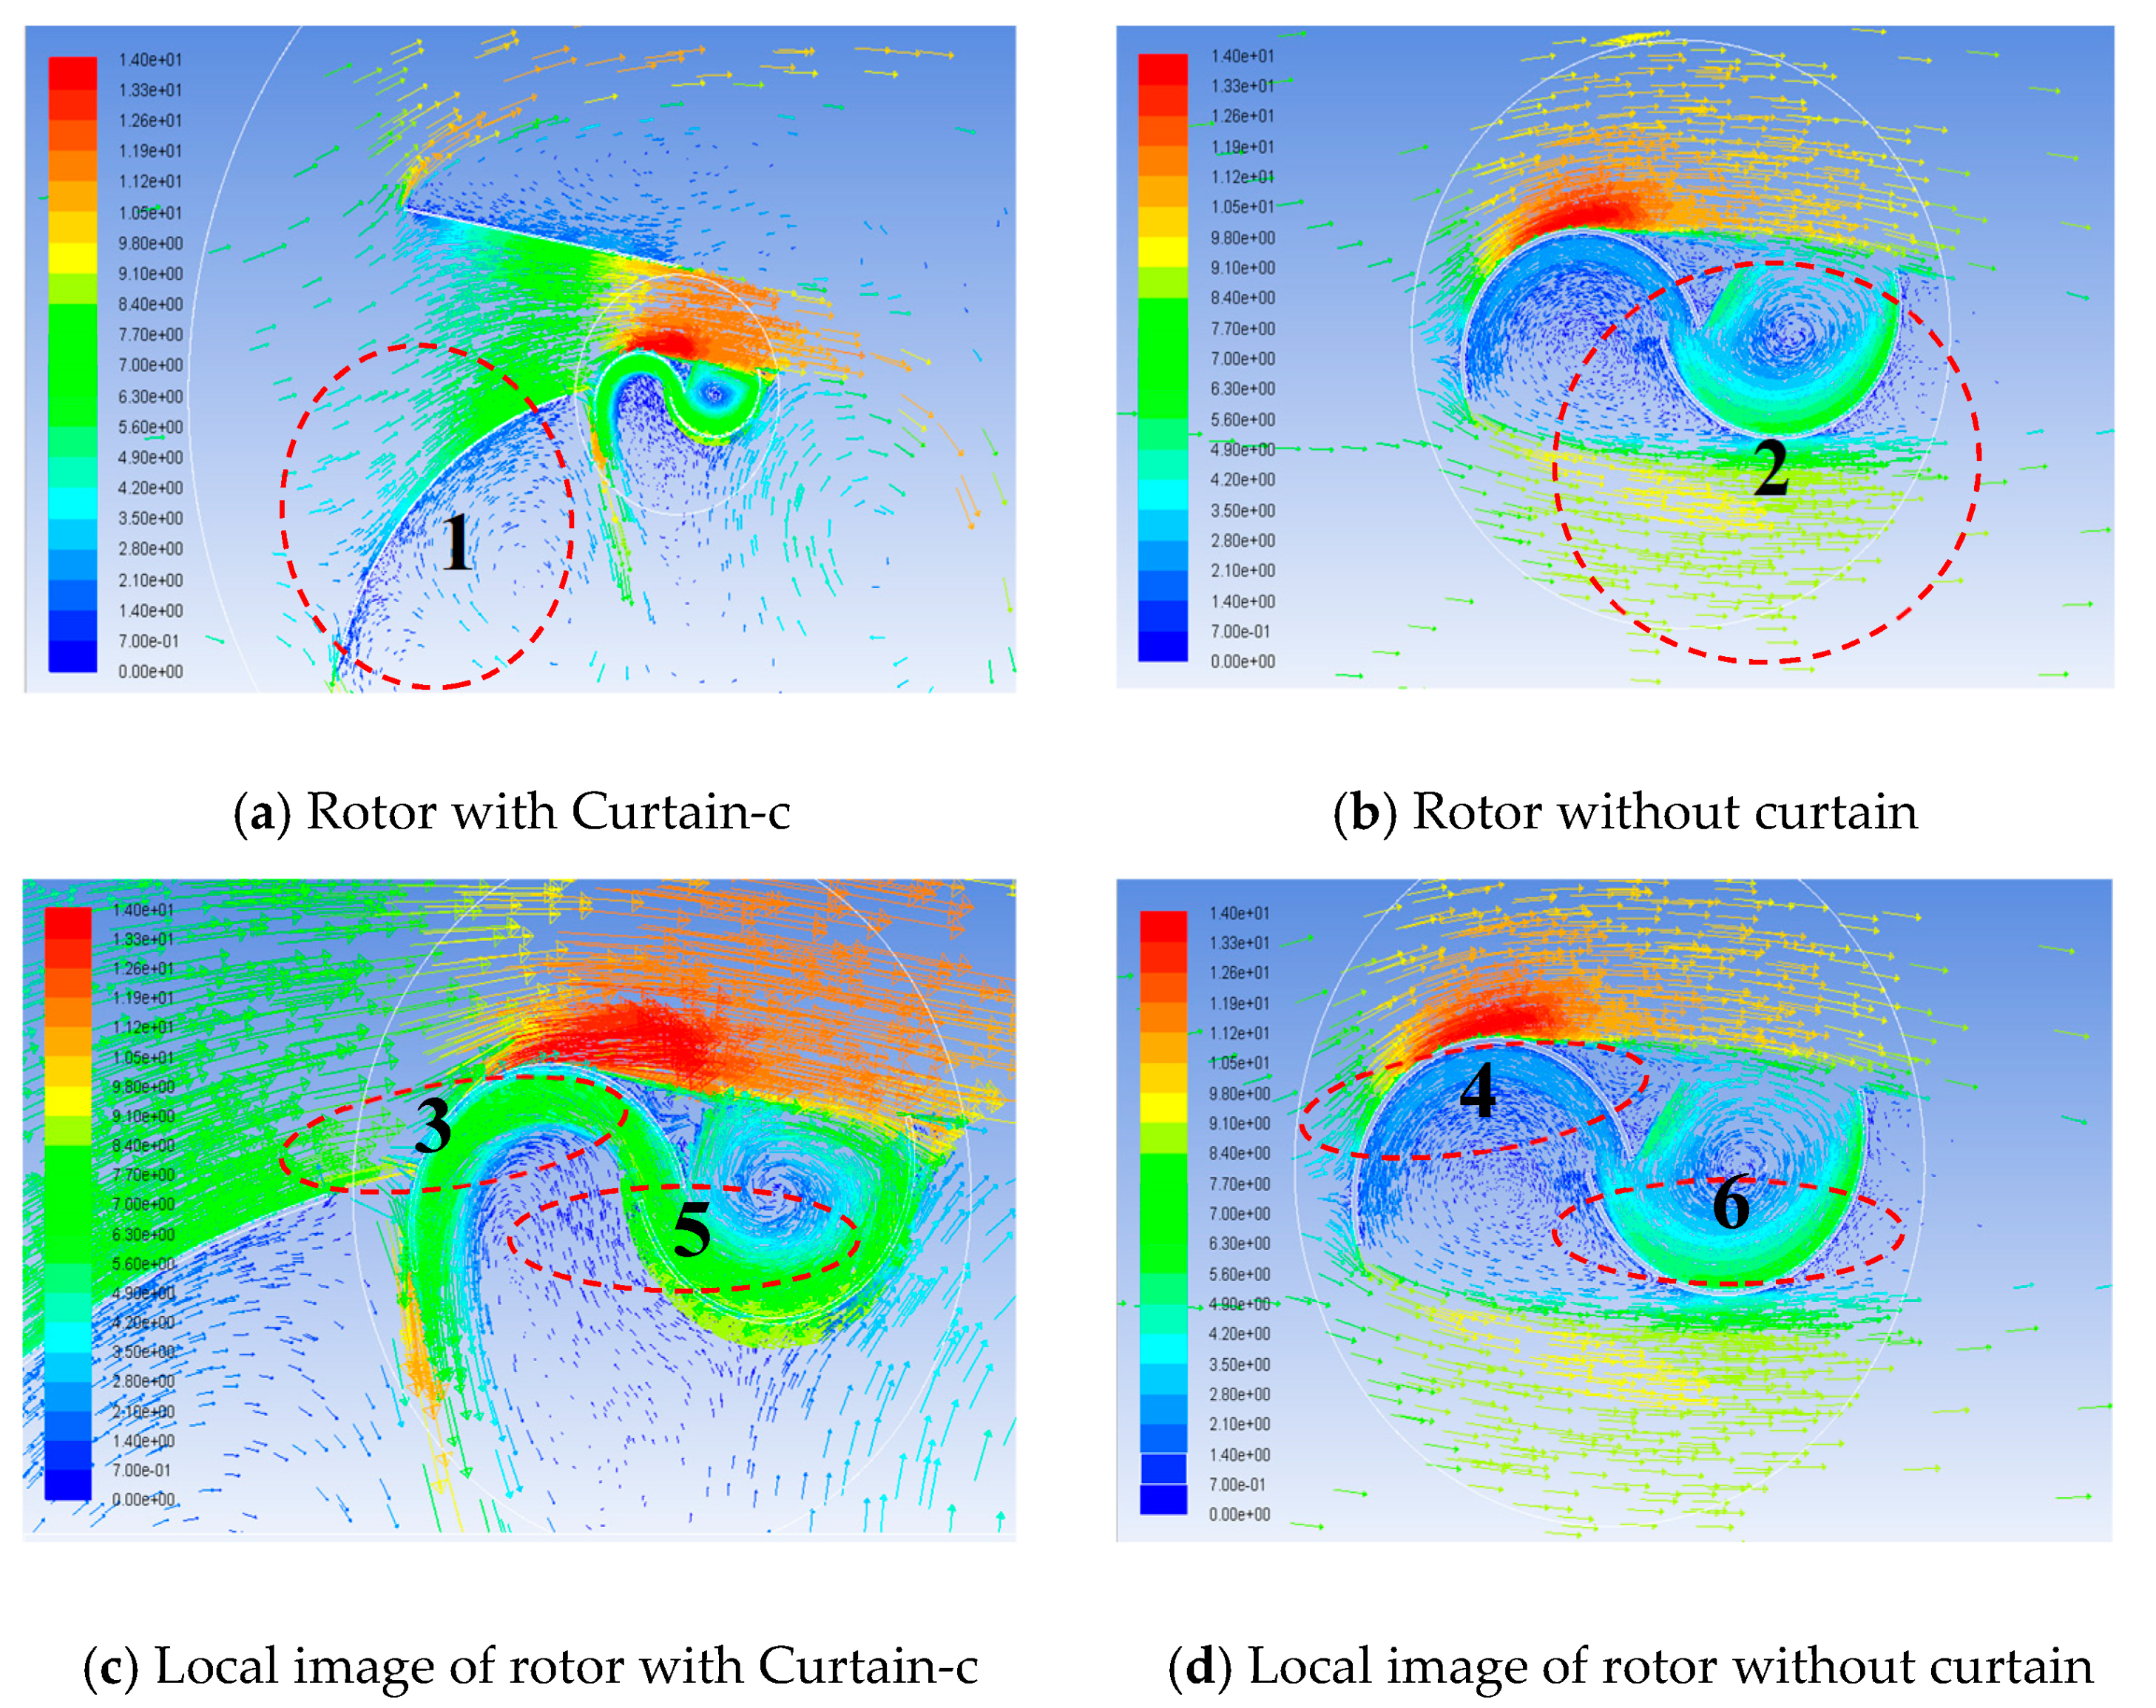
4.3. Pressure and Velocity Contours Around the Rotor

Pressure contours generated from the numerical simulation of the wind rotor with and without Curtain-c for two different angle-of-attacks are shown in Figure 19. In all cases, higher pressure values are found at the concave blade of the Savonius rotor model. A negative pressure region develops from the convex side of the blade. By comparing Figure 19a,b, it can be found that the pressure around arrow 1 is significantly lower than the pressure around arrow 2. This means that placing Curtain-c in front of the wind rotor can effectively weaken wind flow onto the convex blade and reduce the pressure at the convex side of the convex blade so as to improve the positive static torque of the convex blade. By comparing Figure 19c,d it can be found that the pressure around arrow 3 is significantly higher than that around arrow 4 and the pressure around arrow 5 is significantly lower than that around arrow 6. This means that Curtain-c can effectively promote the wind flow to the concave blade, increase the pressure at the concave side of the concave blade, and reduce the pressure at the convex side of the concave blade so as to improve the positive static torque of the concave blade. In addition, it is noteworthy that the pressure around arrow 6 is higher than that around arrow 4 and the pressure around arrow 3 is higher than that around arrow 5. This result can be used to explain why the Cst value of the wind rotor without the curtain is negative whereas with Curtain-c it is positive when the wind position is 165°.
The velocity contours generated from the numerical simulation of the wind rotor with and without Curtain-c when the wind position is 45° are shown in Figure 20a–d. The first thing that can be noticed in all the Figures is the recirculation zone on the convex side (arrow 1) of the convex blade. This means that Curtain-c can change the direction of the wind and prevent wind flow to the convex blade so as to reduce the negative torque on the convex blade. Another result present in the wind rotor with Curtain-c is the wind velocity around the wind blades, which is increased in area 3. The velocity increase in this area suggests that the positive contribution of the concave and convex blades to the overall torque is significantly increased. In addition, it should be noted that Curtain-c can harvest more of the wind that flows to the wind rotor.
Velocity contours of the wind rotor with and without Curtain-c when the wind position is 165° are shown in Figure 21.
By comparing Figure 21a,b, it can be found that Curtain-c can effectively prevent wind flow to the concave blade (area 1 and area 2). This can reduce the negative torque on the convex side of the concave blade. By comparing Figure 21c,d, it can be found that Curtain-c can effectively increase the wind velocity around the concave side (area 3) of the convex blade and the concave side (area 5) of the concave blade. The velocity increase in this area suggests that the positive contribution of the concave and convex blades to the overall torque is significantly increased.

5. Conclusions

In this study, the aerodynamic performance of the Savonius wind rotor without and with the straight-arc curtain is calculated by numerical simulations. The aim of these numerical simulations is to investigate the enhancement in the performance of the Savonius wind rotor by the arrangement of the straight-arc curtain placed in front of the wind rotor. The following conclusions can be drawn from the present study.
(1)
When the wind rotor is static, the straight-arc curtain can provide better static performance than without the curtain. The static torque values of the rotor with the curtain are always positive, which is not the case with the conventional wind rotor. In all cases, Curtain-c has the best enhancement effect.
(2)
In terms of the power coefficient, the wind rotor with Curtain-c is superior to the wind rotor without the curtain. The Cpmax value of the wind rotor is increased by about 30.3% by arranging Curtain-c in front of the rotor.
(3)
The curtain is a wind-energy harvester device, which can increase the wind flow and wind velocity around the wind rotor, thus improving the aerodynamic performance of the wind rotor.
(4)
The curtain can prevent wind flow to the convex blade and increase the positive contribution of the concave and convex blades to the overall torque.

Author Contributions

Conceptualization, H.Z. and D.X.; data curation, H.Z. and D.X.; formal analysis, H.Z.; methodology, H.Z.; software, H.Z. and J.Z.; validation, H.Z. and Z.L.; writing—original draft, H.Z.; visualization, Z.L.; investigation, Z.L. and J.Z.; funding acquisition, D.X.; project administration, D.X.; resources, D.X.; supervision, D.X.; writing—review & editing, D.X. All authors have read and agreed to the published version of the manuscript.

Funding

This research was funded by the National Natural Science Foundation of China (Grant No. 51908107 and Grant No. 51878131) and the Fundamental Research Funds for the Central Universities (Grant No. 2572018BJ07).

Conflicts of Interest

The authors declare no conflict of interest.

References

  1. Altan, B.D.; Atılgan, M. The use of a curtain design to increase the performance level of a Savonius wind rotors. Renew. Energy 2010, 35, 821–829. [Google Scholar] [CrossRef]
  2. Altan, B.D.; Atılgan, M. An experimental and numerical study on the improvement of the performance of Savonius wind rotor. Energy Convers. Manag. 2008, 49, 3425–3432. [Google Scholar] [CrossRef]
  3. Roy, S.; Saha, U.K. Review on the numerical investigations into the design and development of Savonius wind rotors. Renew. Sustain. Energy Rev. 2013, 24, 73–83. [Google Scholar] [CrossRef]
  4. Tabassum, S.A.; Probert, S.D. Vertical-axis wind turbine: A modified design. Appl. Energy 1987, 28, 59–67. [Google Scholar] [CrossRef]
  5. Akwa, J.V.; Vielmo, H.A.; Petry, A.P. A review on the performance of Savonius wind turbines. Renew. Sustain. Energy Rev. 2012, 16, 3054–3064. [Google Scholar] [CrossRef]
  6. Lee, J.H.; Lee, Y.T.; Lim, H.C. Effect of twist angle on the performance of Savonius wind turbine. Renew. Energy 2016, 89, 231–244. [Google Scholar] [CrossRef]
  7. Savonius, S.J. The S-rotor and its applications. Mech. Eng. 1931, 53, 333–338. [Google Scholar]
  8. Grinspan, A.S.; Saha, U.K.; Mahanta, P.; Saha, U.K.; Rao, D.R.; Bhanu, G.V. Design development and testing of Savonius wind turbine rotor with twisted blades. In Proceedings of the 28th National Conference on Fluid Mechanics and Fluid Power, Chandigarh, India, 13–15 December 2001; pp. 428–431. [Google Scholar]
  9. Zhou, T.; Rempfer, D. Numerical study of detailed flow field and performance of savonius wind turbines. Renew. Energy 2013, 51, 373–381. [Google Scholar] [CrossRef]
  10. Pope, K.; Dincer, I.; Naterer, G.F. Energy and exergy efficiency comparison of horizontal and vertical axis wind turbines. Renew. Energy 2010, 35, 2102–2113. [Google Scholar] [CrossRef]
  11. Shigetomi, A.; Murai, Y.; Tasaka, Y.; Takeda, Y. Interactive flow field around two Savonius turbines. Renew. Energy 2011, 36, 536–545. [Google Scholar] [CrossRef]
  12. Eldridge, F.R. Wind Machines; Van Nostrand Reinhold Co.: New York, NK, USA, 1980. [Google Scholar]
  13. Fujisawa, N. On the torque mechanism of Savonius rotors. J. Wind Eng. Ind. Aerodyn. 1992, 40, 277–292. [Google Scholar] [CrossRef]
  14. Fujisawa, N.; Gotoh, F. Experimental study on the aerodynamic performance of a Savonius rotor. J. Sol. Energy Eng. 1994, 116, 148–152. [Google Scholar] [CrossRef]
  15. Kamoji, M.A.; Kedare, S.B.; Prabhu, S.V. Experimental investigations on single stage, two stage and three stage conventional Savonius rotor. Int. J. Energy Res. 2008, 32, 877–895. [Google Scholar] [CrossRef]
  16. Gupta, R.; Biswas, A.; Sharma, K.K. Comparative study of a three-bucket Savonius rotor with a combined three-bucket Savonius-three-bladed Darrieus rotor. Renew. Energy 2008, 33, 1974–1981. [Google Scholar] [CrossRef]
  17. Mahmoud, N.H.; El-Haroun, A.A.; Wahba, E.; Nasef, M.H. An experimental study on improvement of Savonius rotor performance. Alex. Eng. J. 2012, 51, 19–25. [Google Scholar] [CrossRef] [Green Version]
  18. Wenehenubun, F.; Saputra, A.; Sutanto, H. An Experimental Study on the Performance of Savonius Wind Turbines Related with the Number of Blades. Energy Procedia 2015, 68, 297–304. [Google Scholar] [CrossRef] [Green Version]
  19. Tartuferi, M.; D’Alessandro, V.; Montelpare, S.; Ricci, R. Enhancement of Savonius wind rotor aerodynamic performance: A computational study of new blade shapes and curtain systems. Energy 2015, 79, 371–384. [Google Scholar] [CrossRef]
  20. Youssef, K.M.; El Kholy, A.M.; Hamed, A.M.; Mahmoud, N.A.; El Baz, A.M.; Mohamed, T.A. An innovative augmentation technique of savonius wind turbine performance. Wind Eng. 2019, 44, 93–112. [Google Scholar] [CrossRef]
  21. Twidell, J.W.; Weir, A.D. Renewable Energy Resources; Routledge: Abingdon, UK, 1986. [Google Scholar]
  22. Akwa, J.V.; da Silva Júnior, G.A.; Petry, A.P. Discussion on the verification of the overlap ratio influence on performance coefficients of a Savonius wind rotor using computational fluid dynamics. Renew. Energy 2012, 38, 141–149. [Google Scholar] [CrossRef]
  23. El-Askary, W.A.; Nasef, M.H.; Abdel-Hamid, A.A.; Gad, H.E. Harvesting wind energy for improving performance of Savonius rotor. J. Wind Eng. Ind. Aerodyn. 2015, 139, 8–15. [Google Scholar] [CrossRef]
Figure 1. Working principle of the conventional Savonius wind rotor.
Applsci 10 07216 g001
Figure 2. Working principle of the straight–arc curtain.
Applsci 10 07216 g002
Figure 3. Geometric parameters and schematic of the wind rotor.
Applsci 10 07216 g003
Figure 4. Shape and the geometric parameters of the straight-arc curtain (θ = 90°).
Applsci 10 07216 g004
Figure 5. (a) wind rotor and the curtain; (b) torque meter.
Applsci 10 07216 g005
Figure 6. (a) Calculation domain without the curtain; (b) calculation domain with the curtain; (c) the calculation domain with the curtain.
Applsci 10 07216 g006
Figure 7. (a) Overview of the calculation domain; (b) local image near the interface; (c) boundary layer mesh of the rotor.
Applsci 10 07216 g007
Figure 8. Variation of the static torque coefficient (Cst) with different refinement levels.
Applsci 10 07216 g008
Figure 9. Variation of the power coefficient with the TSR.
Applsci 10 07216 g009
Figure 10. Static torque coefficients of (a) Curtain-a, (b) Curtain-b and (c) Curtain-c (θ = 45°).
Applsci 10 07216 g010aApplsci 10 07216 g010b
Figure 11. Static torque coefficients for different curtains (θ = 45°).
Applsci 10 07216 g011
Figure 12. Static torque coefficients of (a) Curtain-a, (b) Curtain-b and (c) Curtain-c (θ = 60°).
Applsci 10 07216 g012
Figure 13. Static torque coefficients for different curtains (θ = 60°).
Applsci 10 07216 g013
Figure 14. Static torque coefficients of (a) Curtain-a, (b) Curtain-b and (c) Curtain-c (θ = 150°).
Applsci 10 07216 g014
Figure 15. Static torque coefficients for different parameters (θ = 150°).
Applsci 10 07216 g015
Figure 16. Static torque coefficients of (a) Curtain-a, (b) Curtain-b and (c) Curtain-c (θ = 165°).
Applsci 10 07216 g016
Figure 17. Static torque coefficients for different parameters (θ = 165°).
Applsci 10 07216 g017
Figure 18. Variation of the power coefficient with the TSR for (a) Curtain-a, (b) Curtain-b (c) Curtain-c as well as the (d) comparison of the three curtains (U = 10 m/s).
Applsci 10 07216 g018aApplsci 10 07216 g018b
Figure 19. Pressure contours of the wind rotor with Curtain-c at (a) θ = 45°, (c) θ = 45°and without Curtain-c at (b) θ = 165°, (d) θ = 165°.
Applsci 10 07216 g019
Figure 20. Comparison of the velocity contours for the wind rotor (a) with Curtain-c, (b) without the curtain and their corresponding local images (c,d) at θ = 45°.
Applsci 10 07216 g020
Figure 21. Comparison of the velocity contours for the wind rotor (a) with Curtain-c, (b) without the curtain and their corresponding local images (c,d) at θ = 165°.
Applsci 10 07216 g021
Table 1. The parameters of the curtain.
Type of CurtainL1 (mm)R (mm)φ (rad)L2 (mm)
Curtain-a340400π/6210
Curtain-bπ/4314
Curtain-cπ/3419
Table 2. List of simulated operating points of the numerical simulation.
Type of Curtainθαβ
No curtain45°, 60°, 150°, 165°--
Curtain-a10°, 15°, 20°0°, 15°, 30°
Curtain-b
Curtain-c
Table 3. Grid independence test.
Refinement LevelNumber of ElementsU(m/s)CstError (%)
1136,86510 0.392140.04
2154,2380.348024.29
3181,5110.327116.82
4196,6880.29956.964
5245,9740.29394.964
6274,0760.29284.571
7317,0480.29304.642
8332,8020.29294.607
Experimental results0.280
Publisher’s Note: MDPI stays neutral with regard to jurisdictional claims in published maps and institutional affiliations.

