Abstract
International standards discourage the use of grouted anchors with a fixed length exceeding 10 m. However, grouted anchors with a fixed length between 10 and 20 m are frequently used in Italy to transfer high loads to ground with poor geotechnical properties. This paper presents the results of investigation tests on an anchor with a length of 36 m, of which 18 m is fixed, sloping 40° from the horizontal; the anchor is comprised of a reinforced thread-bar which was instrumented with strain gauges and founded in nonhomogeneous ground, a sand deposit followed by marly clay. The test aimed at investigating the progressive mobilization of the shear strength along the foundation. The results indicate a very low shear strength offered by the sand, probably disturbed by the drilling, and an unusually fast mobilization of the shear strength in the marly clay at the deep end of the anchor. The results are particularly useful to identify the reasons for the observed poor performance of the grouted anchor. In particular, the study once again made it clear how important the influence of the execution details on reaching the expected load capacity may be, and likewise the practice of investigation tests on suitably instrumented test anchors.
1. Introduction
Grouted anchors in soils are common geotechnical structures able to transfer tensile load to the soil. They are used to ensure the stability of retaining walls, quays, dam foundations, bridge abutments and underground excavations.
As clearly pointed out in PTI (2014) [1], the performance of a grouted anchor depends on several aspects, the most relevant of which are the methods of drilling, flushing and cleaning the drill hole, soil properties, overburden pressure, hole diameter, grouting methods and number of post-grouting cycles. The importance of the details on the behavior of these geotechnical structures is clearly indicated by the results of investigations on failures that occurred in some cases (Littlejohn and Mothersille, 2008 [2]; Ruggeri et al., 2013 [3]). For these reasons, common practice and standards require testing of all ground anchors before going to service.
Eurocode 7 part 3 (prEN1997-3), EN 1537:2013 and ISO 22477-5:2018, the three coordinated standards respectively assessing the design, execution and testing of grouted anchors in Europe, establish three types of test: investigation tests, suitability tests and acceptance tests. All these tests are oriented to evaluate the global performance of the anchors by making external measurements (e.g., applied force, elongations, creep). In particular, the investigation test is a load test aimed at evaluating the geotechnical ultimate resistance of the anchor and its behavior at working loads.
Despite the widespread use of ground anchors, not many studies have investigated the behavior of such specific geotechnical structures. In particular, not many works have focused on the direct measurements of the tensile stress along the fixed length of the anchors, so that the well-known works of Ostermayer (1975) [4], Ostermayer and Scheele (1978) [5] and Bustamante and Doix (1985) [6] still represent the reference literature for this field. Recently, the development of the fiber optic technology allowed some detailed measurements of the strain distribution along the entire bar. Iten and Puzrin, 2010 [7]; Huang et al., 2013 [8]; Zeni et al., 2015 [9] and Smet et al. (2019) [10] provided interesting analysis of fiber optic strain measurements during load tests on grouted anchors. It is worth noting that most of the monitored anchors had a short fixed length, usually not exceeding 10 m. This choice agrees with many recommendations that suggest limiting the fixed length of the anchor to avoid possible progressive failure phenomena due to the highly non-uniform mobilization of bond stress along the foundation length (Barley, 1997 [11]; Woods and Barkhordari, 1997 [12]). Precisely, such a non-uniform stress distribution corresponds to a progressively decreasing bond-strength with the increasing of the foundation length, along which the peak strength cannot be attained simultaneously. However, anchors with a fixed length between 10 and 20 m are frequently used when soils with low geotechnical properties are encountered, or high design loads have to be sustained. For example, to our experience, many quays of the Ravenna port (Italy) built between 20 and 40 years ago consist of anchored retaining walls with a fixed length of the anchors typically exceeding 15 m (Ruggeri et al., 2019 [13]; Ruggeri et al., 2020 [14]). All these anchors were designed by assuming a uniform shear strength along the bonded length; such structures are found to be fully operational even after decades of severe usage. Such a good performance of the anchors could possibly be related to a more uniform stress distribution along their fixed length, as observed in Sabatini et al. (1999) [15] in weak rock and loose soil. Indeed, Coates and Yu (1970) [16], by studying stress distribution around a cylindrical anchorage in triaxial stress field using finite element methods, observed that non-uniform bond stress distribution is relevant when the ratio of the elastic modulus of the anchor material (EA) and the rock (ER) is less than 10 (EA/ER < 10), as commonly is the case for anchors in rocks. So far, the influence of such a stiffness ratio for grouted anchors in soils on the onset of progressive failure has not been thoroughly investigated in the literature.
The monitoring of the strains along a grouted anchor with a bond length exceeding 10 m could provide a better picture of the soil–structure interaction in situations that have been rarely investigated in the past, but are widely diffused in practice.
This paper presents the results of one investigation test carried out on a high capacity thread-bar grouted anchor, characterized by a bond length equal to 18 m and instrumented with strain gauges along the foundation length. Thanks to these data, two aspects of the test were highlighted and examined: the progressive mobilization of the shear strength along the anchor and the observed low capacity at low pull-out.
2. Materials and Methods
2.1. Site Description
The site of interest is located in the port of Ancona, Italy. There, to upgrade an old gravity quay wall to more demanding operative requirements, the designer opted to abandon the existing structure and to re-build a new quay by encapsulating the old structure in a new structure. The new quay, 200 m long, includes a concrete slab 1.0 m thick founded on 4 rows of large diameter bored piles, three of which are placed behind the existing wall and one seaward, adjacent to the current edge of the quay. To provide adequate resistance to horizontal loads (i.e., mooring loads and seismic actions), a row of high capacity grouted anchors links the top concrete slab to the deep bearing ground.
A borehole in the apron (see the borehole log in Figure 1) indicated that below the pavement, a backfill constituted of loose silty sand is found up to the original seabed, located at about 8.0 m below sea level. A layer of 3.0 m of soft sandy silt is then encountered above a thick layer of dense sand. At a depth varying from 15.0 to 24.0 m below sea level, bedrock is found, made of over-consolidated marly clay. The foundation of the anchor mainly falls in dense sand but, where the sand deposit becomes thinner, the anchor foundation involves the overconsolidated clay deposit. Reference values of the geotechnical properties for the foundations soils in terms of soil unit weight (γ), effective cohesion (c′), effective friction angle (φ′) and Young modulus (E′25,—i.e., the secant modulus at 25% of the maximum deviatoric stress) are considered: for dense fine sand: γ = 18.5 kN/m3, φ′ = 39°, E′ = 40 MPa; for over-consolidated clay: γ = 20 kN/m3, c′ = 30–50 kPa and φ′ = 26°, E′ = 70–100 MPa.
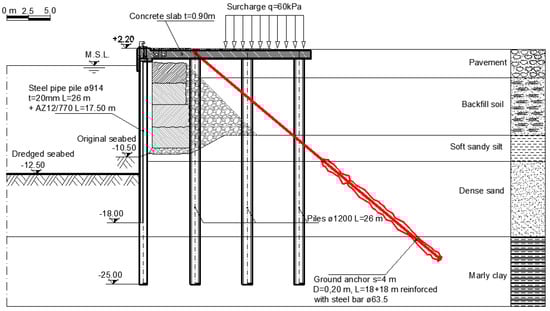
Figure 1.
Cross-section of the quay with the upgrading work. Note the location of the ground anchor (modified from [13]).
The reference vertical cross-section of the structure in the zone where the investigated anchor is located is sketched in Figure 1. Note that in this particular cross section, the foundation of the ground anchor extends through both the dense sand and the marly clay deposits.
2.2. Installation of the Ground Anchor
The test anchor was built with the same geometrical and structural characteristics of the working ones. It slopes 40° to horizontal, has a total length of 36 m with 18 m of free length and 18 m of bonded length. It is made of a fully threated Gewi steel bar, 63.5 mm diameter, with a yield load of 1758 kN and ultimate resistance of 2217 kN.
The test anchor was instrumented with 12 welded vibrating-wire strain gauges to allow the monitoring of the load-transfer process. For redundancy, two mutually opposite strain-gauges were welded at each position, so that the deformations were detected at 6 different locations along the anchor. In Figure 2, two pictures showing the installation process of a pair of strain-gauges on the bar are shown. Note that after welding, the sensors were encapsulated by a protection cover to avoid damage during installation into the borehole’s casing.
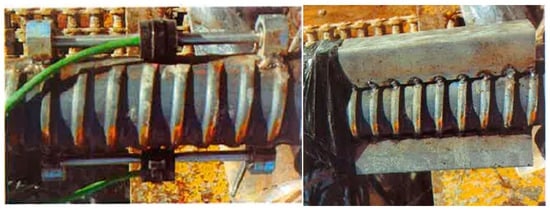
Figure 2.
Picture of a pair of strain-gouges welded on the bar in mutually opposite position and detail of the cover plate adopted to protect the sensors.
The chosen strain gauges, manufactured by Gestecno (Gestecno S.r.l., Castelraimondo, Italy), have a measurements range of 3000 με, an average resolution of 1 με, a working temperature between −20 and +60 °C, an active gauge length of 153 mm, external dimensions of 165 × 25 × 25 mm and a gauge factor equal to 3.618 × 10⁻³ με/Hz2.
As shown in Figure 3, 2 strain-gauges were placed in the middle of the free length segment and 10 in the fixed length segment of the anchor. Moreover, a toroidal load cell at the head provides the actual value of the applied force. The soil stratigraphy recorded for the tested anchor indicates that of the 18 m of fixed length, 14 m are in the dense fine sand and 4 m are in the marly-clay deposits.
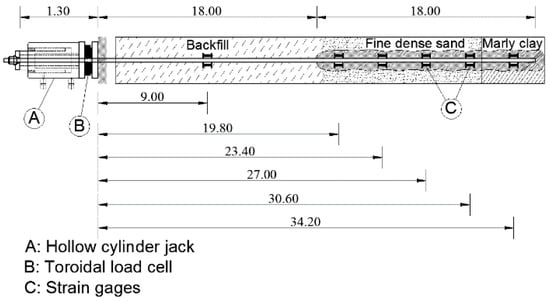
Figure 3.
Setup of the instrumented anchor subjected to loading test.
Because the test anchor had a temporary and experimental purpose, no corrosion protection was provided. In addition, differently from working anchors, the free length of the bar for the tested anchors was not encased in a debonding sleeve. This was imposed by the lack of free space between the borehole casing and the bar for the heavy wiring of the strain-gauges.
A casing was necessary for the entire borehole length. Two different casing diameters were used: 220 mm for the 18 m free length and 178 mm for the bonded length.
A post-grouting injection was also planned but it could not be carried out due to difficulties of the opening of the manchette valves. Therefore, the preliminary test was carried out on an anchor with the primary grouting only.
The grout used for the injection has a water/cement ratio equal to 0.45; a free flow grout additive was also used. The effective length of the anchor foundation is relevant for assessing the performance of the system and it should be as compliant as possible with the designed length. However, it is practically impossible to evaluate the real volume of the drilling cylinder. Recommendations suggest setting the injected volume of the grout between the nominal volume and 1.5 times the nominal volume of the fixed length segment, depending on the soil and drilling technology. For the considered anchor, 0.70 m3 of grout was injected, corresponding to 1.5 times the nominal volume of the foundation cylindrical segment.
Note that an excess of the injected grout volume could produce a foundation segment in the backfill and the consequent reduction in the anchor free length. However, the very poor geotechnical properties of the backfill ensure that the above shortcomings could not significantly affect the pull-out test response.
2.3. Load Test
The load test of the anchor was carried out more than one month after grouting. During the test, readings of the actual load and of the axial end displacement were taken, the latter by means of a plunger dial indicator with an accuracy of 0.01 mm and a stable reference system.
The test was executed following the Test method 3 of ISO 22477-5:2018; that is, a maintained tension test was performed. The procedure implies a stepwise increase in the tensile force applied at the anchor head up to a maximum load Pp, corresponding to failure at the ground–grout interface. Each load was kept constant for 15 min because creep is not an issue for the specific foundation soils. In addition to external monitoring of the load-displacement response, readouts of the strain gauges were continuously taken and recorded at each loading step using a data acquisition system. The maximum load Pp was set to 1800 kN, relatively close to the yield limit of the steel bar. An alignment load Pa = 70 kN was applied at the beginning of the test to keep the testing equipment correctly positioned. Then, some load cycles with the following steps were planned: 0.25-0.40-0.55-0.70-0.85-1.00 of Pp for loading; 0.85-0.70-0.40-0.10 of Pp for unloading. However, due to the early reaching of the pull-out force, not all of the planned loading cycles could be followed.
3. Results
The results of the loading test were analyzed in terms of head displacement response and load distribution along the anchor.
3.1. Head Displacement Response
Head displacement response of the anchor is presented in Figure 4. It is possible to note the quasi-elastic response of the anchor during the first three loading steps, and that failure suddenly appeared at the anchor load slightly above 1000 kN. The anchor was then unloaded to 480 kN and again loaded up to failure. During unloading, the anchor response was slightly stiffer than for loading. At reloading, the force displacement pattern perfectly matched the unloading path in the first loading step, but with the load increase in the second step, a clear reduction in the stiffness was observed, thus indicating the occurrence of the irreversible response of the anchor and the reaching of a failure condition. Indeed, a load equal to 920 kN could yet be sustained by the anchor, but with the subsequent loading step, failure occurred. It is worth noting that the maximum load of the second cycle, equal to 920 kN, does not differ significantly from the load of 976 kN of the first cycle below which a quasi-elastic response of the anchor could be observed.
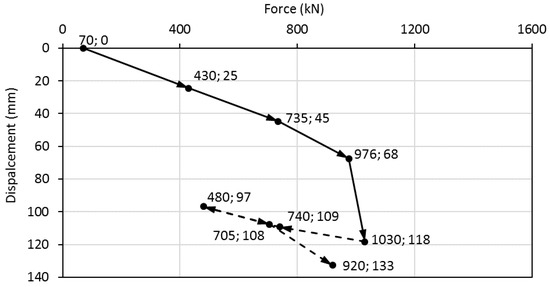
Figure 4.
Displacement of anchor head as function of axial force during load test.
3.2. Strain Readings during Loading Test
The strain readings during the anchor test are presented in Figure 5 for all the installed strain gauges. Note that the sensors positioned at 19.8 and 23.4 m from the head gave odd values and their readings were not considered reliable for the analysis. Nevertheless, it was observed that all readings were within the operational range of the sensors.
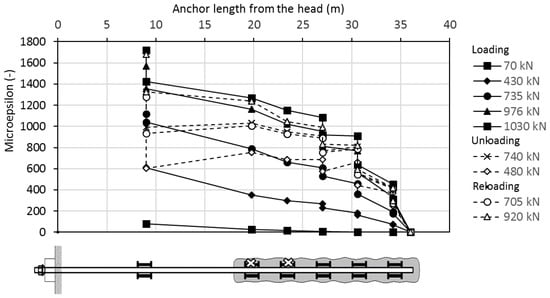
Figure 5.
Strain readings during loading test.
Because some pairs of sensors exhibit a non-negligible difference between their respective readings, the average reading for each pair of strain-gauges was always assumed.
4. Discussion
The results of the load test were used to evaluate the apparent free length of the anchor, the load distribution along the bar, the shear strength mobilization along the foundation and the corresponding transfer curves.
4.1. Evaluation of the Apparent Free Length
The unloading portion of the graph allowed us to estimate the apparent free length (Lapp), which is the length of the tendon which is fully decoupled from the surrounding grout, after failure. As suggested in ISO 22477-5:2018, the following expression is applied:
where At and Et are the cross section and elastic modulus of the tendon and Δs is the elongation corresponding to the load increment ΔF.
According to (1), the post-failure apparent length of the tested anchor is equal to 27 m, which is slightly less than the distance between the head and the foundation half; such a length is compliant with the upper limit suggested in EN 1537:2013.
4.2. Load Distribution during Tests
The strain gauge measurements gave the strain distribution along the thread-bar during each loading step of the loading test. By knowing the gauge factor of the devices, the area of the bar and the Young modulus of the steel, it is possible to turn the strains into the tensile load along the anchor. In Figure 6, the load distribution along the anchor is presented for the different loads applied at the head, which was directly measured by a load cell. Note that the load increase apparent at 9 m from the head during the first loading cycle is due to experimental error, as the load along the bar cannot be greater than the applied load. However, such behavior is admissible after unloading and reloading, due to the redistribution of mobilized shear stress along the ground–anchor interface.
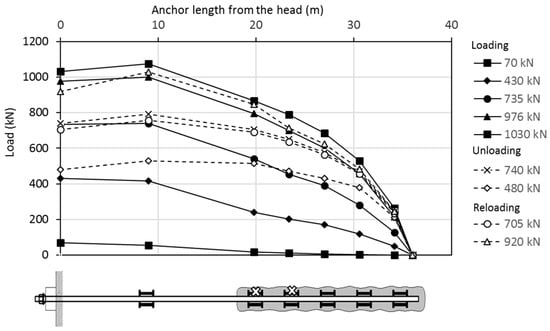
Figure 6.
Distribution of the tensile force along anchor T1.
By observing the continuous curves of the first loading cycle in Figure 6, it is fairly clear that at the middle of the free length (i.e., 9 m from the anchor head) the load is close to the applied load, confirming the absence of any bond between the bar and the soil along the free length. Moving from the first to the second device, at about 20 m from the anchor head, the load reduces, thus indicating that a fraction of the load has been transferred to the ground. Moving further along the anchor, the progression of the load transfer to the ground is clearly shown by the load–distribution curves at any load step.
The slope of the load–distribution curves represents the rate at which the load is transferred from the anchor to the ground. Slope trends suggest an almost homogeneous collaboration of the entire foundation at the low loads, while the load transfer becomes more effective in the deepest part of the foundation as the applied load increases.
It is interesting to observe the differences in the load distributions for unloading and reloading steps. By focusing on the curve representing the unloading step at 480 kN, it appears that for a long segment of the foundation, there is not any load transfer to the ground so that the major part of the reaction takes place between 30 to 36 from the head. A more uniform load transfer occurs along the anchor foundation only when higher reloading values are reached (see curves at 705 and 920 kN), so that even the initial foundation segment is involved in the load transfer process.
4.3. Shear Strength Mobilization
From the load change between two adjacent pairs, an estimate of the mean value of the mobilized shear strength at the ground–grouted body interface can be estimated by assuming the side area of the grouted body as the nominal; that is, the side area of a cylinder with diameter equal to the nominal drilling diameter. These values are shown in Figure 7. It can be observed that with increasing load, the shear strength is mobilized over the entire fixed length and that, already from the second loading step and up to pull-out, the segment of the foundation in marly clay mobilizes the greatest shear strength values. The maximum strength mobilized along the sand segment ranges from 50 to 100 kPa, while values up to 250 kPa are obtained for the marly clay. Note that the skin friction estimated for the last segment of the anchor foundation could have been overestimated if the real length of the foundation was larger than the bar length. Indeed, a slight overlength of the drilling hole is always needed for execution to allow the correct positioning of the bar. It is thus possible that some decimeters of foundation beyond the anchor tip could react together with the last segment of the bar, determining an increase in the available shaft area not considered in the evaluation of the mobilized skin friction. In any case, all the observed limit values are well below the values given by Ostermayer and Scheele (1978) [5] from their experiments and even below the values suggested by Bustamante and Doix (1985) [6] for anchors and micropiles, usually believed the more conservative ones. The graphs suggested by these last two authors, very popular among practitioners in Italy, allow a shear strength higher than 200 kPa both for dense sands and marly clay.
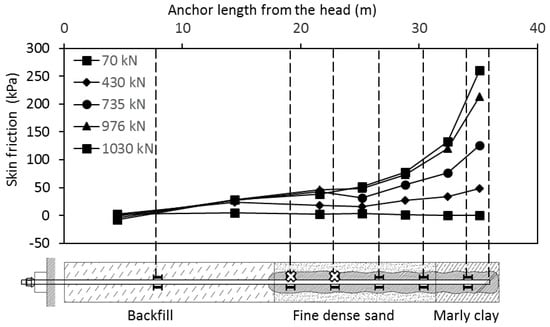
Figure 7.
Distribution of skin friction in the soil/grout interface along the anchor T1.
In conclusion, the very poor performance of the tested anchor was evident. In addition, the mobilization of the shear strength along the whole foundation of the anchor with activation of the deepest segments from the early loading steps was unusual, as was the absence of any strain-softening for the interface segment in the sand stratum.
4.4. Evaluation of the Transfer Curves
The monitoring of local strains allowed the evaluation of the transfer curves of the shear resistance along the bonded length of the anchor, at any loading step. These curves are plotted in Figure 8 in terms of shear strength normalized with the peak shear strength versus local displacements in the percentage of the grouted body nominal diameter.
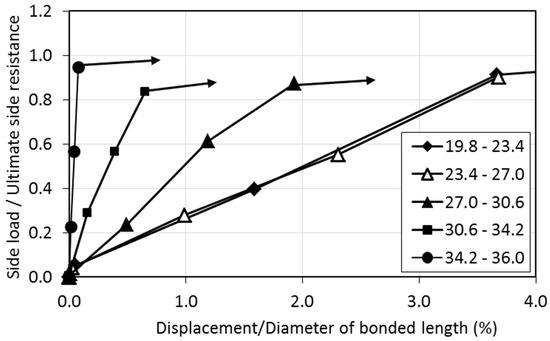
Figure 8.
Transfer curves of side resistance for 5 segments of the bonded length of anchor T1.
The significant increase in the stiffness along the foundation from the shallower to the deeper locations can be clearly observed from the transfer curves, a behavior that reflects the fast mobilization of the shear strength in the deepest soil strata. Moreover, all the transfer curves are mostly linear up to the pull-out, and no strain-softening can be observed before the failure.
Present transfer curves are compared in Figure 9 with the typical transfer curves of bored piles in clay and in sand proposed by O’Neill and Reese (1999) [17]. Such comparison is presented separately for the segments embedded in the sand deposit and in the marly clay. The extremely low stiffness of the transfer curves in sands emerges clearly, while an acceptable agreement between typical and observed transfer curves in marly clay is found.
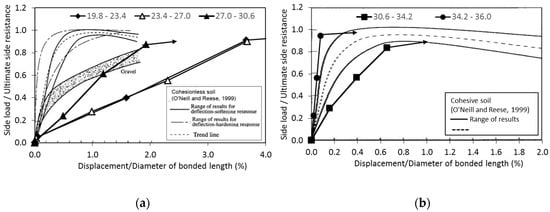
Figure 9.
Comparison between obtained transfer curves of anchor T1 and typical transfer curves of side resistance for (a) granular and (b) fine soils.
4.5. Lesson Learnt from the Investigation Test Results
The rare opportunity to have local strain measurements along the anchor thread-bar allowed an explanation of the anchor performance below the expectation.
In particular, the analysis of the local measurements pointed out two aspects:
- the segment of the foundation in sand did not perform well;
- shear strength mobilization along the foundation of the anchor was unusual for a tension grouted anchor.
The shear strength mobilized in sand was anomalous not only in terms of its limit value (less than 1/3 of the expected) but also in terms of the very low stiffness and absence of a peak in the load transfer curves. These results are in contrast with the geotechnical properties of the deposit and have to be related with the construction process. It has already been indicated that the planned post-grouting injection could not be executed due to the very quick concrete hardening that impeded the opening of the manchette valves. This fact could explain the low limit skin friction, but cannot justify the very soft behavior shown by the transfer curves. It seems possible to relate this behavior to the decay of the original density of the sand around the borehole, due to the use of air flushing during the drilling operations.
Moreover, the local measurements revealed a particular distribution of the shear strength along the foundation. Different from expected, the shear strength mobilization was very significant at the deep end of the grouted body, probably due to the minor installation damage suffered by the marly clay in comparison with the sand. In summary, the relatively high stiffness and resistance of the grout–marly clay interface and the very low stiffness and resistance of the grout–sand interface caused an unusual progression of the skin friction mobilization with a large amount of the tensile load quickly transferred to the deeper stratum. It is interesting to note that this load-transfer distribution resembles that observed by Kim (2003) [18] for the so-called compression anchors, which are anchors in which the tendon is bonded to the soil only in its deeper segment.
The information collected by carrying out an investigation test on an instrumented anchor allowed us to fulfill design requirements by adapting the technological process. In particular:
- taking into account the susceptibility of the dense sand to the use of air, the entire drilling of the working anchors was executed by using water flush only;
- the post-grouted injection was always executed within 6–8 h from the completion of the primary injection, so that a large part of the manchettes valves opened and allowed a correct execution of the high-pressure injection.
Moreover, some general conclusions can be outlined from such testing:
- the high stiffness of the bar compared with the soil stiffness properties allowed a rapid mobilization of the shear strain along the entire foundation, so that a progressive failure of the foundation does not apply for the examined anchor;
- the presence of a layered soil deposit in which the deep soils are stiffer than the shallow ones does not allow the progressive transfer of the anchor loads to the ground, as should occur with long anchor foundations.
5. Conclusions
Grouted anchors are geotechnical structures that are very efficient for transferring tension loads to soil. However, their performance depends on several construction details which are very difficult to anticipate by the designer. The provision of international standards prescribing the use of investigation tests to define construction details and of suitability/acceptance tests to check the performance of the designed anchors appears particularly appropriate.
This paper, by showing the results of an investigation test on an instrumented anchor, demonstrated the usefulness of the local measurements to evaluate the real behavior of the structure, even in the case of performances well below expectations. The availability of local measurements allowed us to identify the flaws of the tested anchor so that the appropriate countermeasures could be taken for the execution of the working anchors. In particular, carrying out the post-grouted injection no later than 6–8 h after the first grouting and the use of water flush during drilling allowed the permanent anchors to carry more than 1800 kN without showing any non-linear behavior during the proof tests.
The important information collected by the local measurements along the grouted anchor foundation drives the development and diffusion of efficient monitoring systems able to catch such local response. In this sense, the optical fiber technology seems most promising and its wider use in practice should be promoted.
Author Contributions
Conceptualization, P.R.; Data curation, P.R.; Funding acquisition, G.S.; Methodology, V.M.E.F.; Supervision, G.S.; Writing—original draft, P.R.; Writing—review & editing, V.M.E.F. and G.S. All authors have read and agreed to the published version of the manuscript.
Funding
This research was funded by Università Politecnica delle Marche, research plan 127/2019 and by the Italian Ministry of University and Research, grant number PRIN201572YTLA_005.
Acknowledgments
The authors would like to thank the whole Port Authority of Ancona and the engineers Maria Letizia Vecchiotti, Silvia Pieroni and Lorenzo Leghissa in particular, for providing the technical data showed in the present paper.
Conflicts of Interest
The authors declare no conflict of interest.
References
- PTI. Recommendations for Prestressed Rock and Soil Anchors; Post-Tensioning Institute: Phoenix, AZ, USA, 2014. [Google Scholar]
- Littlejohn, S.; Mothersille, D. Maintenance and monitoring of anchorages: Guidelines. Geotech. Eng. 2008, 161, 93–106. [Google Scholar] [CrossRef][Green Version]
- Ruggeri, P.; Segato, D.; Scarpelli, G. Sheet pile quay wall safety: Investigation of posttensioned anchor failures. J. Geotech. Geoenviron. Eng. 2013, 139, 1567–1574. [Google Scholar] [CrossRef]
- Ostermayer, H. Construction, Carrying Behaviaur and Creep Characteristics of Ground Anchar. In Proceedings of the Conference on Diaphragm Walls and Anchorages, London, UK, 18–20 September 1974; pp. 141–151. [Google Scholar]
- Ostermayer, H.; Scheele, F. Research on ground anchors in non-cohesive soils. Rev. Fr. Géotech. 1978, 92–97. [Google Scholar] [CrossRef]
- Bustamante, M.; Doix, B. Une méthode pour le calcul de tirants et des micropieux injectés. In Bulletin de Liaison des Laboratoires des Ponts et Chaussées; Ministère de L’Équipement, du Logement, des Transports et de la Mer: Paris, France, 1985; pp. 75–92. (In French) [Google Scholar]
- Iten, M.; Puzrin, A.M. Monitoring of stress distribution along a ground anchor using BOTDA. In Proceedings of the Sensors and Smart Structures Technologies for Civil, Mechanical and Aerospace Systems, 27 April–8 May 2020; Volume 76415, p. 76472. [Google Scholar]
- Huang, M.; Zhou, Z.; Huang, Y.; Ou, J. A distributed self-sensing frp anchor rod with built-in optical fiber sensor. Measurement 2013, 46, 1363–1370. [Google Scholar] [CrossRef]
- Zeni, L.; Picarelli, L.; Avolio, B.; Coscetta, A.; Papa, R.; Zeni, G.; Di Maio, C.; Vassallo, R.; Minardo, A. Brillouin optical time-domain analysis for geotechnical monitoring. J. Rock Mech. Geotech. Eng. 2015, 7, 458–462. [Google Scholar] [CrossRef]
- Smet, J.; Huybrechts, N.; Van Lysebetten, G.; Verstraelen, J.; François, S. Optical fiber strain measurements and numerical modeling of load tests on grouted anchors. J. Geotech. Geoenviron. Eng. 2019, 145, 1–11. [Google Scholar] [CrossRef]
- Barley, A.D. The single bore multiple anchor system. In Proceedings of the International Conference: Ground Anchorages and Anchored Structures, London, UK, 20–21 March 1997; pp. 65–75. [Google Scholar]
- Woods, R.I.; Barkhordari, K. The influence of bond stress distribution on ground anchor design. In Proceedings of the International Conference: Ground Anchorages and Anchored Structures, London, UK, 20–21 March 1997; pp. 55–64. [Google Scholar]
- Ruggeri, P.; Fruzzetti, V.M.E.; Scarpelli, G. Renovation of quay walls to meet more demanding requirements: Italian experiences. Coast. Eng. 2019, 147, 25–33. [Google Scholar] [CrossRef]
- Ruggeri, P.; Fruzzetti, V.M.E.; Scarpelli, G. Upgrading of quay walls at the Ravenna port, Italy: Evaluation of the steel piles degradation after a long working life. Struct. Infrastruct. Eng. 2020. [Google Scholar] [CrossRef]
- Sabatini, P.J.; Pass, D.G.; Bachus, R.C. Geotechnical Engineering Circular No. 4: Ground Anchors and Anchored Systems; Rep. FHWA-IF-99-015; Office of Bridge Technology: Atlanta, GA, USA, 1999.
- Coates, D.F.; Yu, Y.S. Three dimensional stress distribution around a cylindrical hole and anchor. In Proceedings of the 2 International Conference on Rock Mechanics, Belgrade, Serbia, 21–26 September 1970; pp. 175–182. [Google Scholar]
- O’Neill, M.W.; Reese, L.C. Drilled Shafts: Construction Procedures and Design Methods; Publication FHWA-IF-99-025; FHWA: Washington, DC, USA, 1999.
- Kim, N.-K. Performance of Tension and Compression Anchors in Weathered Soil. J. Geotech. Geoenviron. Eng. 2003, 129, 1138–1150. [Google Scholar] [CrossRef]
Publisher’s Note: MDPI stays neutral with regard to jurisdictional claims in published maps and institutional affiliations. |
© 2020 by the authors. Licensee MDPI, Basel, Switzerland. This article is an open access article distributed under the terms and conditions of the Creative Commons Attribution (CC BY) license (http://creativecommons.org/licenses/by/4.0/).