Article

Computational Characterization of Microwave Planar Cutoff Probes for Non-Invasive Electron Density Measurement in Low-Temperature Plasma: Ring- and Bar-Type Cutoff Probes

1
Nanotech Optoelectronics Research Center, Yongin Gyonggi Province 16882, Korea
2
Applied Physics Lab for PLasma Engineering (APPLE), Department of Physics, Chungnam National University, Daejeon 34134, Korea
3
Korea Research Institute of Standards and Science, Daejeon 34113, Korea
4
Institute of Quantum Systems (IQS), Chungnam National University, Daejeon 34134, Korea
*
Author to whom correspondence should be addressed.
Appl. Sci. 2020, 10(20), 7066; https://doi.org/10.3390/app10207066
Submission received: 14 August 2020 / Revised: 25 September 2020 / Accepted: 28 September 2020 / Published: 12 October 2020
(This article belongs to the Special Issue Passive Planar Microwave Devices )

Abstract

:
The microwave planar cutoff probe, recently proposed by Kim et al. is designed to measure the cutoff frequency in a transmission (S21) spectrum. For real-time electron density measurement in plasma processing, three different types have been demonstrated: point-type, ring-type (RCP), and bar-type (BCP) planar cutoff probes. While Yeom et al. has shown that the RCP and BCP are more suitable than the point-type probe for process monitoring, the basic characteristics of the ring- and bar-type probes have yet to be investigated. The current work includes a computational characterization of a RCP and BCP with various geometrical parameters, as well as a plasma parameter, through a commercial three-dimensional electromagnetic simulation. The parameters of interest include antenna size, antenna distance, dielectric thickness of the transmission line, and input electron density. Simulation results showed that the RCP has several resonance frequencies originating from standing-wave resonance in the S21 spectrum that the BCP does not. Moreover, the S21 signal level increased with antenna size and dielectric thickness but decreased with antenna distance. Among the investigated parameters, antenna distance was found to be the most important parameter to improve the accuracy of both RCP and BCP.

1. Introduction

Consisting of charged particles (electrons and ions) and neutral particles (atoms, molecules, radicals, excited and metastable species), plasma is controllable via electrostatic and electromagnetic fields [1]. Its application covers various fields such as material fabrication, nuclear fusion, and medical, environmental, and aerospace industries [1,2]. In particular, plasma is one of the key factors in semiconductor and display fabrication, since both its physical (energetic ions) and chemical (reactive radicals) properties can be exploited.
Advanced process control (APC) refers to the fine-tuning of plasma processing based on real-time feedback signals from various plasma process monitoring devices. In fabrication fields, recent demands for sub-nanometer patterning and high aspect ratio- and atomic scale-etching and deposition [3,4,5] have greatly increased process difficulty, leading to wide interest in APC and real-time plasma process monitoring. The latter has contributed to productivity improvements through providing feedback signals to process control units; the feedback signals are produced via the gathering and post-processing of myriad monitoring parameters, such as plasma emission light, voltage and current of the electrode, antenna, electrostatic chuck, chamber pressure, gas flow rate, and plasma parameters (electron density, electron temperature, etc.) [4]. Among these monitoring parameters, electron density is one of the crucial factors because it is directly related to processing time and quality [1,2,6].
Many diagnostic techniques including electrical, laser, optical, and microwave methods have been developed to measure electron density. Examples include the Langmuir probe, laser Thomson scattering diagnostics, optical emission and absorption spectroscopy, and microwave probes. Most of these approaches, though, are not suitable for plasma process monitoring; the Langmuir probe cannot operate under conditions with probe tip contamination (especially in the deposition process), laser Thomson scattering diagnostics is highly sensitive to the environment and requires quite a large space, and the optical emission and absorption method operates only within a narrow window [7].
On the other hand, the microwave method has attracted great attention for application to plasma process monitoring since microwave probes are not affected by probe tip contamination, afford high measurement accuracy [8,9], and further, the required microwave power is small enough to not disturb the plasma. One drawback, though, is that microwave probes provide few parameters, namely electron density and temperature. Nowadays, research is focused on the development of a planar and compact microwave probe for real-time plasma process monitoring, since a small and planar probe can be embedded into a wafer chuck or chamber wall, and is therefore non-invasive. Variations such as the curling probe (CP), the planar multipole resonance probe (pMRP), and the planar cutoff probe have been developed and are currently under improvement via commercial three-dimensional (3D) electromagnetic simulation (CST Microwave Studio [10]), as well as experimental validation. Here, the computer simulation approach is quite simple and economical for the optimization and analysis of microwave probes.
Ogawa et al. developed the CP to measure the shift of standing wave (SW) resonance frequency caused by plasma in a reflection microwave frequency spectrum (S11) [11]. The authors optimized the CP via computer simulation [11], as well as physical modeling [12,13]. They have recently demonstrated the in situ simultaneous measurement of the thickness of a deposition film and electron density using two CPs [14,15]. Developed by Schultz et al., the pMRP uses the resonance characteristics of the probe itself and can measure muti-resonance frequencies in S11 [16]. The antenna of the pMRP consists of two semi-circle planar plates with a dielectric cover. The authors also optimized the pMRP via CST Microwave Studio [16], as well as physical modeling [17], and practically proved the feasibility of the probe to be mounted on the chamber wall for industrial plasma processing.
Kim et al. developed the first planar cutoff probe, which measures the cutoff frequency in a transmission microwave frequency spectrum (S21), analyzed the basic characteristics of the point-type probe, and optimized it via CST Microwave Studio [18]. They also fabricated the probe and firstly demonstrated its operation. Advanced types of the planar cutoff probe were subsequently developed by Yeom et al.: the ring-type planar cutoff probe (RCP) and bar-type planar cutoff probe (BCP) [19]. In [19], the authors simply compared the three designs in terms of the Q-factor of the cutoff peak using CST Microwave Studio and fabricated the BCP based on their simulation results. The BCP was then successfully applied to real-time plasma process monitoring. The basis of the planar cutoff probes is the cutoff probe, which, despite being an invasive type of probe, is considered as one of the most accurate diagnostic methods among microwave probes [20]. Therefore, it is believed that the three types of planar cutoff probes will be able to show high measurement accuracy compared to other planar microwave probes. Despite the promising potential and the fact that the RCP and BCP are more suitable for plasma process monitoring than the point-type probe [19], the basic characteristics of the ring- and bar-type probes have not been investigated yet. Hence, this paper characterizes the RCP and BCP considering various geometrical parameters, as well as a plasma parameter through the CST Microwave Studio. The main parameters include antenna size, antenna distance, dielectric thickness, and input electron density.
This paper consists of three parts. Section 2 gives the simulation details, such as simulation method, geometry, boundary conditions, and materials. Section 3 presents the simulation results and analysis of each case. Finally, Section 4 summarizes the paper.

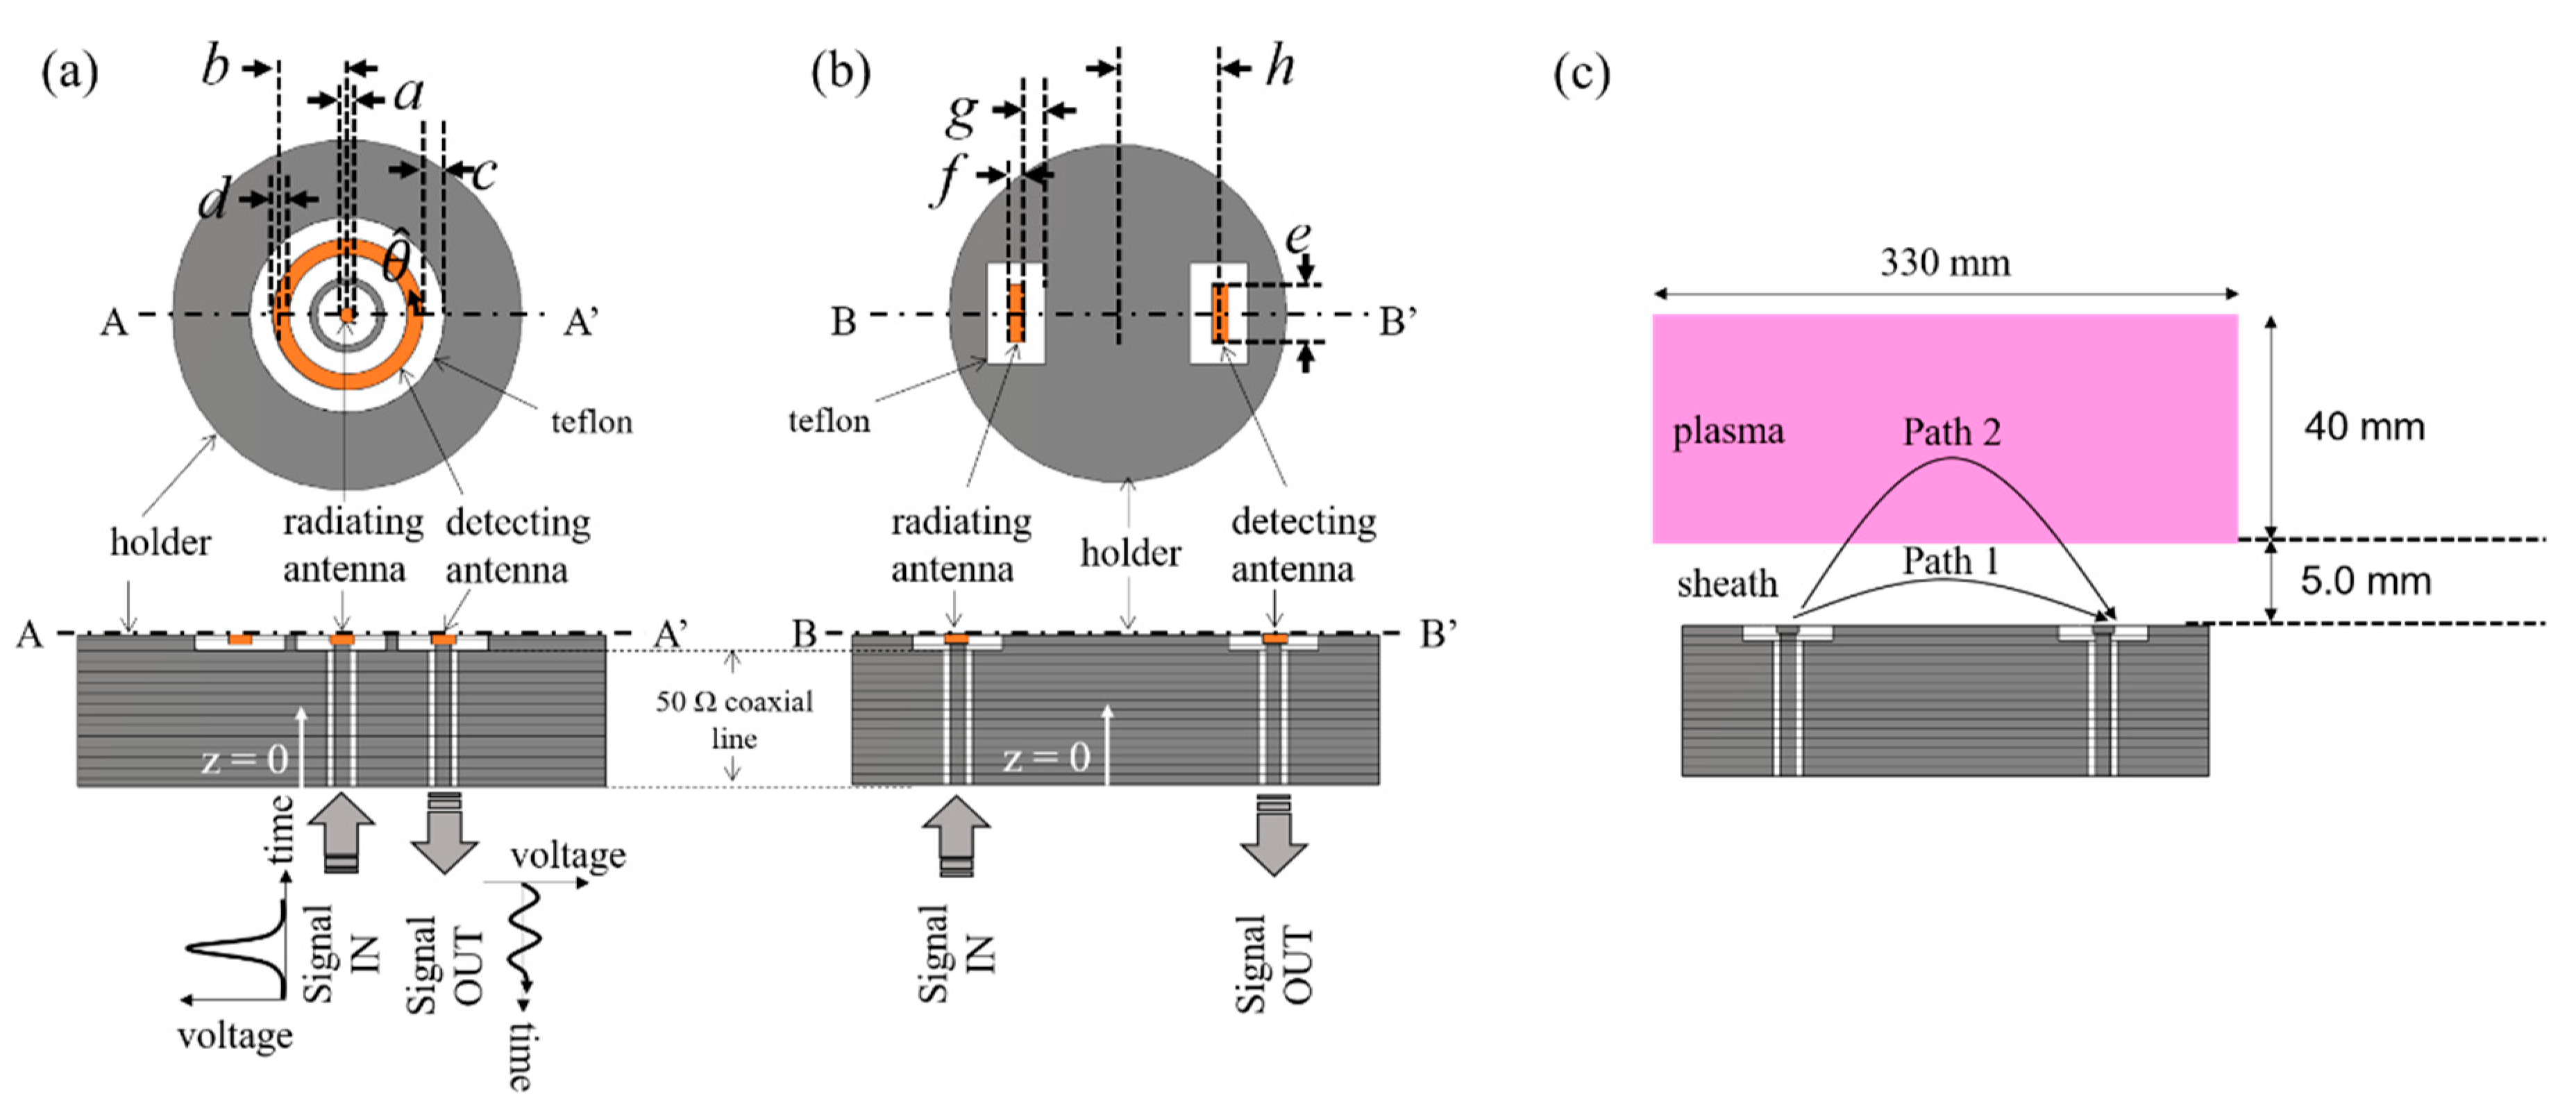
2. Simulation Details

The high-frequency time domain solver in CST Microwave Suite was adopted in this study. This solver used the finite-difference time-domain method to solve Maxwell’s equations in 3D space, typically in the microwave range. Although this software did not solve the basic plasma equations self-consistently, compared to fluid plasma simulation [21] or particle-in-cell simulation [22], it was a useful tool to study the characteristics of the microwave probes mentioned in Section 1. Since electron density was a controllable input parameter in this simulation, the software allowed us to easily establish the ideal measurement accuracy by defining it as the deviation of the output electron density from the input electron density.
Besides, it should be noted that this simulation did not need to define the plasma source, such as a capacitively or inductively coupled plasma source, since plasma is regarded as a dispersive dielectric material. Such a material can be represented by the Drude model, in which the plasma dielectric constant ( ϵ p ) is given by ϵ p = ϵ 0 ( 1 ( 2 π f p e ) 2 / { ω ( ω j ν m ) } ) , where ϵ 0 is the vacuum dielectric constant, f pe ( = 8980 n e , input ) is the plasma oscillation frequency, ω is microwave frequency, ν m is electron-neutral collision frequency, and n e , input is the input electron density. Here, the ν m term only includes the momentum transfer collision between electrons and Argon atoms at an electron temperature of 2.0 eV, with Maxwellian distribution for simplicity. The ϵ p is related to the complex wavenumber ( k ) from the dispersion relation for electromagnetic waves ( k = ω / c ϵ p ) [5]. The real and imaginary parts of k are related to the refractive index and attenuation constant, respectively.
Figure 1a,b show schematic diagrams of the top and cross-sections of the RCP and BCP, respectively, which are embedded in a cylindrical holder. Both probes consisted of radiating and detecting antennae; the RCP had a point-type radiating antenna and ring-type detecting antenna, while the BCP had bar-type radiating and detecting antennae. All antennae had 1.0 mm height, were insulated by a dielectric of height 2.0 mm, and were connected with a 50 Ω coaxial line. The plasma was a cylinder of 330 mm diameter and 40 mm height, and was positioned with an interlayer (sheath) distance of 5.0 mm from the RCP and BCP, as shown in Figure 1c; here, the simulation considers the sheath as a vacuum dielectric material ( ϵ sheath = ϵ 0 ).
Input and output ports were located at the ends of the 50 Ω coaxial lines. First, a Gaussian voltage pulse (Vin(t)) with 1 V maximum, including frequencies from zero to 10 GHz, was applied to the input port and radiated by the radiating antenna. Then, a fraction of the pulses (Vout(t)) entered the output port via the detecting antenna. The S21 is defined as S 21 = 20 log 10 ( V in ( f ) / V out ( f ) ) (dB), where Vin(f) and Vout(f) are the processed data through a fast Fourier transform of Vin(t) and Vout(t).
All simulations were conducted in the open boundary condition except for the z = 0 plane where the input and output ports are located. On this plane, the ground boundary condition (zero tangential electric field) was applied.
Figure 1a,b represent the geometrical simulation variables (a to h), and Table 1 lists the simulation conditions. For simple expression, except for antenna diameter (a) and antenna length (e), all parameters were normalized as α   ( d / a or f / e ) , β   ( b / a or h / e ) , and γ   ( c / a or g / e ) . In each simulation case, α changed from 1 to 4 for the RCP, and β and γ changed from 4.5 to 7 and 0.5 to 1.5 for both probes, respectively. Additionally, the normalized factors (a and e) changed from 2.0 to 3.0 mm. Otherwise, the plasma parameter (input electron density) also changed from 1 × 1009 to 1 × 1011 cm−3, a range common in plasma processing conditions.

3. Simulation Results and Discussion

To analyze the antenna characteristics of the two probes, Section 3.1 and Section 3.2 include an investigation of the S21 spectrum in a vacuum condition (without plasma) with various geometrical parameters, such as α , β , γ , a for the RCP, and e for the BCP. Furthermore, for simple understanding, visualizations of the antenna configurations in the RCP and BCP are provided for each condition. Afterward, in plasma conditions, the S21 spectrum with various antenna distances is examined.

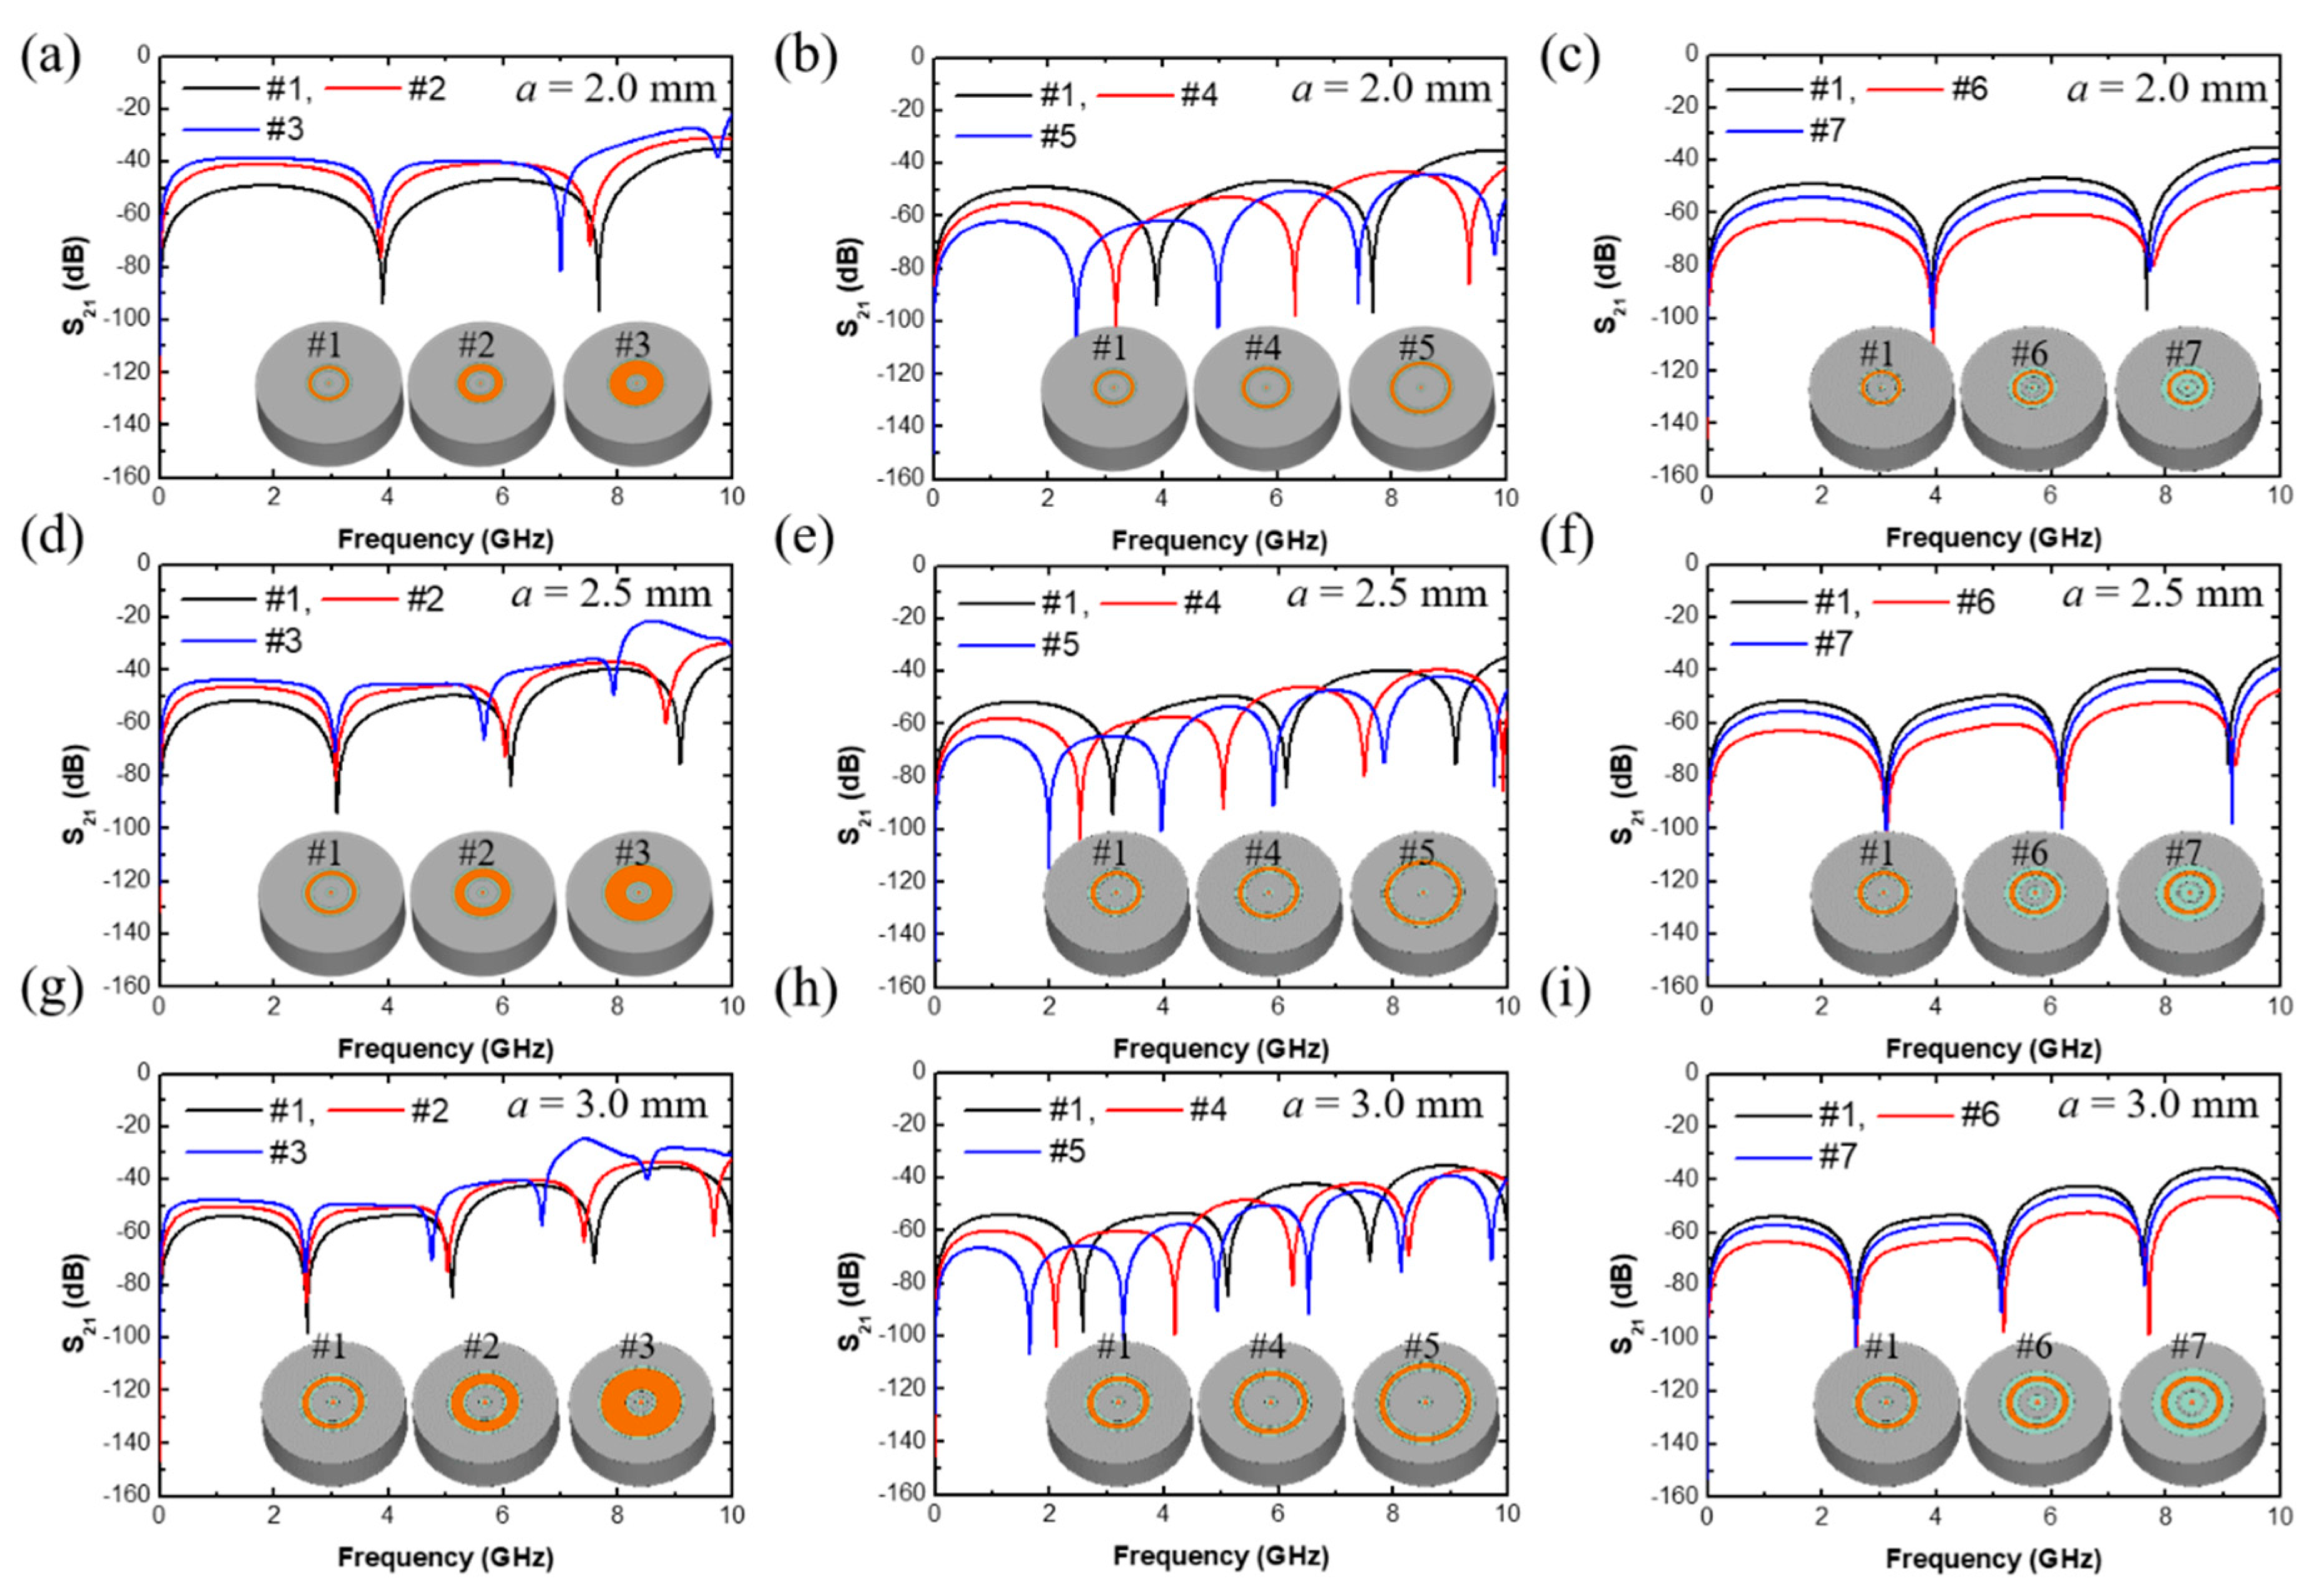
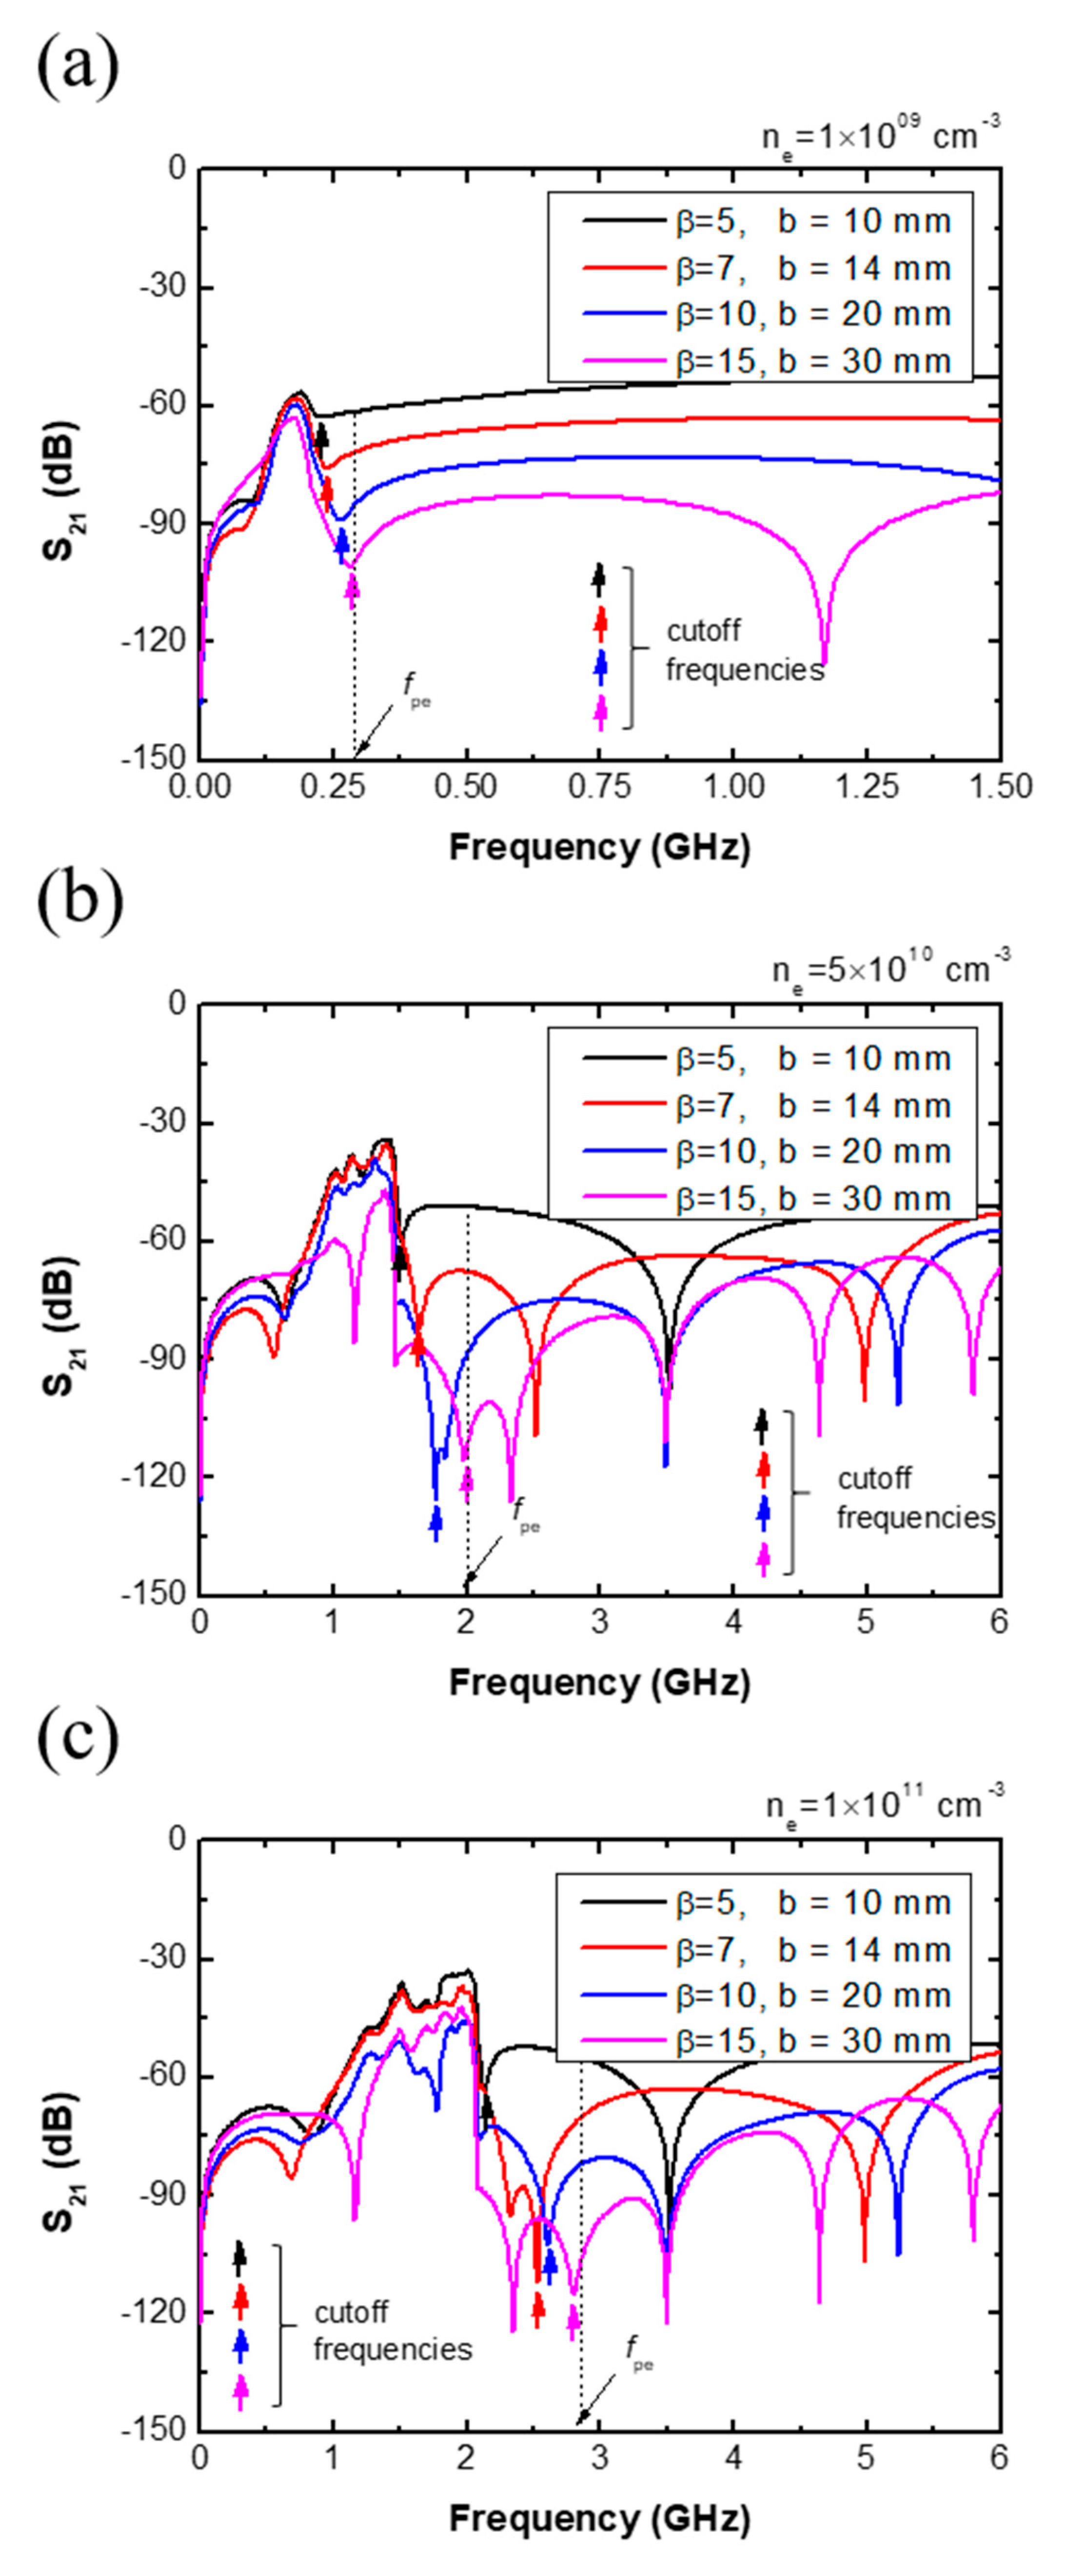
3.1. Ring-Type Cutoff Probe (RCP)

Figure 2a shows the S21 spectra with various   α (normalized width of the detecting antenna) at fixed β and γ . An increase in α led to a slight elevation of the S21 level. This was because of an increase in the capacitive coupling between the radiating and detecting antenna. Furthermore, the S21 had several resonance frequencies at its extremes. Except for the lowest resonance frequency, with an increase in α , the resonance frequencies shifted toward lower values. When a increased, as shown in Figure 2d,g, the low-frequency shift became enlarged. The origin of the resonance frequencies will be analyzed later.
Figure 2b plots the S21 spectra with several β (normalized antenna distance), with results showing that the overall S21 signal level reduced with increasing β due to a decrease in the capacitive coupling between the antennae [23]. Besides, an increase in β led to a low frequency shift of the resonance frequencies. Compared with the effect of α , increasing β more clearly shifted the resonance frequencies toward lower values.
As shown in Figure 2c, an increase in γ (normalized dielectric thickness) did not change the resonance frequencies. The signal levels changed with γ , while there was no trend compared with the α and β effects. This might have resulted from a characteristic impedance mismatching between the radiation and detecting antennae, since they had no symmetry with each other. Impedance matching might deteriorate at γ = 1.0.
To figure out the origin of the resonance frequencies as shown in Figure 2, the electric field on the detecting antenna surface was examined, the direction of which was normal to the antenna surface (z-axis as shown in Figure 1). Figure 3 exhibits the normalized electric field as a function of the normalized antenna length ( θ ^ -axis as shown in Figure 1) at resonance (2.61, 5.17, and 7.71 GHz) and non-resonance (3.90 and 6.50 GHz) frequencies of the #6 condition at a = 3.0 mm. The simulation result showed that the oscillation amplitude at the resonances was larger than that at the non-resonances. Furthermore, the wavelength at the three resonances was one, two, and three times the antenna length. Based on these two facts, the resonance frequencies resulted from the SW resonances of the electric field on the detecting antenna [20,24]. Due to this SW resonance, electric field energy was strongly localized on the detecting antenna surface such that it could not propagate toward the Signal Out (Figure 1); the S21 value at the resonances, therefore, dramatically decreased, as shown in Figure 2.
The RCP essentially featured resonance peaks induced by SW resonance in the simulated frequency ranges (<10 GHz), resulting from the length of the detecting antenna. This fact ultimately brought some negative aspects to the RCP, since the resonance peaks made finding the cutoff peak difficult in an S21 spectrum, as discussed below.
Figure 4 shows the S21 spectra of the RCP with various electron density values ranging from 1 × 10⁹ to 1 × 1011 cm−3 with various β . In Figure 4a, an increase in β produced a high frequency shift of the cutoff frequency, which was the extreme in the S21 spectrum and marked by an arrow. Eventually, the cutoff frequency became equal to the plasma frequency (fpe in Figure 4). This might have resulted from a larger rate of reduction in the capacitive coupling in the sheath (Path 1 in Figure 1c) compared to that in the plasma (Path 2 in Figure 1c) with increasing antenna distance [25]. In other words, at a short antenna distance, capacitive coupling in the sheath was dominant, so the effective electron density became smaller than the input electron density due to the sheath, where the electron density was zero.
This means that the cutoff frequency was lower than the plasma frequency. But at longer antenna distances, coupling in the plasma was dominant, and the effective electron density became the input electron density, and thereby, the cutoff frequency matched the plasma frequency [26]. Deeper analysis of the different coupling reduction trends between Path 1 and Path 2 in terms of antenna distance is beyond the scope of this paper, but will be discussed in detail in a later paper with rigorous theory.
The trend of cutoff frequency saturating to the plasma frequency at large antenna distances was the same as for other high density cases, as shown in Figure 4b,c. If measurement accuracy is defined as the discrepancy between the cutoff frequency (fc) and the plasma frequency (fpe) as f pe f c f pe , the measurement accuracy of the RCP, therefore, strongly depended on the antenna distance; it was recommended that the distance be as large as possible. However, since the overall level of an S21 spectrum diminished as the antenna distance increased, there was a trade-off between signal-to-noise ratio and measurement accuracy. Additionally, the larger the antenna distance was, the more complex the spectrum shape became due to the SW resonance.

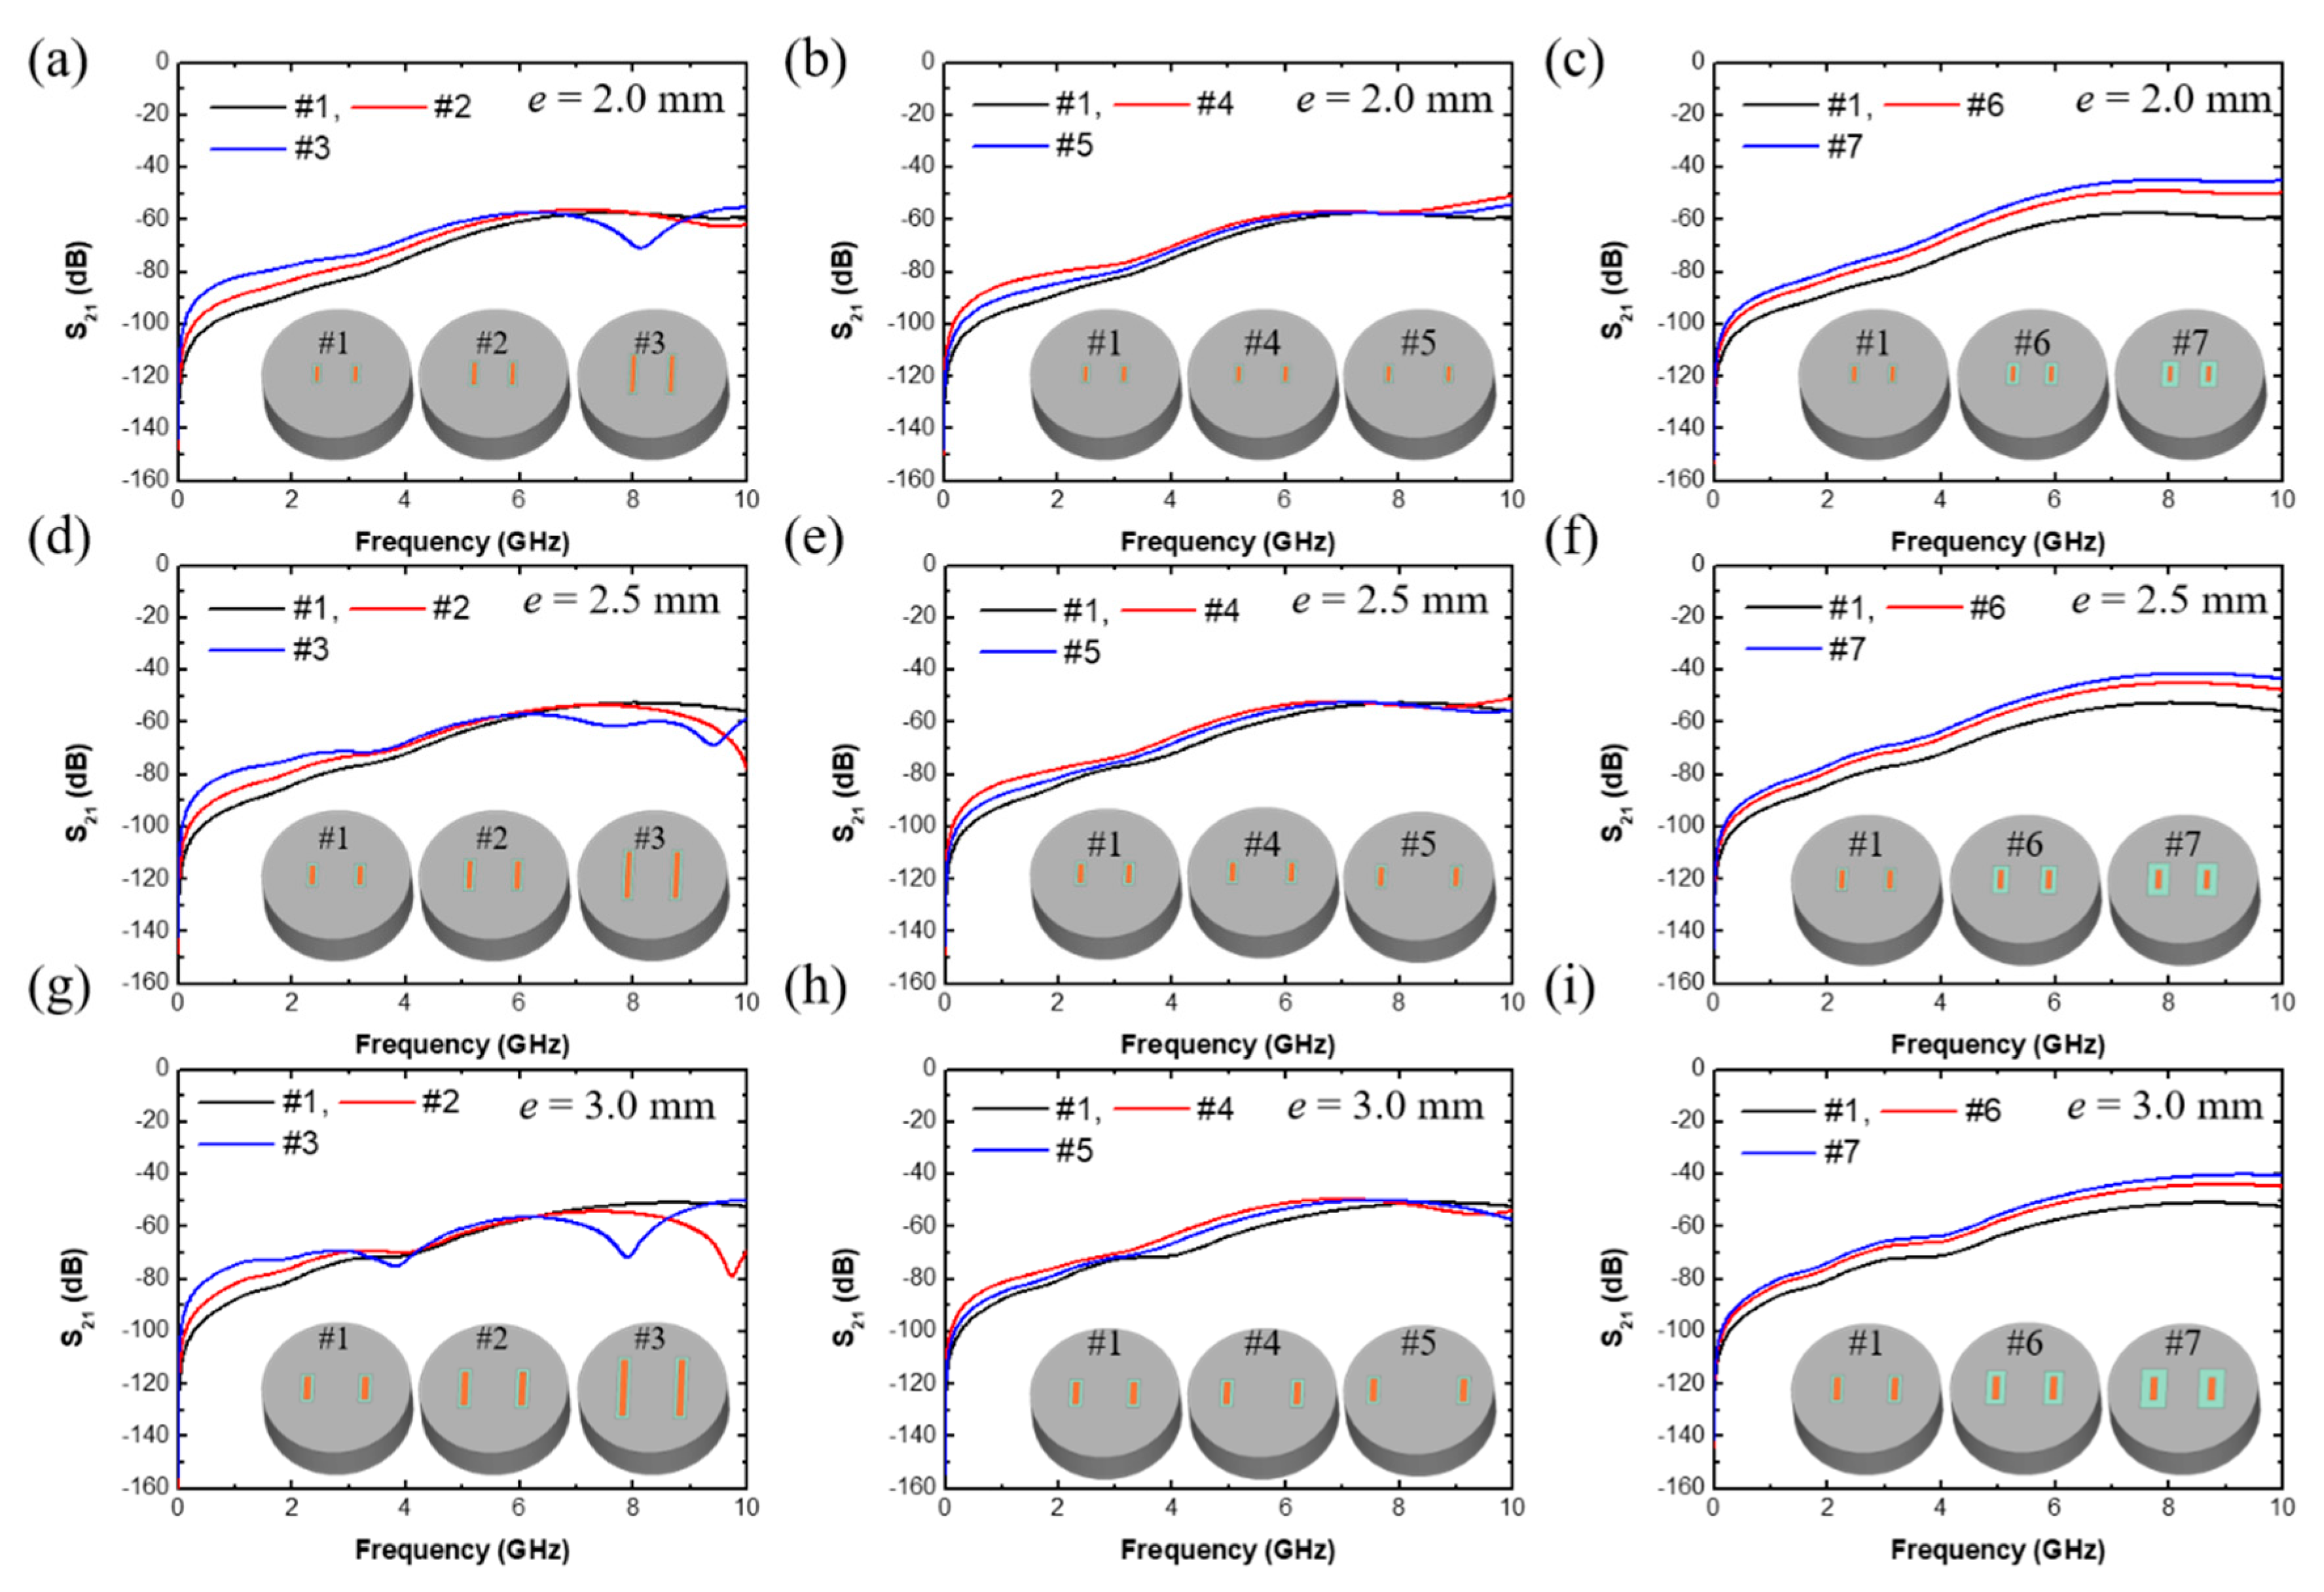
3.2. Bar-Type Cutoff Probe (BCP)

Figure 5a shows the S21 spectra of the BCP with various α at fixed β and γ in a vacuum condition. An increase in α led to a slight increase of the S21 level, which was similar to the RCP case and for the same reason. Here, there were no significant resonance peaks in the S21 spectra from the BCP, except for case #3, because the length of the radiating and detecting antennae was much smaller than the RCP detecting antenna; the SW resonance took place at high frequencies beyond the interested range (<10 GHz). When the antenna length e increased, as shown in Figure 5d,g, a low frequency shift of the resonance frequency with low Q-factor took place near 8 GHz (cases #2 and #3), but this could be negligible. The signal level of the BCP, however, was lower than that of the RCP, by as much as 20 dB due to the small size of the BCP antennae.
Figure 6 shows the S21 spectra of the BCP with various electron densities ranging from 1 × 109 cm−3 to 1 × 1011 cm−3 and various β , with the same conditions as in Figure 4. In Figure 6a, an increase in β produced the same results as the RCP case. With increasing antenna distance, the cutoff frequency saturated to the plasma frequency, which might have resulted from a reduction in capacitive coupling between the antennae for the same reason as in the RCP. Figure 6b,c show smooth spectral shapes, and it is therefore easy to determine the cutoff frequency in each spectrum. They also manifested the same trend as Figure 6a in terms of β dependence.
It should be noted for the BCP here that the critical antenna distance (dc), where the cutoff frequency matched the plasma frequency, was much lower than that in the RCP, at 14 mm compared to 30 mm as shown in Figure 7, which showed the ratio of the cutoff frequency to the plasma frequency by antenna distance. Additionally, the S21 spectrum of the BCP was much straighter, without any resonance peaks, than that of the RCP. This fact facilitated simple cutoff frequency monitoring by just measuring the minimum S21 value, which indicated the possibility for a simple plasma monitoring system based on the BCP. In summary, the BCP was more practical than the RCP in terms of miniaturization as well as electron density monitoring, since it was much easier to determine the cutoff frequency in the S21 spectrum of the BCP than that of the RCP.

4. Conclusions

This paper investigated the basic properties of two types of planar cutoff probes, the ring-type and the bar-type planar cutoff probes, with various geometrical parameters as well as a plasma parameter through a commercial 3D electromagnetic simulation. Simulation results showed that the RCP had several resonance frequencies that originated from standing-wave resonance on the detecting antenna, while the BCP did not. Moreover, the signal level of both the RCP and BCP increased with increasing antenna size and decreased with increasing antenna distance between the radiating and detecting antennae because of elevated and diminished capacitive coupling, respectively. Among the studied parameters, antenna distance was found to be the key parameter highly related to the accuracy of both probes. As a result, the BCP was more practical than the RCP for use in non-invasive electron density measurement systems since it allowed for much easier determination of cutoff frequency in S21 spectra.

Author Contributions

Investigation, S.J.K.; resources, H.C.L., J.-H.K.; data curation, S.J.K., J.J.L., Y.S.L., and H.J.Y.; writing—original draft preparation, S.J.K.; writing—review and editing, S.J.Y. All authors have read and agreed to the published version of the manuscript.

Funding

This research was supported by the National Research Council of Science & Technology (NST) grant by the Korea government (MSIP) (No. CAP-17-02-NFRI), by the Korea Institute of Energy Technology Evaluation and Planning (KETEP) and the MOTIE of the Republic of Korea (No. 20172010105910), by Korea Institute for Advancement of Technology (KIAT) grant funded by the Korea Government (MOTIE) (P0008458, The Competency Development Program for Industry Specialist), by the Aerospace Low Observable Technology Laboratory Program of the Defense Acquisition Program Administration and the Agency for Defense Development of the Republic of Korea, and by Basic Science Research Program through the National Research Foundation of Korea(NRF) funded by the Ministry of Education (NRF-2020R1A6A1A03047771).

Conflicts of Interest

The authors declare no conflict of interest.

References

  1. Lieberman, M.A.; Lichtenberg, A.J. Principles of Plasma Discahrges and Materials Processing, 2nd ed.; Wiley & Sons. Inc.: Hobken, NJ, USA, 2005; pp. 1–22. [Google Scholar]
  2. Adamovich, I.V.; Baalrud, S.D.; Bogaerts, A.; Bruggeman, P.J.; Cappelli, M.; Colombo, V.; Czarnetzki, U.; Ebert, U.; Eden, J.G.; Favia, P.; et al. The 2017 Plasma Roadmap: Low temperature plasma science and technology. J. Phys. D Appl. Phys. 2017, 50, 323001. [Google Scholar] [CrossRef]
  3. Umeda, S.; Nogi, K.; Shiraishi, D.; Kagoshima, A. Advanced Process Control Using Virtual Metrology to Cope With Etcher Condition Change. IEEE Trans. Semicond. Manuf. 2019, 32, 423–427. [Google Scholar] [CrossRef]
  4. Roh, H.-J.; Ryu, S.; Jang, Y.; Kim, N.-K.; Jin, Y.; Park, S.; Kim, G.-H. Development of the Virtual Metrology for the Nitride Thickness in Multi-Layer Plasma-Enhanced Chemical Vapor Deposition Using Plasma-Information Variables. IEEE Trans. Semicond. Manuf. 2018, 31, 232–241. [Google Scholar] [CrossRef]
  5. Ahn, J.-H.; Gu, J.-M.; Han, S.-S.; Hong, S.-J. Real-time In-situ Plasma Etch Process Monitoring for Sensor Based-Advanced Process Control. J. Semicond. Technol. Sci. 2011, 11, 1–5. [Google Scholar] [CrossRef]
  6. Kim, S.J.; Lee, J.J.; Kim, D.W.; Kim, J.-H.; You, S.J. A transmission line model of the cutoff probe. Plasma Sources Sci. Technol. 2019, 28, 055014. [Google Scholar] [CrossRef]
  7. Engeln, R.; Klarenaar, B.L.M.; Guaitella, O. Foundations of optical diagnostics in low-temperature plasmas. Plasma Sources Sci. Technol. 2020, 29, 063001. [Google Scholar] [CrossRef]
  8. You, K.H.; You, S.J.; Kim, D.W.; Na, B.K.; Seo, B.H.; Kim, J.H.; Seong, D.; Chang, H.-Y. Measurement of electron density using reactance cutoff probe. Phys. Plasmas 2016, 23, 053515. [Google Scholar] [CrossRef]
  9. Kim, J.-H.; Choi, S.-C.; Shin, Y.-H.; Chung, K.-H. Wave cutoff method to measure absolute electron density in cold plasma. Rev. Sci. Instruments 2004, 75, 2706–2710. [Google Scholar] [CrossRef]
  10. 3ds SIMULIA CST STUDIO SUITE. Available online: www.cst.com (accessed on 6 October 2020).
  11. Liang, I.; Nakamura, J.; Sugai, H. Modeling Microwave Resonance of Curling Probe for Density Measurements in Reactive Plasmas. Appl. Phys. Express 2011, 4, 066101. [Google Scholar] [CrossRef]
  12. Arshadi, A.; Brinkmann, R.P.; Hotta, M.; Nakamura, K. A simple and straightforward expression for curling probe electron density diagnosis in reactive plasmas. Plasma Sources Sci. Technol. 2017, 26, 045013. [Google Scholar] [CrossRef]
  13. Arshadi, A.; Brinkmann, R.P. Analytical investigation of microwave resonances of a curling probe for low and high-pressure plasma diagnostics. Plasma Sources Sci. Technol. 2016, 26, 15011. [Google Scholar] [CrossRef]
  14. Hotta, M.; Ogawa, D.; Nakamura, K.; Sugai, H. Real-time curling probe monitoring of dielectric layer deposited on plasma chamber wall. Jpn. J. Appl. Phys. 2018, 57, 046201. [Google Scholar] [CrossRef]
  15. Ogawa, D.; Nakamura, K.; Sugai, H. A novel technique for in-situ simultaneous measurement of thickness of deposited film and electron density with two curling probes. Plasma Sources Sci. Technol. 2020. [Google Scholar] [CrossRef]
  16. Schulz, C.; Styrnoll, T.; Awakowicz, P.; Rolfes, I. The Planar Multipole Resonance Probe: Challenges and Prospects of a Planar Plasma Sensor. IEEE Trans. Instrum. Meas. 2014, 64, 857–864. [Google Scholar] [CrossRef]
  17. Friedrichs, M.; Oberrath, J. The planar Multipole Resonance Probe: a functional analytic approach. EPJ Tech. Instrum. 2018, 5, 7. [Google Scholar] [CrossRef]
  18. Kim, D.W.; You, S.J.; Kim, S.J.; Kim, J.-H.; Lee, J.Y.; Kang, W.S.; Hur, M.S. Planar cutoff probe for measuring the electron density of low-pressure plasmas. Plasma Sources Sci. Technol. 2019, 28, 015004. [Google Scholar] [CrossRef]
  19. Yeom, H.J.; Kim, J.-H.; Choi, D.; Choi, E.S.; Yoon, M.Y.; Seong, D.-J.; You, S.J.; Lee, H.-C.; Hyo-Chang, L. Flat cutoff probe for real-time electron density measurement in industrial plasma processing. Plasma Sources Sci. Technol. 2020, 29, 035016. [Google Scholar] [CrossRef]
  20. Kim, D.W.; You, S.J.; Kim, J.H.; Chang, H.Y.; Oh, W.Y. Computational comparative study of microwave probes for plasma density measurement. Plasma Sources Sci. Technol. 2016, 25, 35026. [Google Scholar] [CrossRef]
  21. Kim, H.C.; Iza, F.; Yang, S.S.; Radmilović-Radjenović, M.; Lee, J.K. Particle and fluid simulations of low-temperature plasma discharges: benchmarks and kinetic effects. J. Phys. D Appl. Phys. 2005, 38, R283–R301. [Google Scholar] [CrossRef]
  22. Verboncoeur, J.P. Particle simulation of plasmas: review and advances. Plasma Phys. Control. Fusion 2005, 47, A231–A260. [Google Scholar] [CrossRef]
  23. Jackson, J.D. Classical Electrodynamics, 3rd ed.; Wiley & Sons. Inc.: Hobken, NJ, USA, 1999; p. 310. [Google Scholar]
  24. Na, B.-K.; Kim, D.-W.; Kwon, J.-H.; Chang, H.-Y.; Kim, J.-H.; You, S.J. Computational characterization of cutoff probe system for the measurement of electron density. Phys. Plasmas 2012, 19, 53504. [Google Scholar] [CrossRef]
  25. Walker, J.; Halliday, D.; Resnick, R. Principles of Physics, 10th ed.; John Wiley & Sons: Singapore, 2014; pp. 413–416. [Google Scholar]
  26. Mehdizadeh, M. Microwave/RF Applicators and Probes: for Material Heating, Sensing, and Plasma Generation, 2nd ed.; Elsevier Inc.: Cambridge, MA, USA, 2015; p. 99. [Google Scholar]
Figure 1. Schematics of the (a) ring-type cutoff probe (RCP) and (b) bar-type cutoff probe (BCP), with various geometrical parameters: a—antenna diameter; b,h—antenna distances; c,g—dielectric thickness; e—antenna length; d,f—antenna widths. (c) Geometry of the plasma and sheath.
Applsci 10 07066 g001
Figure 2. S21 spectra of the RCP from various (a,d,g) antenna widths, (b,e,h) antenna distances, and (c,f,i) dielectric thickness at various antenna diameters: (ac) a = 2.0 mm, (df) a = 2.5 mm, and (gi) a = 3.0 mm.
Applsci 10 07066 g002
Figure 3. Normalized Ez-field distribution (Ez/Ez,max) on the detecting antenna of the RCP along normalized antenna length (L/Lmax), where the z-direction is parallel to the normal direction of the antenna surface.
Applsci 10 07066 g003
Figure 4. S21 spectra of the RCP from various normalized antenna distances ( β ) with electron densities of (a) ne = 1 × 10 9   cm 3 , (b) 5 × 10 10   cm 3 , and (c) 1 × 10 11   cm 3 .
Applsci 10 07066 g004
Figure 5. S21 spectra of the BCP from various (a,d,g) antenna widths, (b,e,h) antenna distances, and (c,f,i) dielectric thickness at various antenna lengths: (ac) e = 2.0 mm, (df) e = 2.5 mm, and (gi) e = 3.0 mm.
Applsci 10 07066 g005
Figure 6. S21 spectra of the BCP from various normalized antenna distances ( β ) with electron densities of (a) ne = 1 × 10 9   cm 3 , (b) 5 × 10 10   cm 3 , and (c) 1 × 10 11   cm 3 .
Applsci 10 07066 g006
Figure 7. Normalized cutoff frequency (fcutoff/fpe) of the RCP and BCP with various antenna distances and input electron densities at a = e = 2.0 mm and p = 100 m Torr.
Applsci 10 07066 g007
Table 1. Simulation conditions with various α , β , γ , and probe diameters. Parameters a–g are given in Figure 1.
TypeRing-Type ProbeTypeBar-Type Probe
Numberα (≡ d/a)β (≡ b/a)γ (≡ c/a)Numberα (≡ f/e)β (≡ h/e)γ (≡ g/e)
#114.50.5#844.50.5
#224.50.5#964.50.5
#344.50.5#10104.50.5
#415.50.5#1145.50.5
#517.00.5#1247.00.5
#614.51.0#1344.51.0
#714.51.5#1444.51.5

