Abstract
The aging of porcelain insulators is responsible for the failure of power utilities. Porcelain insulators from different places in South Korea, possessing various aging times and years of installation, have been investigated to carry out lifetime statistics. These samples have a mass of 36,000 lbs and are operated at 154 kV. X-ray fluorescence (XRF) and scanning electron microscopy (SEM) were performed on the porcelain bodies of the samples collected. XRF and SEM revealed trends in the weight percentage of SiO2, Al2O3, and Fe2O3 in the porcelain bodies of the collected samples. The SiO2 and Fe2O3 weight percentage reduced to 8.93% and 73.17%, respectively, in sample C compared to A. However, the Al2O3 weight percentage increased to 16.23% in sample C compared to sample A. This change in weight percentage of SiO2, Fe2O3, and Al2O3 contributed toward enhancing the mechanical and electrical properties of the insulators. Mechanical load tests with electrical voltage (M&E), thermal and mechanical load tests (T&M), and hardness tests (HRB) were performed to evaluate these characteristics. Experiments revealed an increase of 90.9% in the inequality factor (K) in sample C compared to A. The impact of constituents of porcelain on the lifetime expectancy of a porcelain insulator was reported by implementing statistical strategies, such as the Weibull distribution.
1. Introduction
Power industries are highly cautious regarding the aging assessment of transmission systems. The consistency and durability of insulators are extremely necessary for the efficient performance of power utilities. Despite insulators being only 5% of the capital cost, they require 70% of the maintenance costs of transmission lines [1,2,3]. Many works have been reported regarding the failure of porcelain insulators due to impulsive stresses caused by electrical, mechanical, thermal, and various environmental stresses. These stresses lead to the failure of the insulator, either mechanically or electrically. The failure probability is highly dependent on the mechanical and electrical characteristics of insulators, as mechanical and electrical properties are responsible for the strength of the insulator. It has been reported in many articles that the composition constituents of the porcelain body has a large impact on the mechanical and electrical characteristics of insulators [4,5,6,7]. This article focused on studying the relation between the failure probability of insulators and the weight percentage of porcelain contents, such as SiO2, Al2O3, and Fe2O3, for the lifetime assessment of a porcelain insulator. Many articles have been reported on the contribution of SiO2, Al2O3, and Fe2O3 in porcelain insulators. Riahi et al. reported that whenever porcelain insulators having SiO2 as the major component have been subjected for firing at higher temperatures, the corners of the quartz (SiO2) particles are dissolved into feldspar. Thus, this decreases the solid quartz (SiO2) content, leading to a degradation of mechanical strength [8,9,10,11]. Therefore, the firing temperature has to be performed attentively in the case of porcelain insulators that have quartz (SiO2) as a major portion. However, another considerable issue with insulators having SiO2 as a major portion is the difference in the thermal coefficient of the quartz grain and matrix around it. This condition leads to tensile stress in the quartz grains, and the surrounding matrix undergoes compressive stress. Thus, micro cracks are generated, which reduces the bulk density of the porcelain body of the insulators. However, in the case where SiO2 has been altered with Al2O3 in the porcelain body, the density of the fired porcelain body improves. At the same time, Noori reported on the replacement of SiO2 with Al2O3 to enhance the bending strength of electrical porcelain bodies. This improves the mechanical and electrical strength of the insulator [9]. Furthermore, Piva reported that Fe2O3 enhances the dielectric constant and loss tangent, which tends to result in an increase in heating through dielectric losses [1,12,13].
Porcelain insulator samples were collected from various power transmission lines throughout South Korea, which were 36,000 lbs and operated at 154 kV. These insulators were discarded from utility systems to assess the condition of similar samples. The samples collected were categorized into three sections according to the year of installation. Mechanical load tests with electrical voltage (M&E), thermal and mechanical load tests (T&M), and hardness tests (HRB) were performed on all three categories of insulators to evaluate their mechanical and electrical characteristics. X-ray fluorescence (XRF) and scanning electron microscopy (SEM) characterization techniques were adapted to study the detailed change in weight percentage of the SiO2, Al2O3, and Fe2O3 and its impact on the microstructure of the porcelain of porcelain insulators. Finally, statistical distributions were implemented to analyze the trends of the probability of failure of collected samples depending on the constituents of the porcelain body. Many researchers have performed research on the lifetime assessment of porcelain insulators before. Most of the articles predicted the useful life of insulators to be more than 40 years. However, some also reported active lives below 30 years [14]. This study investigated the dependency of the mechanical and electrical characteristics of porcelain insulators on the porcelain constituents. Further, the relation between the probability of failure of porcelain insulators with varying weight percentages of SiO2, Al2O3, and Fe2O3 was found.
2. Influence of the Material Contents of Porcelain Body on the Electrical and Mechanical Properties of Porcelain Insulators
Porcelain insulator samples that were manufactured in different years with a mass of 36,000 lbs and operated at 154kV were collected from various power transmission lines in South Korea. These were discarded from utility systems to assess the condition of similar samples. Table 1 shows the essential specifications of the insulators required for the evaluation of the aging state. The M&E and T&M loading tests were performed on insulators to evaluate their mechanical and electrical strengths. Load tests were performed as per the Acronym for the American National Standards Institute ANSI. InstronTM hydraulic press with a maximum capacity of 135,000 lbs has been used. The mechanical load was raised up to load of 50% of the M&E rating and fixed at this value for 1 min. Consequently, a thermal chamber was maintained with 24-h cycles with two temperature levels, −30 °C and 40 °C, and the insulator had to withstand for 4 h. Figure 1 shows the condition of the insulator samples that failed the load tests. During the load tests, these failed samples showed different issues like cap separation, pulling out of pins, breaking of the porcelain body, etc. Table 1 shows specifications of the insulators collected from different places in South Korea. Remarks represent location of porcelain insulator at which failure occur.

Table 1.
Details of mechanical load tests with electrical voltage (M&E) test results.
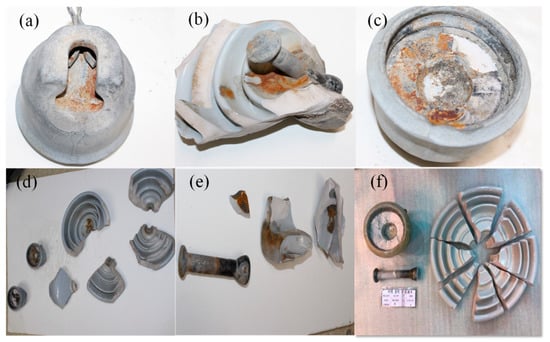
Figure 1.
Mechanical and electrical failure of insulators that failed the load tests: (a) separated cap, (b) broken insulator, (c) cap separated, (d) broken insulator, (e) pin pulled out and mechanical failure, and (f) break due to electrical failure.
The collected samples were categorized into three sections according to the constituents of the porcelain body and the manufacturing year. Table 1 and Table 2 show that the average load at which failure occurred increased approximately 14.7% in samples manufactured in 2005 compared to those manufactured in 1975. The quality factor (K), which evaluates any insulator mechanically and electrically, was calculated. For a passing load test, K should be greater than 3 [8]. It was observed that there was an increase of 90.95% in K in the case of samples manufactured in 2005 compared to those manufactured in 1975.
where QM is the initial quality index, QA is the current quality index, and Yu is the remaining lifetime.
Table 2.
Details of the thermal and mechanical (T&M) load test results.
Figure 2 shows change in the trend of K of the porcelain insulators for samples manufactured in 1975, 1995, and 2005. Further, the hardness was evaluated to confirm the trend of the mechanical strength increase by implementing the HRB hardness test. Figure 3 shows the results of the HRB hardness test. The average result of the HRB test for the collected samples was calculated to be 119.8, 119.4, and 121.8 for samples produced in 1975, 1995, and 2005, respectively. The standard deviation was calculated and plotted in Figure 2 to check the distance of each data point from the mean hardness values observed. Figure 2 shows that the standard deviation decreased in samples manufactured later compared to earlier insulators. It can be deduced from the above experiments that the mechanical and electrical properties were enhanced with the increasing year of production. Further, XRF and SEM were performed to study the elemental composition change and microstructural condition in the porcelain insulators with increasing years to investigate the reason for the improvement in electrical and mechanical properties. The XRF results are shown in Table 3 for the collected samples. Microstructural analysis performed using SEM, as shown in Figure 4, depicts a huge porosity in sample A, which enhanced the tendency for cracking in these porcelain insulators.
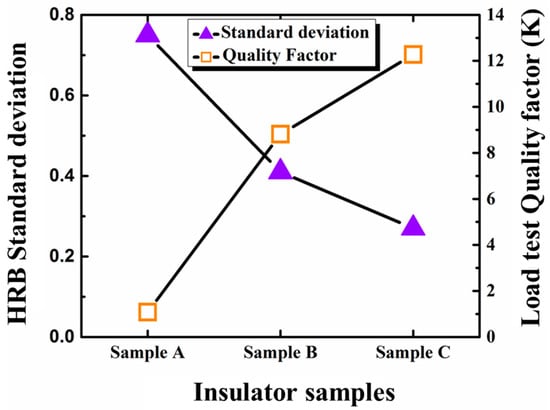
Figure 2.
Results of the HRB hardness test and Quality factor of load test on porcelain insulator samples.
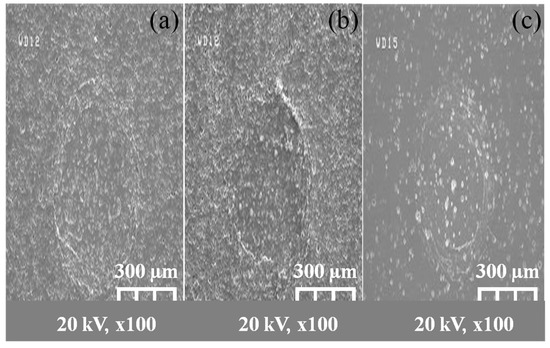
Figure 3.
Results of the hardness test for (a) sample A, (b) sample B, and (c) sample C.
Table 3.
X-ray fluorescence (XRF) studies of the porcelain body of porcelain insulators.
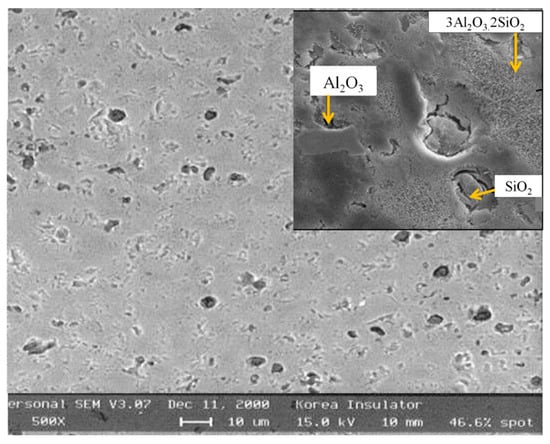
Figure 4.
Microstructure of insulator sample A depicting a high porosity of the porcelain body.
3. Statistical Analysis of the Constituents of Porcelain and the Probability of Failure of Porcelain Insulators
Among all statistical techniques, the Weibull distribution is popular for analyzing the failure probability with fewer data points. In this case, 10 samples were considered for studying the failure probability of the porcelain insulators. The Weibull distribution has the potential to provide an accurate failure analysis with a low number of samples (n < 20) [15,16,17,18,19,20,21]. Another advantage identified with Weibull analysis is that it provides a logical and effortless graphical plot of the required lifetime expectancy. The graphical plot analysis is quite significant for researchers. The two most significant parameters in the case of a Weibull distribution are the shape (α) and the scale factor (β). Here, a two-parameter Weibull distribution was used to predict the lifetime of the porcelain insulators. Data distributed in accordance with Weibull function should approximately follow a straight line, as shown in Figure 5 and Figure 6.
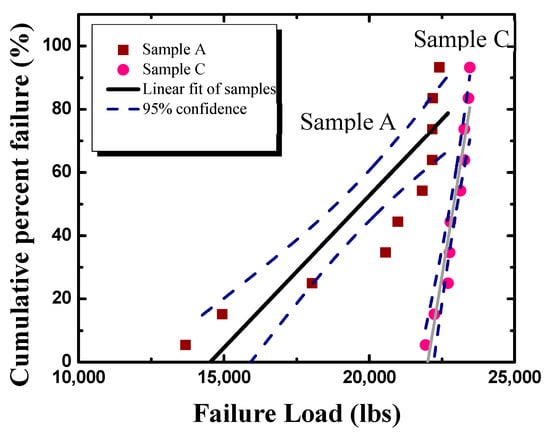
Figure 5.
Cumulative probability of failure of the samples based on the mechanical load test with electric voltage (M&E) of the porcelain insulators.
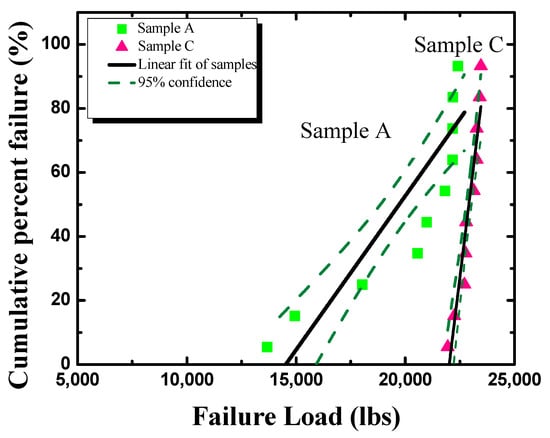
Figure 6.
Cumulative probability of failure of the samples based on the thermal and mechanical load test (T&M) of the porcelain insulators.
Moreover, as discussed in articles, the correlation coefficient should be calculated to check the adequacy of the Weibull distribution [17,18,19,20,21]. Here, the correlation coefficient was calculated to be 0.64, 0.84, and 0.95 respectively, for the three samples A, B and C. The correlation coefficient was calculated using the built-in function in a spreadsheet. The adequacy of the Weibull distribution can be evaluated if the correlation coefficient is greater than [22], where n stands for number of samples. All cases reported satisfy the adequacy of a Weibull distribution in accordance with the above formula. Further, the data was sorted in ascending order and a breakdown probability was assigned. A simple approximation used to calculate the probability of failure was used:
where i is the rank of the data point.
For each breakdown load value, (ti), a value was assigned:
For each probability of failure, F(i,n) was expressed as:
The estimates of failure, i.e., α and β was calculated using:
where b is the y-intercept.
α = slope of the Weibull plot,
Considering a two-parameter Weibull distribution, the failure probability was calculated using:
where F(t) is the cumulative probability of failure, t is the failure load, α is the shape factor, β is the scale factor, and n is the number of samples
In this study, six cases were considered to find the lifetime expectancy of the insulators. Three case study probabilities of failure were based on the mechanical load test with electric voltage (M&E) on insulators. However, another three studies dealt with the probability of failure based on the thermal and mechanical load test on the insulators. The correlation factor for all six cases were checked as stated before in this section. These cases satisfied the Weibull adequacy criterion where the correlation coefficient was greater than . The correlation coefficient was calculated to be 0.64, 0.84, and 0.95, respectively, for the three case studies mentioned above. Consequently, α and β values were calculated to be α = 7.69 and β = 20,952.22, α = 32.27 and β = 22,378.61, and α = 45.66 and β = 22,743.4, respectively, for samples A, B, and C. The probability of failure was also calculated according to the Weibull function using Equation (7). The probability of failure was calculated to be 9%, 3%, and 0.4%, respectively, for the same sequence of samples mentioned above. Further, the probability of failure based on the thermal and mechanical load test on samples A, B, and C were calculated. The correlation factors were 0.65, 0.97, and 0.98, respectively. It was checked that for all cases, the correlation coefficient was greater than . Consequently, the α and β values were calculated to be α = 6.96 and β = 21,284.8, α = 46.84 and β = 22,859.07, and α = 59.82 and β = 23,078.26, respectively, for samples A, B, and C. Additionally, the probability of failure was calculated to be 8%, 1.2%, and 1%, respectively, for samples A, B, and C. All six cases of load failure were re-evaluated by implementing the normal function. The calculated probability of failure was 7%, 3%, and 0.1%. Additionally, the probability of failure was also calculated by implementing a normal distribution on the T&M load test. The calculated probability of failure was 6%, 1.3%, and 0.9%, respectively, for samples A, B, and C. The normal probability was calculated using an in-built normal function of a spreadsheet. Both evaluation process results for calculating the probability of failure of the insulators were approximately similar. Figure 5 and Figure 6 depict the cumulative failure probability of porcelain insulators by implementing the Weibull distribution with a 95% confidence. These plots also ensured the adequacy of the Weibull distribution. Figure 7 gives the relation between the average value of the loads at which failure occurred based on both load tests, i.e., M&E and T&M, and the weight percentage of SiO2, Al2O3, and Fe2O3 in the porcelain body. Our calculations for the probability of failure gave the load at which failure would occur increased by 14.70% on average from sample A to C. Additionally, the probability of failure was reduced by 91.5% on average from sample A to C. In this study, load tests, hardness tests, and SEM were performed to study the improvement in mechanical and electrical properties of insulators with the later manufacturing years. Also, elemental analysis XRF was performed to study the reason for the improvement in the electrical and mechanical properties with the later manufacturing years. A statistical strategy was implemented to calculate the probability of failure. Figure 7 and Figure 8 show that due to changes in the elemental composition (SiO2, Al2O3, and Fe2O3) of porcelain insulators with later years of production, the loads at which failure occurred increased and the probability of failure decreased. Thus, changes in the SiO2, Al2O3, and Fe2O3 composition of porcelain insulators with later manufacturing years increased the electrical and mechanical properties and decreased the probability of failure. It was inevitable that due to the change in the trend of the weight percentage of SiO2, Al2O3, and Fe2O3, the value of the load at which failure occurred was enhanced by 14.70% on average, as seen in Figure 7. Thus, it can be concluded that the trend in the weight percentage of SiO2, Al2O3, and Fe2O3 in porcelain insulators was responsible for the decrease in the probability of failure by an average of 91.5%. Figure 8 shows this relation clearly.
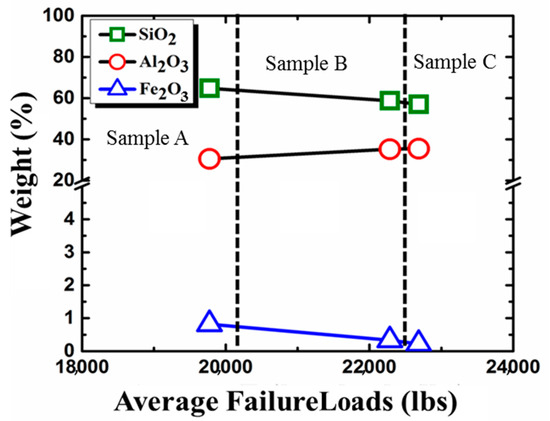
Figure 7.
Load at which failure occurred for samples A, B, and C based on the weight percentage of porcelain constituents and load tests.
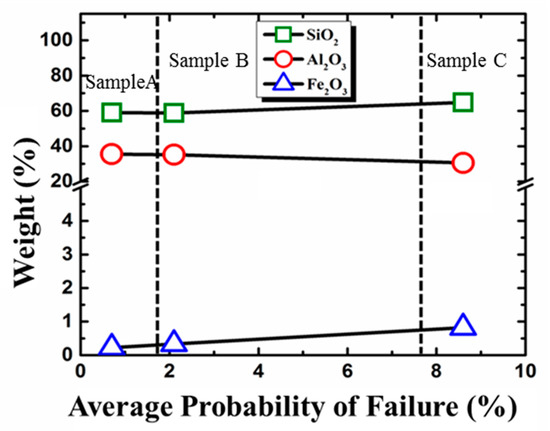
Figure 8.
Probability of failure of samples A, B, and C based on the weight percentage of the porcelain constituents.
4. Conclusions
An insulators must withstand rigorous stress as it is an outdoor device. Due to this, the aging cycle is hastened in insulators, which affects the mechanical and electrical characteristics of the insulators. Although an initial visual inspection is possible, almost all cases require experimental and statistical studies for a proper prediction of failure. This paper studied insulator samples that were collected from different power utilities in South Korea and had a weight of 36,000 lbs and operated at 154 kV. It was observed from load test and hardness test results that with later manufacturing years, the load at which failure occurred increased by 14.7% in average. K increased by 90.9% on average in the case of sample C compared to A. Characterizations using XRF and SEM were performed to investigate the reason for this. The XRF and SEM analysis showed there was a 8.93% and 73.17% decrease in the weight percentage of SiO2 and Fe2O3 and a 16.23% increase in the weight percentage of Al2O3 from sample A to C. The mechanical and electrical properties improved, as depicted by an increase in the K value of sample C. The Weibull distribution was implemented on the results to predict the probability of failure for the insulators. The goodness of fit was evaluated before the implementation of the Weibull analysis, as depicted in Figure 5 and Figure 6. The Weibull estimates α and β were calculated. The probability of the load at which failure occurred was observed to increase on average by 14.7% with a new trend line of the weight percentage of the porcelain body in sample C. The probability of failure was calculated for all insulators. The probability of failure decreased by 91.5% on average from sample A to C. Hence, it can be concluded from this work that the life expectancy of a porcelain insulator is dependent on the weight percentage of SiO2, Fe2O3, and Al2O3 of the porcelain body of an insulator where sample A was the most deteriorated and sample C was the least deteriorated sample among the three samples.
Author Contributions
Data curation, J.-B.K., J.-A.S., and I.-H.C.; formal analysis, S.S. and T.K.; project administration, J.-B.K., J.-A.S., and I.-H.C.; supervision, J.Y. and I.-H.C.; writing—original draft, S.S.; writing—review and editing, T.K. All authors have read and agree to the published version of the manuscript.
Funding
This research was funded by the Korea Electric Power Corporation R16TA29.
Conflicts of Interest
The authors declare no conflict of interest.
References
- Mishra, A.P.; Gorur, R.S.; Venkataraman, S. Evaluation of Porcelain and Toughened Glass Suspension Insulators Removed from Service. IEEE Trans. Dielectr. Electr. Insul. 2008, 15, 467–475. [Google Scholar] [CrossRef]
- Gorur Ravi, S. Failure Modes of Porcelain and Toughened Glass Suspension Insulators. In Proceedings of the IEEE Electrical Insulation Conference, Annapolis, MD, USA, 5–8 June 2011; pp. 221–225. [Google Scholar]
- Han, S.W. Thermal mechanical performance test on suspended insulators for transmission line. In Proceedings of the Conference Record of the 2004 IEEE International Symposium on Electrical Insulation, Indianapolis, IN, USA, 19–22 September 2004; pp. 300–303. [Google Scholar]
- Chaudhuri, S.P.; Sarkar, P. Dielectric behavior of porcelain in relation to constitution. Ceram. Int. 2000, 26, 865–875. [Google Scholar] [CrossRef]
- Mishra, A.P.; Gorur, R.S.; Venkataraman, S.; Kingsbury, D. Condition assessment of porcelain and toughened glass insulators from residual strength tests. In Proceedings of the IEEE Conference on Electrical Insulation and Dielectric Phenomena, Kansas City, MO, USA, 15–18 October 2006; pp. 413–416. [Google Scholar]
- Gorur, R.S.; Shaffner, D.; Clark, W.; Vinson, R.; Ruff, D. Utilities Share Their Insulator Field Experience. Transm. Distrib. World 2005, 57, 17–27. [Google Scholar]
- Meng, Y.; Gong, G.; Wu, Z.; Yin, Z.; Xie, Y.; Liu, S. Fabrication and microstructure investigation of ultra-high-strength porcelain insulator. J. Eur. Ceram. Soc. 2012, 32, 3043–3049. [Google Scholar] [CrossRef]
- Hettich, P.; Schell, K.G.; Oberacker, R.; Bucharsky, E.C.; Schulte Fischedick, J.; Hoffmann, M.J. Failure behavior of high performance porcelain insulators. Mater. Sci. Eng. Technol. 2017, 48, 792–799. [Google Scholar] [CrossRef]
- Riahi Noori, N.; Sarraf Mamoory, R.; Mehraeen, S. Effect of Materials Design on Properties of Porcelain Insulators. Am. Ceram. Soc. Bull. 2007, 86, 9201–9205. [Google Scholar]
- Cho, H.G.; Han, S.W.; Park, K.H.; Han, D.H. Ageing Characteristics of Porcelain Suspension Insulators for Transmission Line by Cool and Heat Accelerate Method. In Proceedings of the 7th International Conference on Properties and Applications of Dielectric Materials, Nagoya, Japan, 1–5 June 2003; pp. 161–167. [Google Scholar]
- Han, S.W.; Cho, H.G. A study on electrical and mechanical simulation for designing porcelain insulators with high strength. In Proceedings of the ICEE 2002 Proceeding, Jeju, Korea, 14–17 June 2002; Volume 13, pp. 1191–1194. [Google Scholar]
- Pivaa, R.H.; Vilarinhob, P.; Morellic, M.R.; Fiorid, M.A.; Montedod, O.R.K. Influence of Fe2O3 content on the dielectric behavior of aluminous porcelain insulators. Ceram. Int. 2013, 39, 7323–7330. [Google Scholar] [CrossRef]
- Schulte-Fischedick, J.; Singh, P.; Lehretz, F.; Hettich, P.; Bucharsky, C.; Schell, G.; Hoffmann, M.J.; Marthen, W.; Wekenborg, H.; Pohlmann, H. Materials Based Lifetime Assessment of Porcelain Insulators. In The International Symposium on High Voltage Engineering ISH, Proceedings of the 21st International Symposium on High Voltage Engineering; Springer: Berlin/Heidelberg, Germany, 2019; Volume 599, pp. 528–539. [Google Scholar]
- Choi, I.; Kim, T.; Yoon, Y.; Yi, J.; Kim, S. Lifetime Assessments on 154 kV Transmission Porcelain Insulators with a Bayesian Approach. Korean Inst. Electr. Electron. Mater. Eng. 2017, 30, 551–557. [Google Scholar]
- Rawat, A.; Gorur, R.S. Microstructure based evaluation of field aged and new porcelain suspension insulators. IEEE Trans. Electr. Insul. 2009, 16, 107–115. [Google Scholar] [CrossRef]
- Baker, A.C.; Bernstorf, R.A.; Cherney, E.A.; Gorur, R.S.; Hill, R.J.; Lodi, Z.; Marra, S.; Powell, D.G.; Schwalm, A.E.; Shaffner, D.H.; et al. High voltage insulators mechanical load limits—Part I: Overhead line load and strength requirements. IEEE Trans. Power Del. 2012, 27, 1106–1115. [Google Scholar] [CrossRef]
- Abernethy, R. An Overview of Weibull Analysis, 5th ed.; Robert Abernethy: West Palm Beach, FL, USA, 1983; pp. 1–11. [Google Scholar]
- Se-Won, H.; In-Hyuk, C.; Dong-ll, L. Accelerating Aging of Transmission Line Porcelain Suspension Insulators by Autoclaving. In Proceedings of the Electrical Insulation Conference and Electrical Manufacturing Expo, Nashville, TN, USA, 22–24 October 2007; pp. 114–117. [Google Scholar]
- Cherney, E.A.; Baker, A.C.; Kuffel, J.; Lodi, Z.; Phillips. A.; Powell, D.G.; Stewart, G.A. Evaluation of and Replacement Strategies for Aged High Voltage Porcelain Suspension-Type Insulators. IEEE Trans. Power Del. 2014, 29, 275–282. [Google Scholar] [CrossRef]
- Baker, A.C.; Bernstorf, R.A.; Cherney, E.A.; Gorur, R.S.; Hill, R.J.; Lodi, Z.; Marra, S.; Powell, D.G.; Schwalm, A.E.; Shaffner, D.H.; et al. High voltage insulators mechanical load limits—Part II: Standards and recommendations. IEEE Trans. Power Del. 2012, 27, 2342–2349. [Google Scholar] [CrossRef]
- Han, S.-W.; Cho, H.-G.; Choi, I.-H.; Lee, D.-I. Failure Characteristics of Suspension-Type Porcelain Insulators on a 154kV Transmission Line. In Proceedings of the IEEE International Symposium on Electrical Insulation, Toronto, ON, Canada, 11–14 June 2006; pp. 118–121. [Google Scholar]
- ANSI/IEEE Std930. IEEE Guide for the Statistical Analysis of Electrical Insulation Voltage Endurance Data; IEEE: Piscataway, NJ, USA, 1987. [Google Scholar]
© 2020 by the authors. Licensee MDPI, Basel, Switzerland. This article is an open access article distributed under the terms and conditions of the Creative Commons Attribution (CC BY) license (http://creativecommons.org/licenses/by/4.0/).