Article

Permeate Flux and Rejection Behavior in Submerged Direct Contact Membrane Distillation Process Treating a Low-Strength Synthetic Wastewater

Department of Environmental Engineering, Inha University, 100 Inha-ro, Michuhol-gu, Incheon 22212, Korea
*
Author to whom correspondence should be addressed.
Appl. Sci. 2020, 10(2), 677; https://doi.org/10.3390/app10020677
Submission received: 12 November 2019 / Revised: 20 December 2019 / Accepted: 14 January 2020 / Published: 18 January 2020
(This article belongs to the Section Civil Engineering)

Abstract

:
The effects of operational conditions such as permeate recirculation velocity, mixing intensity, and trans-membrane temperature on the performances of hydrophobic polyethylene (PE) hollow-fiber membrane were investigated by operating the submerged direct contact membrane distillation (SDCMD) process treating a synthetic low-strength wastewater. Permeate flux of the membrane increased with increasing a permeate recirculation velocity through the fiber lumen. However, the effectiveness was less pronounced as the velocity was higher than 0.5 m/s. Increasing rotational speed to 600 rpm, which can lead to mixing intensity from a bulk wastewater toward hollow-fiber membrane, enhanced permeate flux. Feed temperature played a more significant role in enhancing permeate flux rather than a permeate temperature under constant trans-membrane temperature. The SDCMD process treating a synthetic low-strength wastewater achieved an excellent rejection efficiency which is higher than 97.8% for both chemical oxygen demand (CODCr) and total phosphorus (T-P) due to the hydrophobic property of membrane material which can allow water vapor through membrane. However, the rejection efficiency of the ammonia nitrogen (NH3-N) was relatively low at about 87.5% because ammonia gas could be volatized easily through membrane pores in SDCMD operation. In a long-term operation of the SDCMD process, the permeate flux decreased significantly due to progressive formation of inorganic scaling on membrane.

1. Introduction

Membrane distillation (MD) is a thermal-driven separation process that uses hydrophobic membranes as an excellent way to treat water and wastewater. Unlike pressure-driven membrane process, the driving force to produce membrane permeate is the vapor pressure difference between the two sides of the membrane pores, allowing for the mass transfer of the volatile solution components [1,2,3]. In addition, hydrostatic pressure encountered in MD is lower than that used in pressure-driven membrane processes such as reverse osmosis (RO) and nanofiltration (NF) [4]. One of the great advantages of the MD technology in water and wastewater treatment is that the industrial sources and renewable energies such as waste heat or solar energy can be used as the heat energy to operate MD system [5,6]. Interests in MD technology have been growing rapidly in the areas of seawater desalination due to relatively low fouling potentials and energy requirements compared to high-pressure driven membrane process [7,8]. Nevertheless, the MD process has disadvantages such as low permeate flux compared to NF or RO and high susceptibility permeate flux to the concentration and temperature of the feed conditions due to the concentration and temperature polarization phenomena [4]. Furthermore, few studies have been done to better understand the performances of MD processes in wastewater treatment in comparison to seawater desalination [9,10].
Direct contact membrane distillation (DCMD) is the most commonly used MD module configuration. In DCMD, both feed wastewater and permeate are in direct contact with a hydrophobic membrane. The water vapor transferred across the membrane is directly condensed in the permeate produced by the membrane module from which temperature is lower than feed one [4]. The DCMD is attractive particularly for wastewater treatment because it does not require external equipment such as vacuum pump or condensation plate, which may be necessary for other types of MD configuration such as air gap membrane distillation (AGMD), sweeping gas membrane distillation (SGMD) or vacuum membrane distillation (VMD) [11,12,13]. For DCMD, a submerged configuration using a bundle of hydrophobic hollow-fiber membranes is preferentially used [14,15,16]. Furthermore, the DCMD configuration is especially suitable for hybrid membrane technologies such as membrane distillation bioreactor (MDBR) or integrated forward osmosis-membrane distillation (FO-MD) [17,18,19].
Hollow-fiber membrane is considered more favorable than flat sheet membrane in submerged direct contact membrane distillation (SDCMD) process due to its high packing density as well as relative easiness in membrane module design. Nevertheless, thermal efficiency can often be lower as membrane packing density is higher because the permeate can be heated up through the geometry of hollow-fiber membrane [20,21,22]. Most of all, hydrodynamic conditions should affect trans-membrane temperature and permeate flux because they can influence temperature polarization. Recently, the interest in MD processes such as submerged configuration have grown rapidly for resource recovery from brine solution [23,24,25]. In a submerged MD configuration, temperature polarization across the membrane should occur more easily due to the lack of turbulence on the membrane surface compared to the cross-flow MD system [26]. However, the submerged MD system requires less energy and a smaller foot-print than that needed to generate a high cross-flow velocity from a side-stream of MD process. In addition, the submerged MD can be integrated with a bioreactor to obtain energy more easily, for example, anaerobic MD bioreactor process [19]. In spite of many advantages, there is still lack of effort applying the SDCMD process to understand the effect of operational conditions on MD performances in treatment of low-strength wastewater. The objectives of this study are to investigate the effect of operational conditions including permeate recirculation velocity into the lumen of hollow-fiber MD membrane and mixing intensity in SDCMD treating low-strength wastewater. Permeate flux was investigated systematically with respect to operational conditions. Membrane performances, such as the rejection of organics and nutrients including ammonia nitrogen (NH3-N) and total phosphorus (T-P), were also observed by conducting short-term and long-term operation with SDCMD.

2. Materials and Methods

2.1. Feed Wastewater and Membrane

In this study, synthetic wastewater consisting of sodium acetate anhydrous (C2H3NaO2, Duksan Chemicals, Korea) and sodium propionate (C3H5NaO2, TCI Chemicals, Korea) yielding chemical oxygen demand (CODCr) was prepared. Ammonium chloride (NH4Cl, Duksan Chemicals, Korea), potassium phosphate monobasic (KH2PO4, Daejung Chemicals, Korea), and sodium bicarbonate (NaHCO3, Duksan Chemicals, Korea) were prepared and applied as feed wastewater for SDCMD experiments. The synthetic wastewater tested in this study was based upon the low-strength feed wastewater prepared as feed for laboratory-scale anaerobic bioreactors [27,28]. The characteristics of the synthetic wastewater used in this study are shown in Table 1.
The polyethylene (PE) hollow-fiber membrane (Econity Co. Ltd., Yongin, Korea) was available with high hydrophobicity (contact angle is about 130°) and used for operating SDCMD system. The mean pore size of the commercially available PE membrane was customized as 0.1 μm and the porosity of the membrane was 50%. The outer and inner diameter of PE hollow-fiber membrane was 1100 and 750 μm, respectively. In this study, twenty fibers were assembled into a membrane holder specially designed and sealed by epoxy resin. The effective surface area of the hollow-fiber membrane tested was 84.3 cm2. The fiber length and distance between each fiber were 9.9 and 1.6 cm, respectively.

2.2. Experimental Set-Up and Performance Tests

A schematic diagram of experimental set-up of SDCMD process is illustrated in Figure 1. The synthetic wastewater prepared was placed into a feed tank with 5 L of effective volume made by tempered glass and stainless steel, in which a magnetic bar was stirred for generating mixing intensity in bulk wastewater. The feed temperature was controlled by using a digital hotplate (MSH-20D, Daihan Scientific, Wonju, Korea). The hollow-fiber membrane module was submerged horizontally and located at about two third of depth from the free surface of wastewater in the feed tank. Digital pressure gauges were connected at inlet and outlet tubing from MD membrane to monitor hydraulic pressure of fiber lumen. Two thermometers were submerged into both feed and permeate tank to monitor water temperatures. Permeate produced by the hollow-fiber membrane was recirculated into the permeate tank with 0.5 L of volume through a water chiller (RBC-20, JEIO Tech, Daejeon, Korea) using a gear pump (WT3000-1FA, Longer Pump, Hebei, China). Deionized (DI) water was filled initially in the permeate tank. The weight of permeate accumulated into the permeate tank with time was measured by using an electric balance (FZ-5000i, A&D Company, Tokyo, Japan). The SDCMD tests were performed over both the short-term (1 h) and long-term period (180 h) in this study.

2.3. Analytical Methods

Permeate flux (N) from the hollow-fiber membrane in operating the SDCMD process was calculated by measuring the weight of permeate with time on electric balance and effective surface area of membrane using Equation (1) as below [29].
N ( L m 2 · h ) = Weight   increase   of   permeate   tan k   ( kg ) ÷ densityof   water   ( kg / L ) membrane   effective   area   ( m 2 ) × operation   time   ( h )
The density of membrane permeate was considered as the same as to the one of the pure water (ρw = 103 kg/m3). The permeate temperature was maintained as 20 °C by using the chiller yielding experimental error of permeate flux caused by the change of permeate temperature was within 0.2%. The rejection of organic contaminants and nutrients such as ammonia nitrogen and total phosphorus were estimated by using Equation (2) [30].
Rejection   ( % ) = ( 1 C p C f ) × 100
where Cp and Cf are concentration of target compound to be removed in permeate at the end of SDCMD operation and feed wastewater, respectively. A permeate pH was measured by using a pH meter (Orion VersaStar Pro, Thermo Scientific, Waltham, MA, USA). The CODCr was measured by Standard Methods (APHA, 2012) while ammonia nitrogen and total phosphorus were determined by using reagent kits and spectrophotometer (DR3900, Hach Lange, Loveland, CO, USA. Concentration ranges detected by reagent kits to measure ammonia nitrogen and total phosphorus were 0.4–50.0 mg/L NH3-N, 0–3.5 mg/L PO43−-P, respectively.

3. Results and Discussion

3.1. Effect of Permeate Recirculation Velocity and Trans-Membrane Temperature

Figure 2A illustrates the permeate flux with respect to the permeate recirculation velocity at feed and permeate temperature of 55 and 20 °C, respectively. The permeate recirculation velocity was calculated by dividing recirculating permeate flow rate by cross-sectional area of fiber lumen. The results show that permeate flux increases with increasing permeate recirculation velocity but approaches an asymptotic value when the velocity is higher than 0.5 m/s. An increase in the permeate recirculation velocity could prevent temperature drop in MD permeate while it was flowed through fiber lumen. Thus, vapor pressure difference can be maintained so that it can result in stable permeate flux [31,32]. As the permeate recirculation velocity increases, the Reynolds number (Re) also increases along the hollow-fiber membrane. When the permeate recirculation velocity increased from 0.2 to 0.8 m/s, the value of Re was increased from 332 to 1162 based upon water density and viscosity at 20 °C. Since the conductivity in MD permeate was very low (less than 30 μS/cm) as observed in this study, the experimental error in estimating Re at 20 °C was within 0.2% only. The permeate flux increased proportionally with Re number, but the flux approached to the steady value as it was higher than 664. The tendency of experimental result shows that the thickness of thermal boundary layer in permeate stream is reduced by increasing the permeate recirculation velocity even under laminar region (Re < 2100). As a result, an increase of permeate recirculation velocity enhances transverse vapor flux through membrane [33,34,35].
Figure 2A also shows the effect of mixing intensity driven by the rotational speed using a magnetic bar in the feed tank on MD performances. Enhancing the mixing intensity of feed wastewater tends to reduce concentration and temperature polarization layer on membrane surface [36,37]. Nevertheless, the beneficial effect of mixing intensity on the permeate flux was not observed as the rate was higher than 600 rpm. In the SDCMD process, inducing mixing intensity in feed wastewater should be the only way to control thermal polarization formed on membrane due to temperature gradient. Higher mixing in feed wastewater is associated with more turbulence on the membrane surface, thereby improving the permeate flux across membrane. However, there was no beneficial effect on enhancing permeate flux as the mixing intensity was higher than the critical value probably due to the limitation of the size of the wake region in fluid mixing which creates secondary flows and/or local mixing on membrane.
The permeate fluxes through the hydrophobic membrane in SDCMD process vary dependent upon the feed temperature due to water vapor pressure change [38,39]. Figure 2B shows that the permeate flux increases as trans-membrane temperature increases from 15 to 40 °C almost exponentially under constant permeate recirculation velocity and mixing intensity of 0.5 m/s and 600 rpm, respectively. The extent to which the enhancement of permeate flux was more pronounced by higher feed temperature rather than that at lower permeate temperature. Permeate flux increased linearly with the permeate temperature as the feed temperature was fixed at 55 °C, indicating that controlling feed temperature should affect permeate flux more dominantly. The theoretical value of permeate flux was calculated by using the MD coefficient from the preparatory experiment using DI water under the corresponding operational condition with Equations (3) and (4).
The mass transfer coefficient was estimated as an indicator to observe the impact of temperature on permeate flux using Equation (3) as below.
N v = C × Δ P = C × ( P fm P pm )
where Nv is vapor flux in SDCMD process, C is MD coefficient, ΔP (kPa) is the pressure difference, Pfm and Ppm are vapor pressure on the membrane surface at feed and permeate side, respectively. Water vapor pressure was calculated by using Antonine equation as below [40].
P = exp ( 23.238 3841 T m 45 )
where P is the vapor pressure of solution, Tm is the temperature of solution near membrane surface as unit of Kelvin (K). Permeate fluxes calculated by using mass transfer coefficient agreed very well with experimental observations, as shown in Figure 2B. Overall MD coefficient calculated by Equations (3) and (4) was within 6.8% of experimental error, suggesting that the membrane permeability in SDCMD be remained at an average 0.4 L/m2-hr-kPa.

3.2. Variations of Solution pH with Operational Conditions

Figure 3 shows the changes of solution pH measured in both feed wastewater and permeate produced by SDCMD process with changes of operating parameter. Experiments were performed under the permeate recirculation velocity of 0.5 m/s, mixing intensity of 600 rpm, feed temperature of 55 °C and permeate temperature of 20 °C for each experimental condition. As shown in Figure 3A, increasing a permeate recirculation velocity as mixing intensity, feed and permeate temperature are constant reduces a permeate pH from 7.1 to 6.7. This can be explained by the transport of CO2 from the feed wastewater toward permeate side through hydrophobic MD membrane [41]. Since higher recirculation velocity through fiber lumen can mitigate the increase in permeate temperature during MD operation, it allows more CO2 dissolved in MD permeate. Furthermore, mass transfer through the membrane walls can be improved by increasing permeate recirculation velocity. It has been reported that enhancing mass transfer allows the passage of volatile fatty acid (VFA) such as sodium acetate and sodium propionate in feed wastewater through membrane easily [42]. However, there was no significant impacts of mixing intensity on solution pH when other operational parameters were constant as shown in Figure 3B. This may be caused by the fact that mixing in feed wastewater through SDCMD process can reduce the concentration or thermal polarization on the outer surface of membrane more rather than mass transfer of CO2 towards the fiber lumen.
The results shown in Figure 3C indicates that the increase of feed temperature leads to an increase of the solution pH in both feed wastewater and permeate as recirculation velocity and mixing intensity are 0.5 m/s and 600 rpm, respectively. However, as shown in Figure 3D, increasing the permeate temperature did not change the pHs in both feed wastewater and MD permeate. Ammonia transfer is driven by the difference in partial pressure of ammonia gas between feed wastewater and permeate. An explanation is that higher feed temperature can allow more ionization of the bicarbonate ions (HCO3) into carbonate ions (CO32−), leading to increase a feed wastewater pH [43]. In addition, an increase in temperature of feed wastewater should facilitate the volatilization of ammonium ion (NH4+) into ammonia gas which can be passed through the hydrophobic membrane easily. With synthetic wastewater tested in this study, ammonia nitrogen can exist mainly as two forms of nitrogen consisting of volatile ammonia and ammonium ions. The solubility of ammonia in feed wastewater can be decreased by increasing its temperature. The vaporization of dissolved ammonia across the membrane should reduce the rejection of ammonium nitrogen. As a result, permeate pH should be increased due to the formation of ammonia nitrogen as shown below [44].
NH 3 + H 2 O NH 4 + + OH
At the 25 °C feed temperature, the rate constant in forward reaction (kA) in Equation (5) is 1.8 × 10⁻⁵ while the constant in backward reaction (kB) is 5.6 × 10⁻¹⁰. This means that the rate of forward reaction with a formation of ammonium ion is almost 3.2 × 10⁴ times faster than that occurring toward the formation of ammonia gas [45]. Consequently, the ammonia gas passed through the membrane can be ionized into ammonium ion quickly, thereby increasing the permeate pH [43,46].

3.3. Membrane Rejections

Figure 4 shows rejection efficiencies of organics and phosphorus at the same operational conditions applied in Figure 3. Results in Figure 4A through D show that the rejection efficiency of organics and phosphorus are very high as 98.3 and 99.9%, respectively regardless of all operational conditions such as permeate recirculation velocity, mixing intensity, feed temperature and permeate temperature. The phosphate ions (PO43−) can lead to the formation of inorganic precipitation which can be associated with magnesium and calcium ions such as Mg3(PO4)2, Ca3(PO4)2 or NH4MgPO4 and this can contribute to high phosphorus rejection efficiency [47,48,49]. However, the rejection of ammonia nitrogen was relatively low, yielding 80.6%–91.3% depending upon operational conditions. Figure 4C shows that increasing feed temperature reduces the rejection of ammonia significantly. A lower rejection of ammonia nitrogen is caused by more fraction of NH3 gas formed in MD permeate at higher feed temperature due to its more vaporization through the membrane in the SDCMD process as discussed above [50,51].

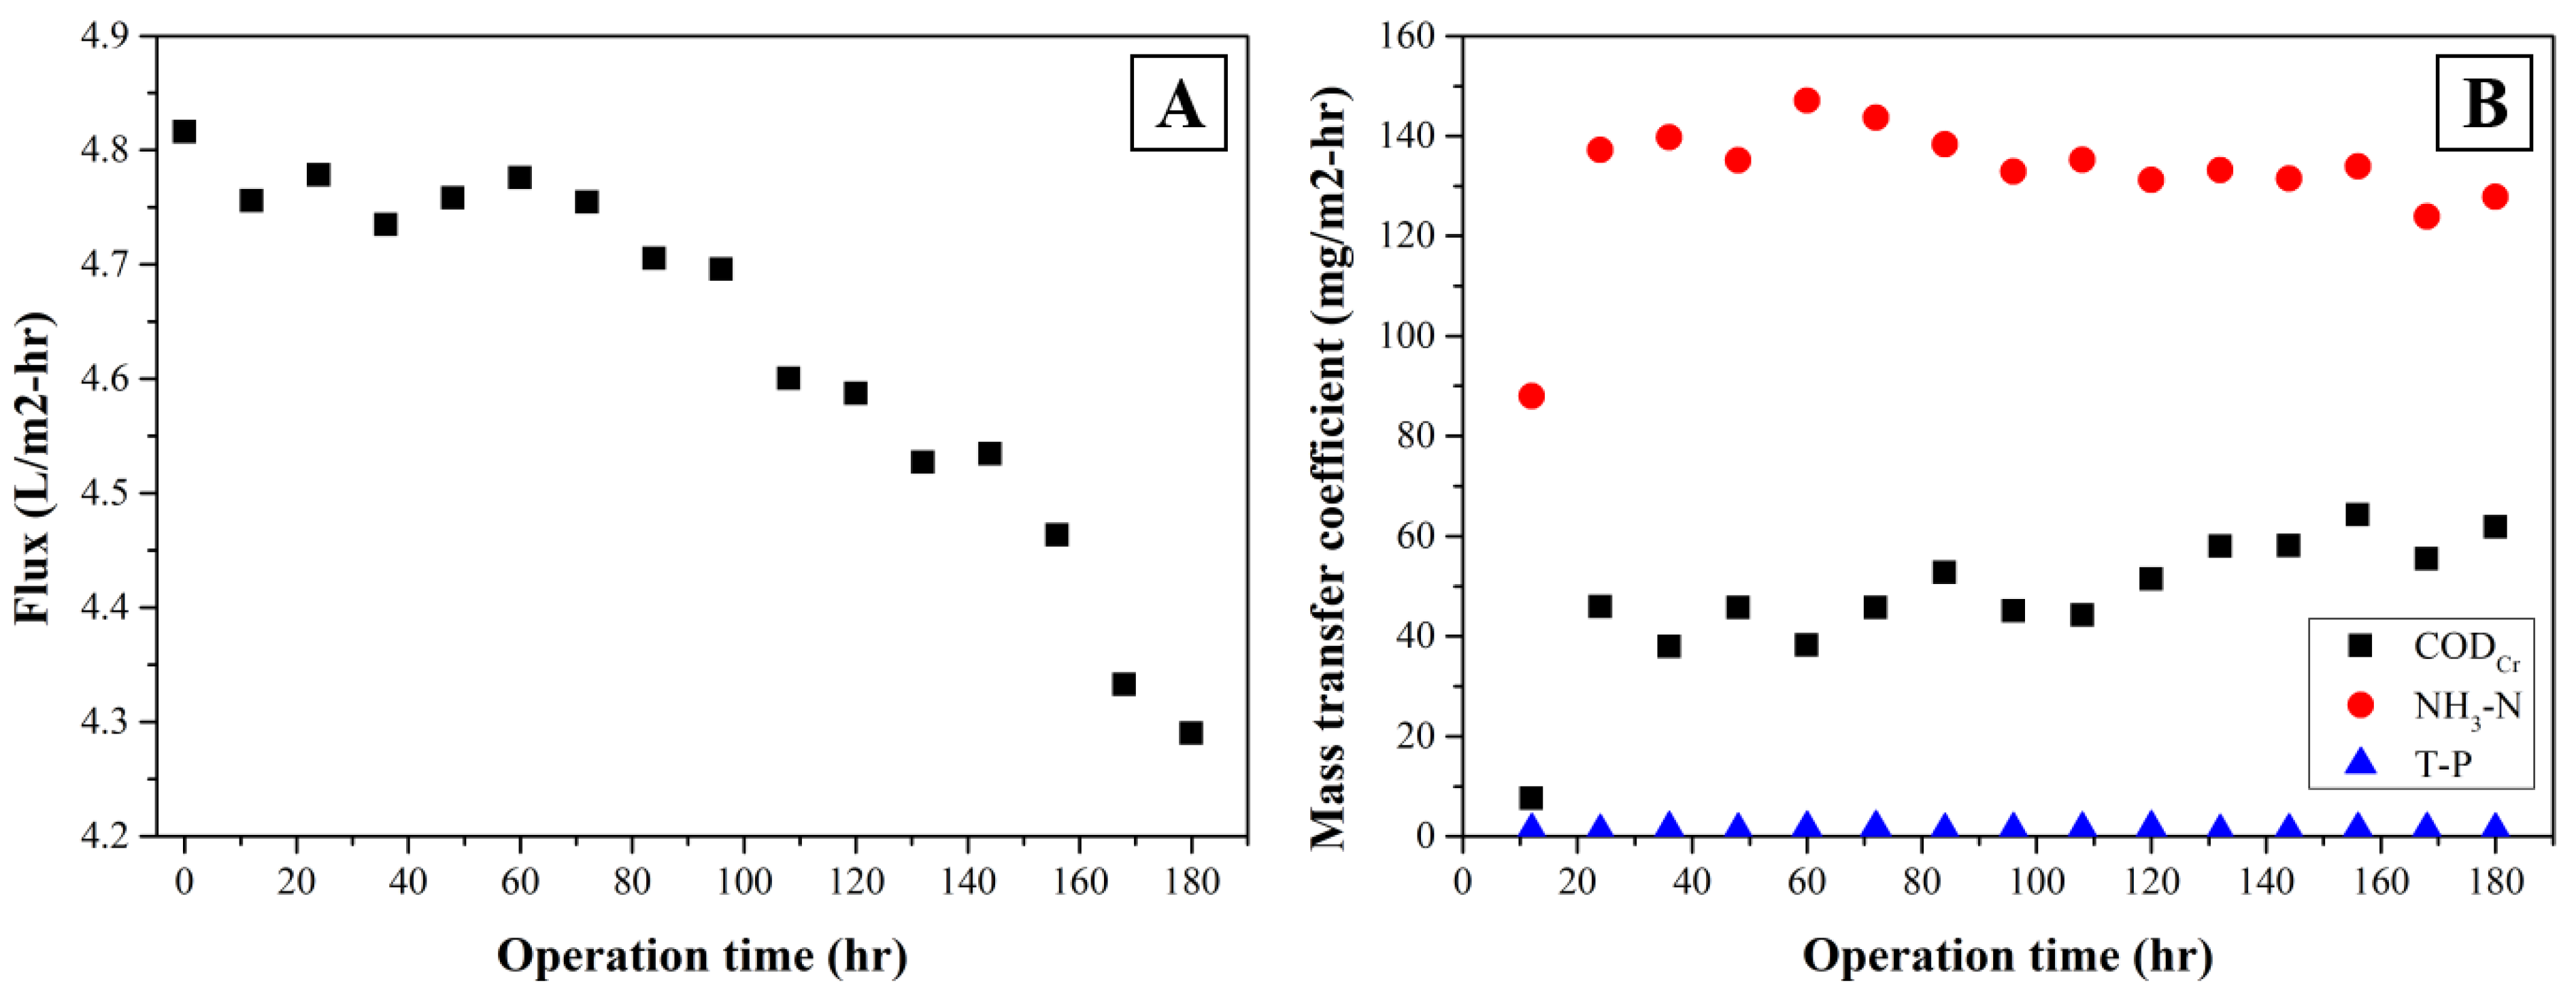
3.4. Long-Term Operation of SDCMD Process

Long-term operation of the SDCMD process was conducted at 0.5 m/s of permeate recirculation velocity, 600 rpm of mixing intensity, 55 °C of feed temperature, and 20 °C of permeate temperature. A temperature in feed wastewater was replenished regularly to maintain a constant water level in the feed tank. Permeate flux from the membrane decreased slowly with operation time, but it was dropped rapidly after 72 h of operation (Figure 5A). Mass transfer coefficients of organics and nutrients are also shown in Figure 5B. The concentration of each component was measured immediately after taking the samples. As mentioned above, ammonia nitrogen in feed wastewater can be passed through the membrane as form of ammonia gas which can be continuously transferred into permeate water. The mass transfer coefficient associated with ammonia nitrogen was estimated about 131.9 ± 12.1 mg/m2-h during 180 h operation. The concentration of ammonia nitrogen in MD permeate was similar to the concentration of it from the feed wastewater after 24 h continuous SDCMD operation.
From the SDCMD process, the transfer of organic compounds such as VFA can occur through membrane. The results show that the mass transfer of VFA through MD membrane slightly increased and reached at 59.5 ± 4.8 mg/m2-h at the end of the long-term experiment due to volatilization of VFA as discussed [29]. In contrast, the SDCMD process showed excellent rejection of phosphorus yielding relatively low mass transfer coefficient which is about 1.3 ± 0.4 mg/m2-h as compared to organics and ammonia nitrogen. Therefore, it appeared that membrane wetting did not affect membrane performances significantly during the long-term operation of SDCMD.
A reduction in permeate flux from the MD membrane is caused by membrane fouling formed, as evidenced by scanning electron microscope (SEM) images and energy dispersive X-ray (EDX) analysis. External fouling on the membrane surface became more serious during longer SDCMD operation. Figure 6 shows the presence of carbon (C), nitrogen (N), oxygen (O), magnesium (Mg), phosphorus (P), and calcium (Ca) ions on the membrane surface as detected by EDX analysis using fouled membrane (Figure 6D). The presence of C, O, and N peaks is often representative of organic fouling [52]. The detection of Ca, P, and Mg ions on membrane can also support the presence of inorganic precipitates such as CaCO3, MgCO3, and Ca3(PO4)2 [53]. Among these inorganic scales, the CaCO3 and Ca3(PO4)2 are thought to be dominant as external resistance against permeate flux through MD membrane. Obviously, high rejection of phosphorus across SDCMD process as shown in Figure 5B is not only caused by the membrane rejection but also due to the formation of inorganic precipitates on the membrane surface [54,55].

4. Conclusions

Attempts were made by applying the SDCMD process for improving the rejection of contaminants such as nutrients present in low-strength synthetic wastewater. The results obtained show that the increase in permeate recirculation velocity through the lumen of the hollow-fiber membrane treating synthetic wastewater increased permeate flux. However, there was no beneficial effect on permeate flux as the velocity was higher than 0.5 m/s. Similarly, permeate flux was enhanced by increasing a mixing intensity in the SDCMD process, but the effectiveness was limited as the intensity was higher than 600 rpm. Permeate flux was affected by controlling the feed temperature more dominantly than permeate temperature. For all operational conditions, the rejection of organics and phosphorus were higher than 98.3% and 97.8%, respectively, but the rejection of ammonia nitrogen was relatively low (87.5%). Increasing feed wastewater temperature decreased the rejection of ammonia nitrogen due to its volatilization across the membrane into ammonia gas. Further research is needed to fully understand the performances of SDCMD process using real wastewater such as domestic sewage. More research should also be directed at developing hybrid MD combined to improve the removal of nutrients and energy saving.

Author Contributions

Conceptualization, W.B. and J.K.; methodology, W.B. and J.K.; investigation, W.B., original draft preparation; W.B.; writing-review and editing, J.K.; supervisions, J.K. All authors have read and agreed to the published version of the manuscript.

Funding

This research was funded by the National Research Foundation (NRF) of Korea, 2017R1A2B4007804.

Acknowledgments

This research was supported by Basic Science Research Program through the National Research Foundation (NRF) of Korea funded by the Ministry of Science and ICT (2017R1A2B4007804).

Conflicts of Interest

The authors declare no conflict of interest.

References

  1. Schofield, R.W.; Fane, A.G.; Fell, C.J.D. Heat and mass transfer in membrane distillation. J. Membr. Sci. 1987, 33, 299–313. [Google Scholar] [CrossRef]
  2. Rezaei, M.; Warsinger, D.M.; Lienhard V, J.H.; Duke, M.C.; Matsuura, T.; Samhaber, W.M. Wetting phenomena in membrane distillation: Mechanisms, reversal, and prevention. Water Res. 2018, 139, 329–352. [Google Scholar] [CrossRef] [PubMed]
  3. El-Bourawi, M.S.; Ding, Z.; Ma, R.; Khayet, M. A framework for better understanding membrane distillation separation process. J. Membr. Sci. 2006, 285, 4–29. [Google Scholar] [CrossRef]
  4. Alkhudhiri, A.; Darwish, N.; Hilal, N. Membrane distillation: A comprehensive review. Desalination 2012, 287, 2–18. [Google Scholar] [CrossRef]
  5. Francis, L.; Ghaffour, N.; Alsaadi, A.A.; Amy, G.L. Material gap membrane distillation: A new design for water vapor flux enhancement. J. Membr. Sci. 2013, 448, 240–247. [Google Scholar] [CrossRef] [Green Version]
  6. Dow, N.; Gray, S.; Li, J.; Zhang, J.; Ostarcevic, E.; Liubinas, A.; Atherton, P.; Roeszler, G.; Gibbs, A.; Duke, M. Pilot trial of membrane distillation driven by low grade waste heat: Membrane fouling and energy assessment. Desalination 2016, 391, 30–42. [Google Scholar] [CrossRef]
  7. Susanto, H. Towards practical implementations of membrane distillation. Chem. Eng. Process. 2011, 50, 139–150. [Google Scholar] [CrossRef]
  8. Mariah, L.; Buckley, C.A.; Brouckaert, C.J.; Curcio, E.; Drioli, E.; Jaganyi, D.; Ramjugernath, D. Membrane distillation of concentrated brines-Role of water activities in the evaluation of driving force. J. Membr. Sci. 2006, 280, 937–947. [Google Scholar] [CrossRef]
  9. Lawson, K.W.; Lloyd, D.R. Membrane distillation. II. Direct contact MD. J. Membr. Sci. 1996, 120, 123–133. [Google Scholar] [CrossRef]
  10. Manawi, Y.M.; Khraisheh, M.; Fard, A.K.; Benyahia, F.; Adham, S. Effect of operational parameters on distillate flux in direct contact membrane distillation (DCMD): Comparison between experimental and model predicted performance. Desalination 2014, 336, 110–120. [Google Scholar] [CrossRef]
  11. Khayet, M.; Godino, P.; Mengual, J.I. Nature of flow on sweeping gas membrane distillation. J. Membr. Sci. 2000, 170, 243–255. [Google Scholar] [CrossRef]
  12. Khayet, M.; Cojocaru, C. Air gap membrane distillation: Desalination, modeling and optimization. Desalination 2012, 287, 138–145. [Google Scholar] [CrossRef]
  13. Chiam, C.K.; Sarbatly, R. Vacuum membrane distillation processes for aqueous solution treatment-A review. Chem. Eng. Process. 2014, 74, 27–54. [Google Scholar] [CrossRef]
  14. Qtaishat, M.R.; Banat, F. Desalination by solar powered membrane distillation systems. Desalination 2013, 308, 186–197. [Google Scholar] [CrossRef]
  15. Al-Obaidani, S.; Curcio, E.; Macedonio, F.; Di Profio, G.; Al-Hinai, H.; Drioli, E. Potential of membrane distillation in seawater desalination: Thermal efficiency, sensitivity study and cost estimation. J. Membr. Sci. 2008, 323, 85–98. [Google Scholar] [CrossRef]
  16. Hou, D.; Dai, G.; Fan, H.; Huang, H.; Wang, J. An ultrasonic assisted direct contact membrane distillation hybrid process for desalination. J. Membr. Sci. 2015, 476, 59–67. [Google Scholar] [CrossRef]
  17. Wang, K.Y.; Teoh, M.M.; Nugroho, A.; Chung, T.S. Integrated forward osmosis-membrane distillation (FO-MD) hybrid system for the concentration of protein solutions. Chem. Eng. Sci. 2011, 66, 2421–2430. [Google Scholar] [CrossRef]
  18. Phattaranawik, J.; Fane, A.G.; Pasquier, A.C.S.; Bing, W. A novel membrane bioreactor based on membrane distillation. Desalination 2008, 223, 386–395. [Google Scholar] [CrossRef]
  19. Yao, M.; Woo, Y.C.; Ren, J.; Tijing, L.D.; Choi, J.S.; Kim, S.H.; Shon, H.K. Volatile fatty acids and biogas recovery using thermophilic anaerobic membrane distillation bioreactor for wastewater reclamation. J. Environ. Manag. 2019, 231, 833–842. [Google Scholar] [CrossRef]
  20. Choi, Y.; Naidu, G.; Jeong, S.; Vigneswaran, S.; Lee, S.; Wang, R.; Fane, A.G. Experimental comparison of submerged membrane distillation configurations for concentrated brine treatment. Desalination 2017, 420, 54–62. [Google Scholar] [CrossRef]
  21. Wan, C.F.; Yang, T.; Lipscomb, G.G.; Stookey, D.J.; Chung, T.S. Design and fabrication of hollow fiber membrane modules. J. Membr. Sci. 2017, 538, 96–107. [Google Scholar] [CrossRef]
  22. Guillen-Burrieza, E.; Ruiz-Aguirre, A.; Zaragoza, G.; Arafat, H.A. Membrane fouling and cleaning in long term plant-scale membrane distillation operations. J. Membr. Sci. 2014, 468, 360–372. [Google Scholar] [CrossRef]
  23. Mericq, J.P.; Laborie, S.; Cabassud, C. Evaluation of systems coupling vacuum membrane distillation and solar energy for seawater desalination. Chem. Eng. J. 2011, 166, 596–606. [Google Scholar] [CrossRef]
  24. Choi, Y.; Naidu, G.; Jeong, S.; Lee, S.; Vigneswaran, S. Fractional-submerged membrane distillation crystallizer (F-SMDC) for treatment of high salinity solution. Desalination 2018, 440, 59–67. [Google Scholar] [CrossRef]
  25. Julian, H.; Ye, Y.; Li, H.; Chen, V. Scaling mitigation in submerged vacuum membrane distillation and crystallization (VMDC) with periodic air-backwash. J. Membr. Sci. 2018, 547, 19–33. [Google Scholar] [CrossRef]
  26. Martínez-Díez, L.; Florido-Díaz, F.J.; Vázquez-González, M.I. Study of evaporation efficiency in membrane distillation. Desalination 1999, 126, 193–198. [Google Scholar] [CrossRef]
  27. Wäeger-Baumann, F.; Fuchs, W. The Application of Membrane Contactors for the Removal of Ammonium from Anaerobic Digester Effluent. Sep. Sci. Technol. 2012, 47, 1436–1442. [Google Scholar] [CrossRef]
  28. Charfi, A.; Park, E.; Aslam, M.; Kim, J. Particle-sparged anaerobic membrane bioreactor with fluidized polyethylene terephthalate beads for domestic wastewater treatment: Modelling approach and fouling control. Bioresour. Technol. 2018, 258, 263–269. [Google Scholar] [CrossRef]
  29. Tibi, F.; Guo, J.; Ahmad, R.; Lim, M.; Kim, M.; Kim, J. Membrane distillation as post-treatment for anaerobic fluidized bed membrane bioreactor for organic and nitrogen removal. Chemosphere 2019, 234, 756–762. [Google Scholar] [CrossRef]
  30. Hubadillah, S.K.; Othman, M.H.D.; Matsuura, T.; Rahman, M.A.; Jaafar, J.; Ismail, A.F.; Amin, S.Z.M. Green silica-based ceramic hollow fiber membrane for seawater desalination via direct contact membrane distillation. Sep. Purif. Technol. 2018, 205, 22–31. [Google Scholar] [CrossRef]
  31. Ali, A.; Tsai, J.H.; Tung, K.L.; Drioli, E.; Macedonio, F. Designing and optimization of continuous direct contact membrane distillation process. Desalination 2018, 426, 97–107. [Google Scholar] [CrossRef]
  32. Yang, X.; Wang, R.; Shi, L.; Fane, A.G.; Debowski, M. Performance improvement of PVDF hollow fiber-based membrane distillation process. J. Membr. Sci. 2011, 369, 437–447. [Google Scholar] [CrossRef] [Green Version]
  33. Banat, F.A.; Simandl, J. Theoretical and experimental study in membrane distillation. Desalination 1994, 95, 39–52. [Google Scholar] [CrossRef]
  34. Bouguecha, S.; Chouikh, R.; Dhahbi, M. Numerical study of the coupled heat and mass transfer in membrane distillation. Desalination 2003, 152, 245–252. [Google Scholar] [CrossRef]
  35. Srisurichan, S.; Jiraratananon, R.; Fane, A.G. Mass transfer mechanisms and transport resistances in direct contact membrane distillation process. J. Membr. Sci. 2006, 277, 186–194. [Google Scholar] [CrossRef]
  36. Meng, S.; Hsu, Y.C.; Ye, Y.; Chen, V. Submerged membrane distillation for inland desalination applications. Desalination 2015, 361, 72–80. [Google Scholar] [CrossRef]
  37. Zuo, J.; Bonyadi, S.; Chung, T.S. Exploring the potential of commercial polyethylene membranes for desalination by membrane distillation. J. Membr. Sci. 2016, 497, 239–247. [Google Scholar] [CrossRef]
  38. Gryta, M. The study of performance of polyethylene chlorinetrifluoroethylene membranes used for brine desalination by membrane distillation. Desalination 2016, 398, 52–63. [Google Scholar] [CrossRef]
  39. Razmjou, A.; Arifin, E.; Dong, G.; Mansouri, J.; Chen, V. Superhydrophobic modification of TiO2 nanocomposite PVDF membranes for applications in membrane distillation. J. Membr. Sci. 2012, 415–416, 850–863. [Google Scholar] [CrossRef]
  40. Yun, Y.; Ma, R.; Zhang, W.; Fane, A.G.; Li, J. Direct contact membrane distillation mechanism for high concentration NaCl solutions. Desalination 2006, 188, 251–262. [Google Scholar] [CrossRef]
  41. Liu, Y.; Hou, M.; Yang, G.; Han, B. Solubility of CO2 in aqueous solutions of NaCl, KCl, CaCl2 and their mixed salts at different temperatures and pressures. J. Supercrit. Fluids 2011, 56, 125–129. [Google Scholar] [CrossRef]
  42. Jacob, P.; Phungsai, P.; Fukushi, K.; Visvanathan, C. Direct contact membrane distillation for anaerobic effluent treatment. J. Membr. Sci. 2015, 475, 330–339. [Google Scholar] [CrossRef]
  43. Nguyen, Q.M.; Lee, S. Fouling analysis and control in a DCMD process for SWRO brine. Desalination 2015, 367, 21–27. [Google Scholar] [CrossRef]
  44. EL-Bourawi, M.S.; Khayet, M.; Ma, R.; Ding, Z.; Li, Z.; Zhang, X. Application of vacuum membrane distillation for ammonia removal. J. Membr. Sci. 2007, 301, 200–209. [Google Scholar] [CrossRef]
  45. Zhu, Z.; Hao, Z.; Shen, Z.; Chen, J. Modified modeling of the effect of pH and viscosity on the mass transfer in hydrophobic hollow fiber membrane contactors. J. Membr. Sci. 2005, 250, 269–276. [Google Scholar] [CrossRef]
  46. Gryta, M. Alkaline scaling in the membrane distillation process. Desalination 2008, 228, 128–134. [Google Scholar] [CrossRef]
  47. Liu, C.; Chen, L.; Zhu, L. Application of membrane distillation for the treatment of anaerobic membrane bioreactor effluent: An especial attention to the operating conditions. Chemosphere 2018, 208, 530–540. [Google Scholar] [CrossRef]
  48. Battistoni, P.; De Angelis, A.; Pavan, P.; Prisciandaro, M.; Cecchi, F. Phosphorus removal from a real anaerobic supernatant by struvite crystallization. Water Res. 2001, 35, 2167–2178. [Google Scholar] [CrossRef]
  49. Seckler, M.M.; Bruinsma, O.S.L.; Van Rosmalen, G.M. Calcium phosphate precipitation in a fluidized bed in relation to process conditions: A black box approach. Water Res. 1996, 30, 1677–1685. [Google Scholar] [CrossRef]
  50. Semmens, M.J.; Foster, D.M.; Cussler, E.L. Ammonia removal from water using microporous hollow fibers. J. Membr. Sci. 1990, 51, 127–140. [Google Scholar] [CrossRef]
  51. Kim, S.; Lee, D.W.; Cho, J. Application of direct contact membrane distillation process to treat anaerobic digestate. J. Membr. Sci. 2016, 511, 20–28. [Google Scholar] [CrossRef]
  52. Naidu, G.; Jeong, S.; Kim, S.J.; Kim, I.S.; Vigneswaran, S. Organic fouling behavior in direct contact membrane distillation. Desalination 2014, 347, 230–239. [Google Scholar] [CrossRef]
  53. Tijing, L.D.; Woo, Y.C.; Choi, J.S.; Lee, S.; Kim, S.H.; Shon, H.K. Fouling and its control in membrane distillation-A review. J. Membr. Sci. 2015, 475, 215–244. [Google Scholar] [CrossRef]
  54. Warsinger, D.M.; Swaminathan, J.; Guillen-Burrieza, E.; Arafat, H.A.; Lienhard V, J.H. Scaling and fouling in membrane distillation for desalination applications: A review. Desalination 2015, 356, 294–313. [Google Scholar] [CrossRef]
  55. Chernicharo, C.A.L. Post-treatment options for the anaerobic treatment of domestic wastewater. Rev. Environ. Sci. Biotechnol. 2006, 5, 73–92. [Google Scholar] [CrossRef]
Figure 1. Experimental set-up of laboratory scaled SDCMD process (PI: pressure indicator, TI: temperature indicator).
Applsci 10 00677 g001
Figure 2. Permeate flux changes with operational parameters (A) permeate recirculation velocity and mixing intensity, (B) trans-membrane temperature.
Applsci 10 00677 g002
Figure 3. Variations of pH in feed wastewater and permeate after 1 h of operation time with respect to the permeate recirculation velocity (A), mixing intensity (B), feed temperature (C) and permeate temperature (D) (background operational condition; permeate recirculation velocity of 0.5 m/s, mixing intensity of 600 rpm, feed temperature of 55 °C and permeate temperature of 20 °C).
Applsci 10 00677 g003
Figure 4. Rejection efficiency of CODCr, NH3-N and T-P with operational parameters of SDCMD process after 1 h of operational time with respect to permeate recirculation velocity (A), mixing intensity (B), feed temperature (C) and permeate temperature (D) (background operational condition; permeate recirculation velocity of 0.5 m/s, mixing intensity of 600 rpm, feed temperature of 55 °C and permeate temperature of 20 °C).
Applsci 10 00677 g004
Figure 5. Variation of permeate flux (A) and mass transfer coefficients (B) in long-term operation.
Applsci 10 00677 g005
Figure 6. SEM/EDX analysis of raw (A,C) and fouled (B,D) membrane surface.
Applsci 10 00677 g006
Table 1. Composition of synthetic wastewater for the submerged direct contact membrane distillation (SDCMD) process.
Chemical Oxygen Demand (mg COD /L)Ammonia Nitrogen (mg NH3-N/L)Total Phosphorus (mg PO43-P/L)Conductivity (μS/cm)pH
282.6 ± 5.732.2 ± 1.35.3 ± 0.1971.4 ± 4.07.7 ± 0.1

