Article

Analysis of the Cause and Mechanism of Hydraulic Gate Vibration during Flood Discharging from the Perspective of Structural Dynamics

1
State Key Laboratory of Hydraulic Engineering Simulation and Safety, Tianjin University, Tianjin 300350, China
2
Postdoctoral Workstation, Yellow River Engineering Consulting Co., Ltd., Zhengzhou 450003, China
3
Postdoctoral Research Station of Water Conservancy Engineering, Hohai University, Nanjing 210098, China
*
Author to whom correspondence should be addressed.
Appl. Sci. 2020, 10(2), 629; https://doi.org/10.3390/app10020629
Submission received: 12 November 2019 / Revised: 6 January 2020 / Accepted: 10 January 2020 / Published: 15 January 2020
(This article belongs to the Special Issue Advances on Structural Engineering)

Abstract

:
According to the results of a dynamic prototype test for the surface outlet radial gate on the Jinping high arch dam during the flood discharging process, a novel cause of vibration fundamentally different from the traditional causes of flow-induced radial gate vibration, is analyzed for the first time. Under the condition that the flood is discharged only from mid-level outlets, an accompanying vibration of the surface outlet gate is induced by the vibration of the closely spaced mid-level outlet gates. It is counterintuitive that the most intense vibration occurs when the surface outlet gate is closed and, on the contrary, the vibration is reduced when the gate is opened and subjected to flow excitation. In order to analyze and explain this accompanying vibration phenomenon, a theoretical model is developed based on the conventional theory of passive vibration absorbers. The difference between the proposed and conventional theoretical models is that more complex load and damping conditions are considered, and more attention was paid to the dynamic behavior of the accessory structure. Then, the cause and mechanism for the surface outlet gate vibration is clarified in detail, based on the proposed theoretical model. The comprehensive analysis and mutual verification of the prototype test, theoretical derivation and numerical simulation, indicate that the clarification and the proposed theoretical model is reasonable and accurate. The research reported in this paper will be beneficial for the design, operation and maintenance of the hydraulic gates installed on high arch dams.

1. Introduction

The intense vibration induced by flood discharge may cause significant damage to hydraulic structures, especially to the accessory structures (e.g., guide walls [1,2], sluice gates [3] and gate piers [4]) on the dam body. Moreover, it had been found that the vibration can be transmitted from the superstructure to the dam foundation, and then to the neighboring ground, which may seriously impact the safety of the nearby buildings as well as the physical and mental health of the building residents. Therefore, hydraulic structure damage and environmental hazards are the two major problems induced by the vibration during the process of high dam flood discharge. In the past several years, numerous studies on vibration mechanisms, health monitoring, safety assessment, and reduction measures have been carried out [5,6,7,8,9,10,11].
Among all the hydraulic structures that can be possibly damaged by flood discharge-induced vibration, the hydraulic gate is very vulnerable and is more likely to be destroyed than other hydraulic structures. The reasons for this are that the carrying capacity and structural strength of hydraulic gates, which are made of thin steel plates, are much lower than those of other hydraulic structures made of massive concrete (e.g., arch dam, guide wall, gate pier, spillway, water cushion pool and end sill, etc.). Moreover, the direct impact of fluctuating pressures on the hydraulic gate and the accompanying complex fluid–structure interaction mechanisms frequently lead to intense vibrations of gates, which has significant adverse effect on structural safety. To the authors’ knowledge, cases of vibration-induced damage to hydraulic gates that have been reported in the public literature [3,12,13,14,15,16,17] are far more frequent than those of other hydraulic structures.
In order to explain the mechanism of hydraulic gate vibration, extensive studies have been carried out and several theoretical models have been proposed. Hardwick [12] reported that the vibration is due to a periodic reattachment of the jet to the flat bottom of the vertical-lift gate. Kolkman and Vrijer [13] presented a theory of self-exciting vertical vibrations which comprises the following elements: (1) gate raise variations induce discharge fluctuations; (2) discharge fluctuations and flow inertia cause local pressure difference variations across the gate opening; and (3) local pressure differences result in variations of the force exercised by the water on the gate. Thang and Naudascher [14,15] believed that hydraulic gates are excited by vortices due to the dynamic interaction between the elastic gate and the unstable shear layer underneath the gate. In order to ensure the stability of Tainter gates with respect to a significant source of self-excited vibration, Isbii and Nauduscher [16] presented a design criterion which specified the gate bottom type, the hydraulic gate design frequency and the relative stiffness of the gate leaf and supporting arm in different operating conditions. Based on prototype observations, Yan et al. [17] studied the flow-induced vibration of the radial gate in some engineering projects and evaluated the operational safety and vibration character of the gate. However, the explanations for the mechanism of hydraulic gate vibrations in different cases are quite controversial and the cause of self-excited vibration is still equivocal.
Recently, the hydraulic gate vibrations with special characteristics that cannot be explained by the traditional flow-induced vibration theory were observed during testing of the prototype. Jinping hydropower station is one of many hydropower engineering projects with high dams and large reservoirs that have been built for the comprehensive utilization of water resources in the past several decades in China. One frequently occurring but still unresolved problem—the intense vibration of the hydraulic gate—was observed when floods were discharging through the orifices on the dam body in the flood season of 2014. According to the prototype dynamic test results, a distinguishing feature of the vibration of the Jinping surface outlet gate from the vibration of hydraulic gates in other projects is that the vibration intensity decreases with the increasing opening of the gate. It is quite counterintuitive that the most intense vibration occurs when the surface gate is closed and, on the contrary, the vibration is reduced when the gate is opened and subjected to flow excitation. To the authors’ knowledge, this vibration amplification effect of a closed hydraulic gate was first observed in the flood discharging process of the Jinping project and has not been reported in the existing literature.
Obviously, this severe vibration is not affected by flow excitation, which prompts us to study the cause and mechanism of the vibration of the surface outlet gate from the perspective of structural dynamics. For the closed hydraulic gate, which is not subjected to flow excitation, its intense vibration is definitely caused by the vibration of the arch dam body, which is the only structure directly in contact with the gate. As the hydraulic gate is essentially an accessory structure installed on the mass concrete structure (i.e., the arch dam), it is natural to expect that the dynamic behavior of the hydraulic gate can be effectively described by developing the existing theory of dynamic vibration absorbers (DVA). The DVA theory is well-studied and considerable progress has been made since its first appearance in 1928 [18]. In the past several decades, different parameter optimization methods [19,20] are presented and many improved types of DVA have been proposed, such as multi-degrees-of-freedom DVAs [21], multiple tuned-mass dampers [22], magnetoviscoelasticity dampers [23] and magnetorheological dampers [24]. Inspired by the theory of DVA, a simplified theoretical model in which the hydraulic gate is regarded as a DVA of the main structure (i.e., dam body) is established and then the cause and mechanism of the surface outlet gate vibration is clarified.
As the theoretical analysis in this study is inspired by the DVA theory, the simplification that is frequently used in the analytical analysis in DVA theory is investigated. In the research on the reduction of vehicle–bridge coupled vibration using DVA [25,26,27], the actual structure is greatly simplified by regarding the bridge and vehicle as the simply supported beam and single mass block, respectively. In the analysis on the damping effect of the DVA on wind turbine vibration, simplified systems with a small number of degrees of freedom (DOFs), for example, three DOFs [28,29] and five DOFs [30], are frequently applied to simulate the actual wind turbine. Moreover, complex structures with large numbers of DOFs are usually converted to single-degree-of-freedom (SDOF) structures by the mode decomposition method in many studies on structural vibration control [31,32]. For theoretical research on the vibration reduction mechanism [33,34], a two-DOF structure is the classical system that is frequently used to represent the structure–DVA system and is very convenient for further research. As the purpose of this paper is to clarify the cause and mechanism of the gate vibration and the calculation for the detailed structural dynamic response is not considered, we believe that this simplified two-DOF theoretical model proposed in this study is appropriate and the analysis results of this article are reasonable and effective. However, only the qualitative analysis results, including the clarification of gate vibration cause and mechanism and the rough estimate for the vibration amplification effect under different working conditions, are obtained, due to the limitation of this simplified theoretical model. The calculation model would be further improved to reasonably and precisely describe the actual conditions in the subsequent research in order to calculate the structural dynamic response more accurately and in greater detail.
The aims of this article are to clarify the cause and mechanism of surface outlet gate vibration in the Jinping high arch dam, and to establish a theoretical model for the aforementioned vibration so that the vibration amplification effect can be approximately estimated as long as the relevant kinetic parameters are determined. This will lay an important foundation and provide significant guidance for the presentation of a vibration reduction method and an optimal design scheme. To achieve the research objectives, this research mainly focuses on the following key points: (1) analysis of the vibration characteristics based on prototype test data; (2) establishment of the theoretical model to approximately describe the vibration; (3) analysis of the effects of kinetic parameter variations on the vibration, based on the theoretical model; (4) carrying out of the numerical modal analysis to determine the kinetic parameters; (5) clarification of the cause and mechanism of this counterintuitive vibration phenomenon by comprehensively considering the results of the prototype testing, theoretical analysis and numerical simulation. The vibration cause and mechanism presented, and the proposed theoretical model, are shown to be reasonable and accurate according to the mutual verification of the prototype test, theoretical derivation and numerical simulation. The remainder of this article is organized as follows. A preliminary analysis of the prototype test results of the hydraulic gate vibration in the Jinping project is carried out in Section 2. In Section 3, the theoretical model is established to analyze the dynamic response of the general accessory structure (i.e., hydraulic gate) installed on a large-scale primary structure (i.e., arch dam), and a parameter sensitivity analysis of the proposed theoretical is performed. Section 4 studies the dynamic characteristic parameters of the related structures (such as the arch dam, surface outlet gate and mid-level outlet gate) by prototype data analysis and numerical simulation. In Section 5, the dynamic response of the surface outlet gate is analyzed in detail in different working conditions by substituting the dynamic characteristic parameters that are obtained from the numerical simulation into the proposed theoretical model. Finally, concluding remarks of this work are given in Section 6.

2. Prototype Test for the Vibration of the Hydraulic Gate

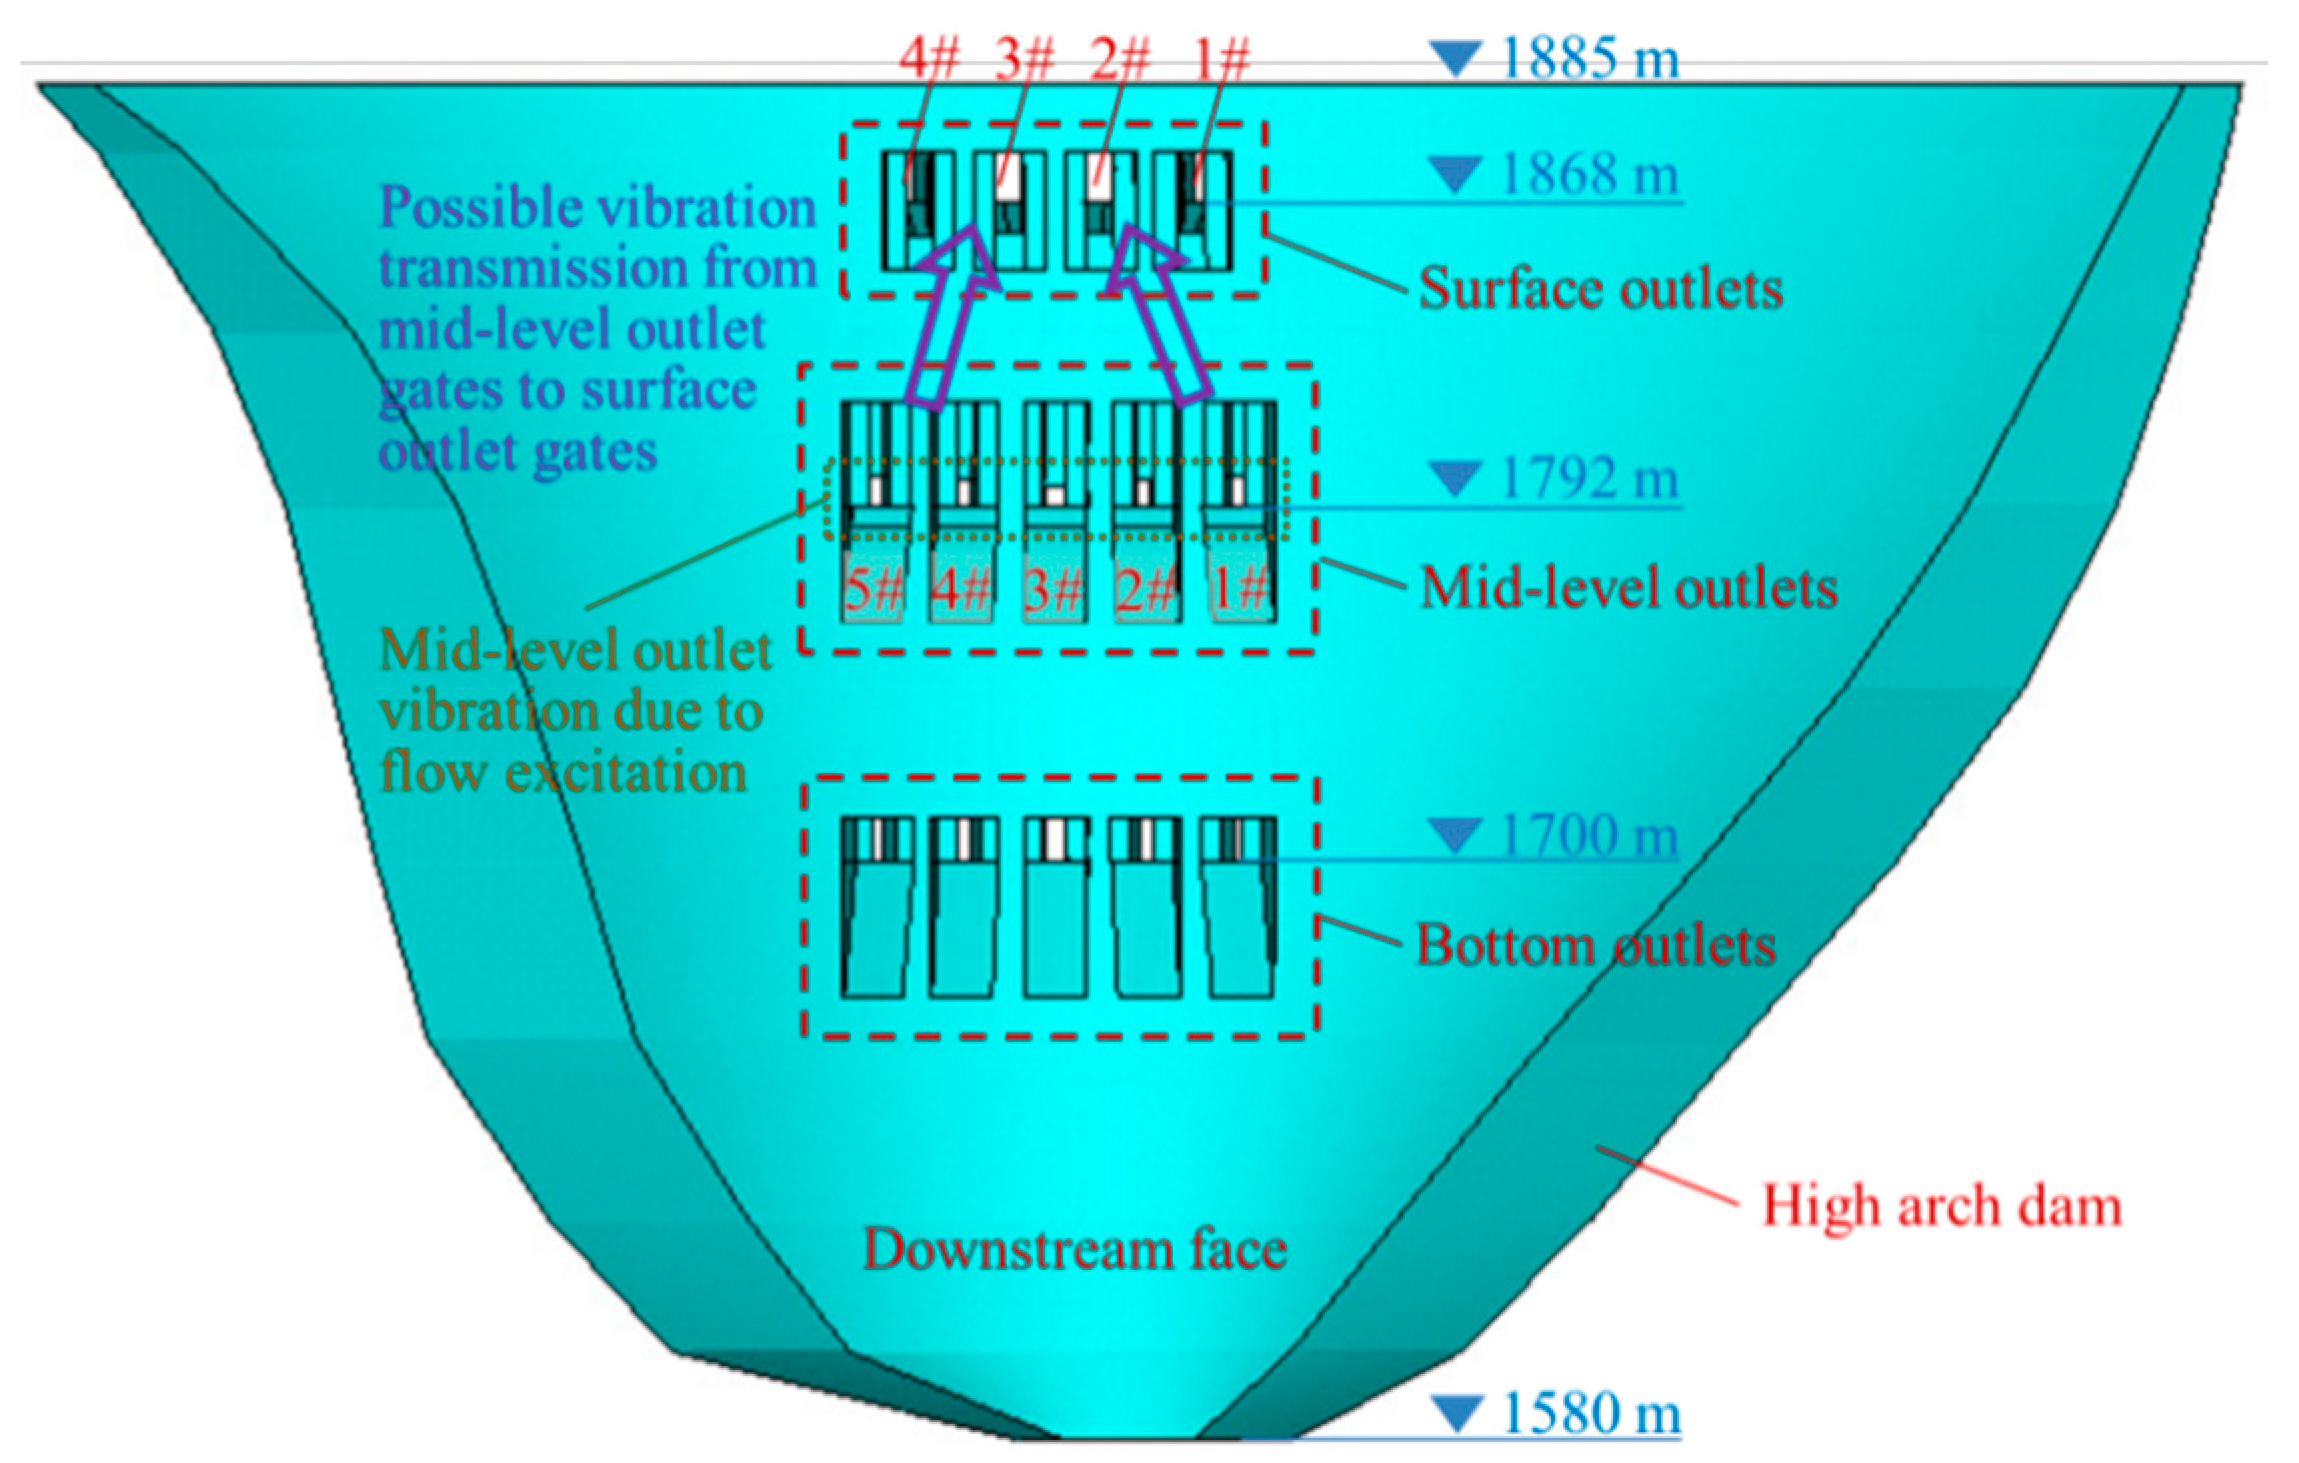
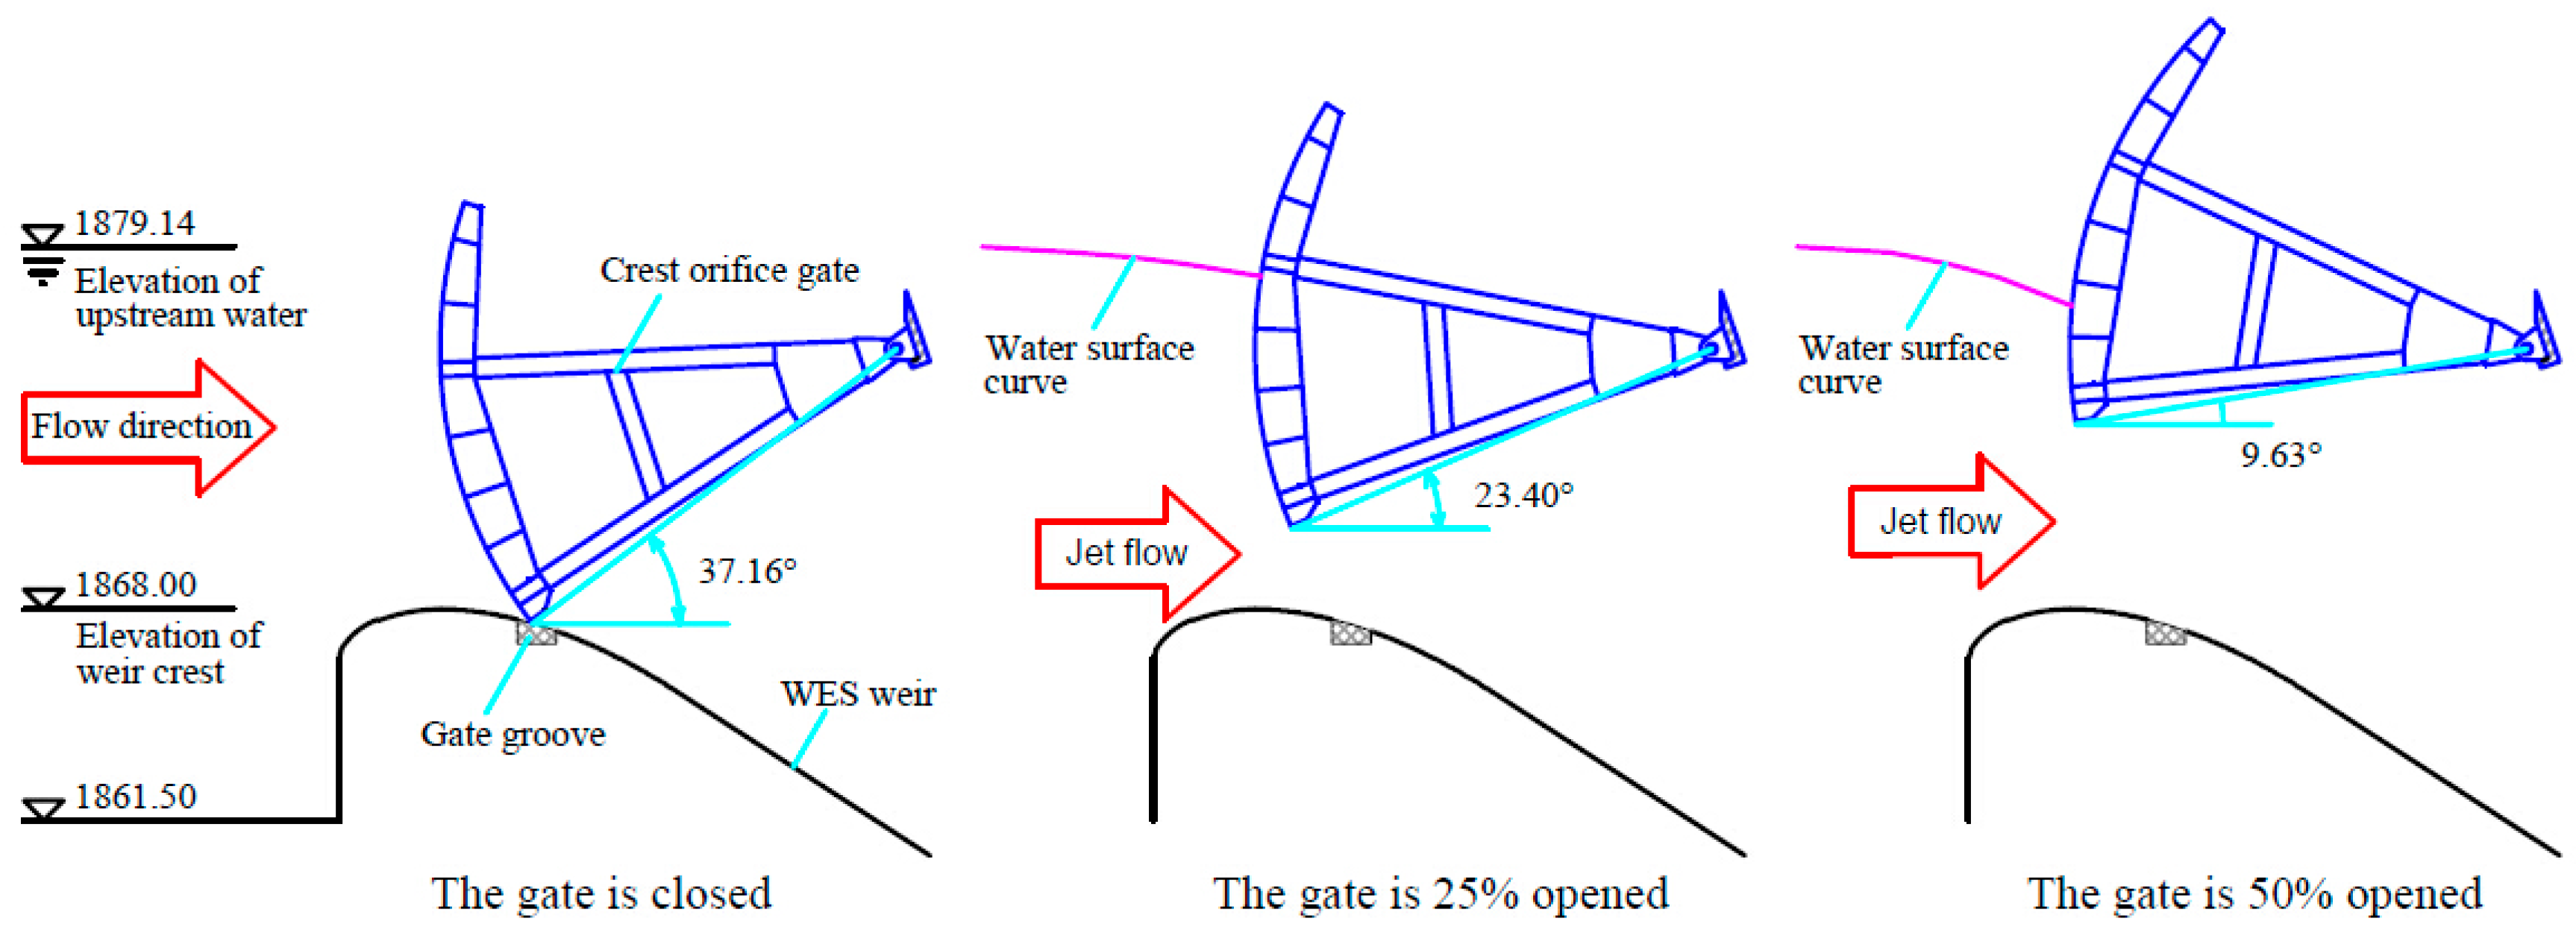
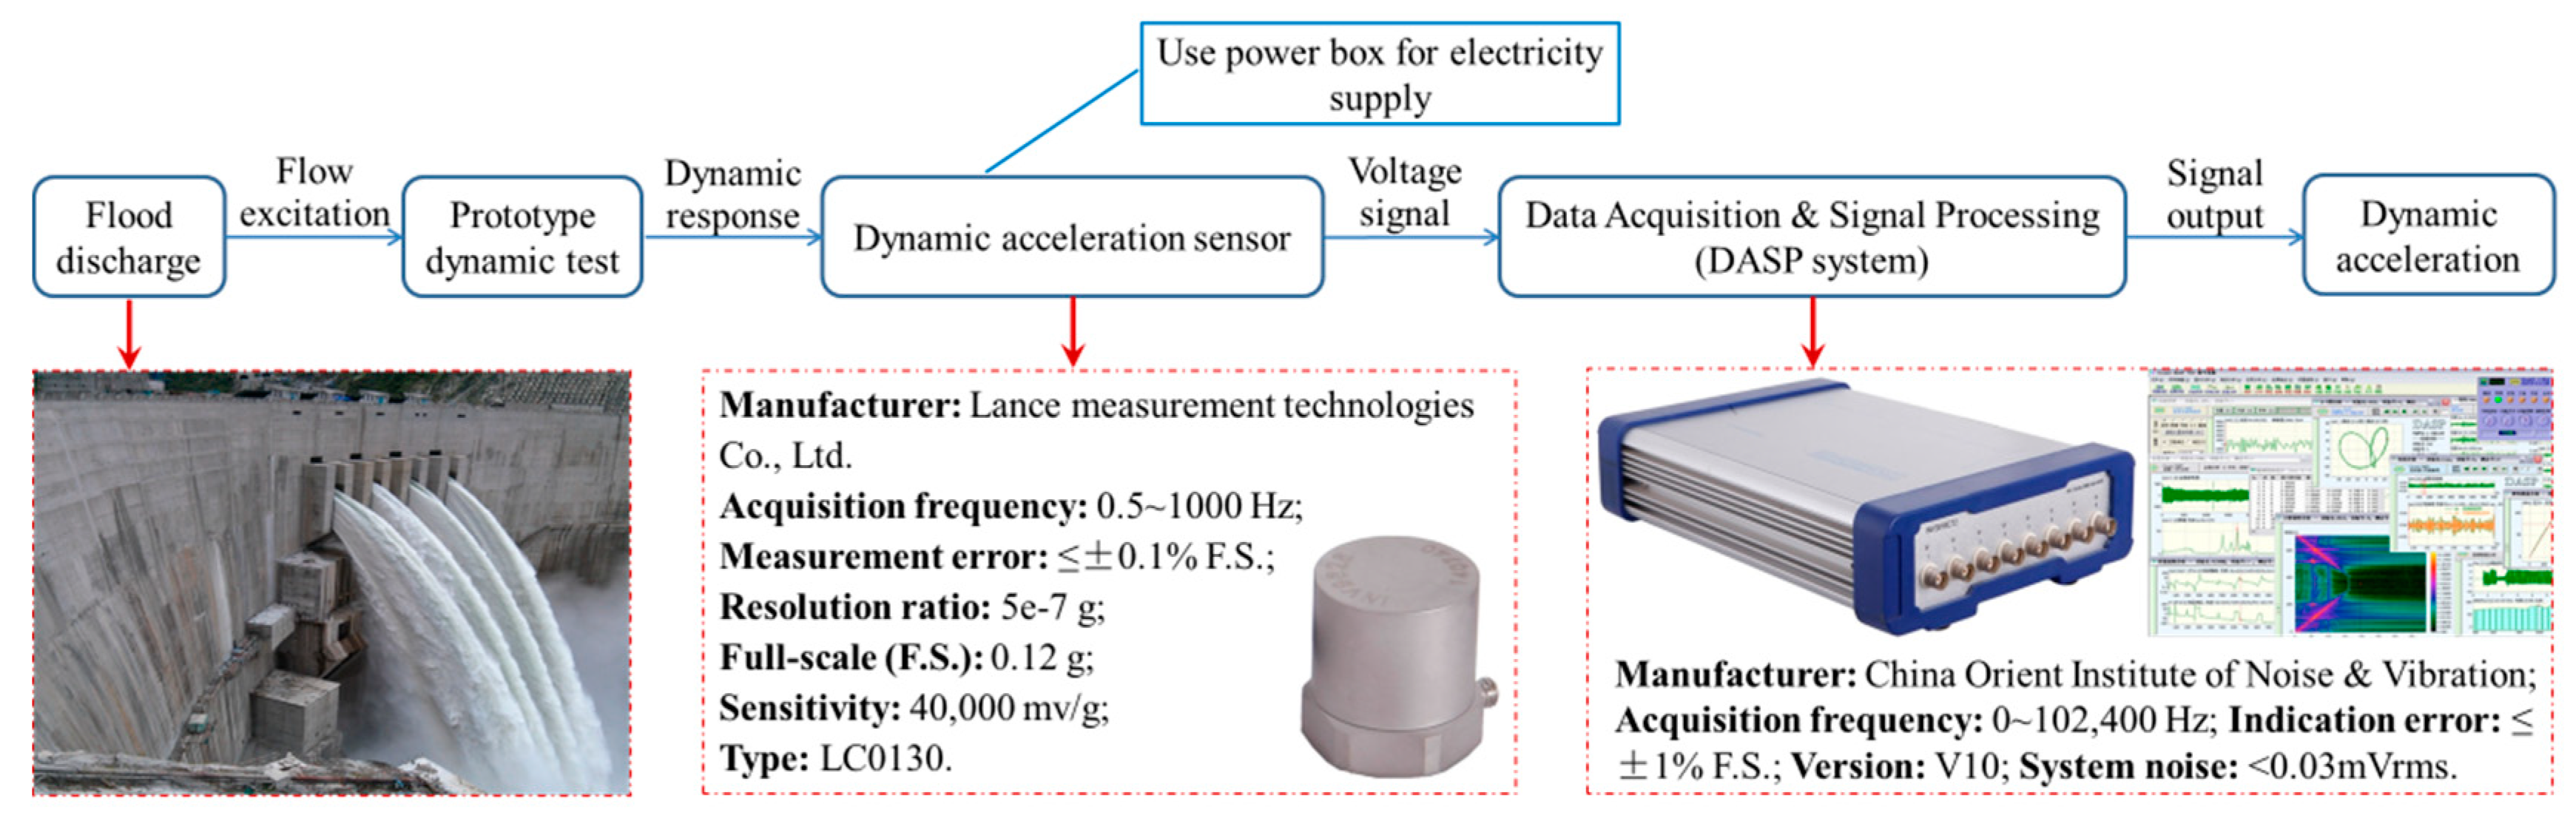
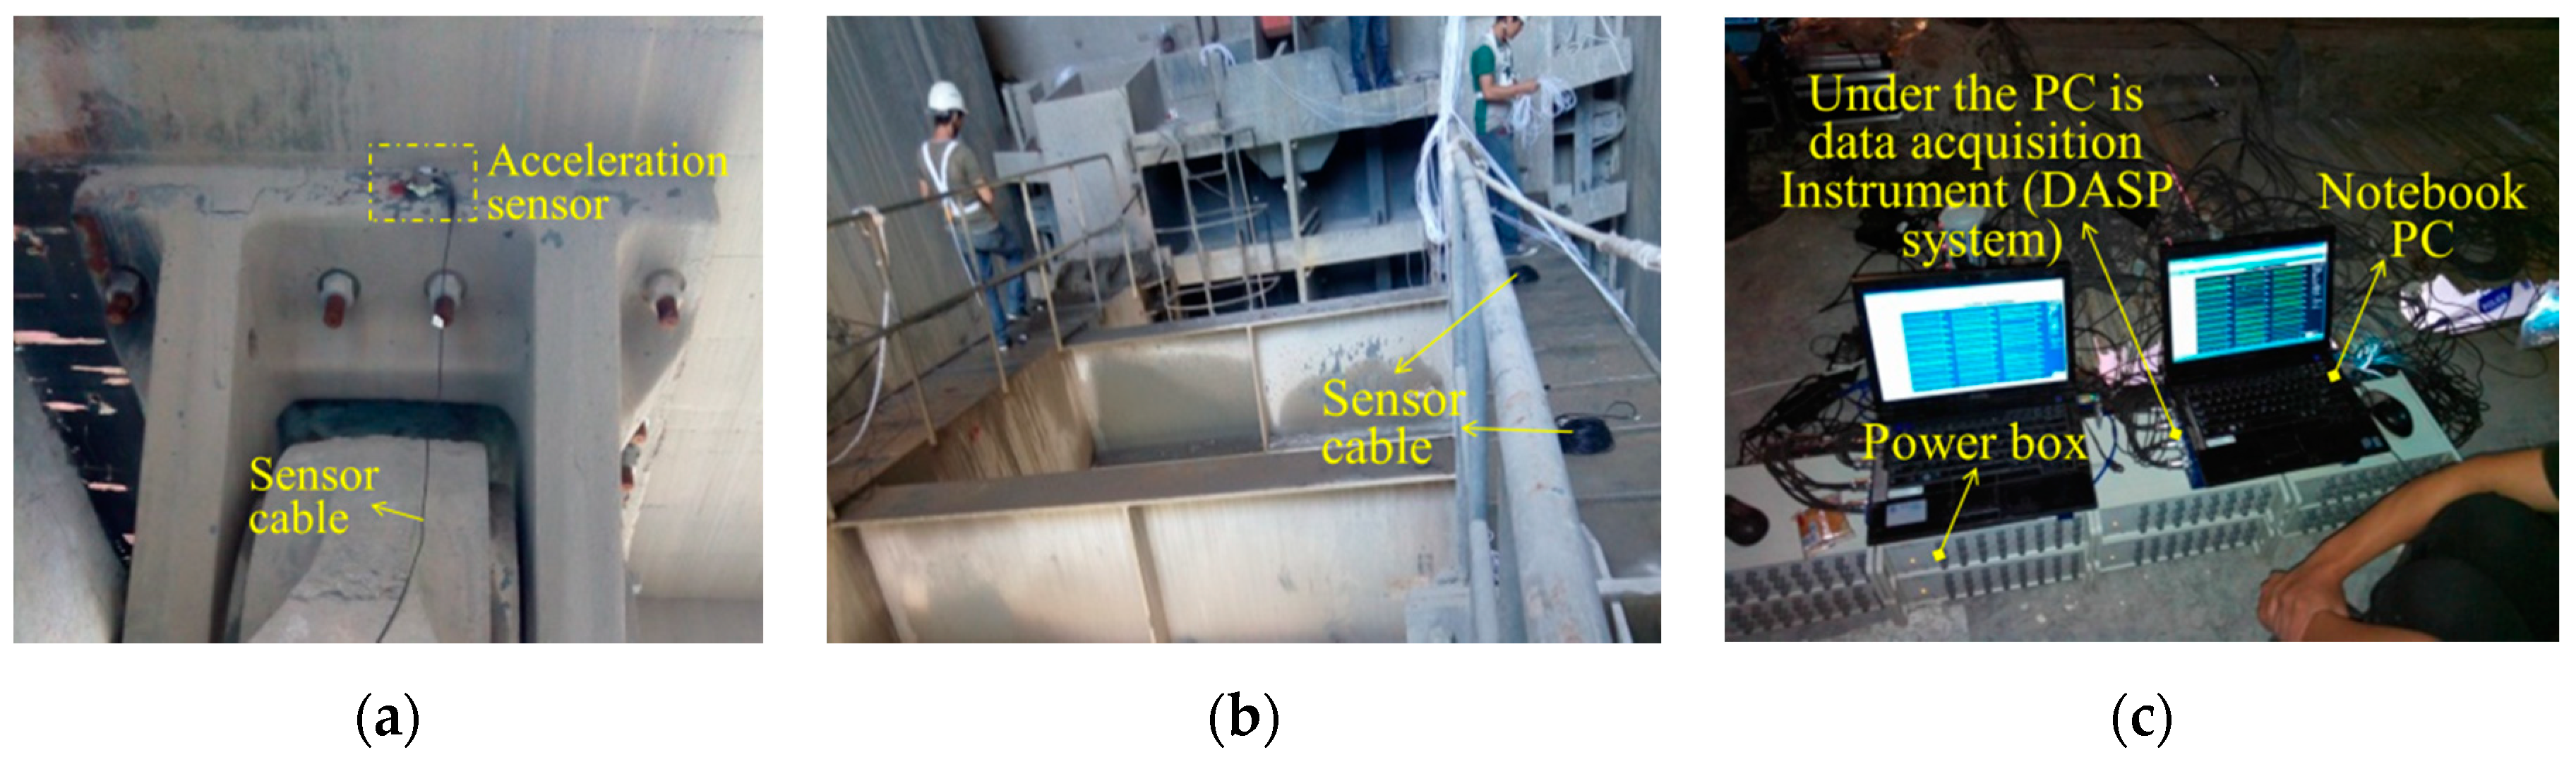
2.1. Basic Information for Jinping I Hydraulic Project and the Prototype Test

The Jinping I hydraulic project is one of the largest hydropower stations in China and its water-containing structure is a concrete double curvature arch dam which is the highest in the world. The arch dam is 305 m in height with a reservoir capacity of 7.76 × 10⁹ m3 and the designed flood discharge rate of the surface and mid-level orifices on the dam body is approximately 13,600 m3/s.
In the flood season of 2014, intense vibration of the surface outlet gates occurred during the flood discharge process. Therefore, we carried out a series of vibration tests for the surface and mid-level orifice gates in almost all the cases included in the reservoir operation scheme, which is determined by the comprehensive utilization of water resources. As shown in Figure 1, the dynamic testing system applied in the prototype dynamic tests is given. The sampling frequency and temporal interval of the testing data are 400 Hz and 0.0025 s, respectively.
Moreover, the working conditions of the Jinping arch dam during the vibration tests are listed in Table 1 and the images of the prototype test are given in Figure 2. It should be pointed out that for the research presented in this paper, the influence of the downstream level, which is an essential factor in describing the working condition of a hydropower project, can be said to be negligible. According to the comprehensive analysis in this study, the variation of the downstream level in a limited range will not influence the generation process of the accompanying vibration of the surface outlet gate. Prototype test records show that the downstream levels of working conditions 4 to 8 are approximately equal to 1649.37 m. This may be because the sums of the hydro-turbine generator discharge and dam body discharge are equal under different working conditions. Of course, the test error in the prototype observation could also be the possible reason for the same downstream level in different working conditions. As the downstream level will not affect the research results, this question is not further investigated in this article. Moreover, the opening of the hydraulic gate is defined as the elevation from the gate bottom to the weir crest (for the surface outlet gate) or the short pressure pipe surface (for the mid-level outlet gate). Therefore, the hydraulic gate opening ratio shown in Table 1 is the ratio between the gate opening under specific working condition and the gate opening when the gate is opened to the maximum extent.
In order to clearly demonstrate the number and relative position of the different hydraulic gates, the arrangement of the outlets on the arch dam body is illustrated in Figure 3.

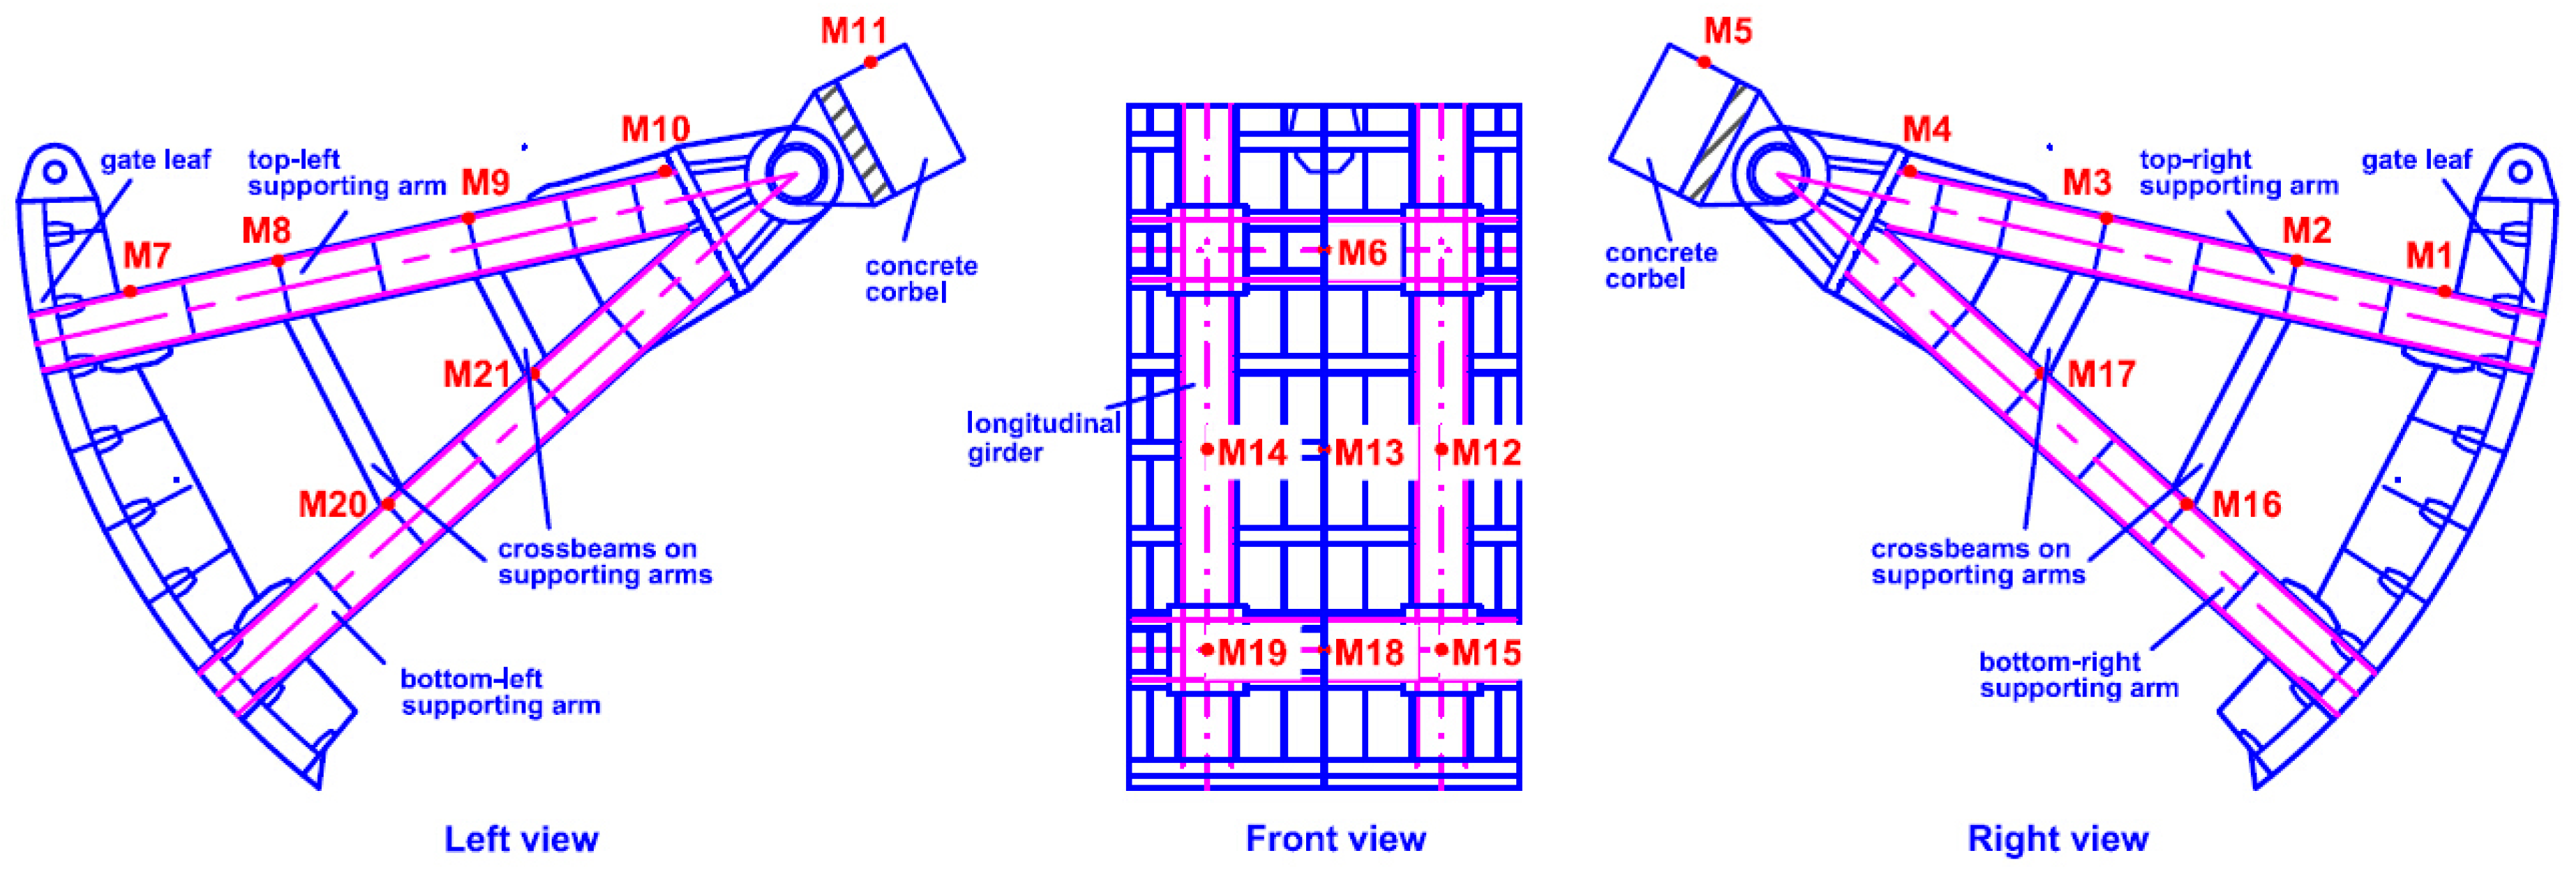
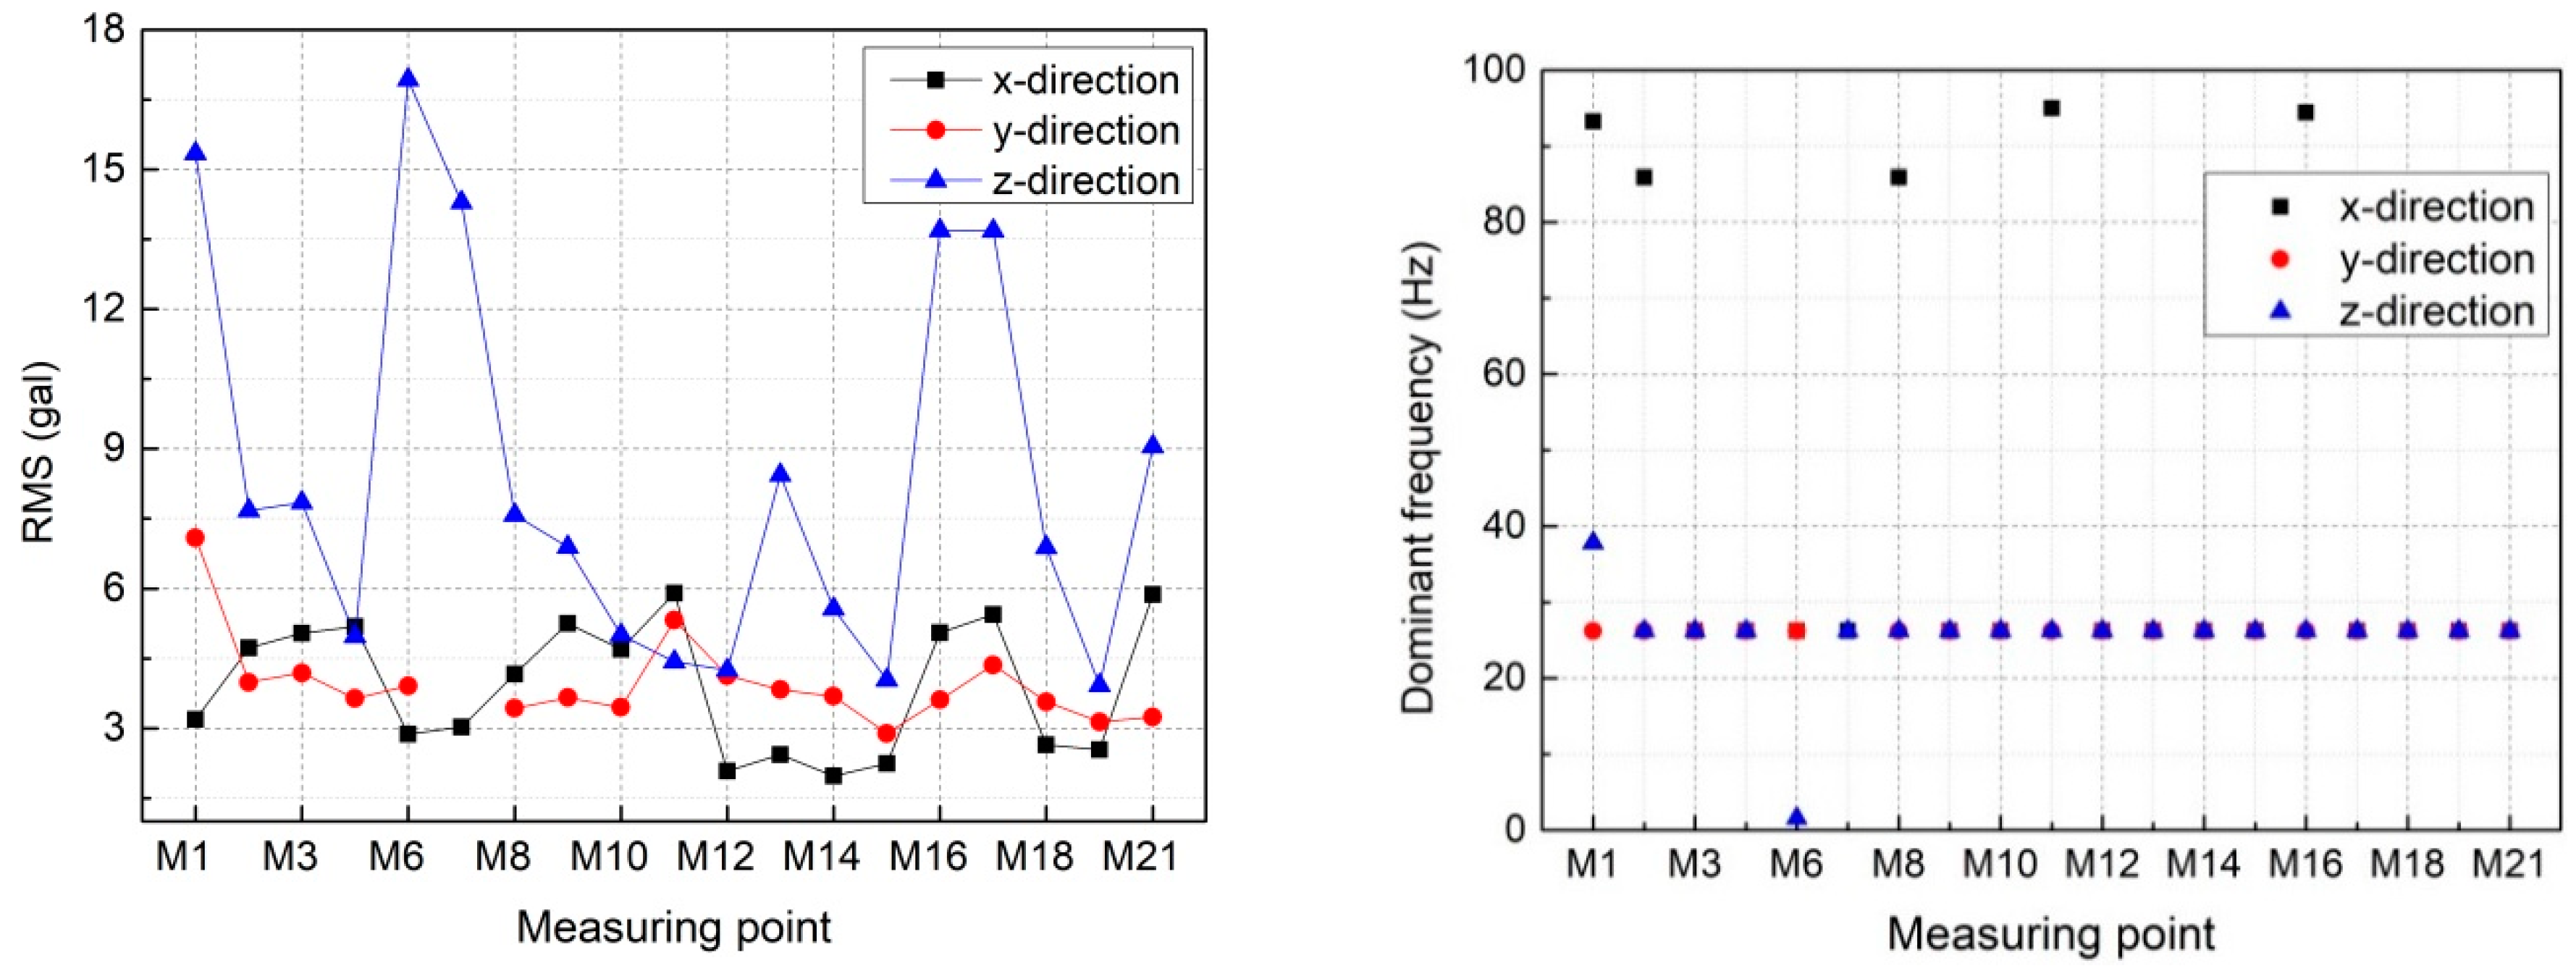
2.2. Vibration of the Mid-Level Outlet Radial Gate

The mid-level outlet on the Jinping arch dam is equivalent to a short pressure pipe and the fluctuating pressure generated by the high-velocity discharge flow in the pressure pipe may mainly consist of high frequency components [35]. As shown in Figure 4, the test point placement on the mid-level outlet gate (No. 3#) was given and triaxial acceleration sensors were installed at each measuring point.
In Figure 5, the root mean squares (RMSs) and dominant frequencies of the acceleration histories measured at each test point on the mid-level gate (No. 3#) are illustrated. The unit gal, shown in Figure 5 and the following several other figures, is frequently used in earthquake engineering and can be expressed as 0.01 m/s2 (i.e., 1 cm/s2) in the international system of units. It is noted that for the test points on the gate leaf, the x-direction represents the lateral direction of the gate leaf, which always remains horizontal, the y-direction represents the tangential direction of the gate leaf, and the z-direction denotes the radial direction of the gate leaf. Moreover, for the test points on the supporting arms and the concrete corbels, the x-direction denotes the lateral direction which always keeps horizontal, the y-direction represents the axial direction of the supporting arm, and the z-direction represents the direction which is perpendicular to the arm. Note that the aforementioned sensor directions are defined in the local coordinate systems and the directions in the global coordinate system may change with gate opening. As mentioned above, the triaxial sensor was installed at each measuring point, which meant that the vibrations in three mutually perpendicular directions in space could be measured at each measuring point but the directions of the sensors at different measuring points may have been different. Specifically, the directions of sensors installed on the concrete corbels did not change because the concrete corbel did not rotate when the gate opening changed. For the sensors installed on the gate, the x-direction (lateral direction) always remained horizontal and did not change in the global coordinate system; the y- and z-directions were dependent on the gate opening and were inconsistent under different working conditions.
Figure 5 indicates that the vibration in the z-direction is more intense than the vibrations in the x- and y-directions, and, except in rare cases, the dominant frequencies of the acceleration histories measured at each test point are approximately 26.2 Hz. It is noted that only the 3# mid-level outlet gate is fully opened in case 1, so that the vibration is almost certainly induced by the fluctuating pressure generated from the high-velocity flow that is discharged through the 3# orifice. According to the test results, the amplitudes and dominant frequencies for the vibrations of the 2# and 4# mid-level orifice gates in case 2 are almost the same as those of the 3# mid-level orifice gate in case 1, which is probably because of the similar flow conditions. Generally, the dominant frequency of flow-induced pressure fluctuation ranges from 0 to 2 Hz and the high frequency vibration is unlikely to be caused. However, the fluctuating pressure generated by the high-velocity discharge flow may consist of high-frequency components [35], and the high-frequency vibration of the hydraulic gate occurs frequently in engineering practice [6,36]. The detailed mechanism for the flow-induced vibration of hydraulic gates needs further investigation.

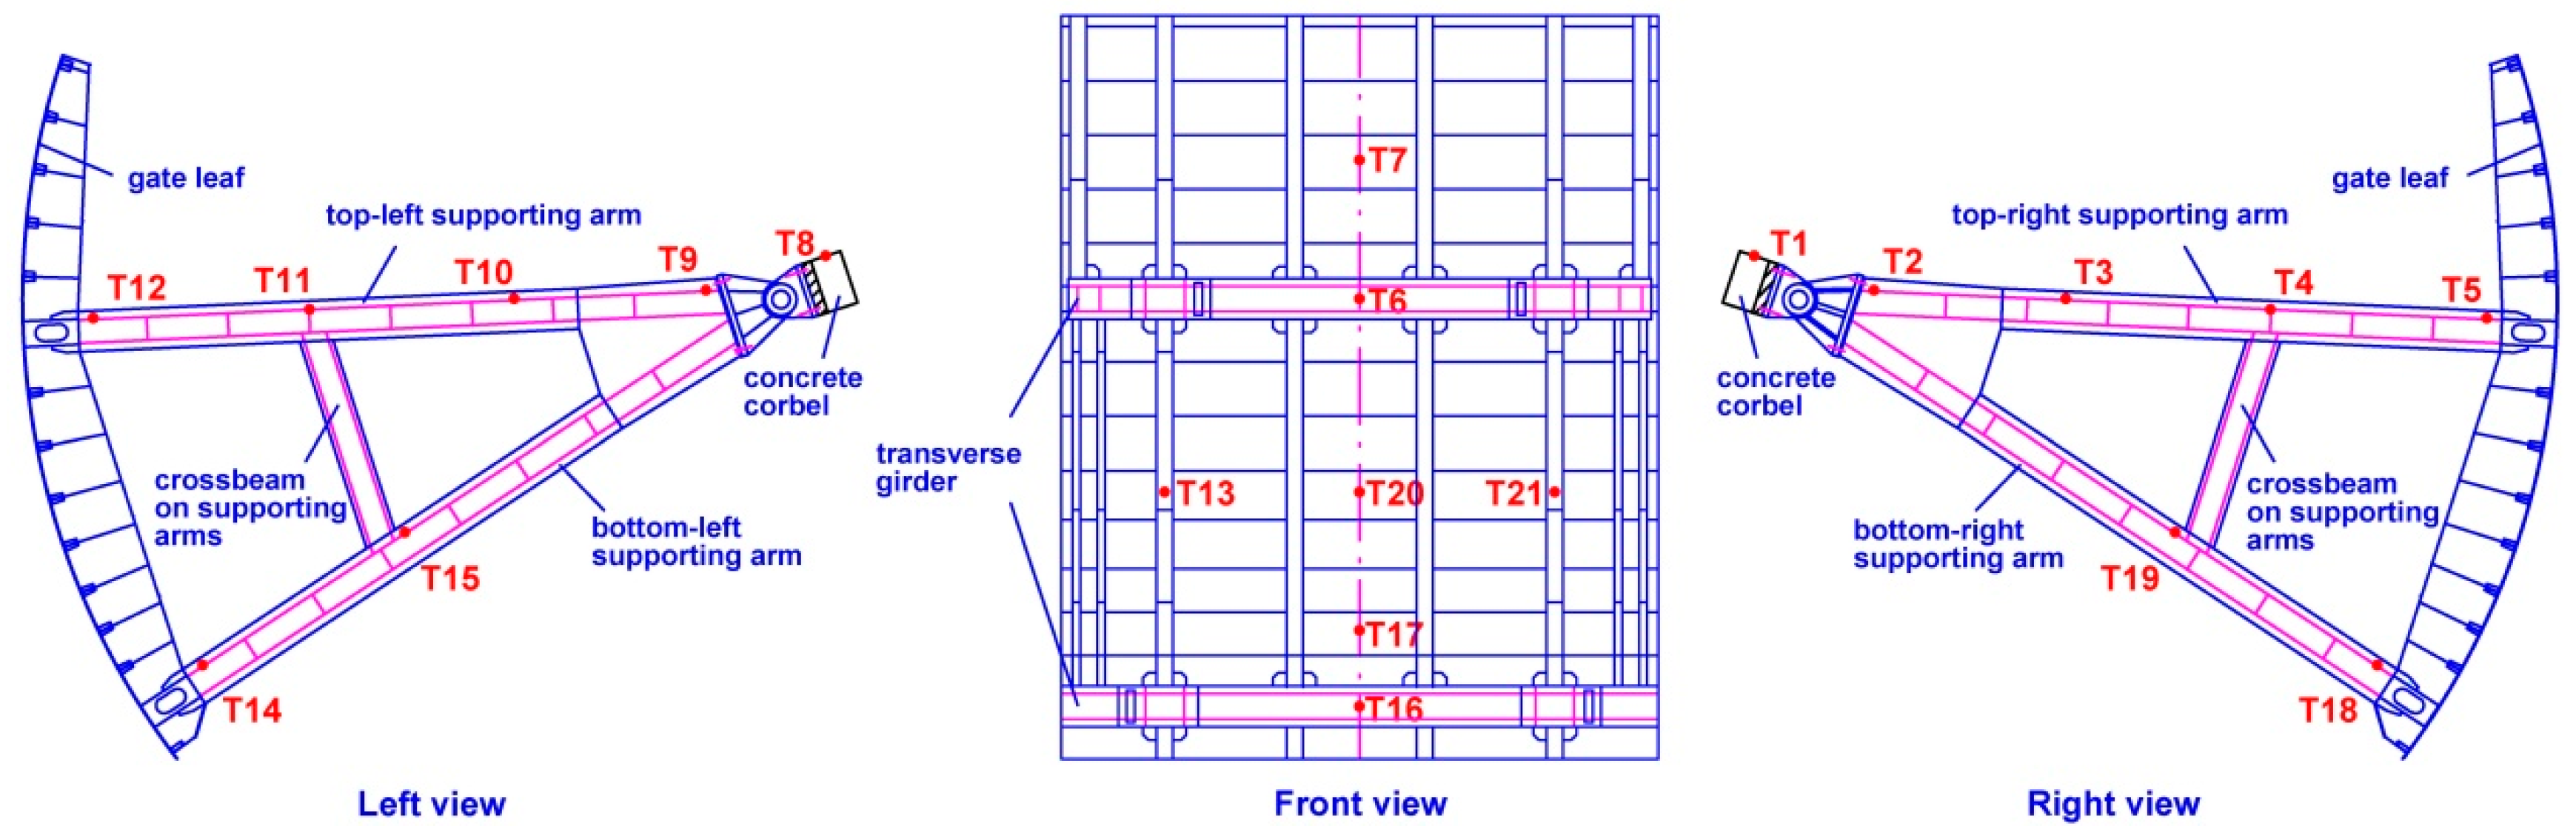
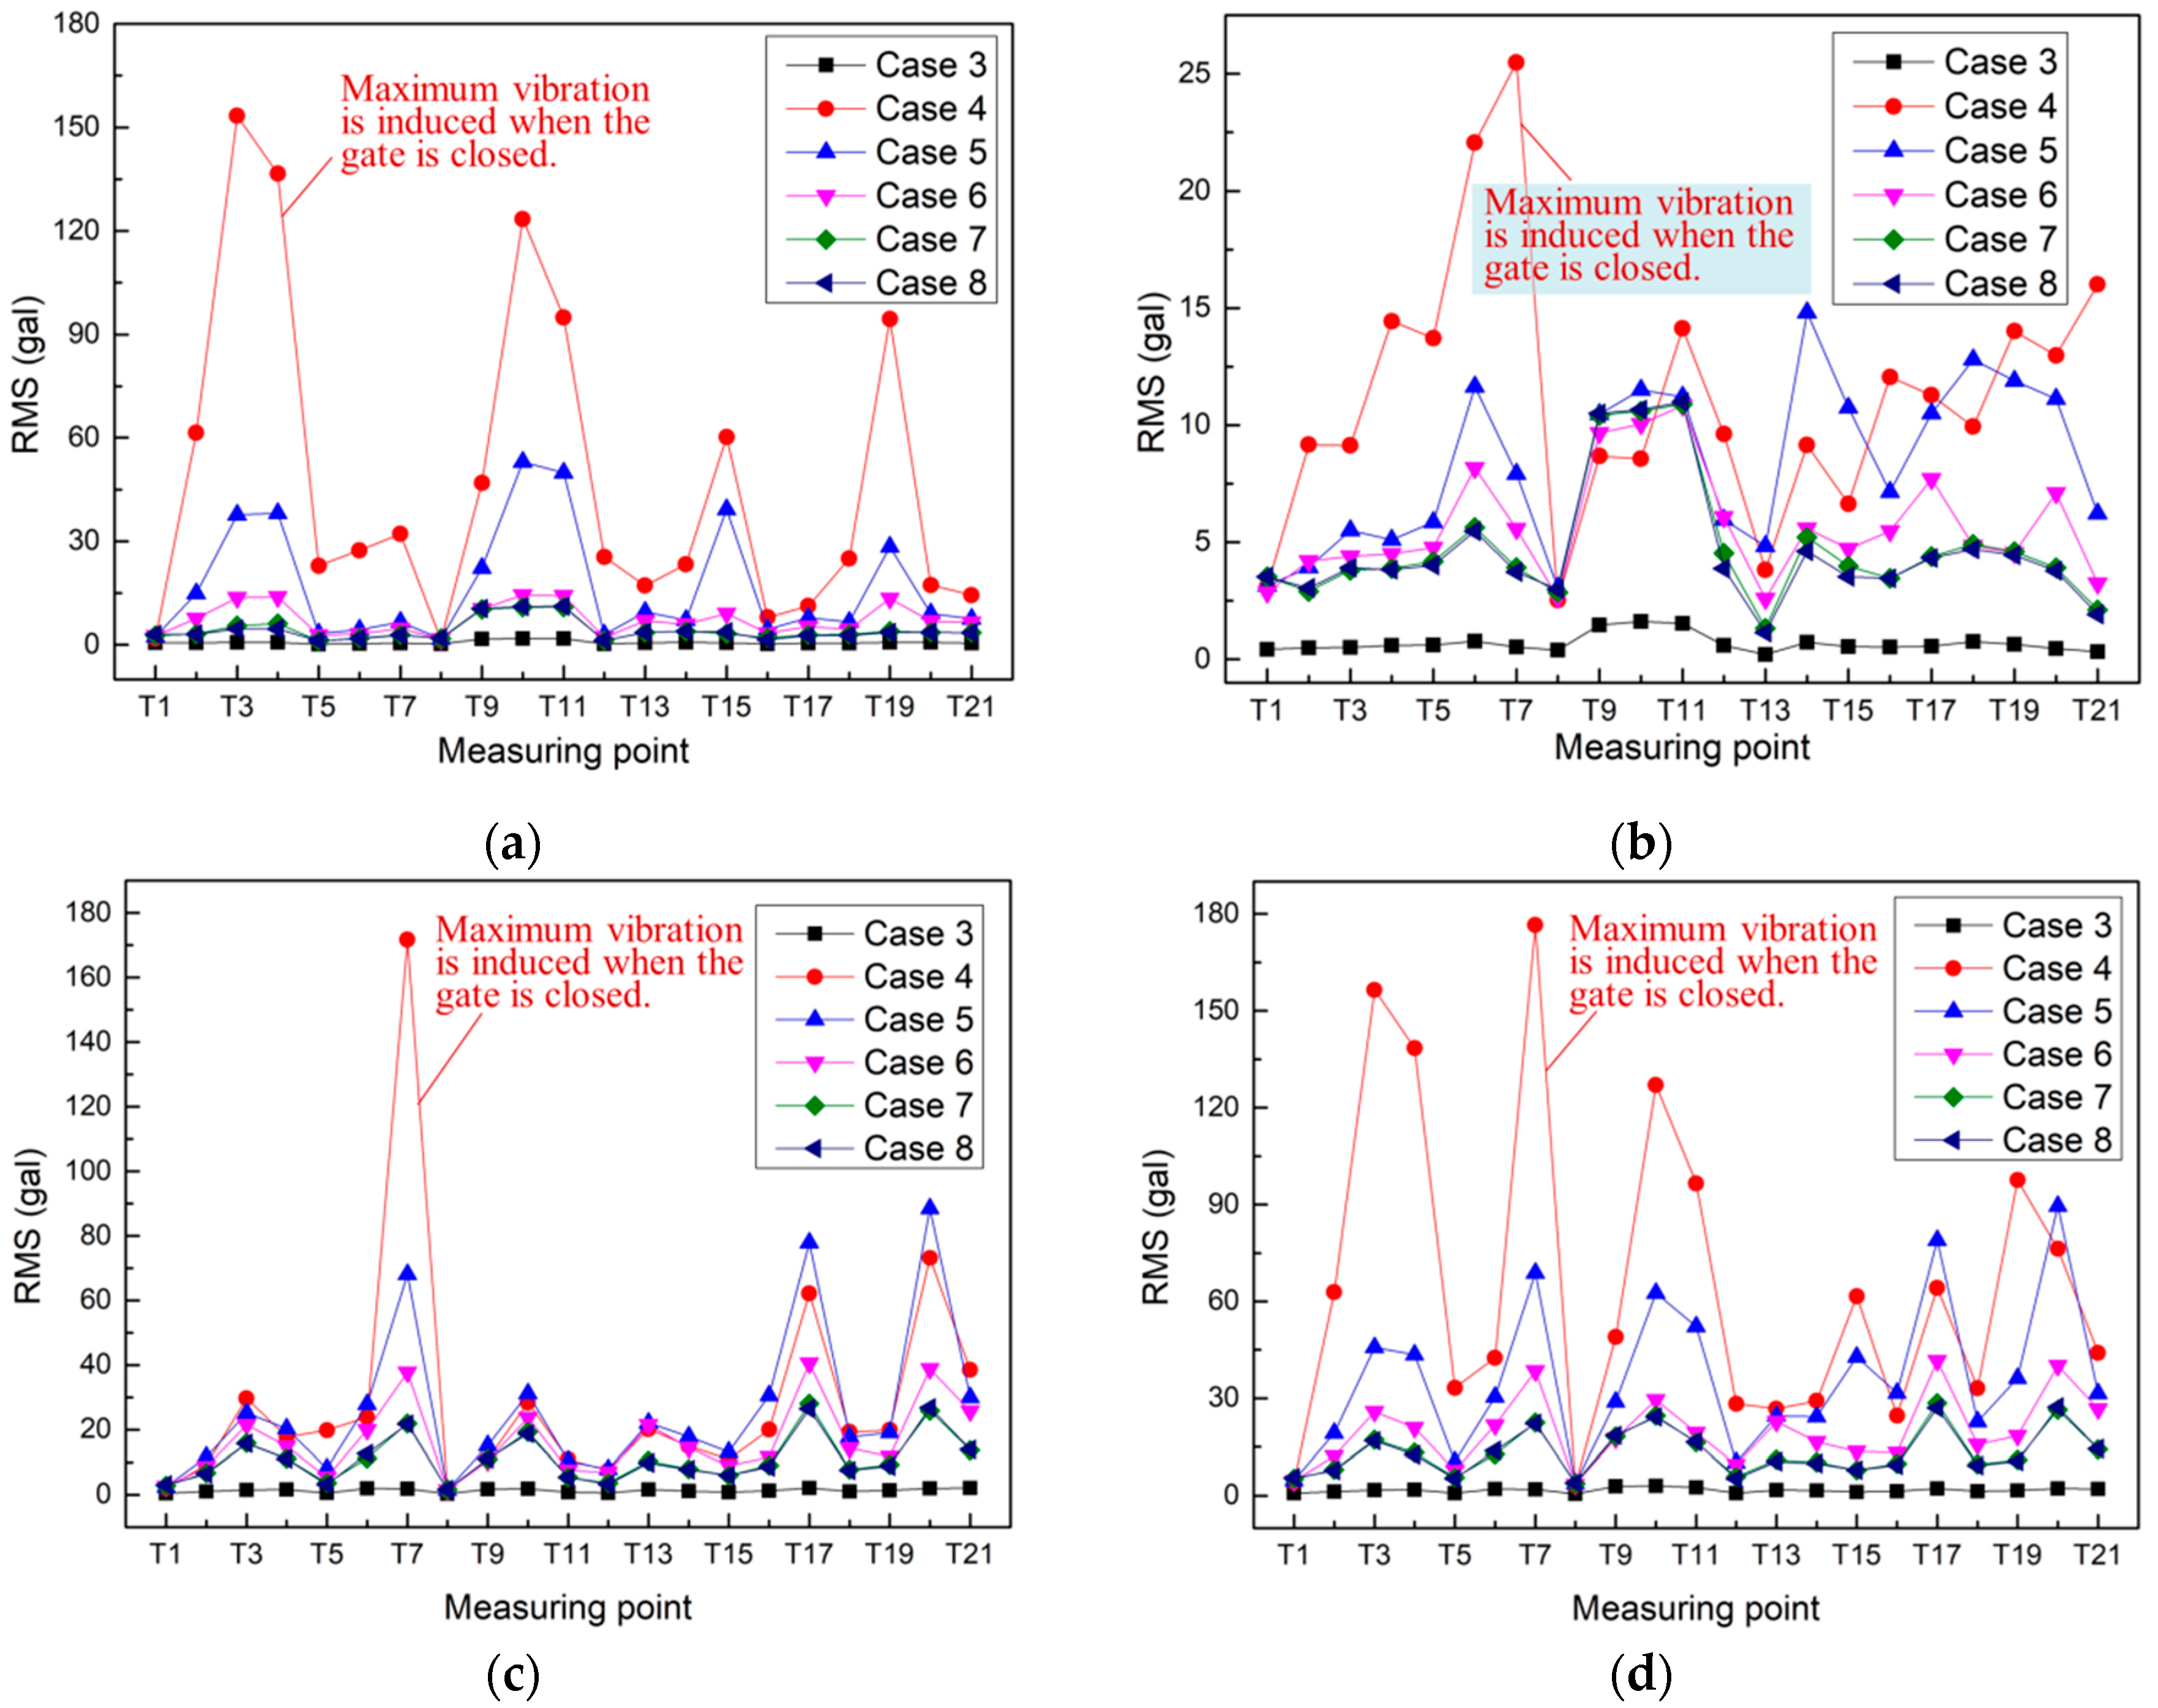
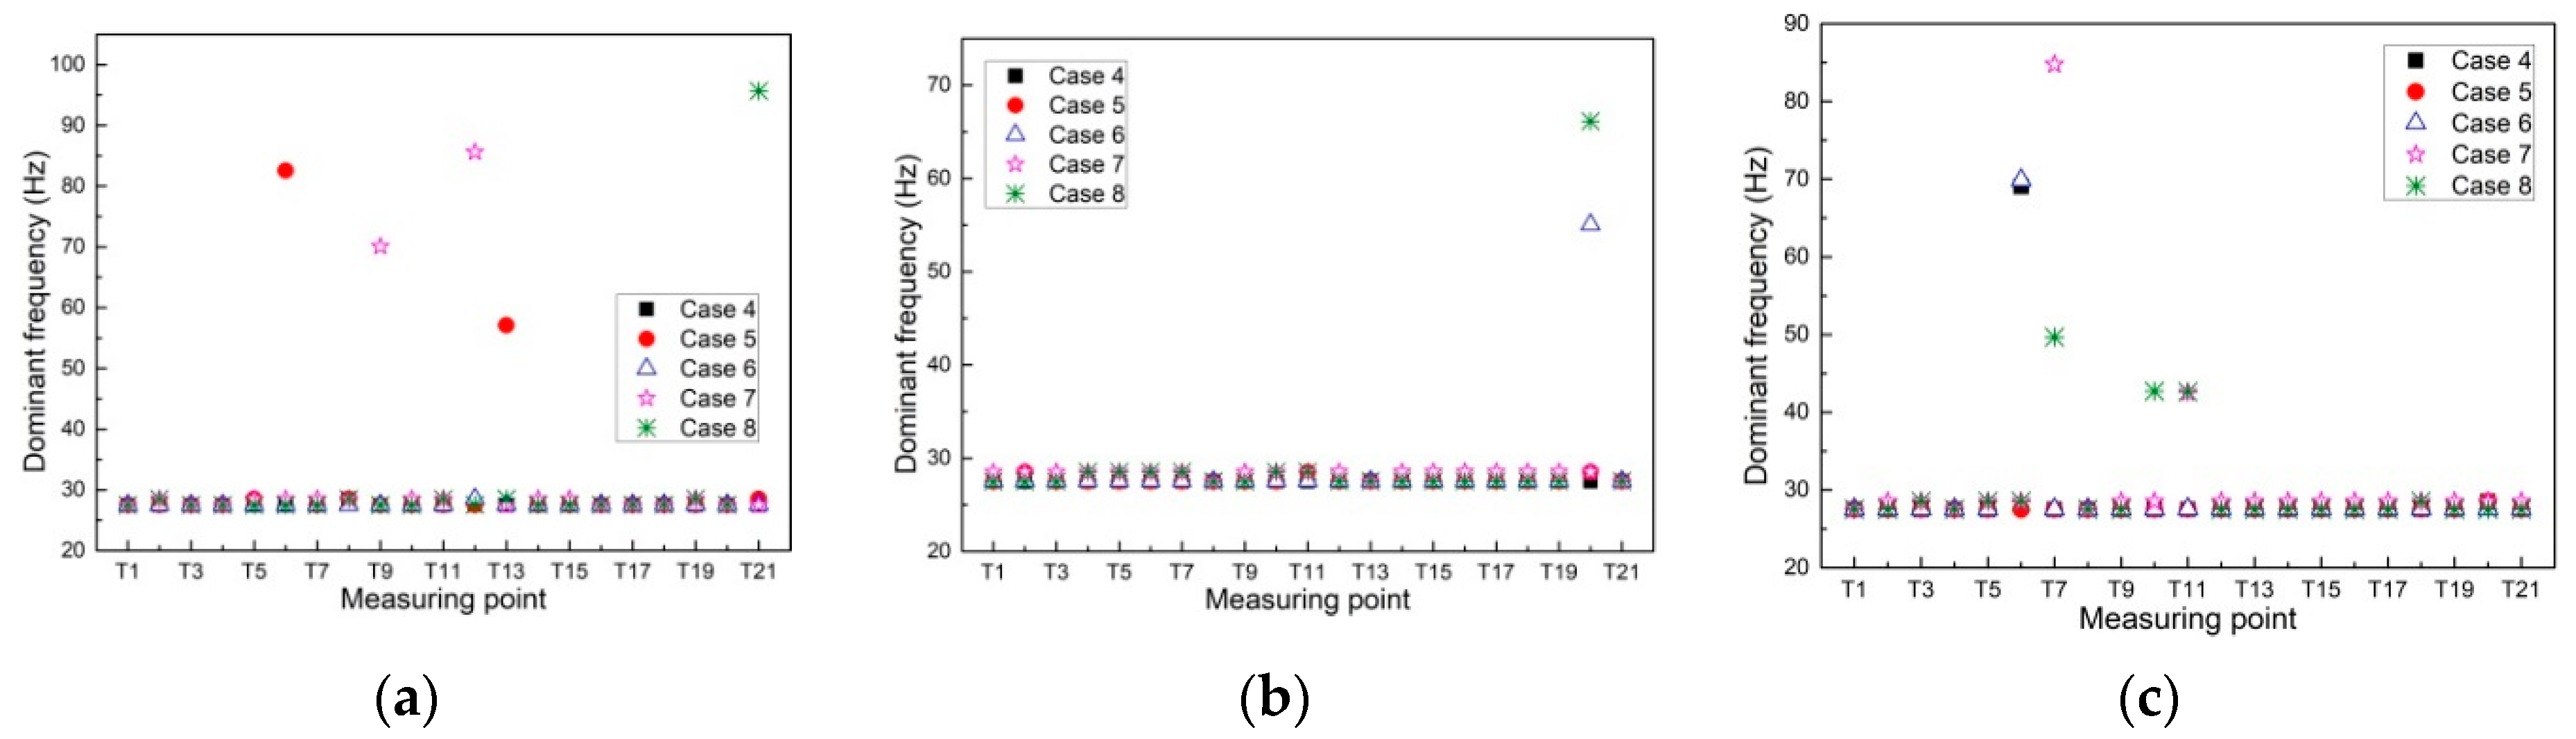
2.3. Vibration of the Surface Outlet Radial Gate

The surface outlets are designed as a WES overflow weir with an 11-m-wide cross section and 12-m-high gate piers to restrict flow in the lateral direction. It is noted that the bottom edge of the 3# surface outlet gate is in contact with the discharge flow when the gate opening ratios are 0%, 25% and 50% (i.e., the cases 4, 5 and 6). Moreover, for the cases 7 and 8, the gate opening ratios are further increased to 75% and 100%, thus the surface outlet gate is uplifted and its bottom edge is separated from the discharge flow. Therefore, the discharge volume cannot be controlled by the hydraulic gate in cases 7 and 8. As shown in Figure 6, the test point placement on the 3# surface outlet gate was given and triaxial acceleration sensors were installed at each measuring point.
In Figure 7 and Figure 8, the RMSs and dominant frequencies of the acceleration histories measured at each test point on 3# surface outlet gate in different cases are illustrated. The x-, y- and z- directions for the test points on surface outlet gate have the same meanings as those for the test points on mid-level outlet gate.
Due to the limited number of sensors, all of the acceleration sensors were installed on the 3# surface outlet gate to meticulously monitor its vibration condition. As shown in Figure 7, it was found that small vibration occurs when only the surface outlet gates are opened (e.g., case 3) and the surface orifice gate vibration is significantly amplified when the mid-level orifice gate is fully opened (e.g., cases 4 to 8). According to the experience of management personnel, the surface gate vibration under working condition 2 can be clearly identified with the naked eye and the vibration is so strong that people cannot stand on the concrete cover directly above the surface gate. In addition, the obvious vibration of the 1#, 2# and 4# surface orifice gates is also observed in cases 2 and 4 to 8 by the operation and maintenance personnel in this hydropower station, although we do not have detailed data. Therefore, the conclusion can be drawn that the intense vibration of surface orifice gate is mainly induced by the mid-level orifice gate vibration.
As shown in Figure 7a, the x-directional accelerations of the 3# surface outlet gate first decrease with the increasing of its opening and then the accelerations do not decrease any more when the bottom of the hydraulic gate is separated from the discharge flow in cases 7 and 8 (i.e., the opening is equal to or greater than 75%). Considering the y- and z-directional accelerations illustrated in Figure 7b,c, the aforementioned varying tendency is approximately satisfied, but is not as obvious as that shown in Figure 7a. Moreover, as illustrated in Figure 7d, the variation trend of the sum of the acceleration vectors in different directions during the gate opening process is almost the same as the varying tendency of x-directional acceleration. The vibration mode of the surface outlet gate is further investigated and compared with the numerical analysis results in Section 4.
Figure 8 illustrates that the dominant frequencies of the acceleration histories in different cases are mainly distributed in a narrow range from 27.5 to 28.5 Hz. It is noted that the dominant frequencies for the vibrations of the surface outlet gate are very similar to those for the vibration of the mid-level outlet gate, which verified the aforementioned analysis that the exciting force generated by the mid-level orifice gate vibration contributes significantly to the surface orifice gate vibration. The dominant frequencies higher than 40 Hz (shown in Figure 8) are probably caused by the vibration of the accessory structures on the gate (e.g., the staircase and its handrail), signal distortion and interfering signals generated by the vehicles and construction process.

2.4. Preliminary Analysis of the Causes of the Hydraulic Gate Vibration

On the basis of the above prototype test data, it is considered that the dynamic interaction between the hydraulic gate and the high velocity discharge flow causes the vibration of the mid-level outlet gate, and then the mid-level orifice gate vibration causes the intense vibration of the surface outlet gate. It is noted that the moduli of the acceleration vectors for the 3# surface orifice gate is significantly decreased with increasing opening from 0% to 25%, which is evidently reflected by the prototype dynamic test data. The probable reason for this result is that the partial vibration propagation path from the mid-level orifice gate to the surface outlet gate is cut off when the bottom of the surface outlet gate is separated from the weir crest of the surface orifice. During increase of the hydraulic gate opening from 25% to 50%, the 3# surface outlet gate is not only excited by the excitation generated from the vibration of the mid-level outlet gate, but also subjected to the fluctuating pressure induced by the high-velocity discharge flow. The reason for the vibration reduction from working condition 5 to 6 is probably due to the variation of the excitation generated by the high-velocity flow discharged through the surface orifice, which is not further investigated in this article. When the hydraulic gate opening increased from 50% to 75%, the vibration of the surface outlet gate decreased due to the absence of flow-induced excitation. As the external excitation is almost unchanged, the RMS values for the accelerations in cases 7 and 8 are very close to each other.
Moreover, in order to explain the possible influence of the mid-level outlet gate vibration on the vibration of the 3# surface outlet gate more clearly, the possible vibration propagation path is briefly illustrated in Figure 3. More detailed analyses are given in subsequent sections.

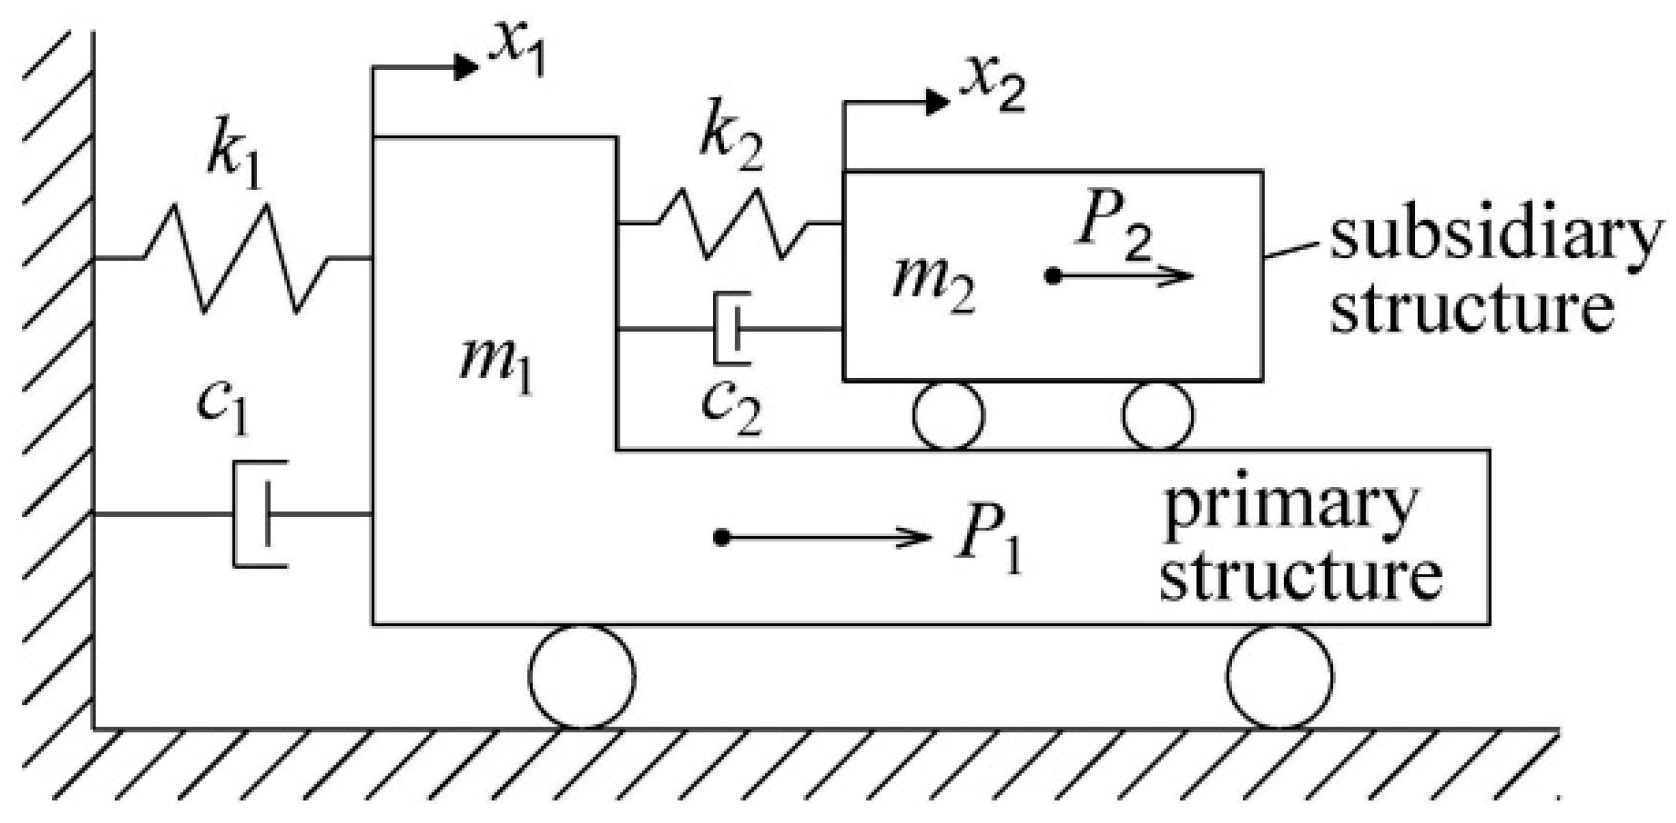
3. Dynamic Response for an Accessory Structure Equipped on the Primary Structure

3.1. Theoretical Model

The vibration problem of a complex multi-degrees-of-freedom (MDOF) system can be transformed into that of a single-degree-of-freedom (SDOF) system using the mode decomposition technique, so that the calculation will be much more convenient. Therefore, regarding the arch dam as the primary structure and the hydraulic gate as the subsidiary structure, respectively, a simplified representation for the complex MDOF dam-gate system is given in Figure 9.
The dynamic equations for the above two-degrees-of-freedom system can be written in following form:
m 1 x ¨ 1 + c 2 ( x ˙ 1 x ˙ 2 ) + k 2 ( x 1 x 2 ) + c 1 x ˙ 1 + k 1 x 1 = P 1 ( t ) + P 2 ( t )
m 2 x ¨ 2 + c 2 ( x ˙ 2 x ˙ 1 ) + k 2 ( x 2 x 1 ) = P 2 ( t )
where, m1, c1 and k1 denote the mass, damping and stiffness for the primary structure, respectively; m2, c2 and k2 denote the mass, damping and stiffness for the subsidiary structure, respectively; x ¨ 1   , x ˙ 1 and x 1 represent the absolute acceleration, velocity and displacement for the primary structure, respectively; x ¨ 2   , x ˙ 2 and x 2 represent the absolute acceleration, velocity and displacement for the subsidiary structure, respectively; P1(t) and P2(t) represent the time-variant external force on the primary and subsidiary structures, respectively; and t denotes the time.
Considering that the system is excited by the harmonic force, the external excitations P1(t) and P2(t) can be expressed as:
P 1 ( t ) = F 1 e i ω 0 t
  P 2 ( t ) = F 2 e i ω 0 t  
where ω 0 denotes the frequency of the external excitations; i represents the imaginary unit; and coefficients F1 and F2 denote the amplitudes of the external harmonic forces. It is noted that the subsequent derivation will be extremely difficult if the frequencies of excitations P1(t) and P2(t) are assigned different values. In order to facilitate the analysis of the dynamic response of the aforementioned system, it is assumed that the external excitations generated by the high velocity discharge flows in the surface and mid-level orifices have similar frequency distributions and the values of the frequencies for excitations P1(t) and P2(t) are equal to each other.
The steady-state dynamic response for the system can be expressed as:
x 1 = X 1 e i ω 0 t
  x 2 = X 2 e i ω 0 t  
Substituting Equations (3)–(6) into Equations (1) and (2), the complex coefficients X1 and X2 can be obtained
X 1 = ( ω 0 2 m 2 + i ω 0 c 2 + k 2 ) F 1 + ( i ω 0 c 2 + k 2 ) F 2 ( ω 0 2 m 2 ) ( i ω 0 c 2 + k 2 ) + ( ω 0 2 m 2 + i ω 0 c 2 + k 2 ) ( ω 0 2 m 1 + i ω 0 c 1 + k 1 )
X 2 = ( i ω 0 c 2 + k 2 ) F 1 + ( ω 0 2 m 1 + i ω 0 c 1 + k 1 + i ω 0 c 2 + k 2 ) F 2 ( ω 0 2 m 2 ) ( i ω 0 c 2 + k 2 ) + ( ω 0 2 m 2 + i ω 0 c 2 + k 2 ) ( ω 0 2 m 1 + i ω 0 c 1 + k 1 )  
If the subsidiary structure is not subjected to the external load (i.e., the surface orifice gate is not directly affected by the fluctuating pressure induced by flood discharge), Equation (8) can be rewritten as
X 2 = ( i ω 0 c 2 + k 2 ) F 1 ( ω 0 2 m 2 ) ( i ω 0 c 2 + k 2 ) + ( ω 0 2 m 2 + i ω 0 c 2 + k 2 ) ( ω 0 2 m 1 + i ω 0 c 1 + k 1 )
It is noted that the dynamic response of the subsidiary structure should be calculated by Equation (8) when the surface outlet radial gate is partially opened, and the outflow water directly impacts the bottom of the gate. Moreover, the displacement of the accessory structure should be calculated by Equation (9) when the surface outlet radial gate is closed or largely opened and no interaction between outflow water and radial gate is generated. As the phase information is included in the above expressions of X2, the moduli of X2 with and without considering the external excitation P2(t) are deduced and given as follows to facilitate following analysis:
| X 2 | X s t = A 1 2 + A 2 2 C 1 2 + C 2 2
  | X 2 | X s t = B 1 2 + B 2 2 C 1 2 + C 2 2  
where
A 1 = 1 ω 01 2 ω 12 2 m 12 F 21 + ω 12 2 m 12 F 21 + F 21
  A 2 = 2 ξ 2 ω 12 ω 01 + 2 ξ 1 F 21 ω 12 2 ω 01 m 12 + 2 ξ 2 F 21 ω 12 ω 01  
  B 1 = 1  
  B 2 = 2 ξ 2 ω 12 ω 01  
  C 1 = ω 01 4 ω 12 2 ω 12 2 ω 01 2 4 ξ 1 ξ 2 ω 01 2 ω 12 ω 01 2 m 21 ω 01 2 + 1  
  C 2 = 2 ξ 1 ω 01 3 ω 12 2 + 2 ξ 2 ω 01 3 ω 12 2 ξ 2 ω 01 ω 12 + 2 ξ 2 ω 01 3 ω 12 m 21 2 ξ 1 ω 01  
  X s t = F 1 k 1  
The parameters in Equations (12) to (16) can be expressed as
ω 1 = k 1 m 1
  ω 2 = k 2 m 2  
  ω a b = ω a ω b                   ( a ,   b = 0 ,   1 ,   2 )  
  m a b = m a m b                 ( a ,   b = 1 ,   2 )  
  F a b = F a F b                   ( a ,   b = 1 ,   2 )  
  ξ 1 = c 1 2 m 1 ω 1  
  ξ 2 = c 2 2 m 2 ω 2  
It is worth noting that the aforementioned theoretical model is developed from the passive control theory. Conventional theory analysis of structures equipped with DVAs mainly focuses on the dynamic response of primary structures rather than the accessory structures (i.e., the DVA), and the damping of primary structures as well as the external force on accessory structures are generally ignored in the existing literature. However, considering the actual condition for the surface outlet gate vibration of the Jinping hydropower station, more attention should be paid to the accessory structures equipped on the large-scale primary structure and, moreover, the subsequent analysis indicates that the primary structure damping and the external force on accessory structure will significantly affect the dynamic response of accessory structures, such as the hydraulic gates.
In order to clarify the cause and mechanism of the intense vibration of the surface outlet gate, we first investigated the general characteristics of the dynamic response of the accessory structures equipped on large-scale structures without considering the external excitation P2, and then a similar investigation was carried out with the consideration of excitation P2. Obviously, the vibration of the surface orifice gate is a specific case of the aforementioned theoretical model.

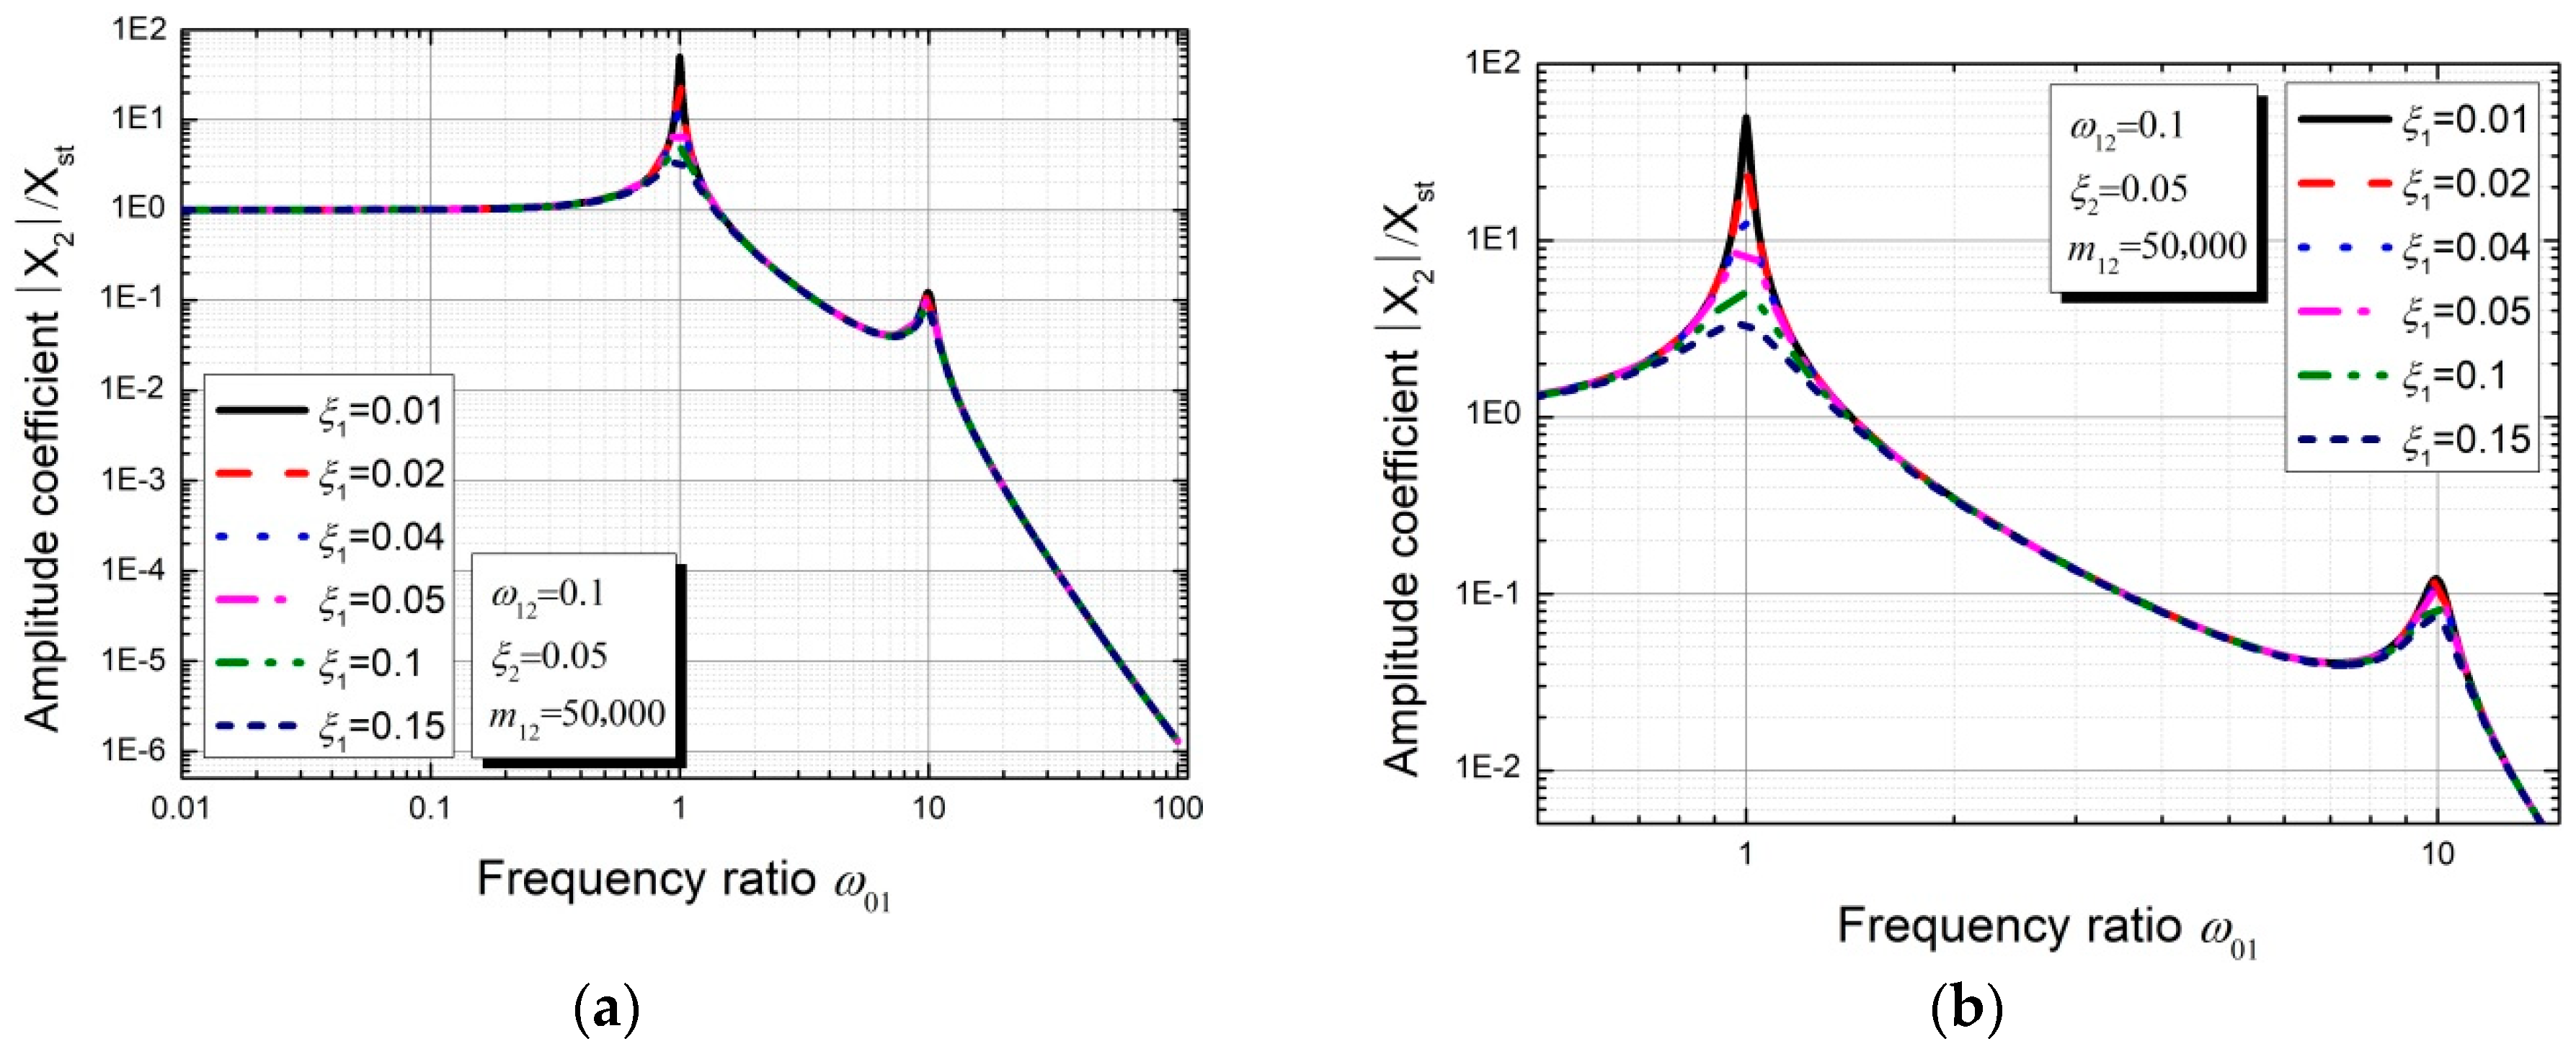
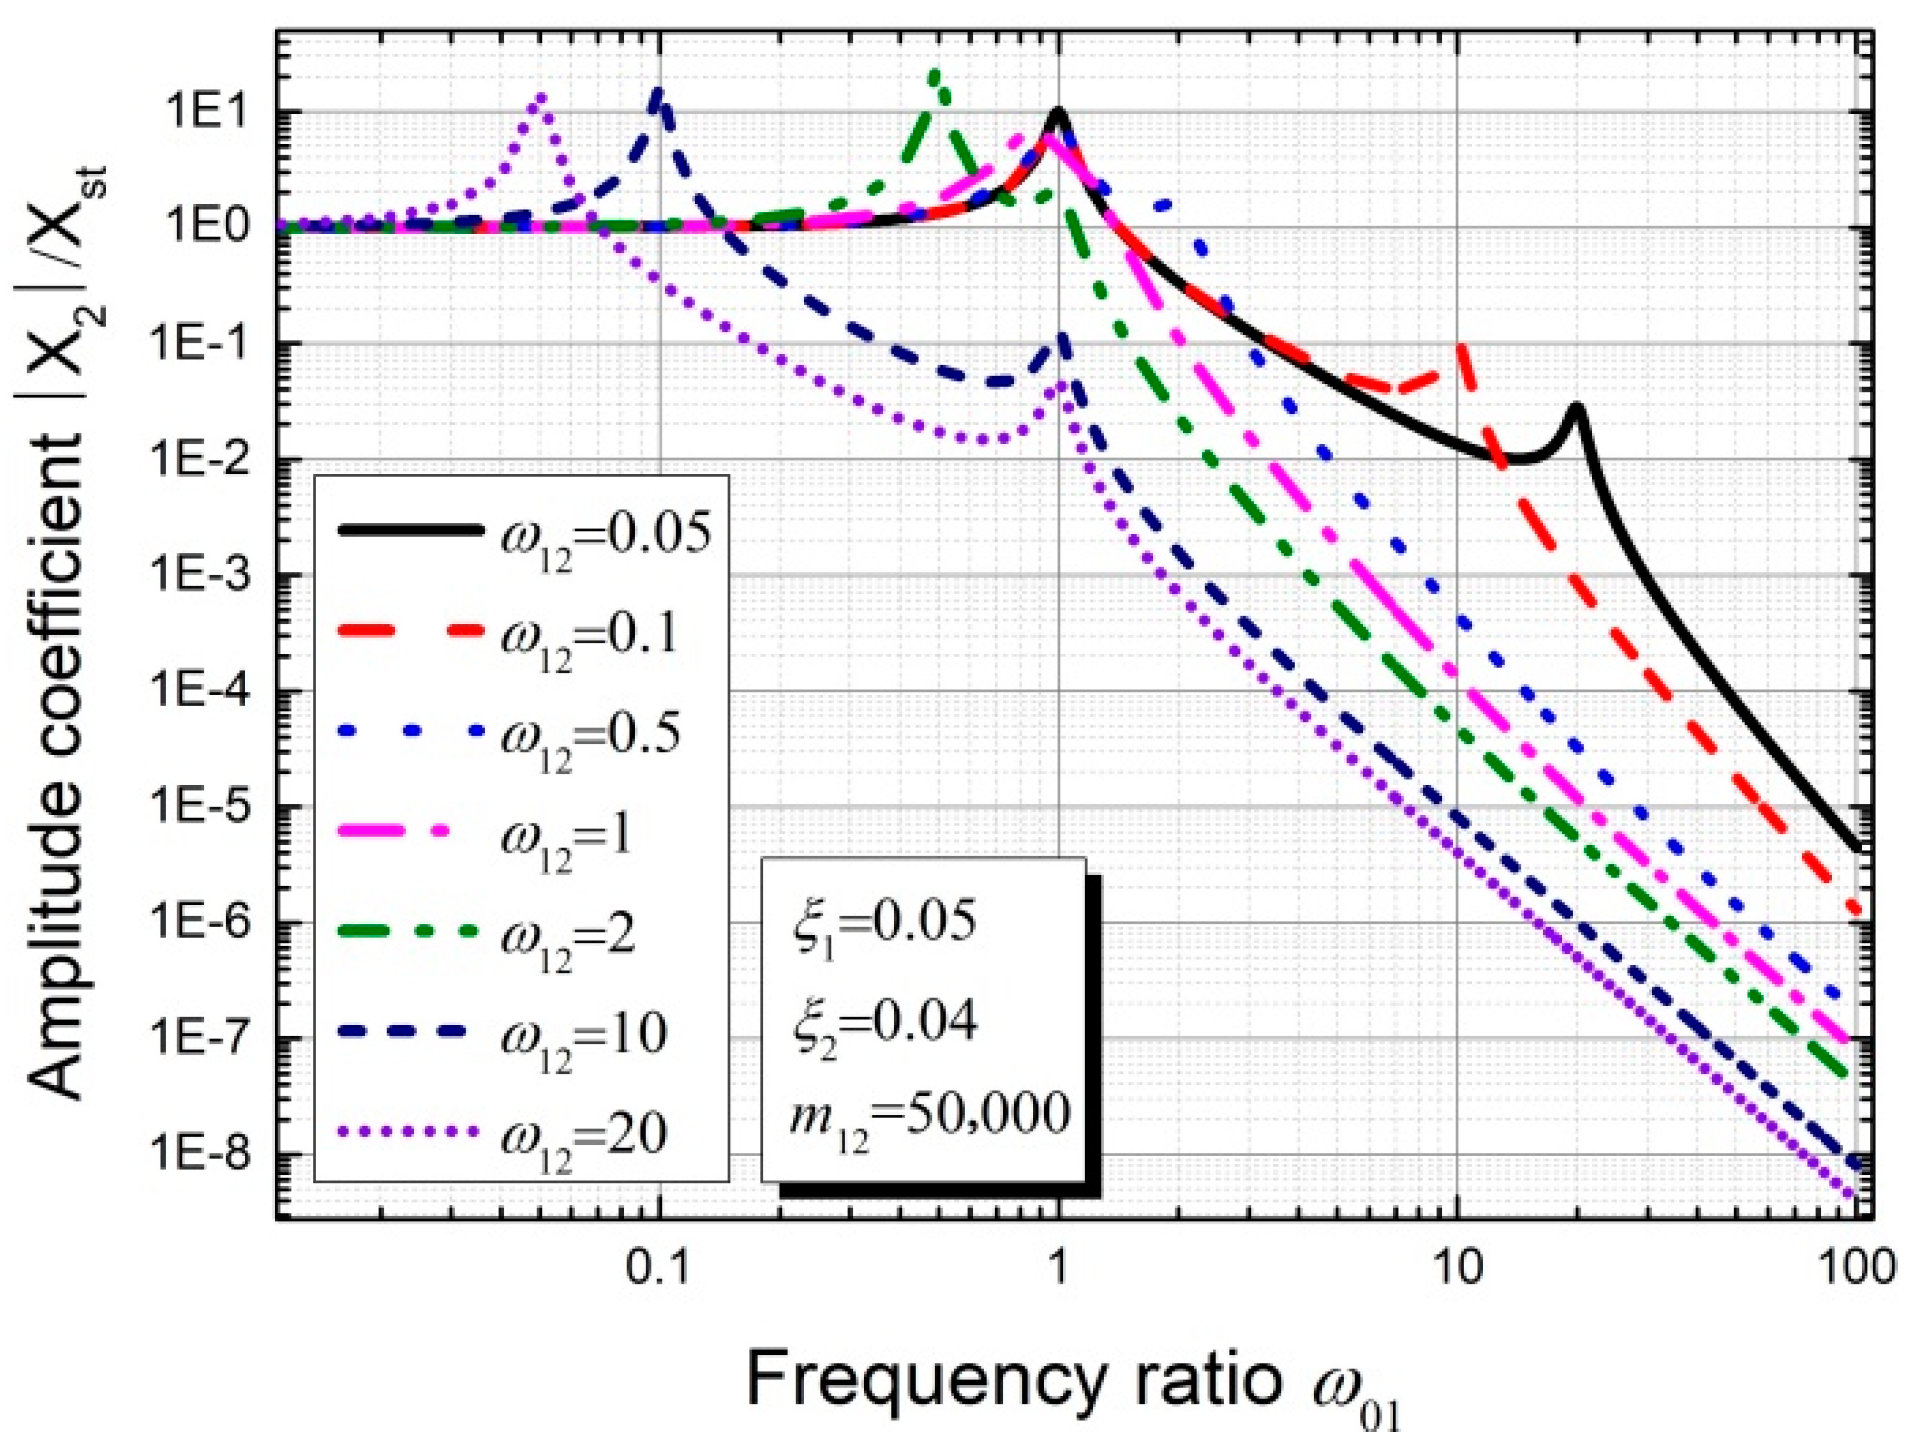
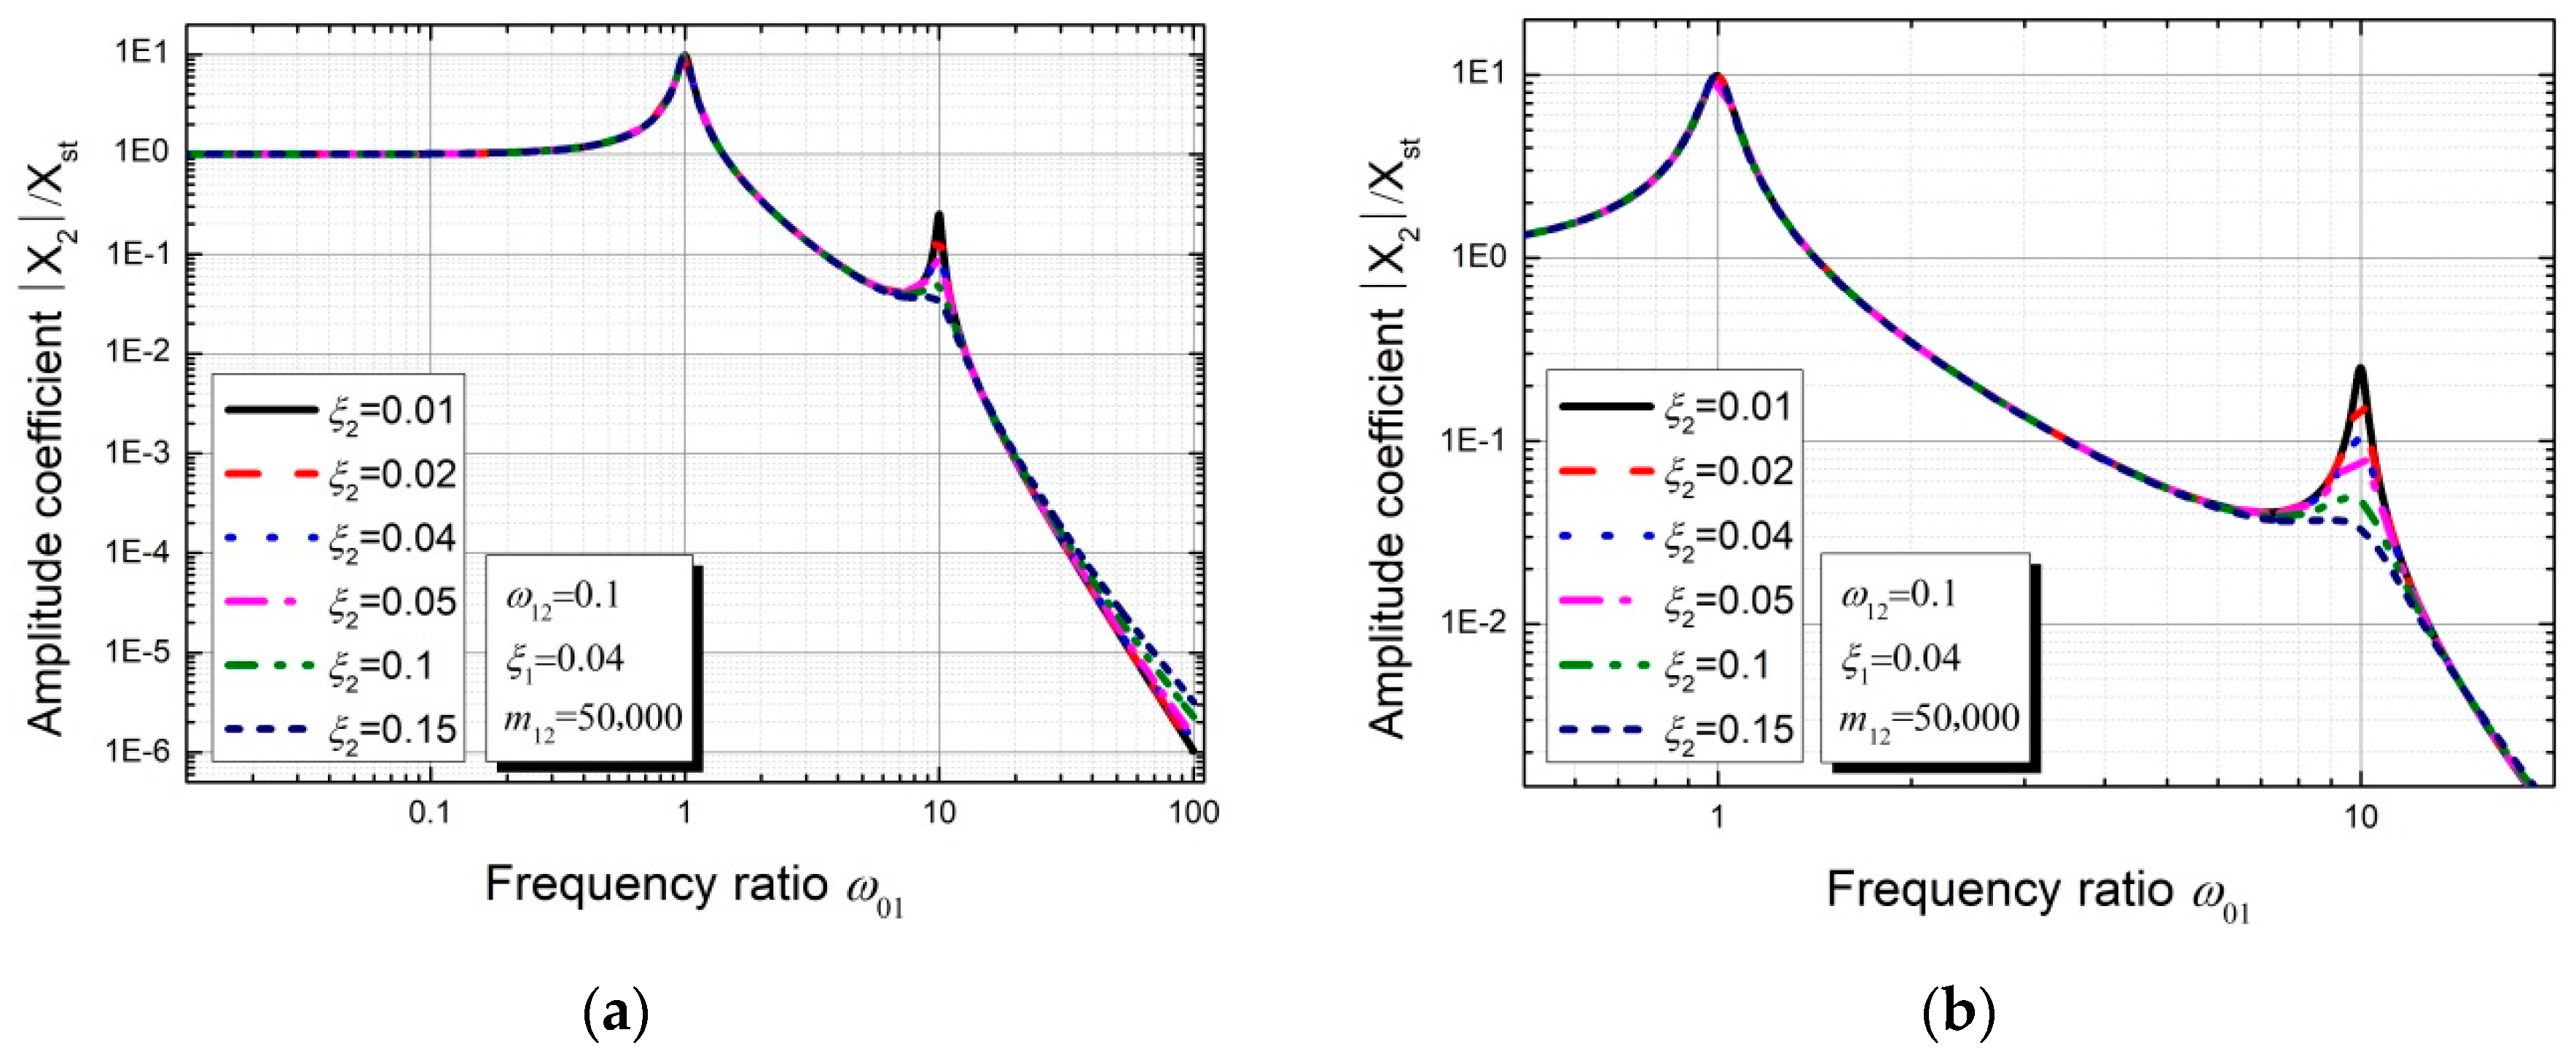
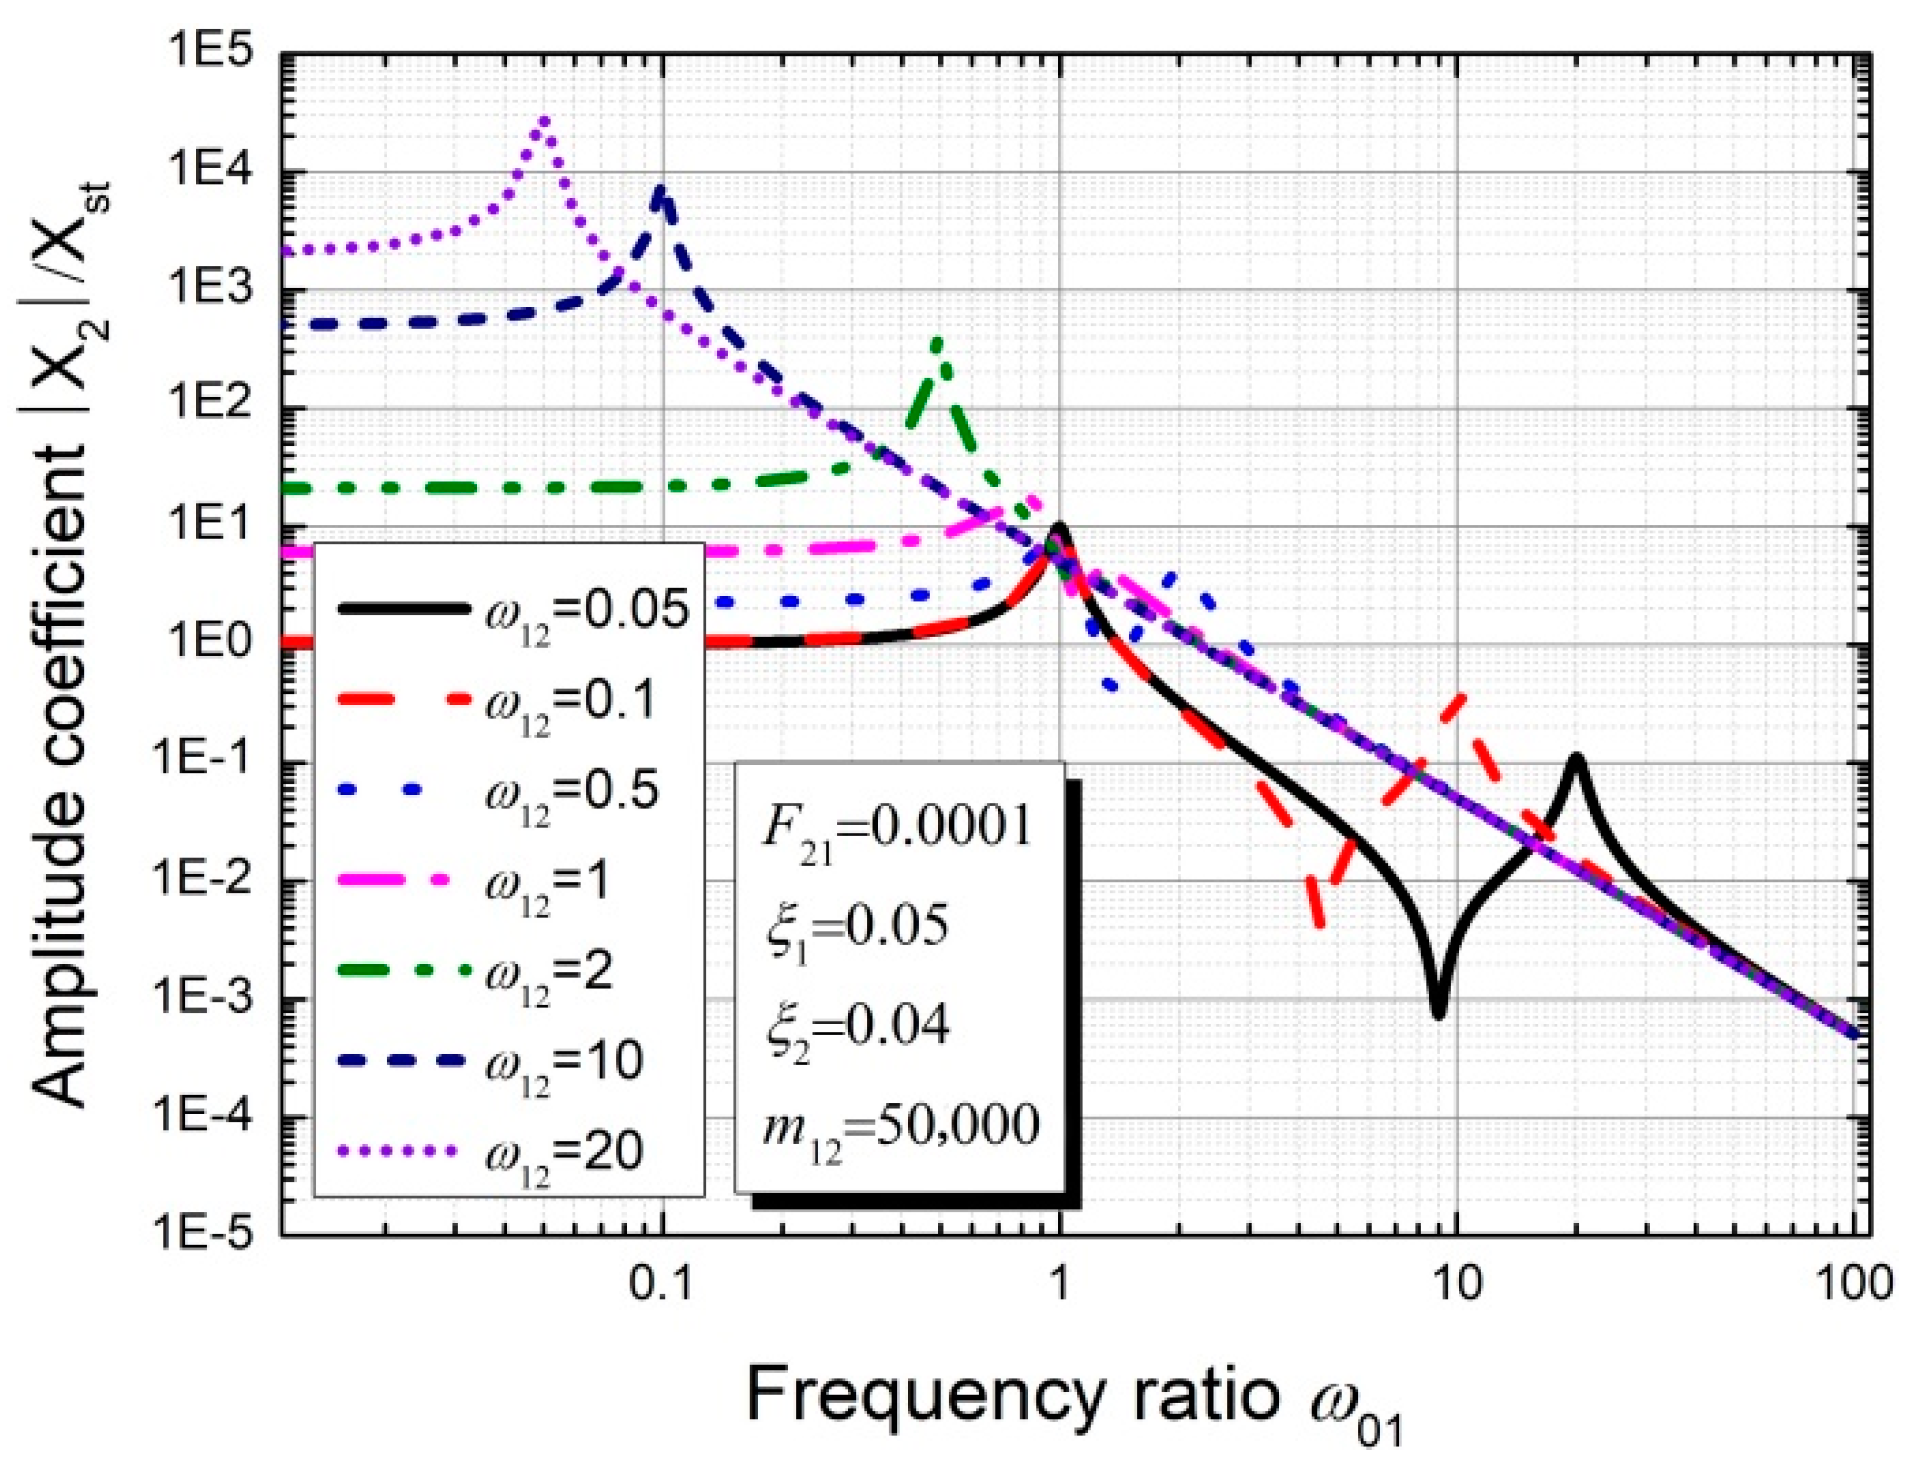
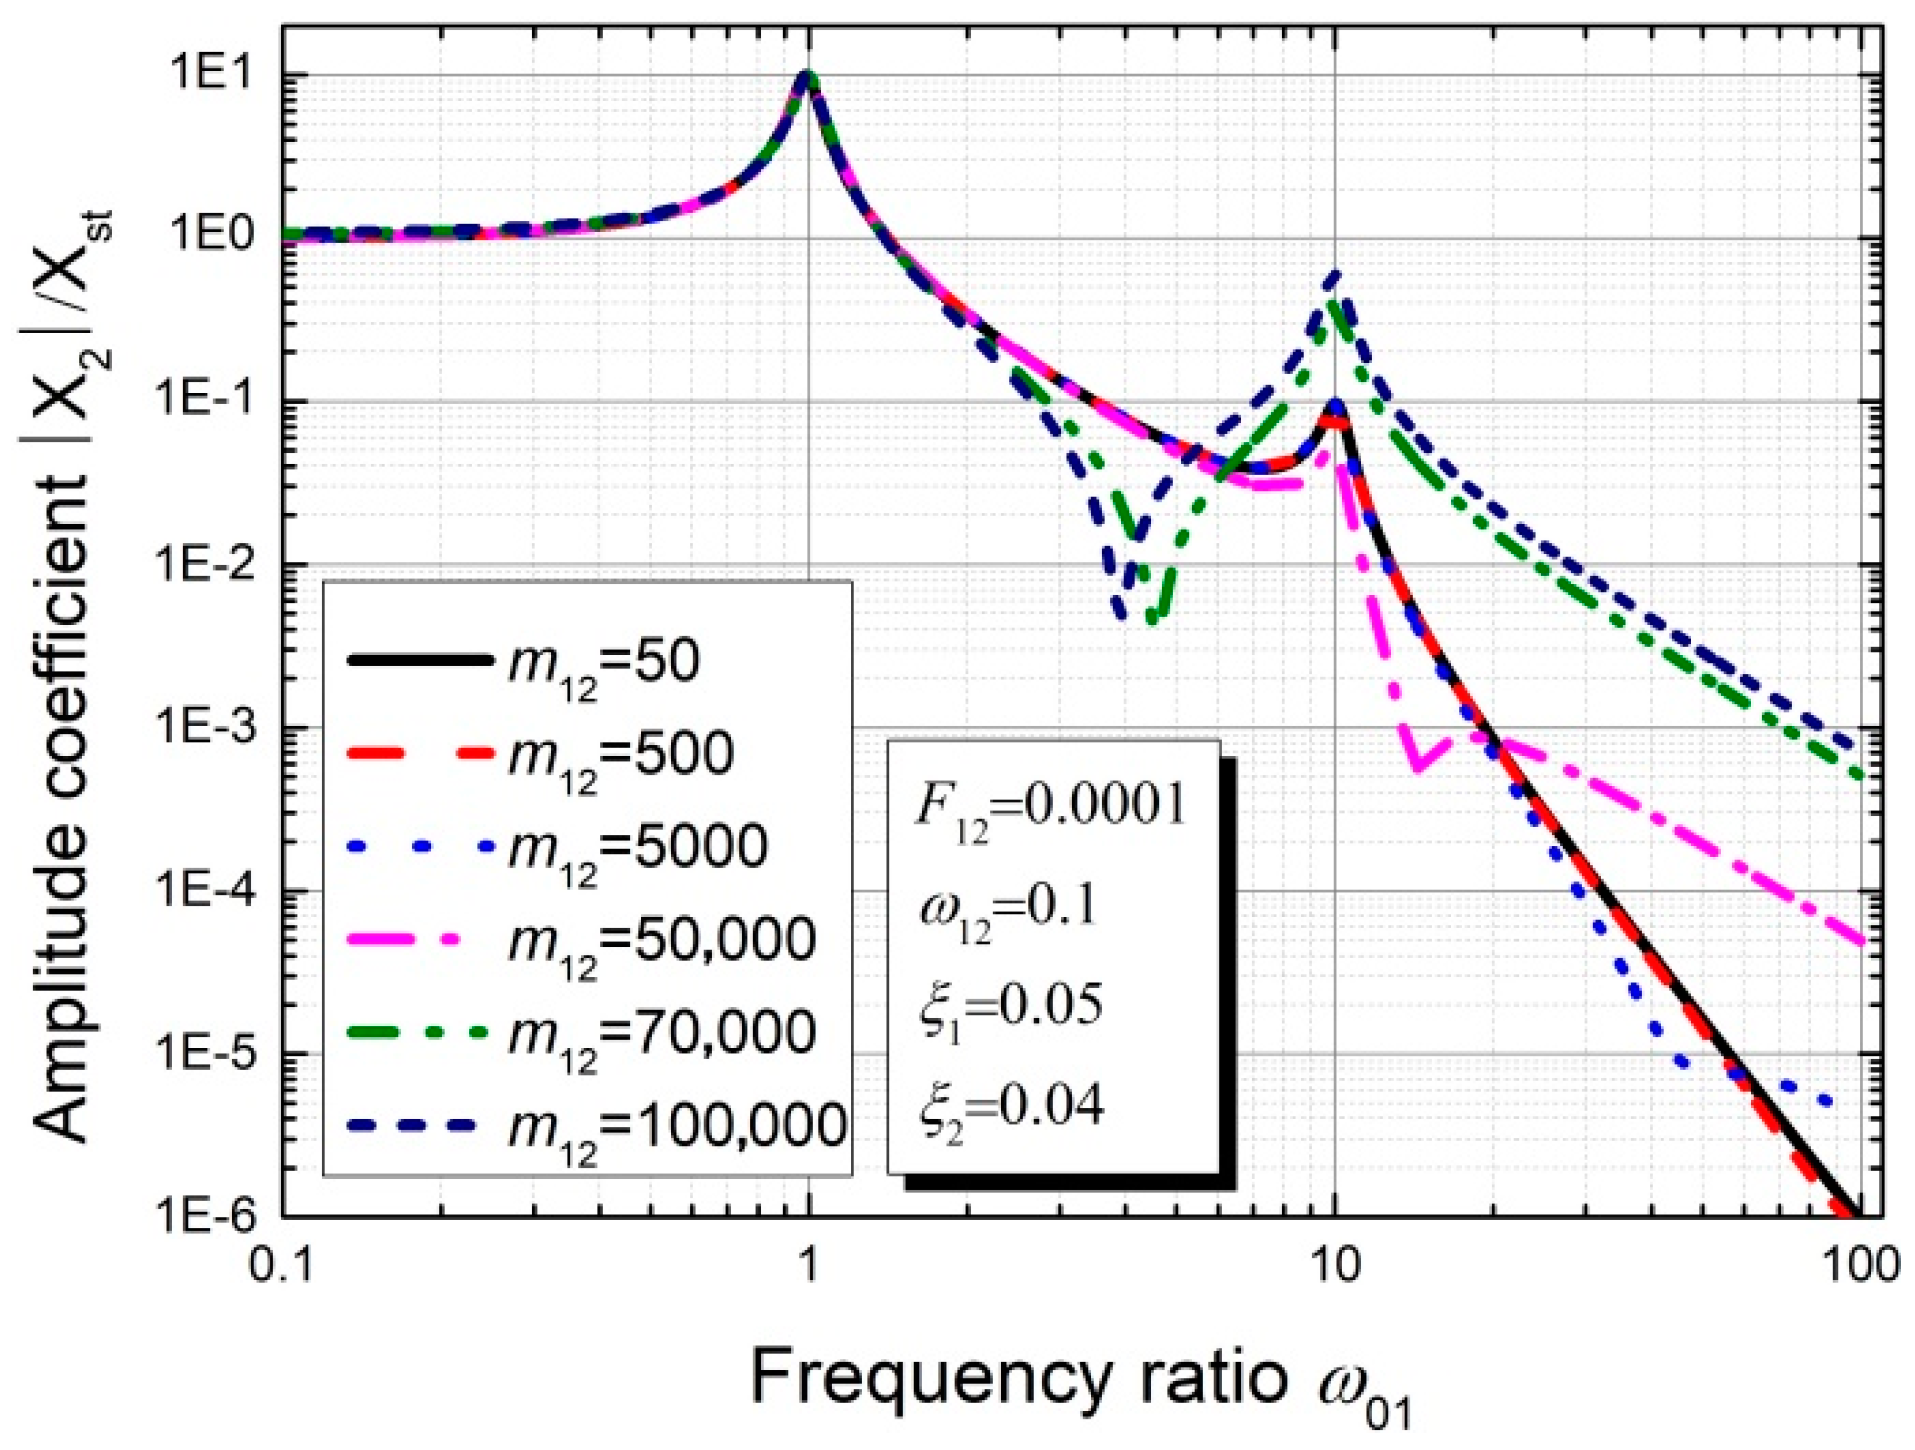
3.2. Parameter Sensitivity Analysis of the Theoretical Model without Considering Excitation P2

According to the code for the seismic design of buildings, the damping ratio of large-scale concrete structures is generally about 0.05, and that of accessory structures which are made of steel and lower than 50 m is considered equal to 0.04. Moreover, the mass ratio m 12 is considered equal to 50,000, which indicates that the mass of the accessory structure is far less than that of the primary structure. Based on the aforementioned parameter values, Figure 10 gives the frequency response for the subsidiary structure of the two-degrees-of-freedom system shown in Figure 9 with varying parameter ω12. It is noted that there are two peaks in the amplitude coefficient curves in Figure 10 when the parameter ω 12 1 , and there is only one peak when parameter ω 12 = 1 . Therefore, it is understandable that the two peaks coincide with each other when the natural frequency of the primary structure equals that of accessory structure. As illustrated in Figure 10, the peak corresponding to the lower external excitation frequency is always higher than the rest peak. Generally speaking, the vibration frequency of the accessory structure is usually higher than that of the large-scale primary structure and the value of ω 12 is considered to be 0.1 in the following analysis. Therefore, it is considered that the dynamic response of the subsidiary structure in the case of ω 0 = ω 1 is greater than that in the case of ω 0 = ω 2 . The possible reason for this is that the dynamic response of the subsidiary structure is significantly amplified by the resonance of the primary structure when ω 0 = ω 1 and the amplification effect is not so obvious when ω 0 = ω 2 , because the external force does not act directly on the accessory structure.
As shown in Figure 11, the influence of the damping ratio ξ2 on the dynamic response of the accessory structure was investigated. It is noted that the peak value decreases with increasing damping ratio ξ2 in the case of ω 0 = ω 2 (i.e., ω 01 = 10 ), and the amplitude coefficient slightly increases with increasing ξ2 at the end of the curves. Moreover, the varying parameter ξ2 has no influence on the first peak of the curves, which indicates that the maximum possible value for the amplification factor is not reduced.
As illustrated in Figure 12, the influence of the damping ratio ξ1 on the accessory structure’s dynamic response is investigated. The first peak value significantly decreases with increase of the damping ratio ξ1 in the case of ω 0 = ω 1 (i.e., ω 01 = 1 ), and the second peak value slightly decreases with increasing ξ1 when ω 0 = ω 2 (i.e., ω 01 = 10 ). Therefore, the peak dynamic response of the accessory structure will be effectively reduced when the primary structure’s damping ratio increases and the values of the parameters ω 12 , ξ2 and m12 remain unchanged.
According to the analysis, the mass ratio m 12 has no influence on the accessory structure’s dynamic response under the condition of ω 12 = 0.1 , ξ 1 = 0.05 and ξ 2 = 0.04 . To save space, the figure for the frequency response of the subsidiary structure with varying parameter m 12 is not given.

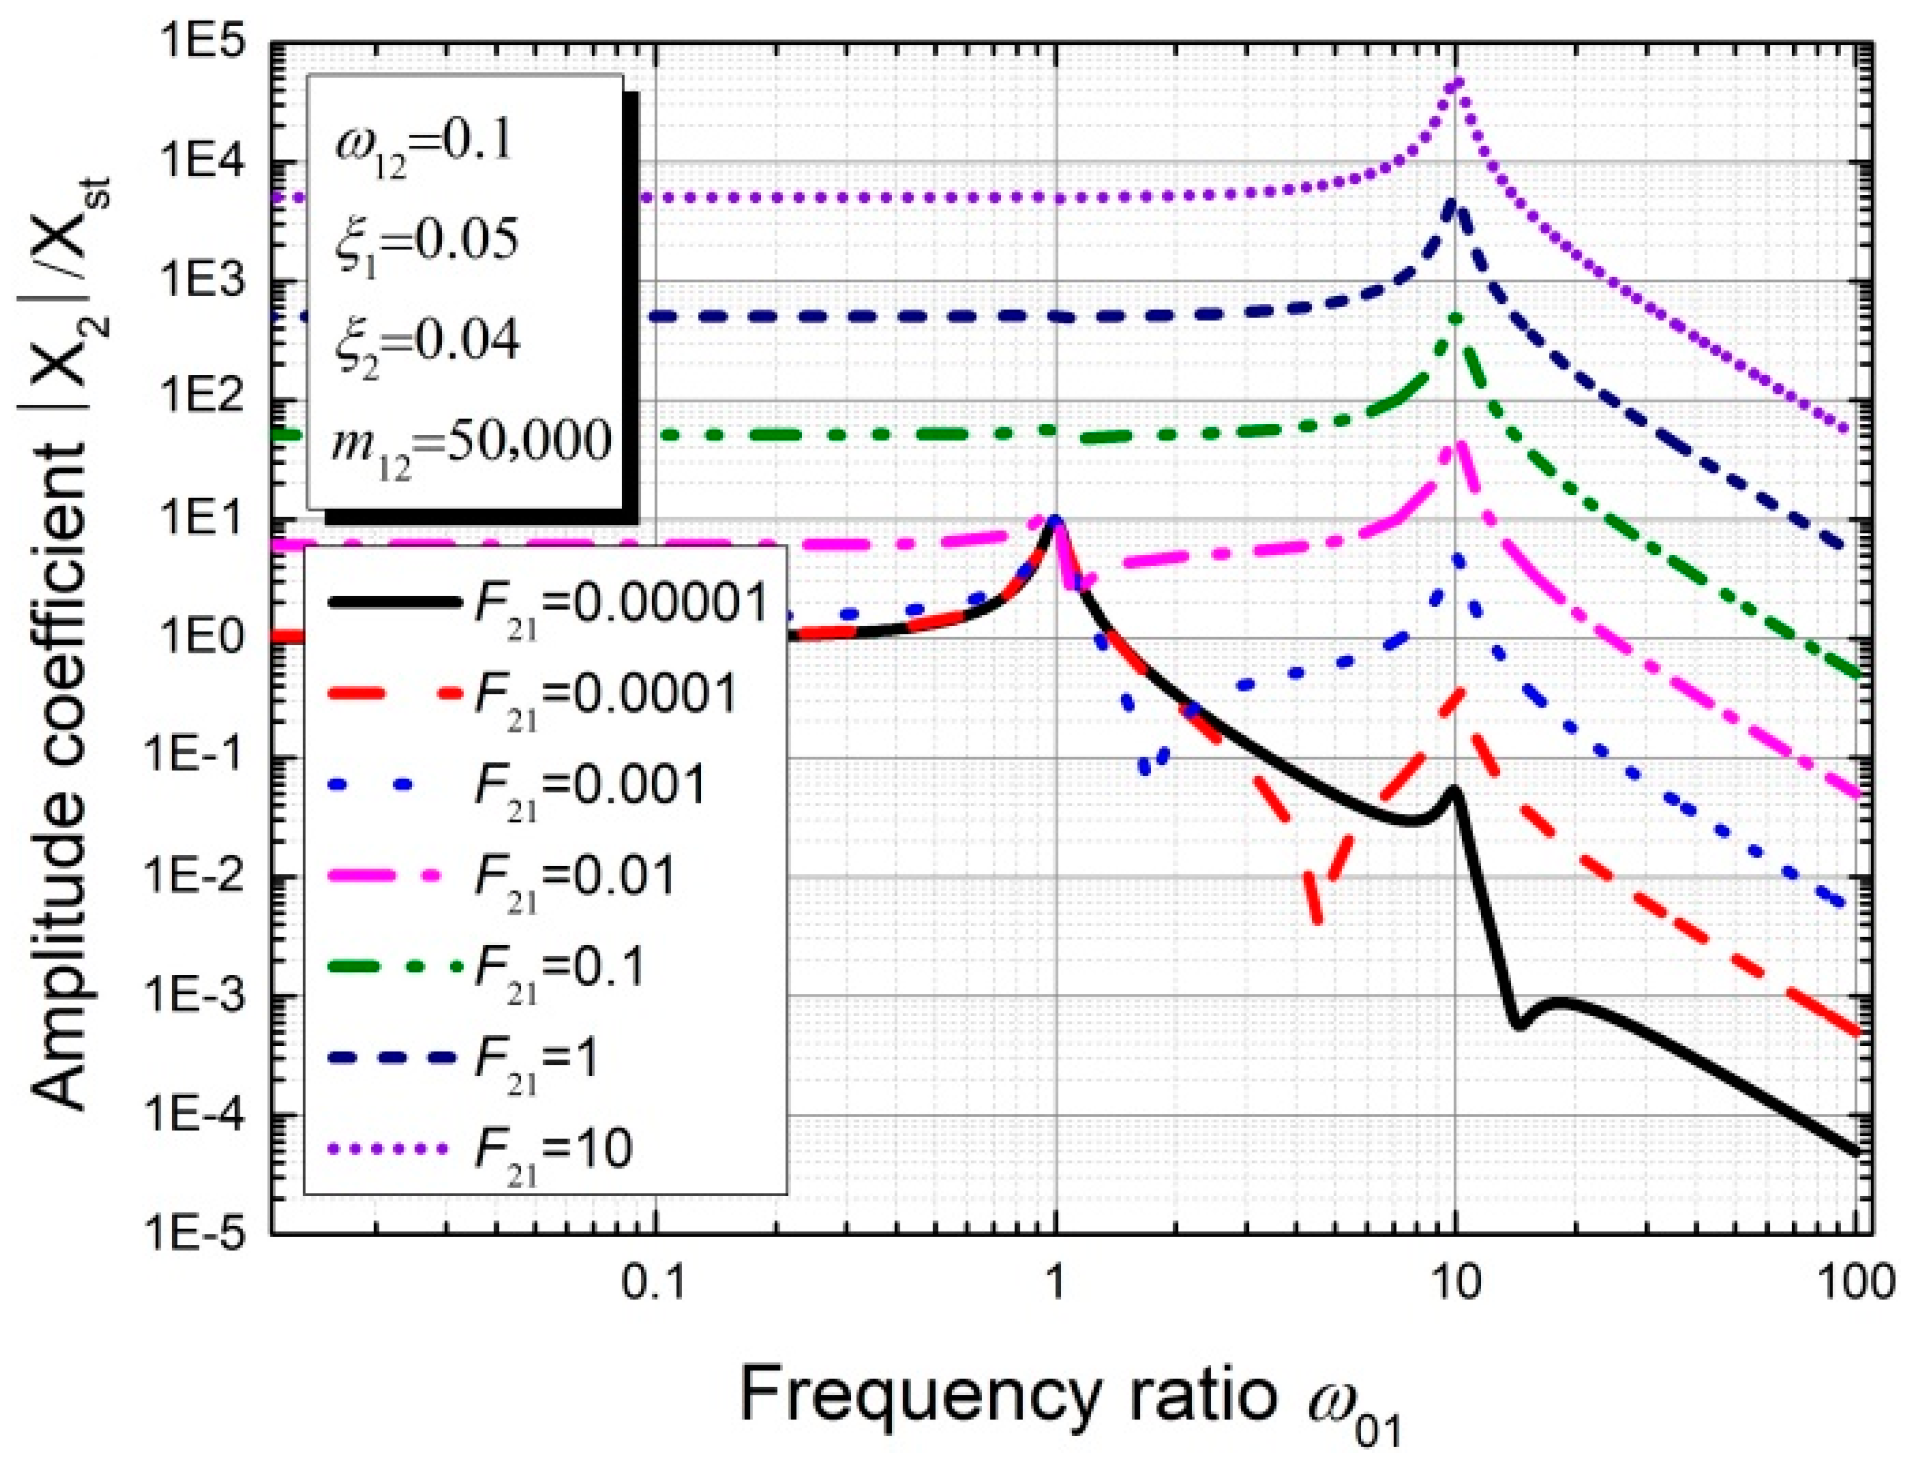
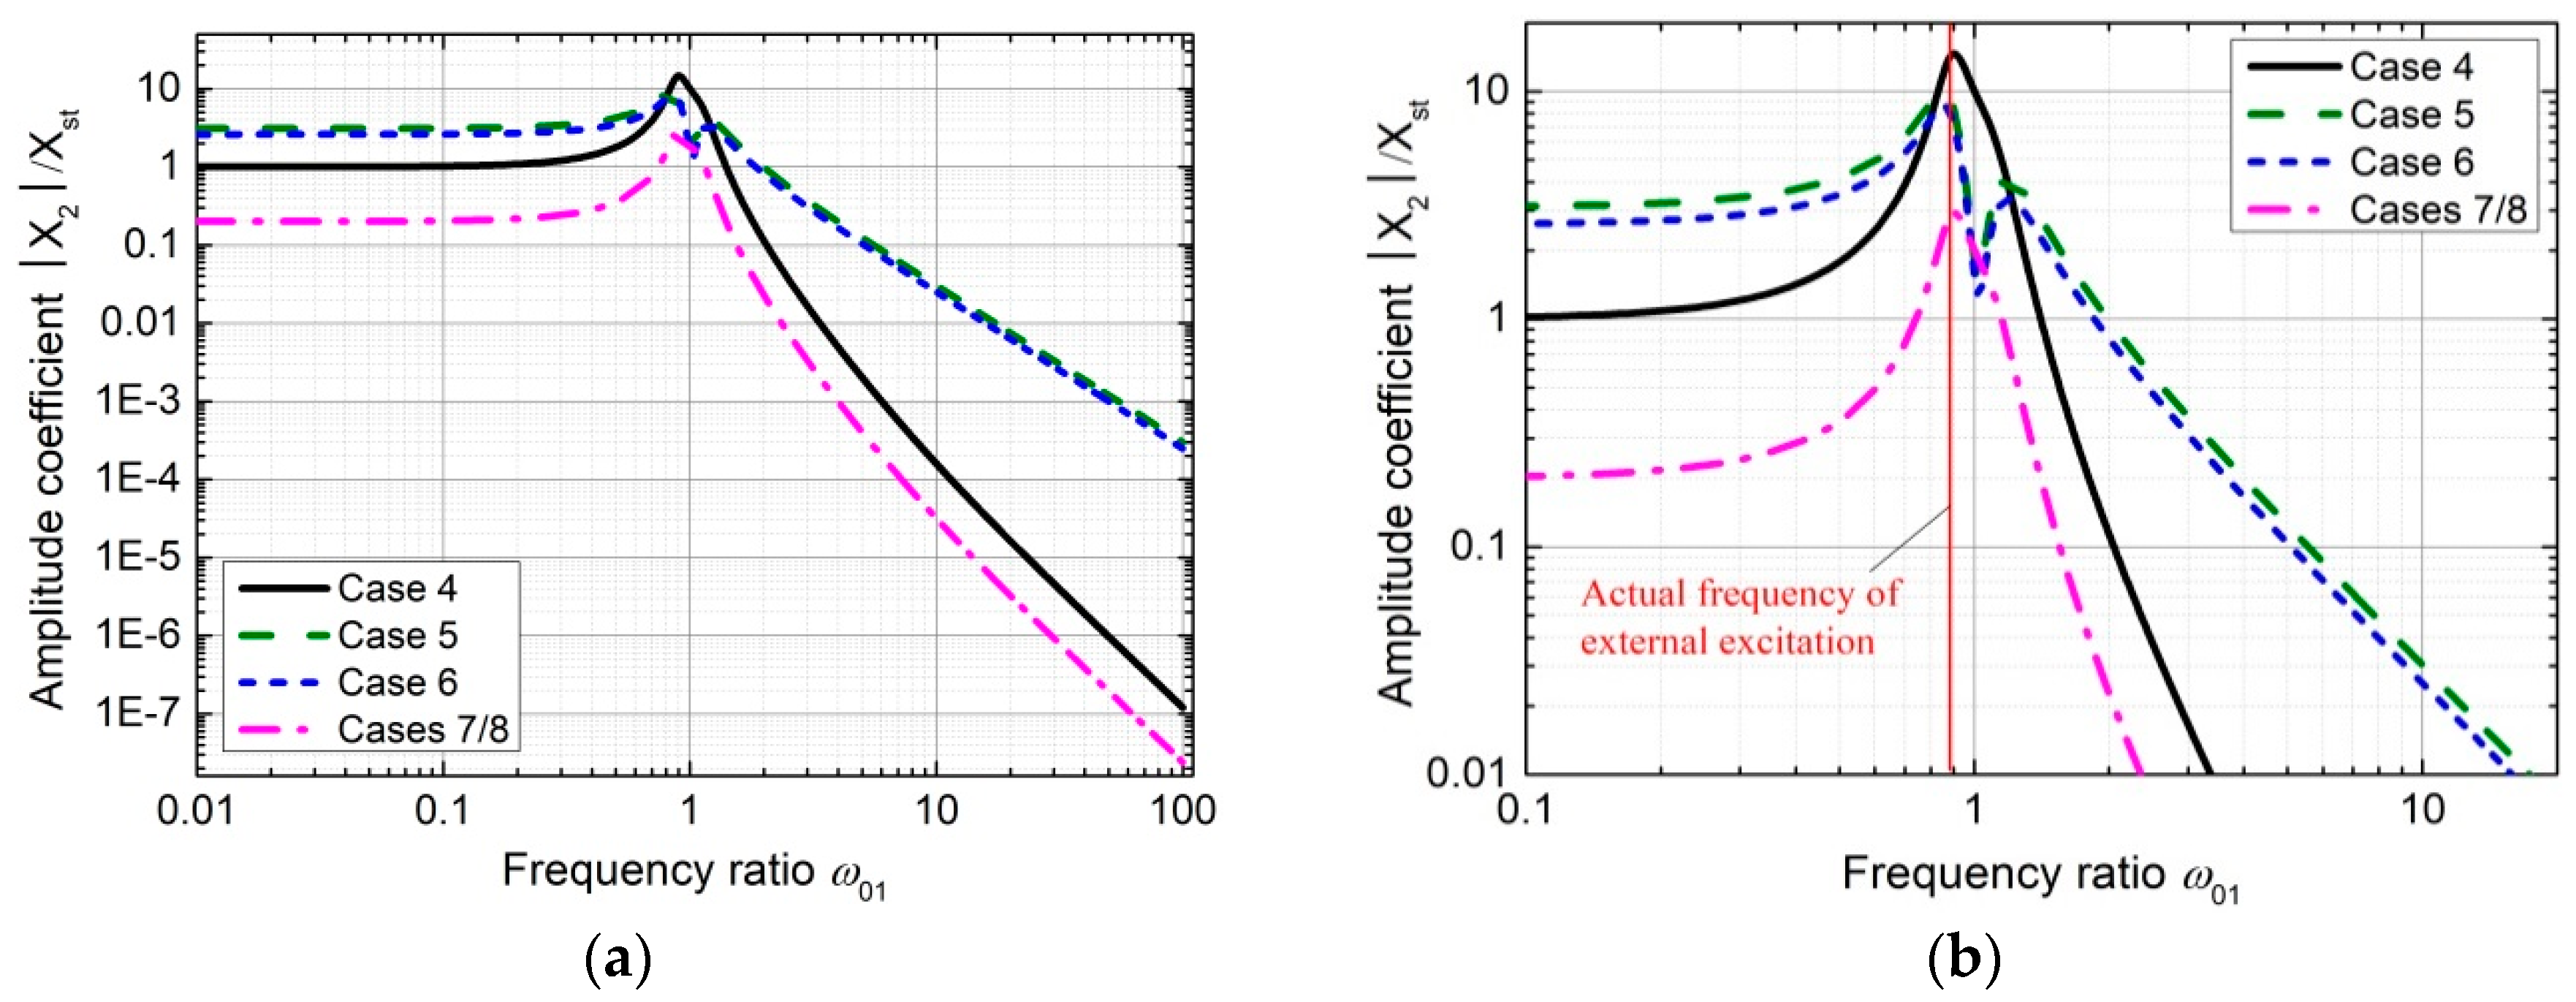
3.3. Parameter Sensitivity Analysis of the Theoretical Model Considering Excitation P2

Figure 13 illustrates the influence of the excitation amplitude ratio F21 on the subsidiary structure’s dynamic response. It is noted that the second peak value significantly increases with increasing parameter F21 and the first peak becomes increasingly inconspicuous as the excitation amplitude F2 increases. The reason for this is that the external force P2, which directly impacts the subsidiary structure, has more influence on the accessory structure’s dynamic response than the excitation P1. As the amplitude ratio F21 increases, the external force P2 will make a major contribution to the dynamic behavior of the accessory structure and the contribution from excitation P1 can be ignored. Generally speaking, the value of parameter F21 cannot be very large in the case of a small mass ratio m21, thus the parameter F21 is considered equal to 0.0001 in the following analysis.
As shown in Figure 14, there are two peaks in the amplitude coefficient curves in the case of ω 12 1 and the peak corresponding to the higher excitation frequency disappears when ω 12 > 1 . Generally speaking, the vibration frequency of the accessory structure is usually higher than that of the large-scale primary structure and the value of ω 12 is considered to be 0.1 in the following analysis. Therefore, it is considered that the dynamic response of the subsidiary structure in the case of ω 0 = ω 1 is greater than that in the case of ω 0 = ω 2 . The possible reason for this is that the dynamic behavior of the subsidiary structure is significantly amplified by the resonance of the primary structure when ω 0 = ω 1 and the excitation P2 is not large enough to make a major contribution for the accessory structure’s dynamic response.
The influence of the damping ratio ξ2 on the dynamic response of the accessory structure is investigated under the condition of ω 12 = 0.1 , m 12 = 50,000 , ξ 1 = 0.05 and F 12 = 0.0001 . It is noted that the peak value decreases with increase of the damping ratio ξ2 in the case of ω 0 = ω 2 (i.e., ω 01 = 10 ) and the varying parameter ξ2 has no influence on the first peak of the curves, which indicates that the maximum possible value for the amplification factor is not reduced. Moreover, the influence of the damping ratio ξ1 on the accessory structure dynamic response is investigated under the condition of ω 12 = 0.1 , m 12 = 50,000 , ξ 2 = 0.04 and F 12 = 0.0001 . The first peak value significantly decreases with increase of the damping ratio ξ1 in the case of ω 0 = ω 1 (i.e., ω 01 = 1 ), and the second peak value slightly decreases with increasing ξ1 when ω 0 = ω 2 (i.e., ω 01 = 10 ). Therefore, the maximum possible dynamic response of the accessory structure will be effectively reduced when the primary structure damping ratio increases and the values of the parameters ω 12 , ξ2, m12 and F12 remain unchanged. To avoid redundancy, the figures for the frequency response of the subsidiary structure with varying parameters ξ1 and ξ2 are not given.
According to Figure 15, the mass ratio m 12 has complex effects on the second peak of the frequency response curves under the condition of ω 12 = 0.1 , ξ 1 = 0.05 , ξ 2 = 0.04 and F 12 = 0.0001 . It is noted that the subsidiary structure’s dynamic response will increase with decrease of the accessory structure mass m 2 , while the excitation P2 remains unchanged.

4. Modal Analysis of the 3# Surface Orifice Gate

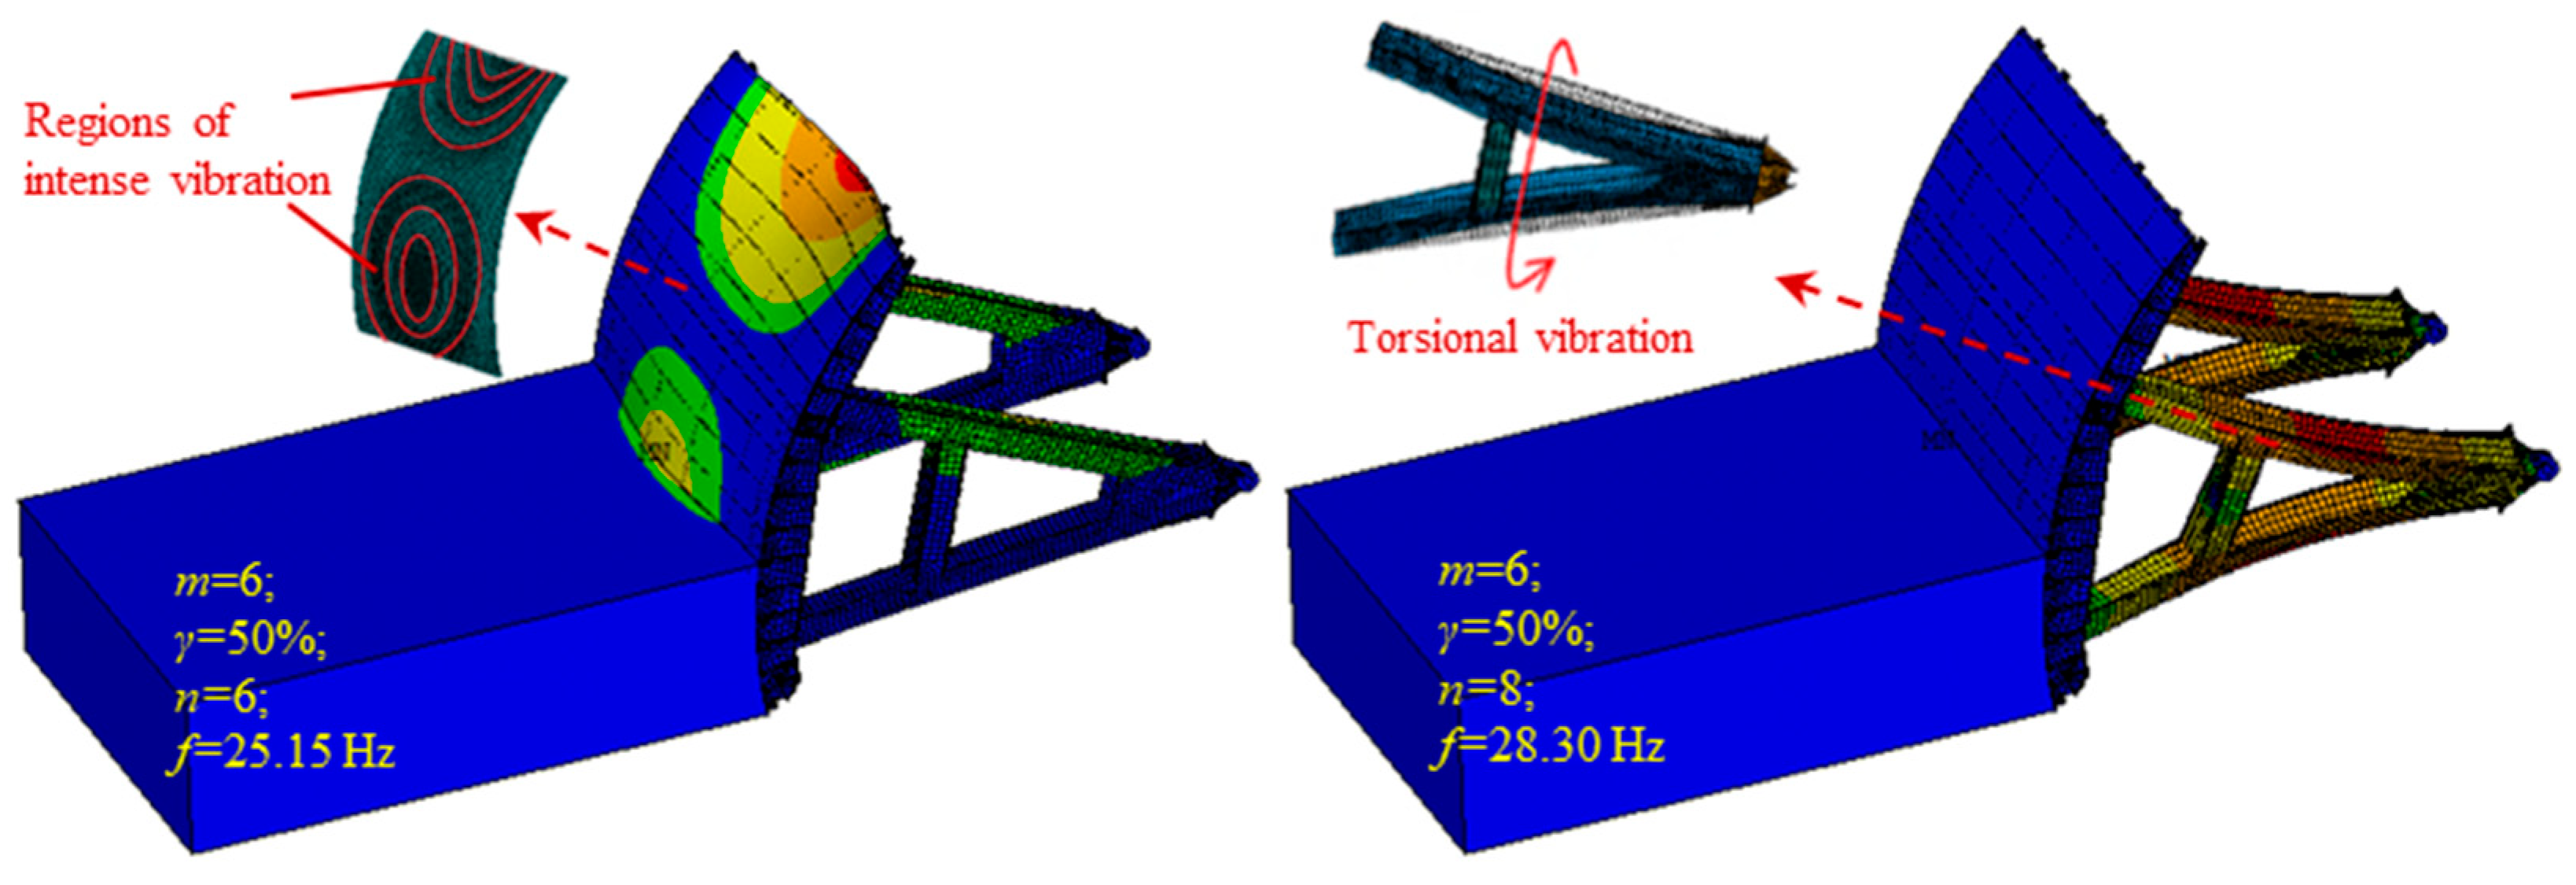
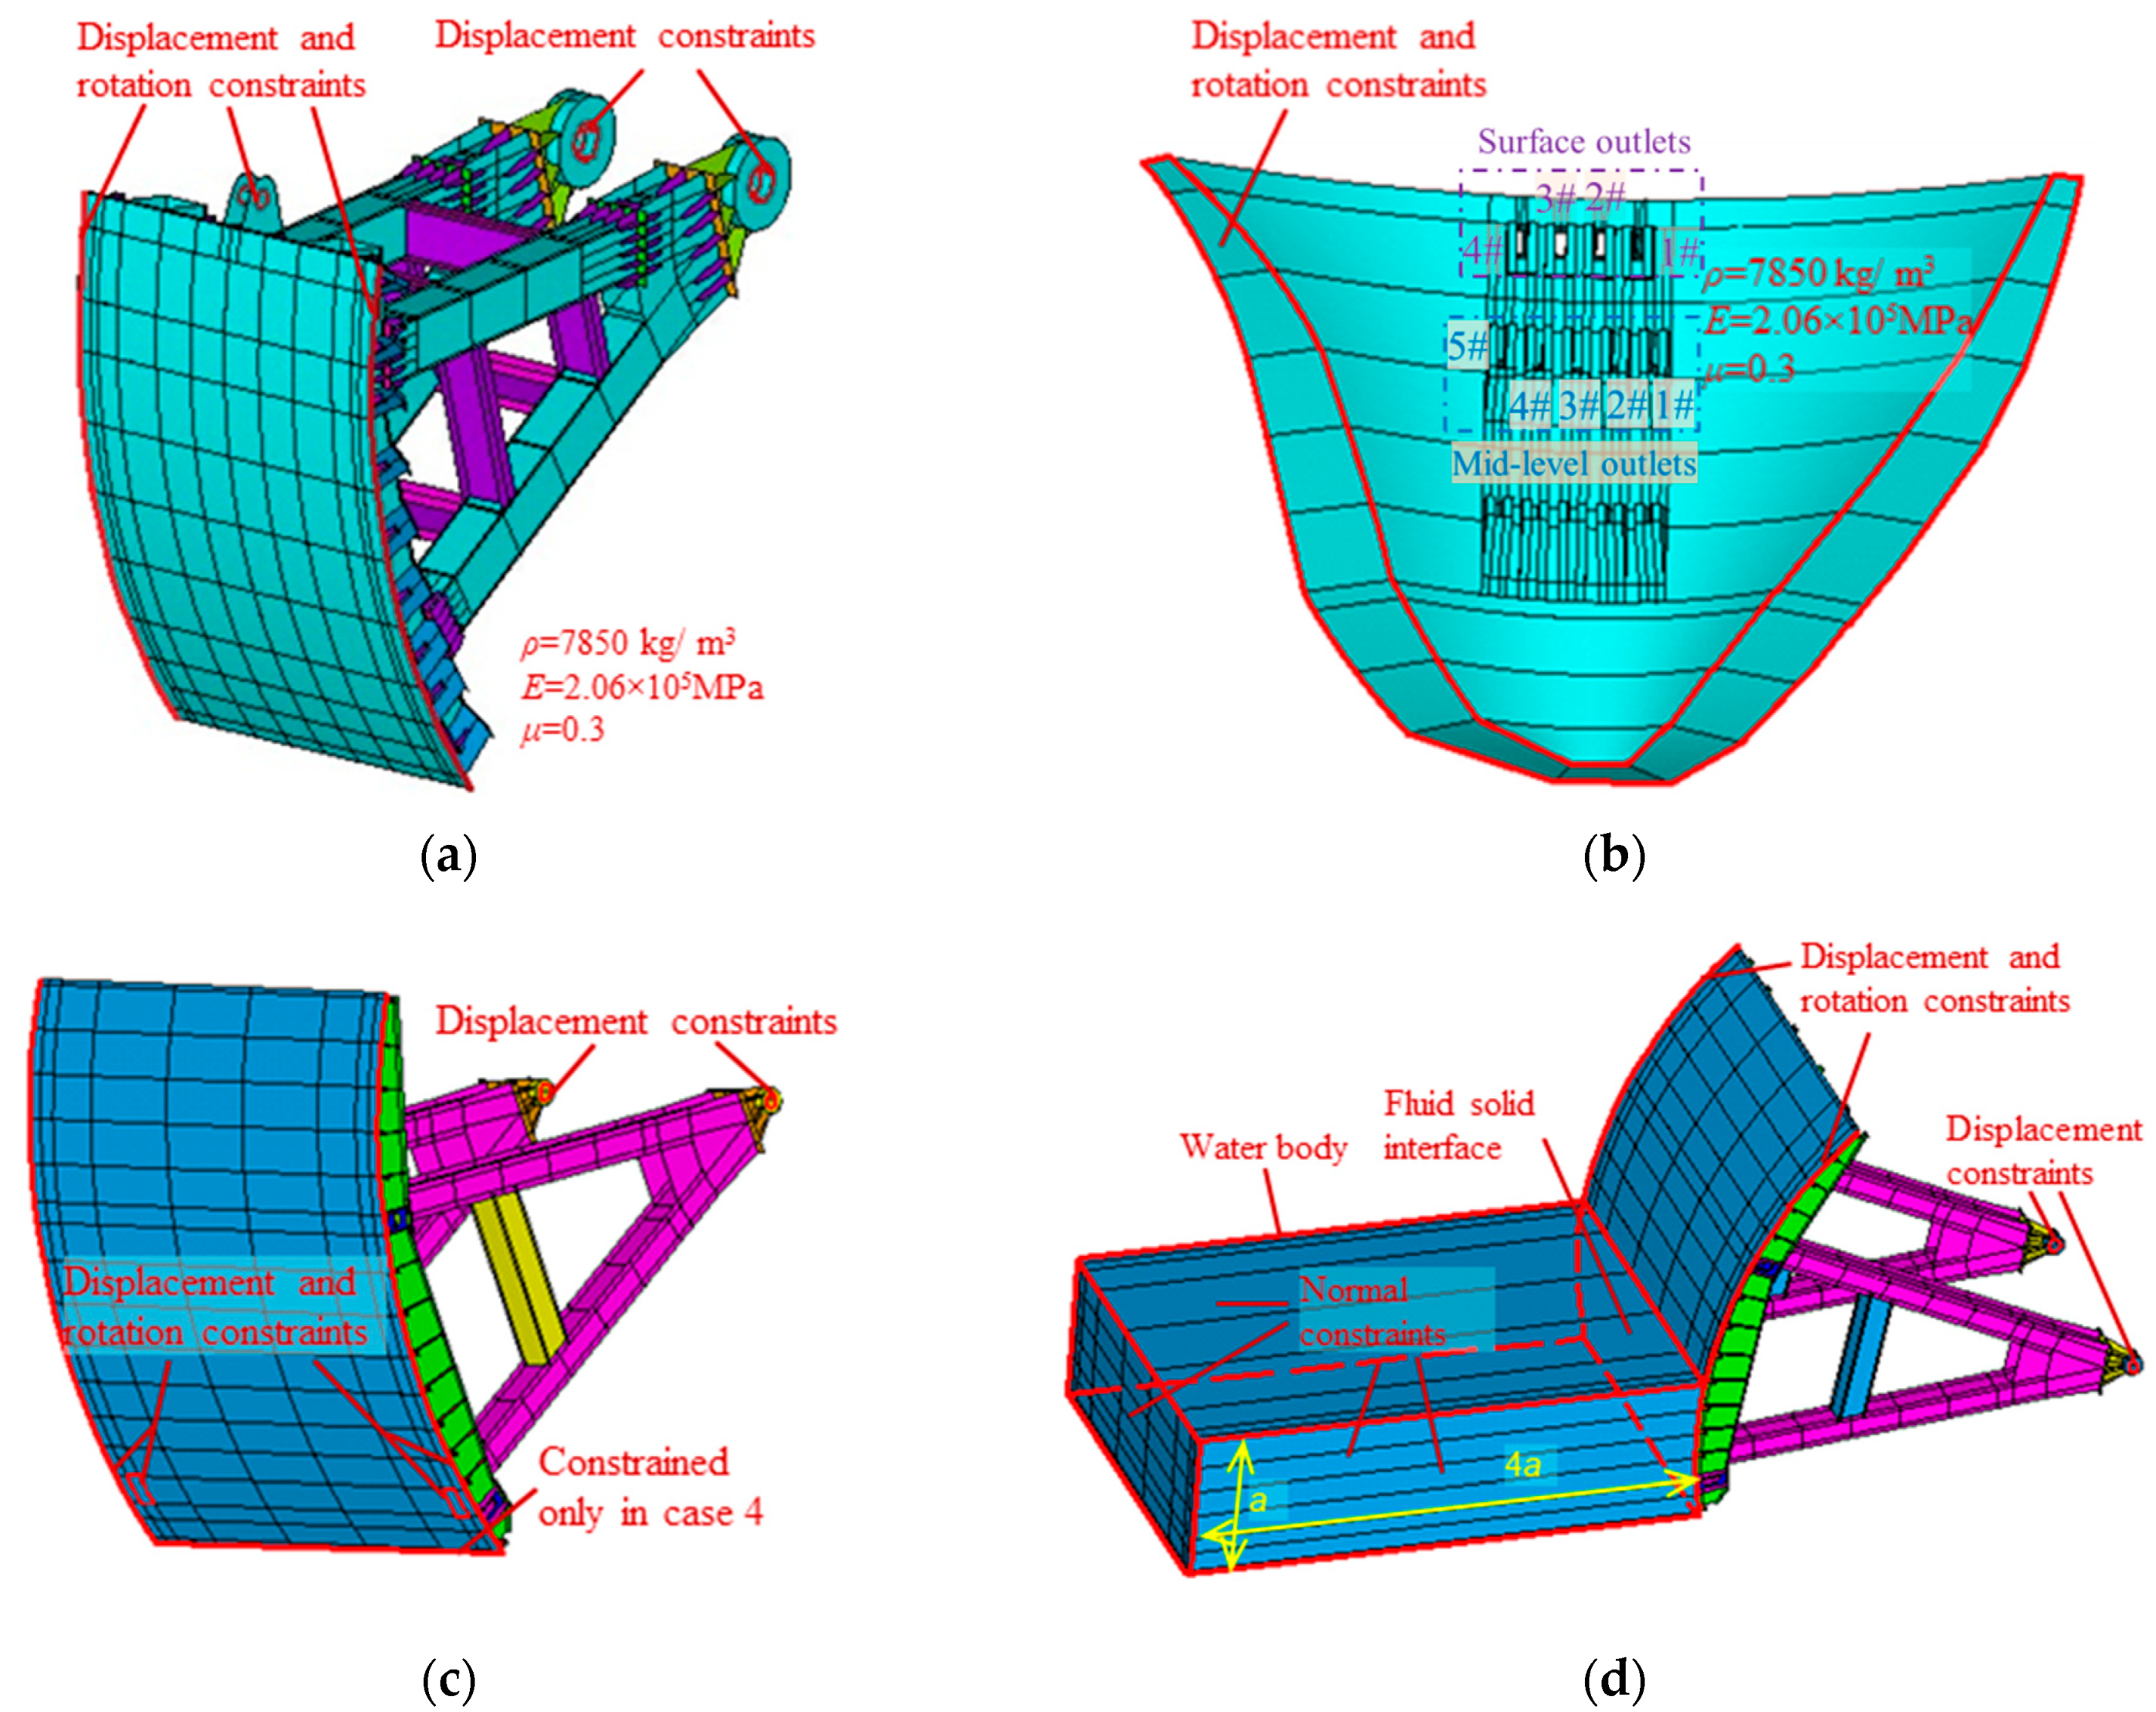
4.1. Modal Analysis Based on Numerical Simulation

According to the theoretical analysis in Section 3, the parameters ξ 1 , ξ 2 , m 12 , F 12 and ω 12 significantly affect the dynamic response of the accessory structure. Generally, the damping of the arch dam and the surface orifice gate (i.e., parameters ξ 1 and ξ 2 ) and the mass ratio m 12 remain unchanged after the dam–gate system has been built. The parameter F 12 is dependent on the dynamic interaction between the elastic gate and the unstable shear layer underneath the gate, and certainly varies within a limited range as the opening ratio of the surface outlet gate increases from 0% to 100%. Moreover, the frequency ratio ω 12 also has great influence on the dynamic response of the surface outlet gate, and the values of parameter ω 12 in different working conditions can be obtained by calculating the natural frequencies for both dry and wet modes of the mid-level outlet gate, surface outlet gate and arch dam through numerical simulation. It is necessary to point out that the numerical modal analysis was carried out on the basis of the ANSYS finite element software, and the model analysis according to prototype test data was conducted using MATLAB programming software.
It is noted that the 2# and 4# mid-level outlet gates are both completely opened when the intense vibration of surface orifice gate occurs. In this case, the breast wall separates most of the area of the hydraulic gate (except for the bottom of the gate) from the discharge flow and thus only the dry mode is involved in the numerical analysis. Moreover, the hanger rod shrinks to the greatest extension and its restraint effect on the gate reaches its maximum when the mid-level orifice gate is fully opened. Therefore, a zero-displacement constraint is applied to the joints between the gate leaf and hanger rod in the numerical analysis, as shown in Figure 16a. Meanwhile, zero displacement and rotation constraints are applied to the right and left edges of the surface orifice gate and zero displacement constraints are applied to the supporting articulations at the rotation centers of the supporting arms. The frequently used Rayleigh damping [37,38] is applied in the numerical calculation to simulate the dynamic system damping. Moreover, the structural fundamental frequency and vibration dominant frequency calculated the by prototype test data are used to obtain the mass and stiffness coefficients in the calculating process of Rayleigh damping. The density ρ, elastic modulus E and Poisson ratio μ for the mid-level outlet gate are given in Figure 16a, and the corresponding parameters as well as damping simulation method of the surface orifice gate are the same as those of the mid-level outlet gate. According to the modal analysis, the fundamental frequency of the mid-level orifice gate is approximately 37 Hz, which indicates that the 26.2 Hz component of the vibration is generated by the dynamic interaction between the elastic gate and the unstable shear layer underneath the gate, and the mid-level outlet gate is subjected to forced vibration.
As shown in Figure 16b, the zero displacement and rotation constraints are applied to the contact areas between the bedrock and arch dam. The density ρ, elastic modulus E and Poisson ratio μ for concrete arch dam are given in Figure 16b. Table 2 gives several natural frequencies of the arch dam and it is noted that the arch dam has closely spaced natural frequencies. In this case, as long as the frequency of the external force is higher than the fundamental frequency of the arch dam, there are always several vibration modes with frequencies that are quite close to the excitation frequency. Considering the fluid–solid interaction, the natural frequencies for the wet mode of the arch dam are slightly lower than those for the dry mode of the arch dam, which is consistent with existing research. It should be pointed out that the frequently used Block Lanczos method is applied to the modal analysis of the structures without considering the fluid element. The asymmetric mass and stiffness matrices will be generated when the fluid elements are involved in the numerical modal analysis, which makes the Block Lanczos method no longer applicable. In this case, the asymmetric method proposed by ANSYS software is used to perform the modal analysis.
As shown in Figure 17, the contact area between the 3# surface orifice gate and discharge flow decreases with the increase of its opening from 0% to 50% and the jet velocity also changes during the opening process, which will affect the dynamic characteristic of the hydraulic gate. In the modal analysis considering the interaction between fluid and solid (i.e., cases 4, 5 and 6), the ratio between the length of the water body and the submergence depth of the surface outlet gate equals 4, which is proved to be appropriate according to the related research on both similar flap gates [39] and steel radial gates [40]. As shown in Figure 16d, the contact area between the water body and the gate leaf is considered as the fluid–solid interface [38] and the upper surface of the water body is constraint-free. Meanwhile, the zero normal displacement constraints are applied on the remaining four areas of the water body and zero displacement and rotation constraints are applied to the right and left edges of the surface orifice gate. Moreover, the zero displacement constraints are applied to the supporting articulations at the rotation centers of the supporting arms and, in case 4, the displacement and rotation of the bottom of the gate is also constrained. When the opening is equal to or greater than 75%, only the dry modes are considered in the numerical simulation and the geometrical constraint condition of the hydraulic gate is the same as the aforementioned constraint conditions in cases 5 and 6.
Table 3 gives the natural frequency distribution of the 3# surface orifice gate, and there are always several vibration modes with frequencies which are quite close to the actual vibration frequency in different cases. Two features of the vibration of the 3# surface outlet gate are found according to the analysis results of the prototype test data. Firstly, the vibration of measuring points T7, T20 and T17 is more intense than the vibration of other measuring points on the gate leaf, and the z-directional vibration of the gate leaf is significantly larger than the vibration in the other two directions. Secondly, the x- and z-directional vibrations of the supporting arms are larger than the y-directional vibration. Based on the numerical analysis, the aforementioned features are consistent with the vibration mode of which the frequency ranges from 25 to 28 Hz. Figure 18 gives the vibration patterns of the 3# surface orifice gate under specific working conditions and the sequence number of the working case in Table 1 (denoted by m), the opening (denoted by γ), the order of vibration mode (denoted by n) and the modal frequency (denoted by f) are illustrated in Figure 18. It is noted that the regions of intense vibration on the gate leaf are in accordance with the actual conditions. The modal vibration of the supporting arms is mainly contributed to by torsional vibration, so the x- and z- directional vibrations are obviously larger than the y-directional vibration. Therefore, it is considered that the actual vibration basically reflects the characteristics of the vibration modes with the frequencies that are quite close to the actual vibration frequency and the corresponding vibration modes significantly participate in the actual vibration.

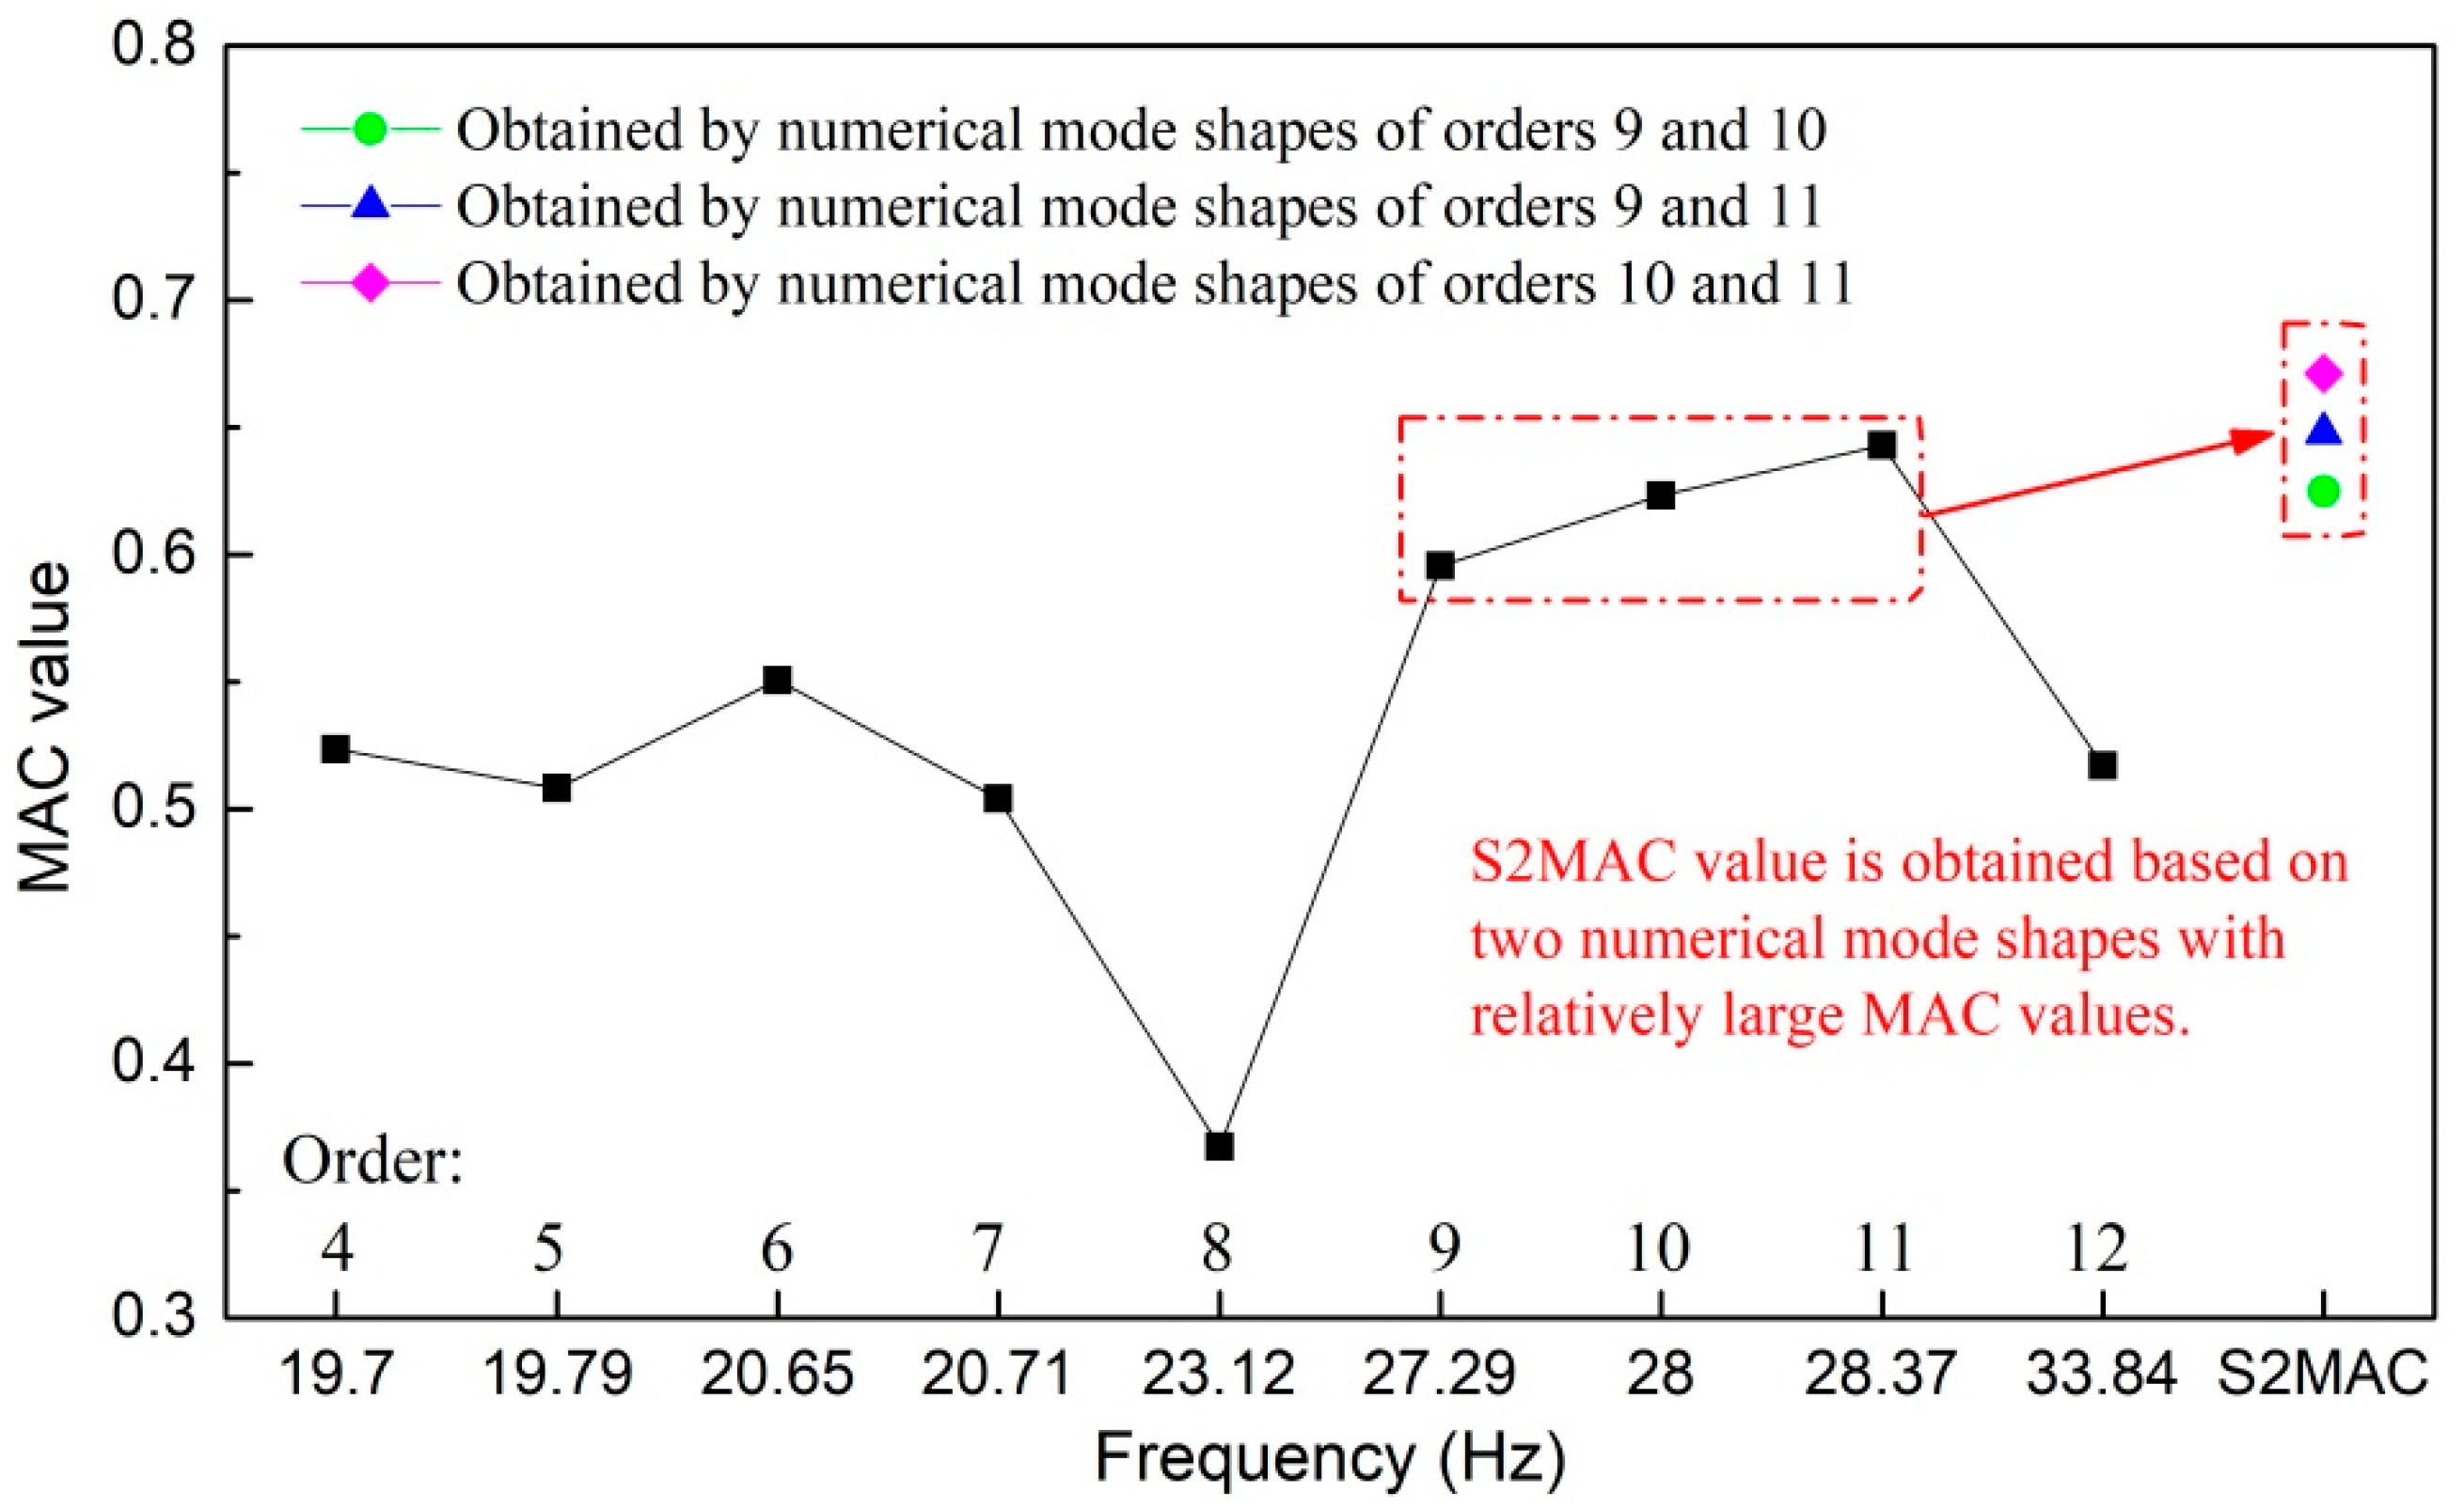
4.2. Correlation Analysis of the Prototype and Numerical Vibration Modes

The combinational analysis method of using the random decrement technique (RDT) and eigensystem realization algorithm (ERA) is a frequently used method for estimating the modal parameters of structures subjected to environmental vibration excitation. This algorithm has the advantages that the analysis is efficient, accurate results can be obtained and little data on the structural free vibration (or impulse response) in a short time are required for the calculation [41]. Therefore, structural modal identification is performed using ERA in the present paper. Before the application of ERA, the structural free vibration data is obtained by RDT based on the testing data of the actual structural dynamic responses. The detailed theoretical deduction process of RDT and ERA methods is described in references [41,42,43].
In the following analysis, the vibration mode of the 3# surface orifice gate under working condition 4 is calculated by both the theoretical and numerical methods. In order to calculate the gate modal parameters based on the prototype dynamic response data under unknown environmental excitations, the RDT is first employed to obtain the structural free vibration responses, then the free-decay vibration histories are used as input for the ERA to calculate the minimal realization and the vibration mode of the hydraulic gate system. The first seven modal frequencies calculated by the RDT and ERA joint method in different cases are listed in Table 4. Due to the reduction in the degrees of freedom, it is easy to understand that a large number of vibration modes cannot be identified and the intervals between adjacent modal frequencies are significantly increased. However, there always exists a vibration mode of which the frequency is very close to the dominant frequency of actual structure’s dynamic response in every operating condition. Thus, the resonances of these specific vibration modes are naturally considered to have made a major contribution to the actual vibration.
In order to further investigate the contributions of specific natural vibration modes to actual structural dynamic responses, the correlation analysis between the mode shapes obtained by the prototype data and numerical simulation is carried out. It is noted that the dominant frequency obtained by the prototype vibration data distributed in a narrow range from 27.5 to 28.5 Hz and the power spectral density of the dominant frequency is much larger than that of other frequency components. Thus, only the vibration modes with similar frequencies to the dominant frequency may significantly contribute to the actual vibration, and the frequencies and shapes for only one vibration mode in the prototype (order 2) and eight vibration modes in the numerical simulation (orders 4 to 12) are included in Table 5.
According to the mode shapes listed in Table 5, the values of modal assurance criterion (MAC) [44] and subspace of order 2 modal assurance criterion (S2MAC) [45] are calculated and illustrated in Figure 19 to describe the correlation between the prototype and numerical vibration modes. As shown in Figure 19, the MAC values corresponding to the numerical vibration modes of orders 9 to 11 are higher than those corresponding to other numerical vibration modes, which demonstrates the fact that only the vibration modes with frequencies quite close to the actual dominant frequency can significantly contribute to the prototype vibration.
According to recent research [46,47], if a set of closely spaced natural vibration modes is obtained from the numerical simulation, it is more reasonable to estimate the correlation between the prototype and numerical vibration modes by calculating the MAC value between the prototype mode shape and the linear combination of the numerical mode shapes corresponding to closely spaced frequencies. This indicates that the closely spaced natural vibration modes have significant influence on the actual vibration in the form of linear combination. Therefore, the S2MAC values are calculated based on the prototype mode shape and two numerical mode shapes that correspond to relatively high MAC values, and the maximum S2MAC value [45] is 0.6713. Due to the various error sources in the analysis (such as the mode mixing generated by the very high- and low-frequency vibrations, the signal interferences that frequently occur in complex environments and the calculation errors in the theoretical and numerical analysis), the maximum S2MAC is considered to be able to reflect the relatively good correlation between the prototype and numerical vibration modes. Therefore, the conclusion can be drawn that the resonances of specific natural vibration modes with frequencies close to the prototype dominant frequency have made a major contribution to the actual vibration of the 3# surface orifice gate.
A better simulation can be achieved if more than two numerical vibration modes are used in the calculation of high order MAC. However, the calculation of the coefficients of different numerical modes in the linear combination is complex and attention should be paid to avoid over-fitting the results [47]. As this is not the focus of this paper, the correlation between the prototype and numerical modes is not further analyzed and discussed.
In order to save space, the analysis results of the vibration mode correlation under cases 5 to 8 are obtained but not included in the present paper, and the calculated results of the other working conditions are similar to those of working condition 4. Therefore, it is reasonable to consider that the intense vibrations of the 3# surface orifice gate are mainly induced by the resonances of specific natural vibration modes with frequencies close to the actual dominant frequency.

5. Cause and Mechanism of the Intense Vibration of the 3# Surface Outlet Gate

Based on the comprehensive analysis of the prototype test data, theoretical derivation and numerical simulation, the cause and mechanism of the intense vibration of the 3# surface outlet gate can be clarified in detail. When the gate is closed, the arch dam is excited by the impact force generated by the flow-induced vibration of the 2# and 4# mid-level outlet gates. Then, the vibration of the arch dam is transmitted to the 3# surface outlet gate, by which the vibration is significantly amplified. As the natural frequencies of the arch dam are closely spaced, there are always several vibration modes with frequencies which are quite close to the excitation frequency, as long as the frequency of the external force is higher than the fundamental frequency of the arch dam. Moreover, according to the numerical simulation, the vibration modes of the 3# surface outlet gate with frequencies similar to the external excitation dominant frequency also exist. Based on the correlation analysis between the prototype and numerical vibration modes in Section 4, it is concluded that the vibration modes with frequencies close to the external excitation frequency significantly participate in the actual vibration. Therefore, the parameter ω 12 in the theoretical model is approximately equal to 1 and the mass ratio m 12 is approximately calculated to be 50,000. According to the design code [48] and numerical simulation, the damping ratios for the arch dam and the 3# surface outlet gate are 0.03 and 0.06 (i.e., ξ 1 = 0.03 and ξ 2 = 0.06   ), respectively. Consequently, the amplitude coefficient curve for the 3# surface outlet gate in case 4 is illustrated in Figure 20, and the red vertical line in Figure 20b represents the actual frequency of the external excitation.
When the opening of the surface orifice gate is 25%, the vibration is decreased because the partial vibration propagation path from the dam body to the hydraulic gate is cut off when the bottom of gate is separated from the weir crest of the surface orifice. It is calculated that the ratio between the length of the decreased propagation path and that of all the possible propagation paths is approximately 0.22, and it is assigned to a reduction coefficient in the calculation of the frequency response curve. Meanwhile, the fluctuating pressure generated by the discharge flow directly impacts the hydraulic gate, which will increase the gate vibration. However, the variation law of this excitation is related to the flow cross section and the dynamic interaction between the hydraulic gate and the unstable shear layer underneath the gate, of which the detailed mechanism is still equivocal. In order to ensure the reasonableness of the analysis, the parameter F 21 in the theoretical model is considered to be 0.0006. The frequency response curve for 3# surface outlet gate in case 5 is illustrated in Figure 20. As a result, the gate vibration is reduced under the combined effect of the decreased propagation path and the additional fluctuating pressure.
When the opening of the 3# surface orifice gate is at 50%, the fluctuating pressure on the bottom of the gate is considered to be decreased, due to the same upstream level and a larger flow cross section. Thus, the parameter F 21 in the theoretical model is reduced to 0.0005. The values for the other parameters in case 6 remain consistent with those in case 5. Furthermore, when the hydraulic gate is 75% or 100% opened, the values of parameters in cases 7 and 8 are the same as those in case 6, except that the parameter F 21 is considered to be 0 in the frequency response formula. The amplitude coefficient curves in cases 6, 7 and 8 are also shown in Figure 20.
It is noted that the red vertical line in Figure 20b represents the ratio between the actual external excitation frequency and primary structure frequency, and thus the longitudinal coordinates of the interaction points between the red vertical line and the other four frequency response curves denote the amplification factors of the dynamic response of the 3# surface outlet gate in the actual vibration. The variation law for the vibration amplification factors calculated from the proposed theoretical model in different cases is in accordance with the results of the prototype test results, which indicates that the proposed clarification and theoretical model is reasonable and accurate.
The intense vibration of the surface outlet gate has caused concerns about the operational safety of this hydraulic gate. According to the prototype test, the gate vibration far exceeds the safety threshold under adverse working conditions, which directly led to the change of the gate operation mode. In the discharge process of recent years, the surface outlet gates are always opened first and the gate opening gradually increases with increasing discharge until the gate bottom is separated from the water surface. Then, the mid-level orifices begin to be put into operation. Based on the current gate opening mode, the vibration problem is not completely solved because a relatively large vibration of the surface outlet gate will still be generated when the surface outlet gate and the mid-level outlet gate are opened simultaneously. Due to the limited inflow volume of the reservoir and the flow volume used to generate electricity, the surface and mid-level orifices will be simultaneously operated only when the discharge volume is very large, and the operation time of this adverse working condition is significantly reduced. After several years of operation, the surface outlet gate has not yet been damaged, but the vibration problem is a threat to the hydraulic gate safety in the case of long-term operation under the general working conditions and short-term operation under working conditions with a large discharge. Based on the research presented in this article, it is a feasible to make the natural frequency of the surface outlet hydraulic gate very different from the dominant frequency of the actual vibration by applying the theory of structural modification. Alternatively, the discharge conditions of the mid-level outlet can be improved to significantly reduce the flow-induced vibration of the mid-level outlet gate so that the external excitation acting on the surface outlet gate will be attenuated. The detailed and complete approach for vibration reduction will be further studied in the subsequent research. It is necessary to point out that due to the complexity of the practical problem, the theoretical model proposed in this paper is significantly simplified, which is acceptable for the qualitative clarification of the cause and mechanism of the hydraulic gate vibration amplification. In order to calculate the structural dynamic response more accurately and in greater detail, the influence of fluid–solid coupling parameters on the gate vibration amplification effect, the mutual influence among accessory structures and the cross correlation between different vibration modes also need to be further investigated.

6. Concluding Remarks

According to the prototype’s dynamic test results, a counterintuitive vibration of the Jinping I surface outlet gate is observed, such that the most intense vibration occurs when the surface gate is closed and, on the contrary, the vibration is reduced when the gate is opened and subjected to flow excitation. A simplified theoretical model to analyze the dynamic response of a hydraulic gate installed on a high arch dam body is established, and the cause and mechanism for the intense vibration of the 3# surface outlet gate is clarified. When the gate is closed, the arch dam is excited by the impact force generated by the flow-induced vibration of the 2# and 4# mid-level outlet gates. Then, the vibration of the arch dam is transmitted to the 3# surface outlet gate, by which the vibration is significantly amplified. Based on the vibration mode correlation analysis, it is concluded that the vibration modes with frequencies close to the external excitation frequency significantly participate in the actual vibration. Moreover, the dynamic characteristic parameters were first estimated based on the design code and numerical calculation, and then the vibration amplification effect was approximately obtained by substituting the dynamic characteristic parameters into the proposed theoretical model. The variation law for the obtained vibration amplification effect in different cases is in accordance with the results of the prototype test, which proved that the proposed clarification and theoretical model is reasonable and accurate.

Author Contributions

Conceptualization, J.L.; Data curation, L.C.; Formal analysis, C.L.; Funding acquisition, J.L. and B.M.; Investigation, C.L. and L.C.; Methodology, J.L. and C.L.; Project administration, J.L. and B.M.; Resources, J.L. and L.C.; Software, B.M. and L.C.; Supervision, B.M.; Visualization, C.L. and L.C.; Writing—original draft, C.L. and L.C. All authors have read and agreed to the published version of the manuscript.

Funding

This research was funded by the National Key R&D Program of China (No. 2016YFC0401705), Science Fund for Creative Research Groups of the National Natural Science Foundation of China (No. 51621092), the National Natural Science Foundation of China (No. 51579173, No. 51779167, No. 51909185, No. 51809194), China Postdoctoral Science Foundation (No. 2019M652550), and the Science and Technology Project of China Huaneng Group (HNKJ15-H12).

Conflicts of Interest

The authors declare no conflict of interest.

References

  1. Lian, J.; Zhang, J.; Wang, H. Study on damage diagnosis of guide wall based on flood discharge response. J. Hydroelectr. Eng. 2008, 27, 96–101. [Google Scholar]
  2. He, L.; Lian, J.; Ma, B. Intelligent damage identification method for large structures based on strain modal parameters. J. Vib. Control 2014, 20, 1783–1795. [Google Scholar] [CrossRef]
  3. Lian, J.J.; Peng, M.X.; Cui, G.T.; Lin, J.Y. On the stability of gate vibrations. J. Tianjin Univ. (Sci. Technol.) 1999, 32, 171–176. [Google Scholar]
  4. Yin, J.B.; Liang, Z.X.; Gong, H.L. Experimental study on application & development of X type flaring gate piers. J. Hydroelectr. Eng. 2007, 26, 36–39. [Google Scholar]
  5. Darbre, G.R.; Smet, C.A.M.D.; Kraemer, C. Natural frequencies measured from ambient vibration response of the arch dam of Mauvoisin. Earthq. Eng. Struct. Dyn. 2015, 29, 577–586. [Google Scholar] [CrossRef]
  6. Proulx, J.; Paultre, P.; Rheault, J.; Robert, Y. An experimental investigation of water level effects on the dynamic behaviour of a large arch dam. Earthq. Eng. Struct. Dyn. 2001, 30, 1147–1166. [Google Scholar] [CrossRef]
  7. Lian, J.J.; Liu, X.Z.; Ma, B. Safety evaluation and the static-dynamic coupling analysis of counter-arched slab in plunge pool. Sci. China Ser. E-Technol. Sci. 2009, 52, 1397–1412. [Google Scholar] [CrossRef]
  8. He, L.; Lian, J.; Ma, B.; Wang, H. Optimal multiaxial sensor placement for modal identification of large structures. Struct. Control Health Monit. 2013, 21, 61–79. [Google Scholar] [CrossRef]
  9. Zhang, Y.; Lian, J.; Liu, F. An improved filtering method based on EEMD and wavelet-threshold for modal parameter identification of hydraulic structure. Mech. Syst. Signal Process. 2016, 68–69, 316–329. [Google Scholar] [CrossRef]
  10. Lian, J.J.; Zhang, Y.; Liu, F.; Zhao, Q.H. Analysis of the ground vibration induced by high dam flood discharge using the cross wavelet transform method. J. Renew. Sustain. Energy 2015, 7, 043146. [Google Scholar] [CrossRef]
  11. Liang, C.; Zhang, J.L.; Lian, J.J.; Liu, F.; Li, X.Y. Probabilistic analysis for the response of nonlinear base isolation system under the ground excitation induced by high dam flood discharge. Earthq. Eng. Eng. Vib. 2017, 16, 841–857. [Google Scholar] [CrossRef]
  12. Hardwick, J.D. Flow-induced vibration of vertical-lift gate. J. Hydraul. Div. 1974, 100, 631–644. [Google Scholar]
  13. Kolkman, P.A.; Vrijer, A. Gate edge suction as a cause of self-exciting vertical vibrations. In Proceedings of the 17th Congress of the International Association for Hydraulic Resources, Baden-Baden, Germany, 14–19 August 1977. [Google Scholar]
  14. Thang, N.D.; Naudascher, E. Vortex-excited vibrations of underflow gates. J. Hydraul. Res. 1986, 24, 133–151. [Google Scholar] [CrossRef]
  15. Thang, N.D.; Naudascher, E. Self-excited vibrations of vertical-lift gates. J. Hydraul. Res. 1986, 24, 391–404. [Google Scholar] [CrossRef]
  16. Ishii, N.; Naudascher, E. A design criterion for dynamic stability of Tainter gates. J. Fluid Struct. 1992, 6, 67–84. [Google Scholar] [CrossRef]
  17. Yan, G.H.; Chen, F.Z.; Zhao, J.P. Prototype observation study on the flow-induced vibration of surface radial gate. J. Hydroelectr. Eng. 2006, 25, 45–50. [Google Scholar]
  18. Ormondroyd, J.; Den, H.J.P. The theory of the dynamic vibration absorber. ASME J. Appl. Mech. 1928, 50, 9–22. [Google Scholar]
  19. Warburton, G.B. Optimum absorber parameters for minimizing vibration response. Earthq. Eng. Struct. Dyn. 1981, 9, 251–262. [Google Scholar] [CrossRef]
  20. Zuo, L.; Nayfeh, S.A. Optimization of the individual stiffness and damping parameters in multiple-tuned-mass damper systems. J. Vib. Acoust. Trans. ASME 2003, 127, 77–83. [Google Scholar] [CrossRef]
  21. Zuo, L.; Nayfeh, S.A. Minimax optimization of multi-degree-of-freedom tuned-mass dampers. J. Sound Vib. 2004, 272, 893–908. [Google Scholar] [CrossRef]
  22. Dinh, V.N.; Basu, B. Passive control of floating offshore wind turbine nacelle and spar vibrations by multiple tuned mass dampers. Struct. Control Health Monit. 2015, 22, 152–176. [Google Scholar] [CrossRef]
  23. Zhu, J.T.; Xu, Z.-D.; Guo, Y.-Q. Magnetoviscoelasticity parametric model of an MR elastomer vibration mitigation device. Smart Mater. Struct. 2012, 21, 075034. [Google Scholar] [CrossRef]
  24. Weber, F.; Distl, H. Amplitude and frequency independent cable damping of Sutong Bridge and Russky Bridge by magnetorheological dampers. Struct. Control Health Monit. 2015, 22, 237–254. [Google Scholar] [CrossRef]
  25. Lee, H.P. Dynamic response of girder bridge with a moving mass. J. Sound Vib. 1996, 191, 289–294. [Google Scholar] [CrossRef]
  26. Peng, X.; Yin, X.F.; Fang, Z. Vibration and TMD control of coupled system of girder bridge and vehicle with variable speeds. J. Hunan Univ. (Nat. Sci.) 2006, 33, 61–66. [Google Scholar]
  27. Miguel, L.F.F.; Lopez, R.H.; Torii, A.J.; Miguel, L.F.F.; Beck, A.T. Robust design optimization of TMDs in vehicle–bridge coupled vibration problems. Eng. Struct. 2016, 126, 703–711. [Google Scholar] [CrossRef]
  28. Lackner, M.A.; Rotea, M.A. Structural control of floating wind turbines. Mechatronics 2011, 21, 704–719. [Google Scholar] [CrossRef]
  29. Stewart, G.; Lackner, M. Offshore Wind Turbine Load Reduction Employing Optimal Passive Tuned Mass Damping Systems. IEEE Trans. Control Syst. Technol. 2013, 21, 1090–1104. [Google Scholar] [CrossRef]
  30. Si, Y.; Karimi, H.R.; Gao, H. Modelling and optimization of a passive structural control design for a spar-type floating wind turbine. Eng. Struct. 2014, 69, 168–182. [Google Scholar] [CrossRef]
  31. Mackriell, L.E.; Kwok, K.C.S.; Samali, B. Critical mode control of a wind-loaded tall building using an active tuned mass damper. Eng. Struct. 1997, 19, 834–842. [Google Scholar] [CrossRef]
  32. Pinkaew, T.; Lukkunaprasit, P.; Chatupote, P. Seismic effectiveness of tuned mass dampers for damage reduction of structures. Eng. Struct. 2003, 25, 39–46. [Google Scholar] [CrossRef]
  33. Anh, N.D.; Nguyen, N.X. Extension of equivalent linearization method to design of TMD for linear damped systems. Struct. Control Health Monit. 2012, 19, 565–573. [Google Scholar] [CrossRef]
  34. Wang, Z.; Chen, G. Analytical mode decomposition with Hilbert transform for modal parameter identification of buildings under ambient vibration. Eng. Struct. 2014, 59, 173–184. [Google Scholar] [CrossRef]
  35. Liu, B.J. Study on the Similarity Law and Characteristics of Fluctuating Pressures in Supercritical Flow; Tianjin University: Tianjin, China, 2013. [Google Scholar]
  36. Ishii, N.; Knisely, C.W.; Nakata, A. Coupled-Mode Vibration of Gates with Simultaneous Over- and Underflow. J. Fluid Struct. 1994, 8, 455–469. [Google Scholar] [CrossRef]
  37. Clough, R.W.; Penzien, J.; Griffin, D.S. Dynamics of Structures, 2nd ed.; McGraw-Hill, Inc.: New York, NY, USA, 1993. [Google Scholar]
  38. Group, A.C. ANSYS15.0 User’s Manual; ANSYS, Inc.: Pittsburgh, PA, USA, 2013. [Google Scholar]
  39. Kolkman, P.A. A simple scheme for calculating the added mass of hydraulic gates. J. Fluids Struct. 1988, 2, 339–353. [Google Scholar] [CrossRef]
  40. Lian, J.J.; Yang, M. Hydrodynamics for High Dam; China Water & Power Press: Beijing, China, 2008. [Google Scholar]
  41. Feng, Z.; Shen, W.; Chen, Z. Consistent Multilevel RDT-ERA for Output-Only Ambient Modal Identification of Structures. Int. J. Struct. Stab. Dyn. 2017, 17, 1750106. [Google Scholar] [CrossRef]
  42. Cole, H., Jr. On-the-line analysis of random vibrations. In 9th Structural Dynamics and Materials Conference; American Institute of Aeronautics and Astronautics: Reston, VA, USA, 1968. [Google Scholar] [CrossRef]
  43. Bedewi, N.E. The Mathematical Foundation of the Auto and Cross-Random Decrement Techniques and the Development of a System Identification Technique for the Detection Structural Deterioration; University of Maryland: College Park, MD, USA, 1986. [Google Scholar]
  44. Allemang, R.J.; Brown, D.L. A correlation coefficient for modal vector analysis. In Proceedings of the 1st International Modal Analysis Conference, Orlando, FL, USA, 8–10 November 1982; pp. 110–116. [Google Scholar]
  45. D’Ambrogio, W.; Fregolent, A. Higher-Order Mac for the Correlation of Close and Multiple Modes. Mech. Syst. Signal Process. 2003, 17, 599–610. [Google Scholar] [CrossRef]
  46. López-Aenlle, M.; Brincker, R.; Pelayo, F.; Canteli, A.F. On exact and approximated formulations for scaling-mode shapes in operational modal analysis by mass and stiffness change. J. Sound Vib. 2012, 331, 622–637. [Google Scholar] [CrossRef]
  47. Brincker, R.; Skafte, A.; López-Aenlle, M.; Sestieri, A.; D’Ambrogio, W.; Canteli, A. A local correspondence principle for mode shapes in structural dynamics. Mech. Syst. Signal Process. 2014, 45, 91–104. [Google Scholar] [CrossRef]
  48. Ministry of Housing and Urban-Rural Development of the People’s Republic of China; Inspection and Quarantine of the People’s Republic of China General Administration of Quality Supervision. Code for Seismic Design of Buildings; China Architecture & Building Press: Beijing, China, 2010.
Figure 1. The dynamic testing system applied during prototype dynamic testing.
Applsci 10 00629 g001
Figure 2. Photos of prototype testing. (a) Sensor installation; (b) cable traction; (c) data acquisition.
Applsci 10 00629 g002
Figure 3. Arrangement of the surface and mid-level outlets on the arch dam body.
Applsci 10 00629 g003
Figure 4. Test point placement on 3# mid-level orifice gate.
Applsci 10 00629 g004
Figure 5. RMSs and dominant frequencies of the acceleration histories measured on 3# mid-level orifice gate in case 1 (3# mid-level outlet gate is 100% opened and the corresponding discharge is approximately 1090 m3/s).
Applsci 10 00629 g005
Figure 6. Test point placement on 3# surface orifice gate.
Applsci 10 00629 g006
Figure 7. RMSs of the acceleration histories measured on the 3# surface orifice gate under the working cases 3 to 8 in Table 1: (a) x-direction; (b) y-direction; (c) z-direction; (d) moduli of acceleration vectors.
Applsci 10 00629 g007
Figure 8. Dominant frequencies of the acceleration histories measured on 3# surface orifice gate: (a) x-direction; (b) y-direction; (c) z-direction.
Applsci 10 00629 g008
Figure 9. A two-degrees-of-freedom system consists of primary and subsidiary structures.
Applsci 10 00629 g009
Figure 10. Frequency response of the subsidiary structure with varying parameter ω 12   .
Applsci 10 00629 g010
Figure 11. Frequency response for the subsidiary structure with varying parameter ξ2. (a) the entire graph; (b) partial enlarged graph.
Applsci 10 00629 g011
Figure 12. Frequency response for the subsidiary structure with varying parameter ξ1: (a) the entire graph; (b) partial enlarged graph.
Applsci 10 00629 g012
Figure 13. Frequency response for the subsidiary structure with varying parameter F 21   .
Applsci 10 00629 g013
Figure 14. Frequency response for the subsidiary structure with varying parameter ω12.
Applsci 10 00629 g014
Figure 15. Frequency response for the subsidiary structure with varying parameter m12.
Applsci 10 00629 g015
Figure 16. Numerical models for the concerned structures. (a) Mid-level orifice gate; (b) arch dam; (c) surface orifice gate; (d) surface orifice gate considering fluid–structure coupling.
Applsci 10 00629 g016
Figure 17. Opening process of the 3# surface orifice gate.
Applsci 10 00629 g017
Figure 18. Vibration pattern of the 3# surface outlet gate in certain cases.
Applsci 10 00629 g018
Figure 19. MAC and S2MAC values between the prototype and numerical mode shapes.
Applsci 10 00629 g019
Figure 20. Frequency response of 3# surface orifice gate in different cases: (a) the entire graph; (b) partial enlarged graph.
Applsci 10 00629 g020
Table 1. Working conditions of the Jinping arch dam.
CaseUpstream Water Level (m)Discharge from Dam Body (m3/s)Downstream Water Level (m)Opening Ratios of Different OutletsGate Installed with Sensors
Surface Outlet No.Mid-Level Outlet No.
1#2#3#4#2#3#4#
11879.73≈10901651.0200000100%03# mid-level outlet gate
2188020801647.530000100%0100%2# and 4# mid-level outlet gate
3188038401650.02100%100%100%100%0003# surface outlet gate
4≈1879.14≈2668≈1649.3730%0030%100%0100%3# surface outlet gate
5≈1879.14≈2913≈1649.3730%025%30%100%0100%3# surface outlet gate
6≈1879.14≈3158≈1649.3730%050%30%100%0100%3# surface outlet gate
7≈1879.14≈3403≈1649.3730%075%30%100%0100%3# surface outlet gate
8≈1879.14≈3648≈1649.3730%0100%30%100%0100%3# surface outlet gate
Table 2. Natural frequencies of the arch dam.
OrderNatural FrequencyOrderNatural Frequency
Dry ModeWet ModeDifferenceDry ModeWet ModeDifference
11.781.5512.98%20826.0825.611.80%
22.592.2712.54%22226.9326.282.41%
53.072.973.37%22327.0526.472.14%
63.393.127.89%23727.9427.322.22%
93.773.546.10%23828.0427.491.96%
103.83.702.60%25428.9928.641.21%
Table 3. Natural frequencies of the 3# surface outlet gate.
OrderNatural FrequencyOrderNatural Frequency
Case 4 (wet)Case 5 (wet)Case 6 (wet)Case 7/8 (dry)Case 4 (wet)Case 5 (wet)Case 6 (wet)Case 7/8 (dry)
419.7019.6920.3120.36927.2928.3928.8343.17
519.7920.6220.6925.771028.0030.1836.5345.17
620.6520.6725.1527.811128.3732.4245.3245.43
720.7126.1128.0827.921233.8435.0245.4056.04
823.1228.3028.3040.98
Table 4. Modal frequencies calculated by the random decrement technique (RDT) and eigensystem realization algorithm (ERA) joint method in different cases.
Mode No.Modal Frequencies in Different CasesMode No.Modal Frequencies in Different Cases
Case 4Case 5Case 6Case 7Case 8Case 4Case 5Case 6Case 7Case 8
10.650.670.860.590.605127.40119.73159.84157.90157.49
227.5127.5027.5328.1828.076128.74173.88170.40182.55180.19
344.2263.2152.4891.6192.867193.29201.29200.07200.03199.73
467.4995.06111.54110.09110.25
Table 5. Mode shapes of the 3# surface orifice gate obtained by prototype data and numerical simulation under working condition 4.
Measuring PointMode Shape Obtained by Prototype Data and Numerical Simulation
Prototype Frequency (Hz)/OrderNumerical Frequency (Hz)/Order
27.51/219.70/419.79/520.65/620.71/723.12/827.29/928.00/1028.37/1133.84/12
T10.13640.00010.00010.00010.00010.00010.00010.00010.00010.0001
T20.15510.32030.29870.36790.33150.25800.42990.46690.47730.4835
T30.92110.78560.74170.89530.80950.63840.85580.93700.96091.0000
T41.00000.87290.78810.74530.83930.50801.00001.00001.00000.3846
T50.03580.15000.11720.10470.08990.07860.44860.14170.12660.4103
T180.07580.09750.13050.08640.07980.05280.11590.09450.08280.1139
T190.09120.88981.00001.00000.92261.00000.90920.90550.89840.2275
T80.08750.00010.00010.00010.00010.00010.07020.00010.00550.0001
T90.07380.35250.25430.33870.36130.25980.42720.46690.47890.4799
T100.15110.83220.60990.79250.84520.62050.82240.67240.54140.9670
T110.40460.94920.66890.85570.91070.51070.99071.00001.00000.3773
T120.39830.16360.09800.09620.09760.07860.44590.37720.43830.4103
T140.03660.11190.11520.07820.08570.05210.11390.09370.08200.1136
T150.12491.00000.87420.91791.00001.00000.90120.90550.90630.2315
T60.07210.08110.00070.00060.01130.00850.12580.00070.01060.3410
T70.03280.05060.00260.00020.00340.00000.08610.00000.00170.0228
T130.06460.00150.00720.00050.00000.01300.02280.00120.00090.2366
T160.00460.01060.00770.00120.00460.00270.02260.00020.00540.0447
T170.05740.00610.00150.00030.00220.00360.03230.00150.00190.0324
T200.11350.00490.00120.00010.00110.00490.03110.00050.00130.0319
T210.06940.00200.00570.00060.00000.01630.02600.00100.00100.2872

