1. Introduction
With the development of public transportation systems in mega cities, public transportation has become the first choice for people to travel. According to statistics, about 6.1 million people travel in Beijing every day through the public transportation system. Analysis of passenger travel plays a very important role in public transportation scheduling, maintaining public safety and ensuring the operation of the public transportation system. This can improve the efficiency of the public transport system and provide better services to passengers.
There are some potential associations among passengers in public transportation, which is very important for analyzing passenger behavior. Because of the advanced automatic ticket checking system, a large amount of travel data can be collected to analyze the association between passengers, and the analysis is able to more accurately determine the behavior types and travel modes of the associated passengers and deduce their relationships. Most associated passengers are those who travel regularly. They may go to work or go shopping together. However, there are also some abnormal behaviors in the public transportation system, such as begging, stealing, and so forth. Among these abnormal behaviors, stealing is the most common. Taking Beijing as an example, the number of stealing events exceeds half of the total number of abnormal behaviors. In recent years, the incidence rate of stealing in the public transportation system has been high, and the rate of solved criminal cases has not been greatly improved. Analyzing the associations between passengers is very helpful for public safety. However, rarely have studies focused on this field. Therefore, it is meaningful to analyze the travel behavior of these travel groups for the management department’s scheduling and management.
Analyzing the association between passengers has an important meaning. This not only helps the management departments to summarize the travel patterns of passengers and deduce the relationship between them, but also help management departments fully understand the travel needs of passengers, formulate scientific scheduling plans, and provide passengers with more efficient and convenient services. More importantly, by analyzing the association between abnormal passengers, the management department can grasp their travel patterns and find out their potential partner. This is very important for the management department to maintain public safety and ensure the operation of the public transportation system.
In order to analyze traffic data more intuitively and conveniently, many studies have introduced visualization technology when analyzing traffic data. Most of the existing studies are on the trajectory data of vehicles and the traffic data of road networks [
1,
2,
3,
4]. They focus on the trajectory of travel, hotspots in cities, the travel of specific passengers, the congestion situation in the road network and the impact of other abnormal events on the road network. There is very little research on travel information about the public transport system, while research on passenger correlation is even more scarce. X. Zhao et al. proposed a method to discover the individual associations among passengers, their method extracts the features of passenger travel and uses them to analyze the associations of passenger travel [
5]. However, they only provide a method for mining and analyzing the associations between passengers. For ordinary users, their method is too professional to intuitively and quickly explore the associations between passengers. Therefore, based on their method, it is necessary to provide an intuitive, fast and interactive visual exploration tool.
In this paper, we propose an interactive visual analytics system that can intuitively explore the associations between passengers in a public transportation system.
The main contributions of this paper are as follows:
- (1)
A multi-view interactive visualization system is designed, the association between passengers in the public transportation system can be intuitively explored by the system.
- (2)
Five views are designed to explore the association between passengers from five aspects: spatio-temporal trajectory, travel time distribution, origin-destination distribution, choice of transportation, and travel area.
- (3)
Two real cases were analyzed using data from Beijing public transportation system to verify the effectiveness of our method.
2. Related Works
The main research content of this paper is traffic data analysis and an interactive visualization system. Related studies are as follows.
2.1. Traffic Data Analysis
Traffic data analysis is of great significance to traffic management. Therefore, research on traffic data has gradually become a research hotspot. H. Tampubolon et al. used mobile sensor data for traffic jam speed prediction [
6]. B. Ji et al. used LTE data to predict road traffic [
7]. W. Yu et al. used the smart card data of the Nanjing Metro to analyze the spatiotemporal changes of passenger flow and residents’ commuting characteristics [
8]. W. Yu et al. analyzed the changes of urban community structure based on taxi GPS trajectory data [
9]. Z. Cheng et al., based on urban road intersection data, analyze the evolution characteristics of traffic accidents and identify spatiotemporal hotspots [
10].
In traffic data visualization analysis, the interaction in the view is an important research direction. Interactive operations include editing, filtering data, and adjusting the parameters of the algorithms and models involved. Single attribute filtering is usually done using a slider or a double slider [
11] and multiple attribute filtering is done using a parallel coordinate system or a scatter plotcite [
12]. In the study of historical traffic data, the study of trajectory data has always been the focus of traffic data visualization [
1,
2]. The trajectory data is usually combined with geographic information and is represented by a line connecting two locations [
3,
13], the attributes of which can represent different trajectory information [
14]. Tominski et al. [
15] designed a 3D view in which the trajectories were placed on a base map, each trajectory is represented by a colored bar and the color is used to represent the attribute value. 3D stacked wall maps provide a good display of historical information [
16]. Jie. Huang et al. used smart card data to analyze the travel situation in Beijing’s work area and living area [
17,
18]. Masahiko. Itoh et al. proposed a visualization method that combines traffic data with social network data [
19]. Ryan Wen Liu et al. proposed a method to analyze normal traffic data and abnormal traffic data separately [
20]. Jiang. X et al. proposed a visual analytics method to analyze large-scale taxi O/D (Origin/Destination)data [
21].
In the research on traffic data, most use road state data, trajectory data and IC card (smart card) data to study vehicle trajectories, urban hotspots, citizen travel patterns, and traffic state detection and prediction. Some of them use interactive visualization technology to explore traffic data and display the analysis results more intuitively. In mega cities, public transportation has gradually become the mainstream mode of travel. However, there is very little research on the visual analytics of public transportation travel data.
2.2. Interactive Visualization System
Due to the original data not being intuitive enough and there being potential connections in the data, the interactive visual analysis system has been applied to data analysis in various fields. Y. Du et al. proposed a visual analysis method for visual analysis of air quality data [
22]. J. Pu et al. proposed an interactive visual analysis system to visually mine the spatio-temporal behavior features in social media data [
23]. J. Yin, et al. proposed an interactive visual analysis system to explore Twitter users’ spatio-temporal movement patterns from multiple scales [
24]. H. Ha, et al. proposed a visualization method for visual analysis of EMR data. Multidimensional medical data can be analyzed through collaboration with psychiatrists [
25]. B. Cervantes et al. proposed a visual analysis method to analyze website visitors [
26]. H. Zhang et al. proposed a visual analysis method to visually explore potential patterns and anomalies in air quality data [
27]. J. Li et al. proposed a visual analysis method to visually explore slip and fall events at work [
28]. G. Sagl et al. proposed a visual analytics approach to extract spatiotemporal urban mobility information from mobile network traffic [
29]. S. Peters et al. designed a visual analysis method for multidimensional lightning data [
30]. J. Hua et al. designed a visual analysis method for stock market data to analyze stock indexes [
31].
In traffic big data visualization analytics, in order to facilitate the exploration of researchers, it is often necessary to analyze a variety of analysis views to form an interactive visualization system. Chu. D et al. use the LDA (Latent Dirichlet Allocation) algorithm to extract hidden topics for taxi data, which integrates interactive visualization tools, including taxi theme maps, theme routes, street clouds and parallel coordinates to visualize probability-based subject information. Users can perform exploration tasks with direct semantic and visual aids [
14]. The system consists of two parts: a sketch-based query and multiple coordinated views that support interactive operations. WangF et al. designed a visual analytics system with a single road as the research object [
3]. ZengF et al. proposed a visual analytics system to analyze passenger mobility [
13]. Wei. Chen et al. proposed a visualization system for exploring urban data [
4]. Riveiro et al. proposed a visualization system for detecting road anomalies [
32]. Zeng. W et al. proposed a visual analytics system that can analyze the activities of public transportation systems [
33].
Nowadays, interactive visualization systems have been applied to many data analysis tasks, such as environmental data, social data, financial data, medical data and traffic data. In the interactive visualization systems that analyze traffic data, most of them use vehicle trajectory data, urban road network data to interactively and visually explore urban hotspots, citizen travel patterns and road network congestion. Although public transportation has gradually become the first choice for citizens, few visual systems have interactive visual explorations of public transportation trips, and even fewer interactive visual explorations of the associations between passengers in public transportation systems.
3. Methodology
3.1. Overview
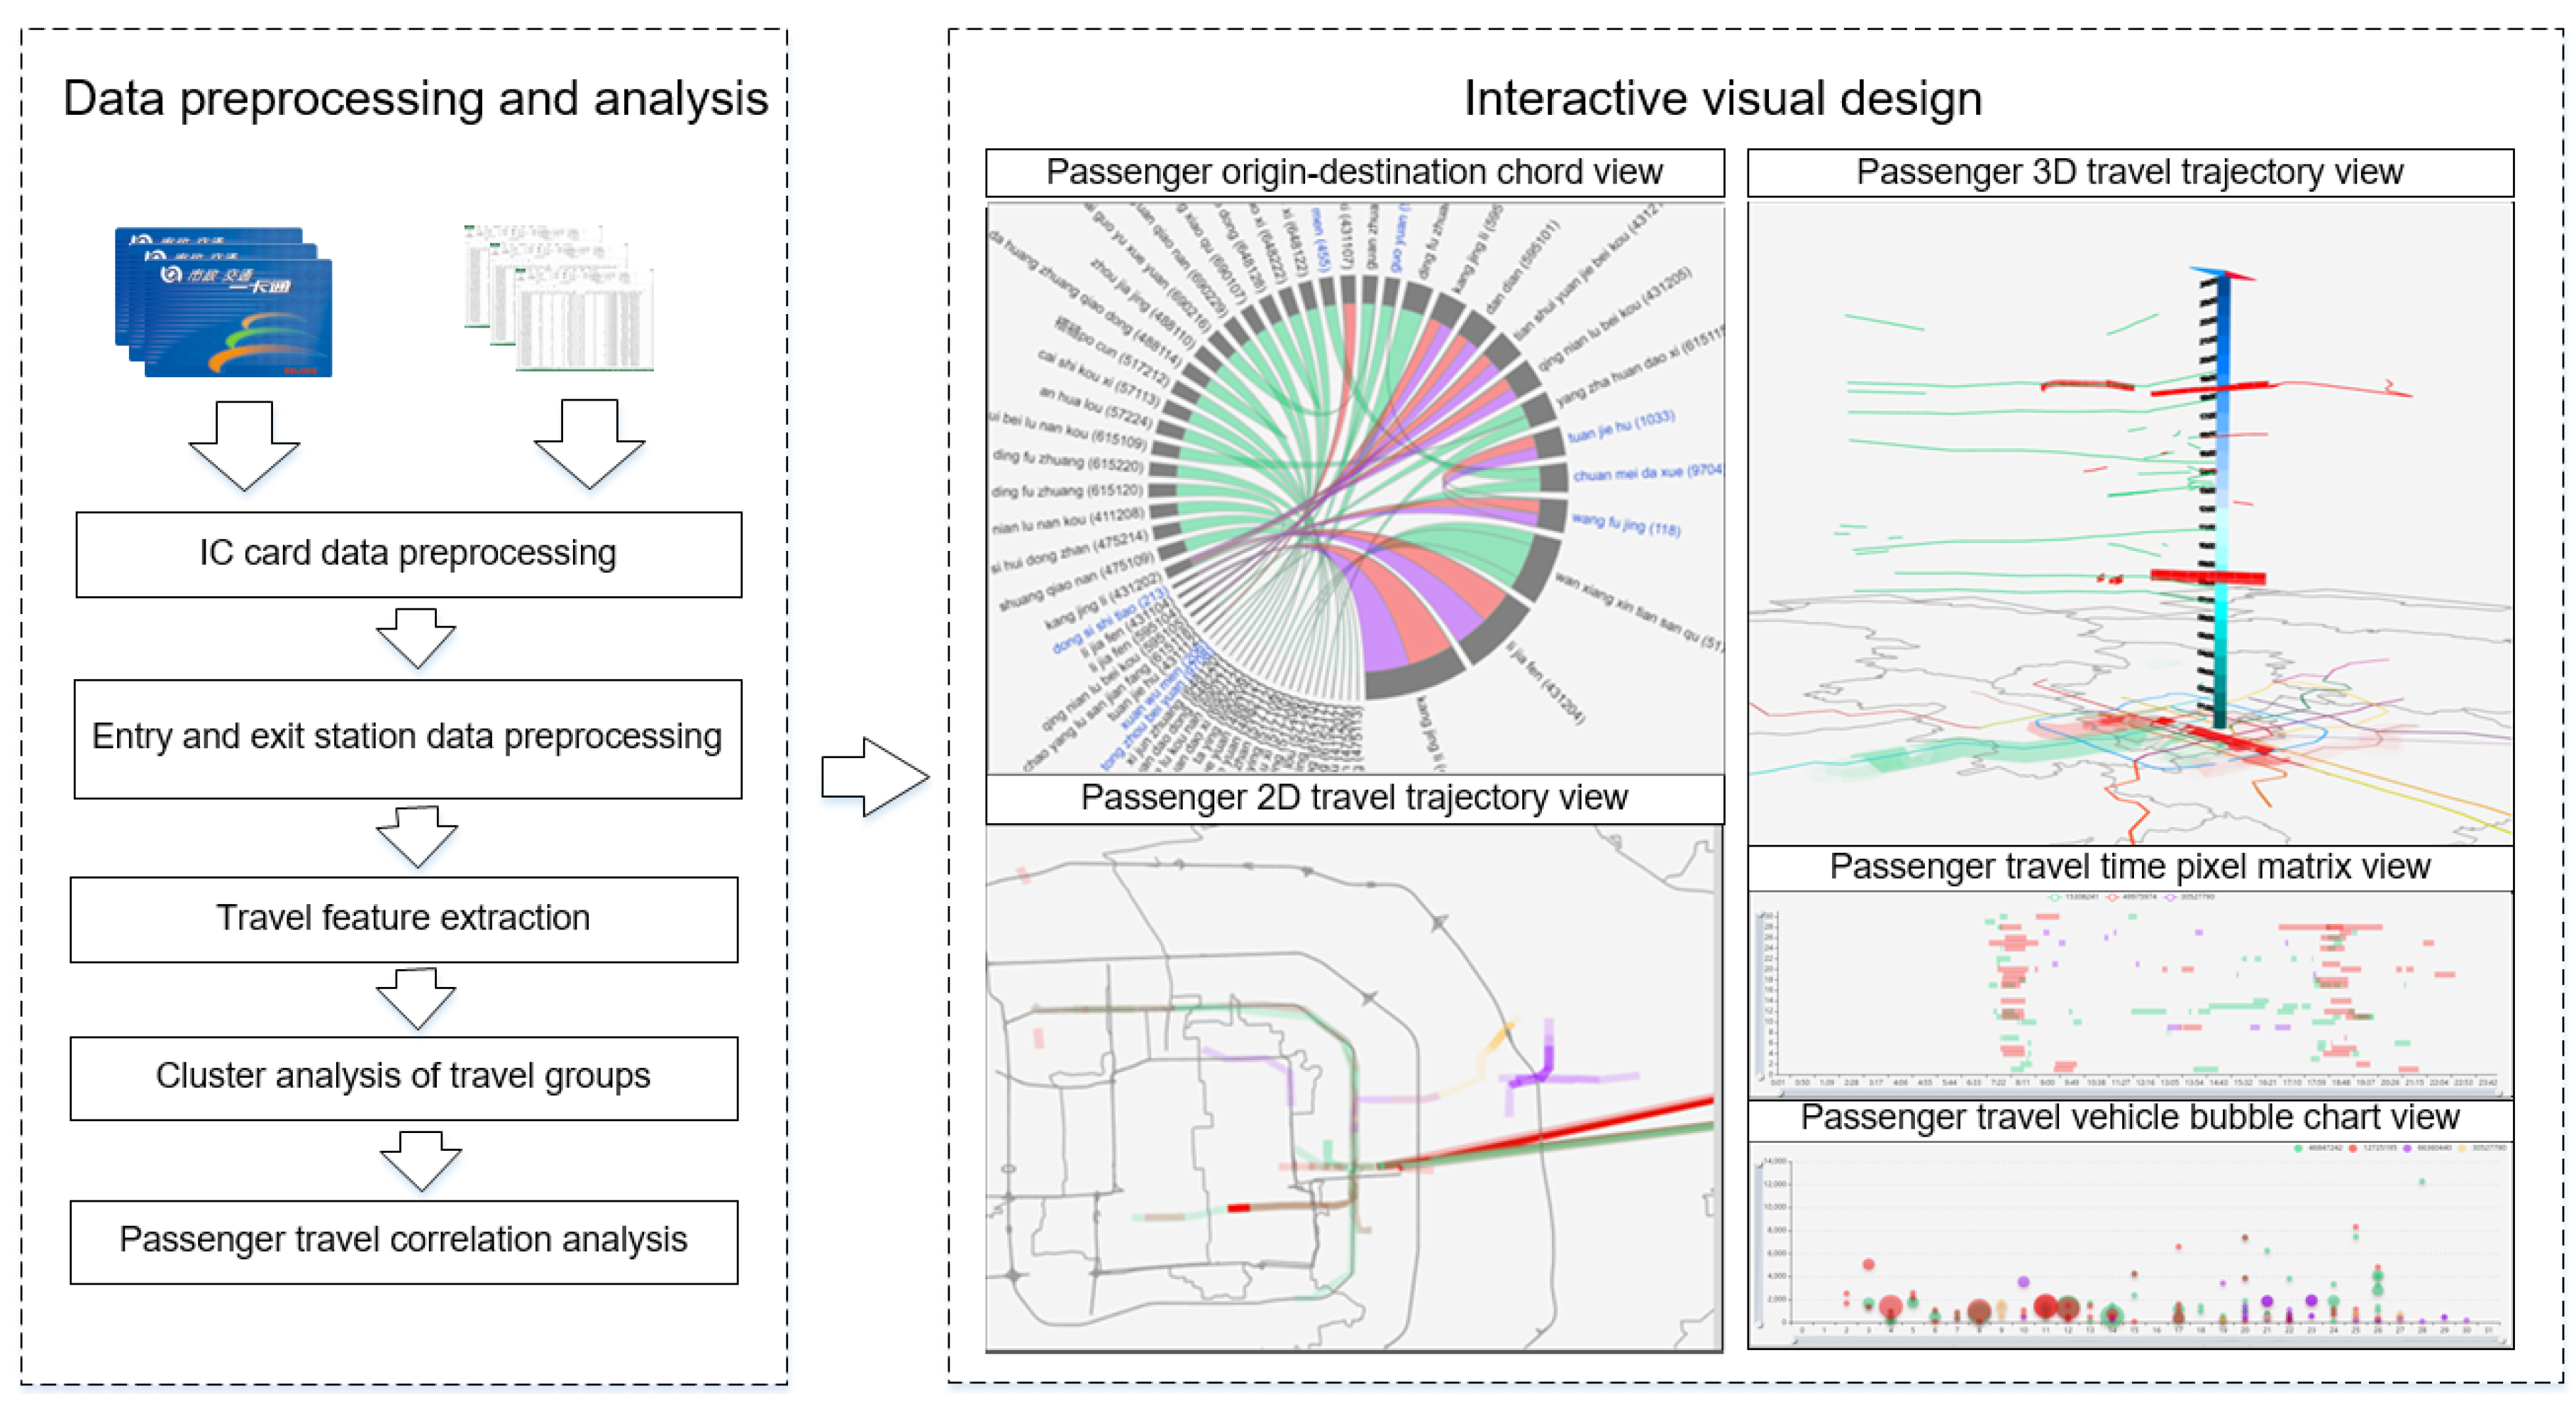
To solve the aforementioned problem, we propose a method that can analyze the associations between passengers in the public transportation system and interactively explore the travel information of associated passengers. To analyze the associations between passengers, we need to consider the spatial similarity, temporal similarity, spatial-temporal similarity, and similarity of passengers’ choice of vehicles. Firstly, we need to analyze the time distribution of passenger travel and observe whether there is an overlap in the travel time of passengers. Next, analyze the travel trajectory of the passenger to observe whether the passenger has an intersecting or similar travel trajectory. We also need to know the areas visited by passengers and how often they are visited. Then, the vehicle selection and frequency of selecting the vehicle when the passenger is riding needs to be analyzed to see if they choose the same vehicle and whether they have the same driving frequency. Finally, it is also necessary to analyze the passenger’s entry and exit stations to see if the passengers have similar departure and destination points. Based on the results of the above analysis, we can determine whether the passengers are related and deduce the relationship between them. Therefore, our method needs to meet the following requirements:
- R1:
It should support exploring the distribution of origin-destination for passenger travel.
- R2:
It should support exploring the trajectory of passenger travel.
- R3:
It should support exploring areas visited by passengers.
- R4:
It should support exploring the frequency of areas visited by passengers.
- R5:
It should support exploring the time distribution of passenger travel.
- R6:
It should support exploring the distribution of vehicles used by passengers for travel.
Our method mainly consists of two modules: Data pre-processing and analysis module and visual analytic module, as shown in
Figure 1.
In the data processing module, we first process the raw data. Then we extract the travel features from the raw data. After that, based on the extracted features, we cluster the passengers’ travel to divide them into different travel categories. Finally, we analyzed the associations between passengers.
In the visual analytics module, we designed five views to explore the associations between passengers:
- (1)
Passenger 3D travel trajectory view
This view shows the 3D trajectory of passenger travel, it can explore the trajectory (R2) and travel time (R5) of passenger travel.
- (2)
Passenger travel time pixel matrix view
This view is used to explore the time distribution of passenger travel (R5). It uses a pixel matrix to show the time of passengers entering, exiting and the time spent in the public transportation system.
- (3)
Passenger origin-destination chord view
This view is used to explore the entry station and exit station of specific passengers (R1). It uses a chord view to show the distribution of entry and exit stations, and also shows the ratio of entry and exit for each station.
- (4)
Passenger travel vehicle bubble chart view
This view is used to explore the distribution of vehicles used by passengers for travel (R6). It shows the routes of the passenger’s vehicle and the frequency of passengers on each route.
- (5)
Passenger 2D travel trajectory view
This view shows the 2D trajectory of passenger travel. It can be used to explore the trajectory of passenger travel (R2), the travel area of passengers (R3) and the travel frequency of each area (R4).
We use the above five views to form a visual analytics system that explores the associations between passengers. Due to the importance of human-computer interaction, these five views are cooperative and interactive.
3.2. Data Processing and Analysis
Our data set is provided by the Beijing Transportation Information Center, which contains travel data of Beijing public transportation systems from 1 June 2015 to 31 December 2015. It contains more than 1 billion pieces of passenger travel information and each has 37 attributes, such as card number, recharge time, balance, time of entry and exit, entry and exit stations. In order to process such a large amount of data quickly, we use Hadoop which provides massive data processing capabilities in a distributed environment for data processing.
3.2.1. Data Preprocessing
It is common knowledge that the raw data need to be processed before visual analytics. We need to clean the data, eliminate useless data, construct the passenger’s travel chain, extract the features of passenger travel, and use these features to analyze associations between passengers. There are two situations. One situation focuses on group travel to see if they are similar. The processing method is as follows: first, calculate the frequency of a travel route entering a station and set it as the connection weight value of the station. If there is no mirrored travel, initialize the connection weight value and set the connection weight value of the exit station to a relative minimum, such as 0.1. The other is individual travel, the connection weight is divided into the entry weight and the exit weight and then processed in a similar way. The results are shown in
Table 1, in the type column in the table, B means bus station, M means subway station.
3.2.2. Travel Feature Extraction
According to the concept of outliers in pattern recognition theory, anomalous behaviors can be regarded as an outlier behavior that deviates from the travel behavior of most passengers [
2]. In order to accurately identify normal and abnormal passengers, multiple travel feature indicators are extracted from the dimensions of time, space, and attributes for identification. Finally, seven key features are extracted to construct a feature sequence for passenger travel to quantify passenger travel patterns. These features are used as input data for cluster analysis [
1].
Referring to the work of X. Zhao et al. [
5], considering the diversity of passenger travel in time, space and travel categories, we extract seven travel key features: abStas (number of visits to the station), staTmEn (temporal entropy of passengers at station level), staZnEn (spatial entropy of passengers at station level), freTraPct (proportion of high-frequency travel during weekdays), peakTmPct (proportion of travel during rush hours), maxODPct (proportion of most frequent travel), shortTraPct (proportion of short travel) and the characteristic attribute lof (anomaly extent of a passenger). In the visual analytics module, we use these features to visually explore passenger travel. Due to the different calculation methods of each feature, the values of each feature not only have large differences, but also have different dimensions. In order to use these features more conveniently, we have normalize these features. The calculation formula of the normalization process is shown in Formula (1), where
represents the value of feature A, B represents the maximum value allowed for each feature in the visual analytics. In our method, the value of B is 10.
3.2.3. Cluster Analysis of Travel Groups
X. Zhao et al. [
5] pointed out that the abnormal passengers have significantly different distribution characteristics from the normal individuals in the key features of freTraPct and maxODPct. According to the statistical results, when the passengers’ freTraPct is higher than 0.05, the frequent travel characteristics of passengers are more obvious, so the threshold of the freTraPct is set to 0.05. Similarly, when the passengers’ maxODct is higher than 0.3, the passengers’ characteristic of regular OD pairs is more obvious. So the threshold of maxODPct is set to 0.3. Generally speaking, when a passenger’s travel features meet the following conditions:
freTraPct > 0.05, recorded as frequent passengers.
maxODPct > 0.3, recorded as the passenger with the most frequent travel path.
According to the above two key conditions, all passengers are divided into G1, G3, G5 and G7. The standard of each group is shown in
Table 2.
Public transportation passengers show different distribution characteristics on the travel features. We use the k-means++ algorithm to cluster the travel characteristics of passengers in G1, G3, G5, and G7, and lof is used to measure the abnormality.
3.2.4. Passenger Travel Correlation Analysis
There may be some potential associations between passengers, especially for groups that travel together whose association will be stronger. Such associations include: similar travel patterns, similar temporal patterns, similar spatial patterns, similar temporal-spatial patterns, travel patterns and weighted similarities in spatial-temporal patterns. The weighted similarity operator
is used to measure the similarity between the passengers p and q, as shown in Formula (2), where
and
refer to the weight coefficients of the travel mode similarity operator mobSim and the spatial-temporal pattern similarity operator stSim respectively,
. Only use the mobSim operator or the stSim operator will bring high error rate. The combination of the two operators can improve the detection accuracy. It is worth noting that the mobSim weight can be reset to 0.1∼0.5 to achieve the maximum effect.
3.3. Interactive Visual View Design
The association between passengers can be better explored by the multi-view interactive exploration. The details of these five views are as follows.
3.3.1. Passenger Travel Time Pixel Matrix View
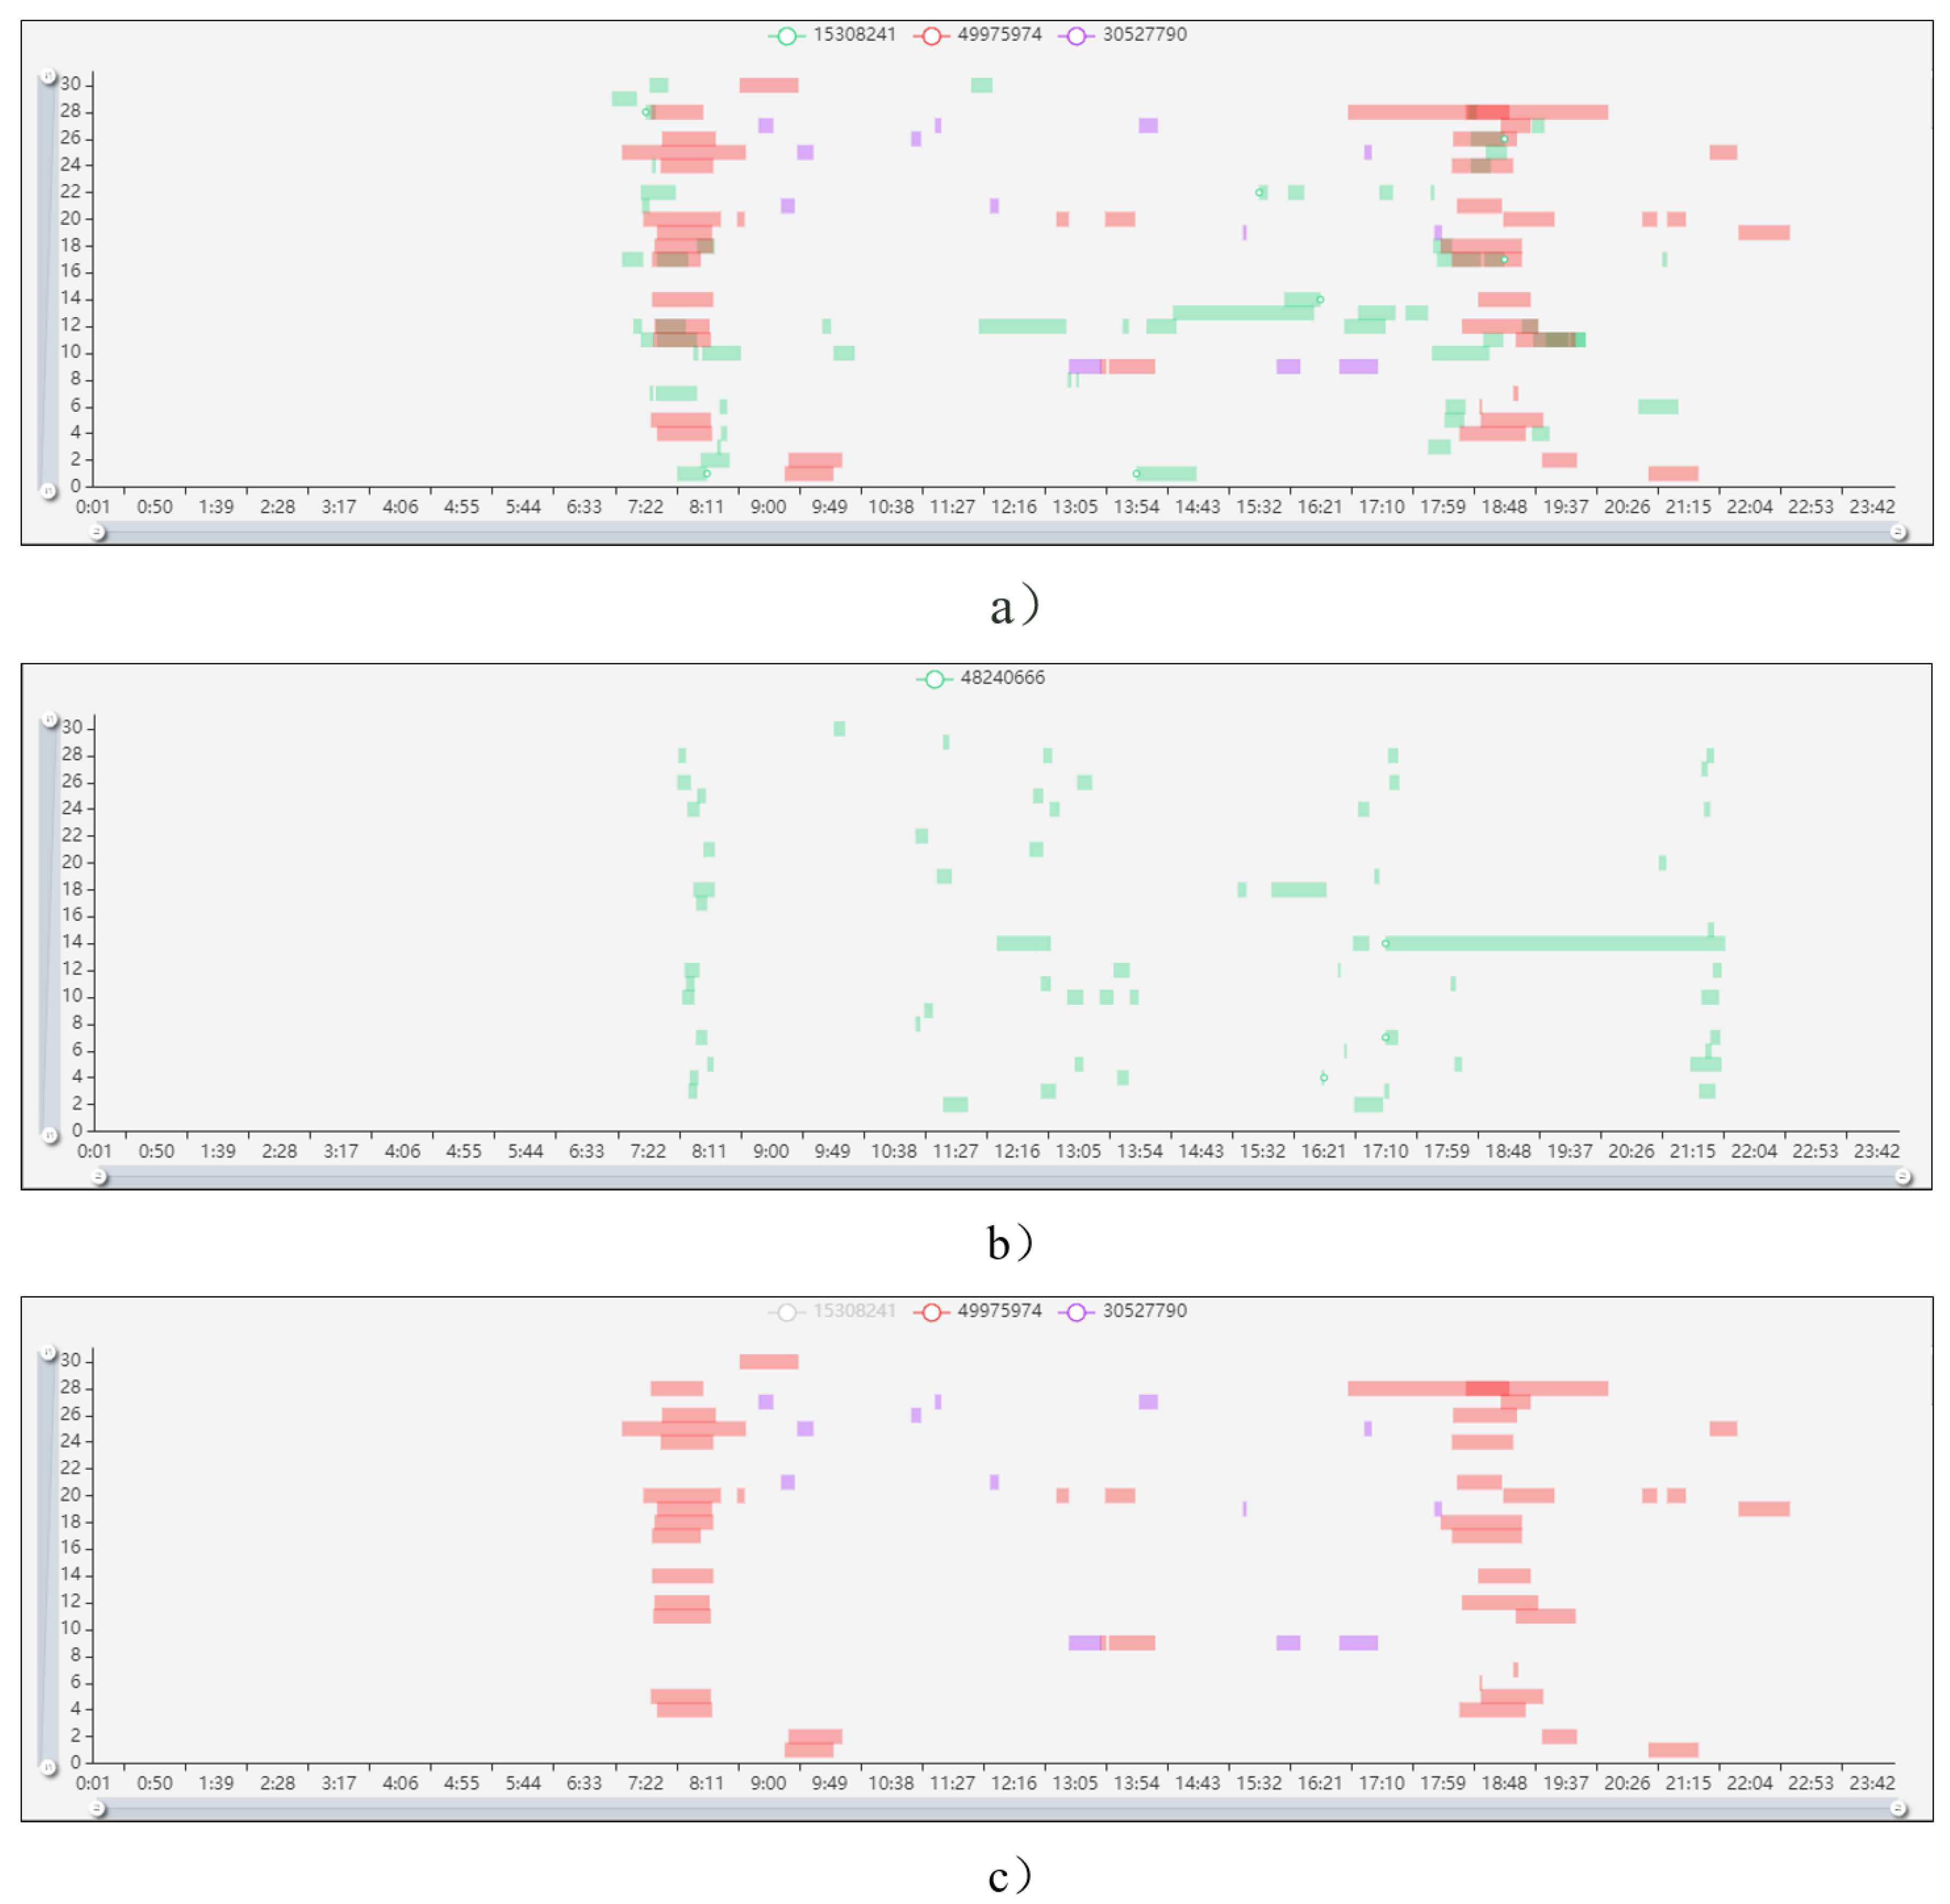
This view is used to show the time distribution of specific passengers in a selected date range, as shown in
Figure 2. The horizontal axis represents 24 h of the day with a format of HH:MM and the vertical axis represents each day of a month. The color of the pixel block represents the IC card to which the data item belongs, different colors represent different IC cards.
As shown in
Figure 2a, the pixel matrix of the cards numbers 15308241 (green), 49975974 (red) and 30527790 (purple) is shown. The pixel block with a color different from the three colors belongs to the time overlap region. The more similar in time, the more overlapping areas. Click the button at the top to hide the pixel matrix of the specified card number, as shown in
Figure 2c, it is the view when the card number 15308241 is hidden.
In addition, as shown in
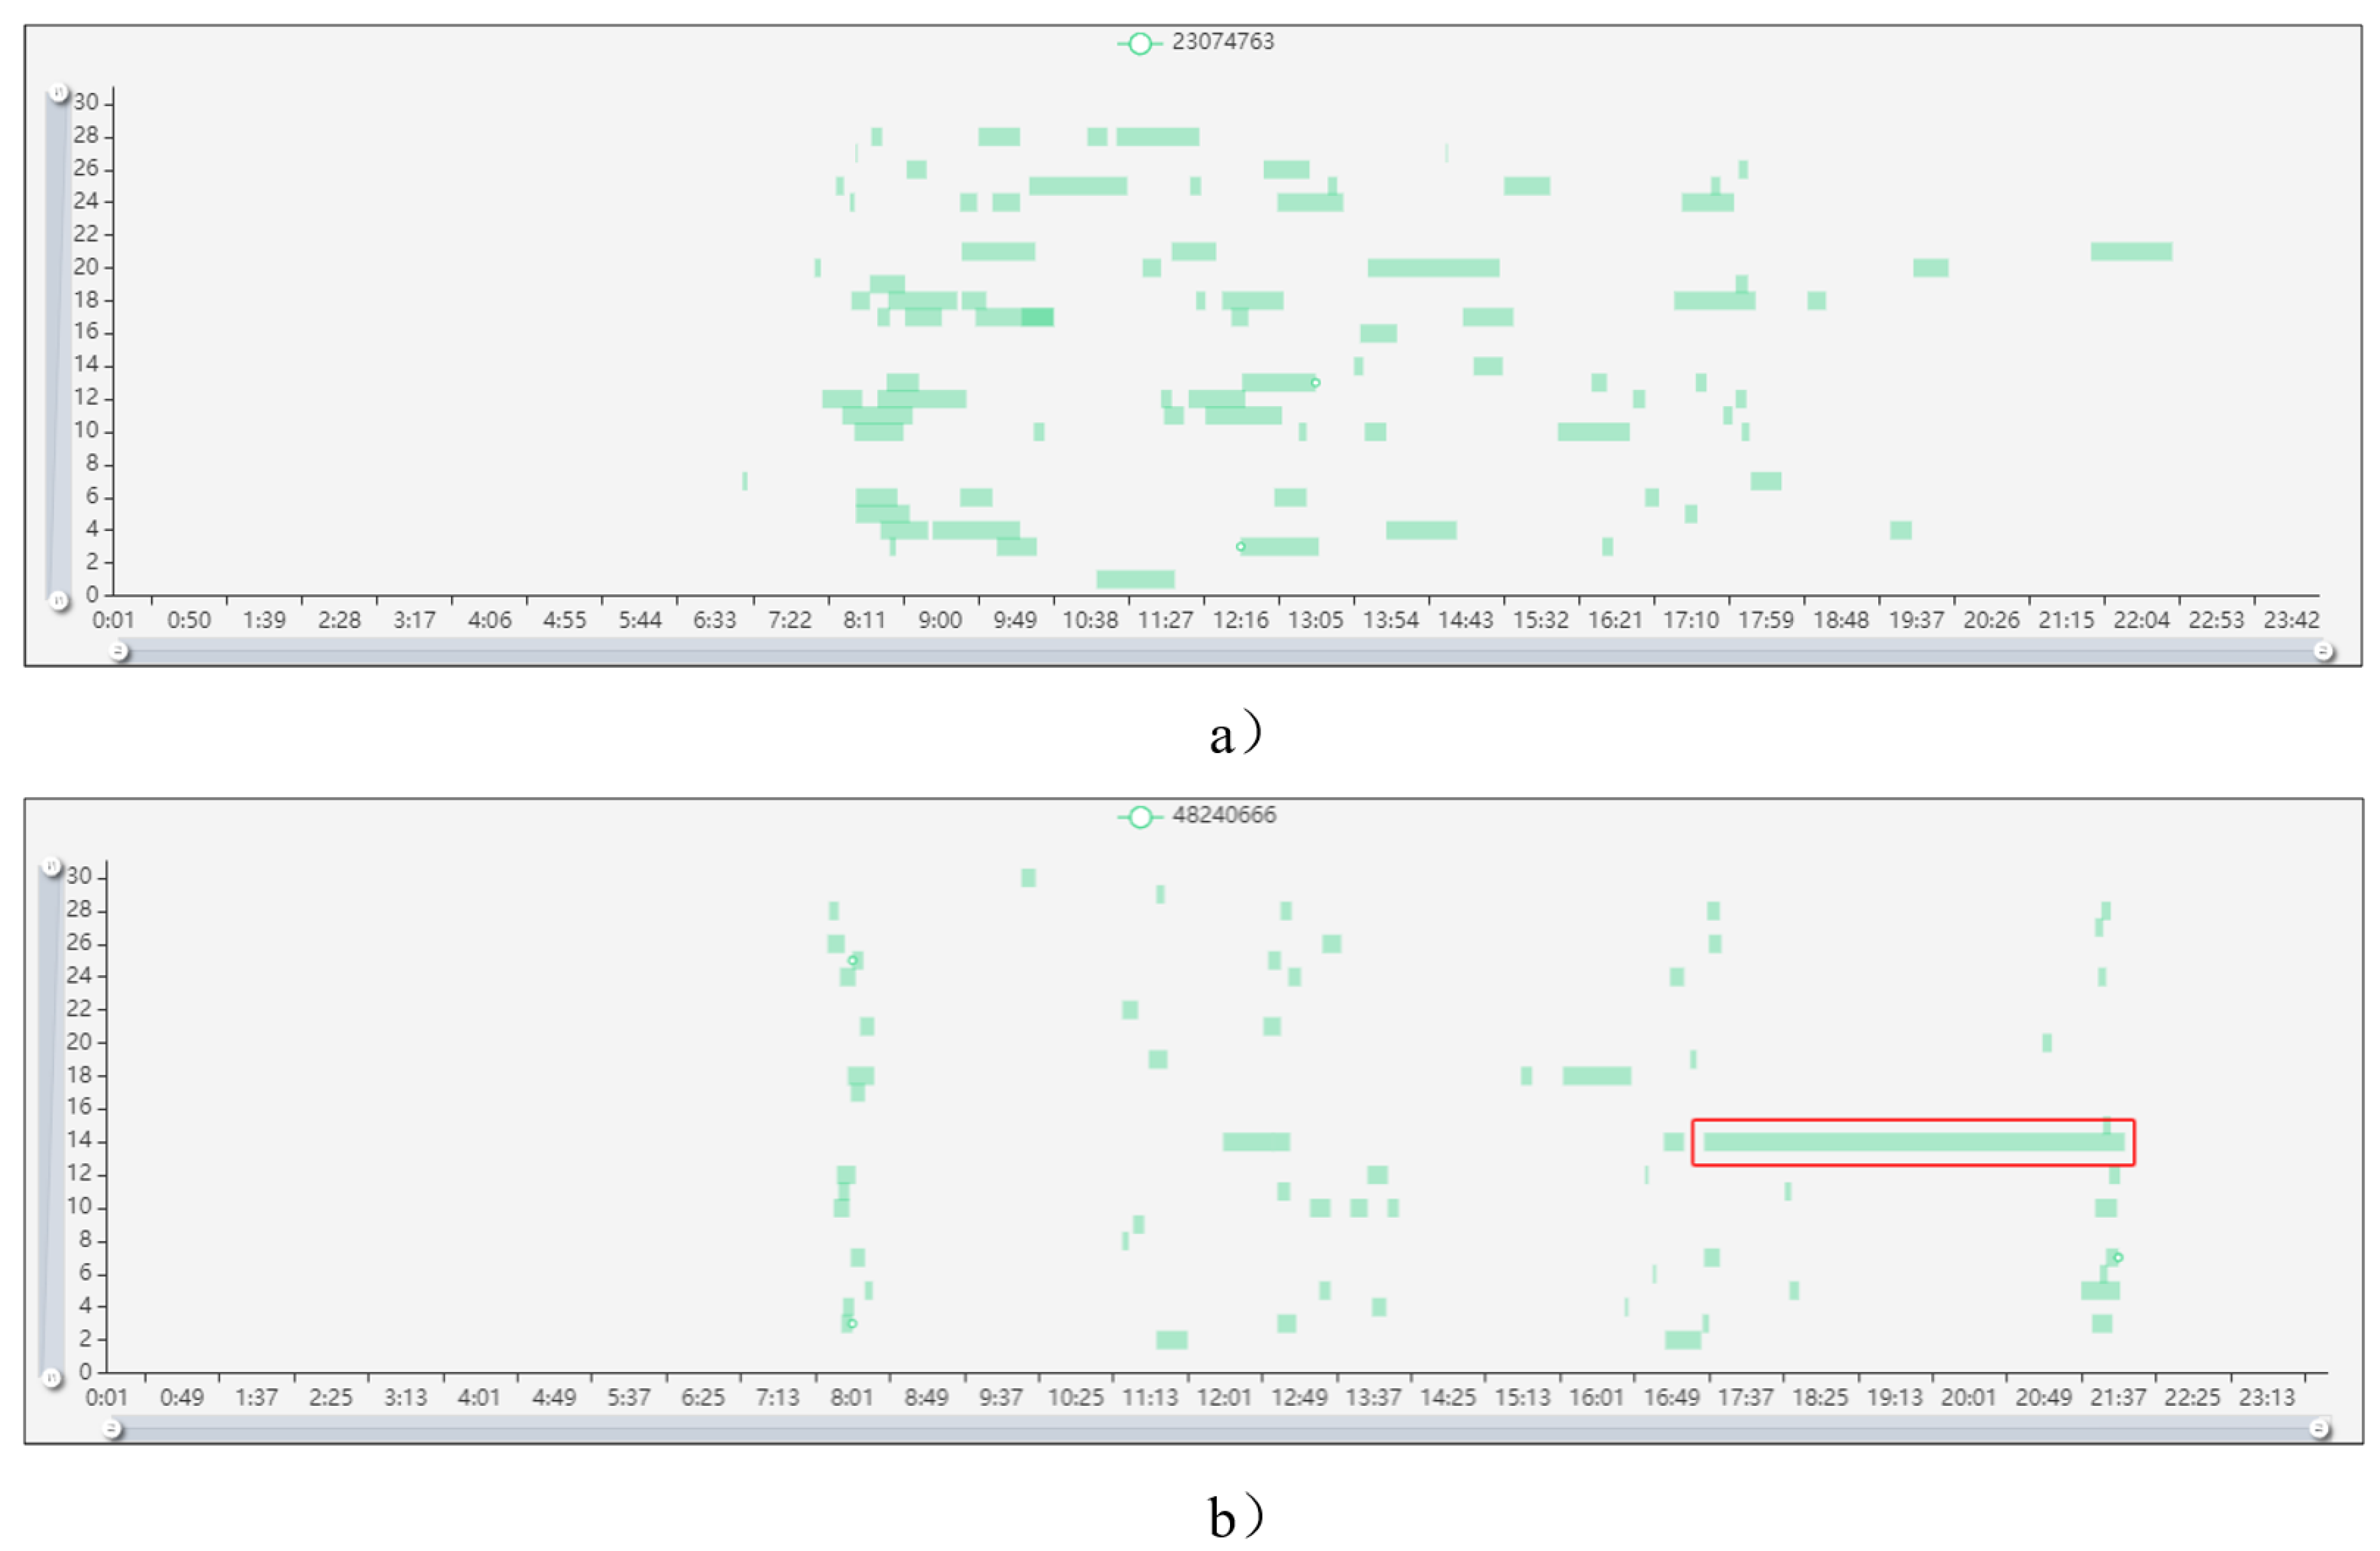
Figure 2a, it can be clearly seen that the travel time of card numbers 15308241 (green) and 49975974 (red) is distributed between 7:00 to 9:00 in the morning and 17:30 to 20:00 in the afternoon, with few travels at other times. The card number 30527790 (purple) is clearly different from them. If the travel time on the matrix is chaotic and there is no regularity, it is likely to be an abnormal card. As shown in
Figure 3a is the travel time pixel matrix of the abnormal card 23074763.
If the travel time is too long in a period of time, it is also considered as a suspected abnormality, as shown in the red rectangle in
Figure 3b. In addition, the view supports zoom in, zoom out and moves the visible range of the pixel matrix view through the horizontal or vertical axis for more detailed observation of passenger travel time. When the mouse is placed on a pixel block, there is also an information floating window showing detailed information, as shown in
Figure 4.
3.3.2. Passenger 3D Travel Trajectory View
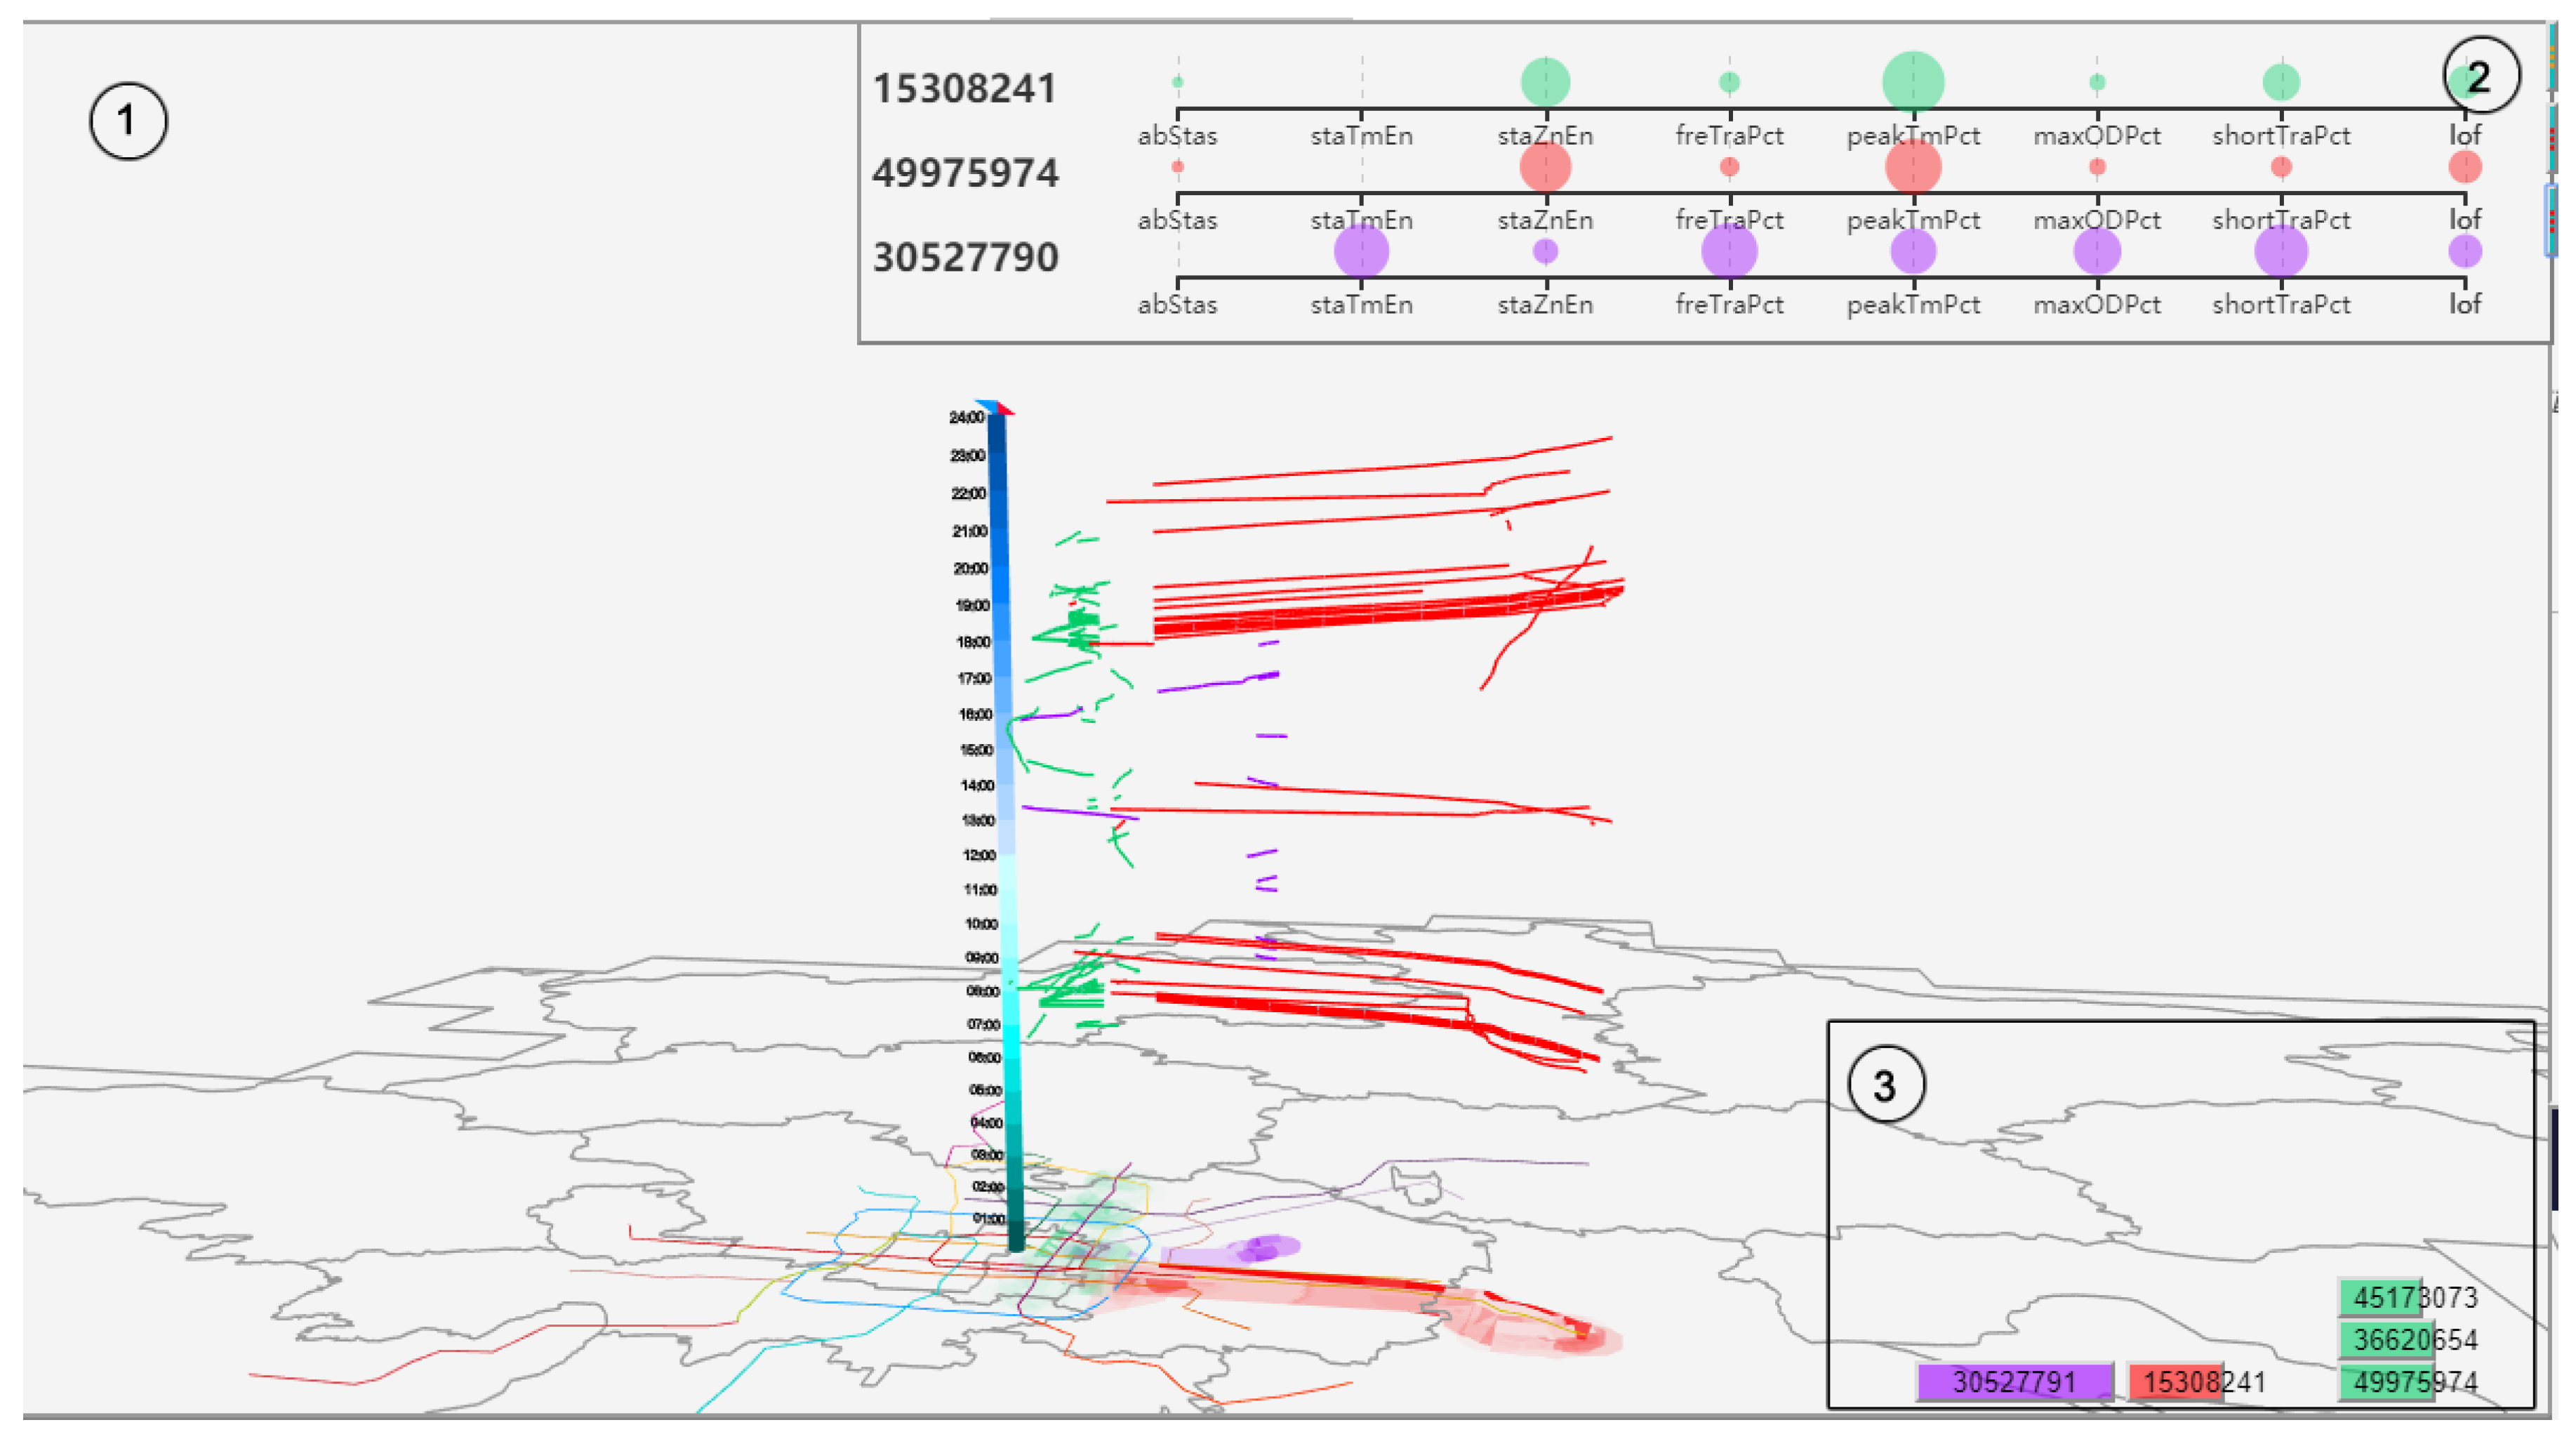
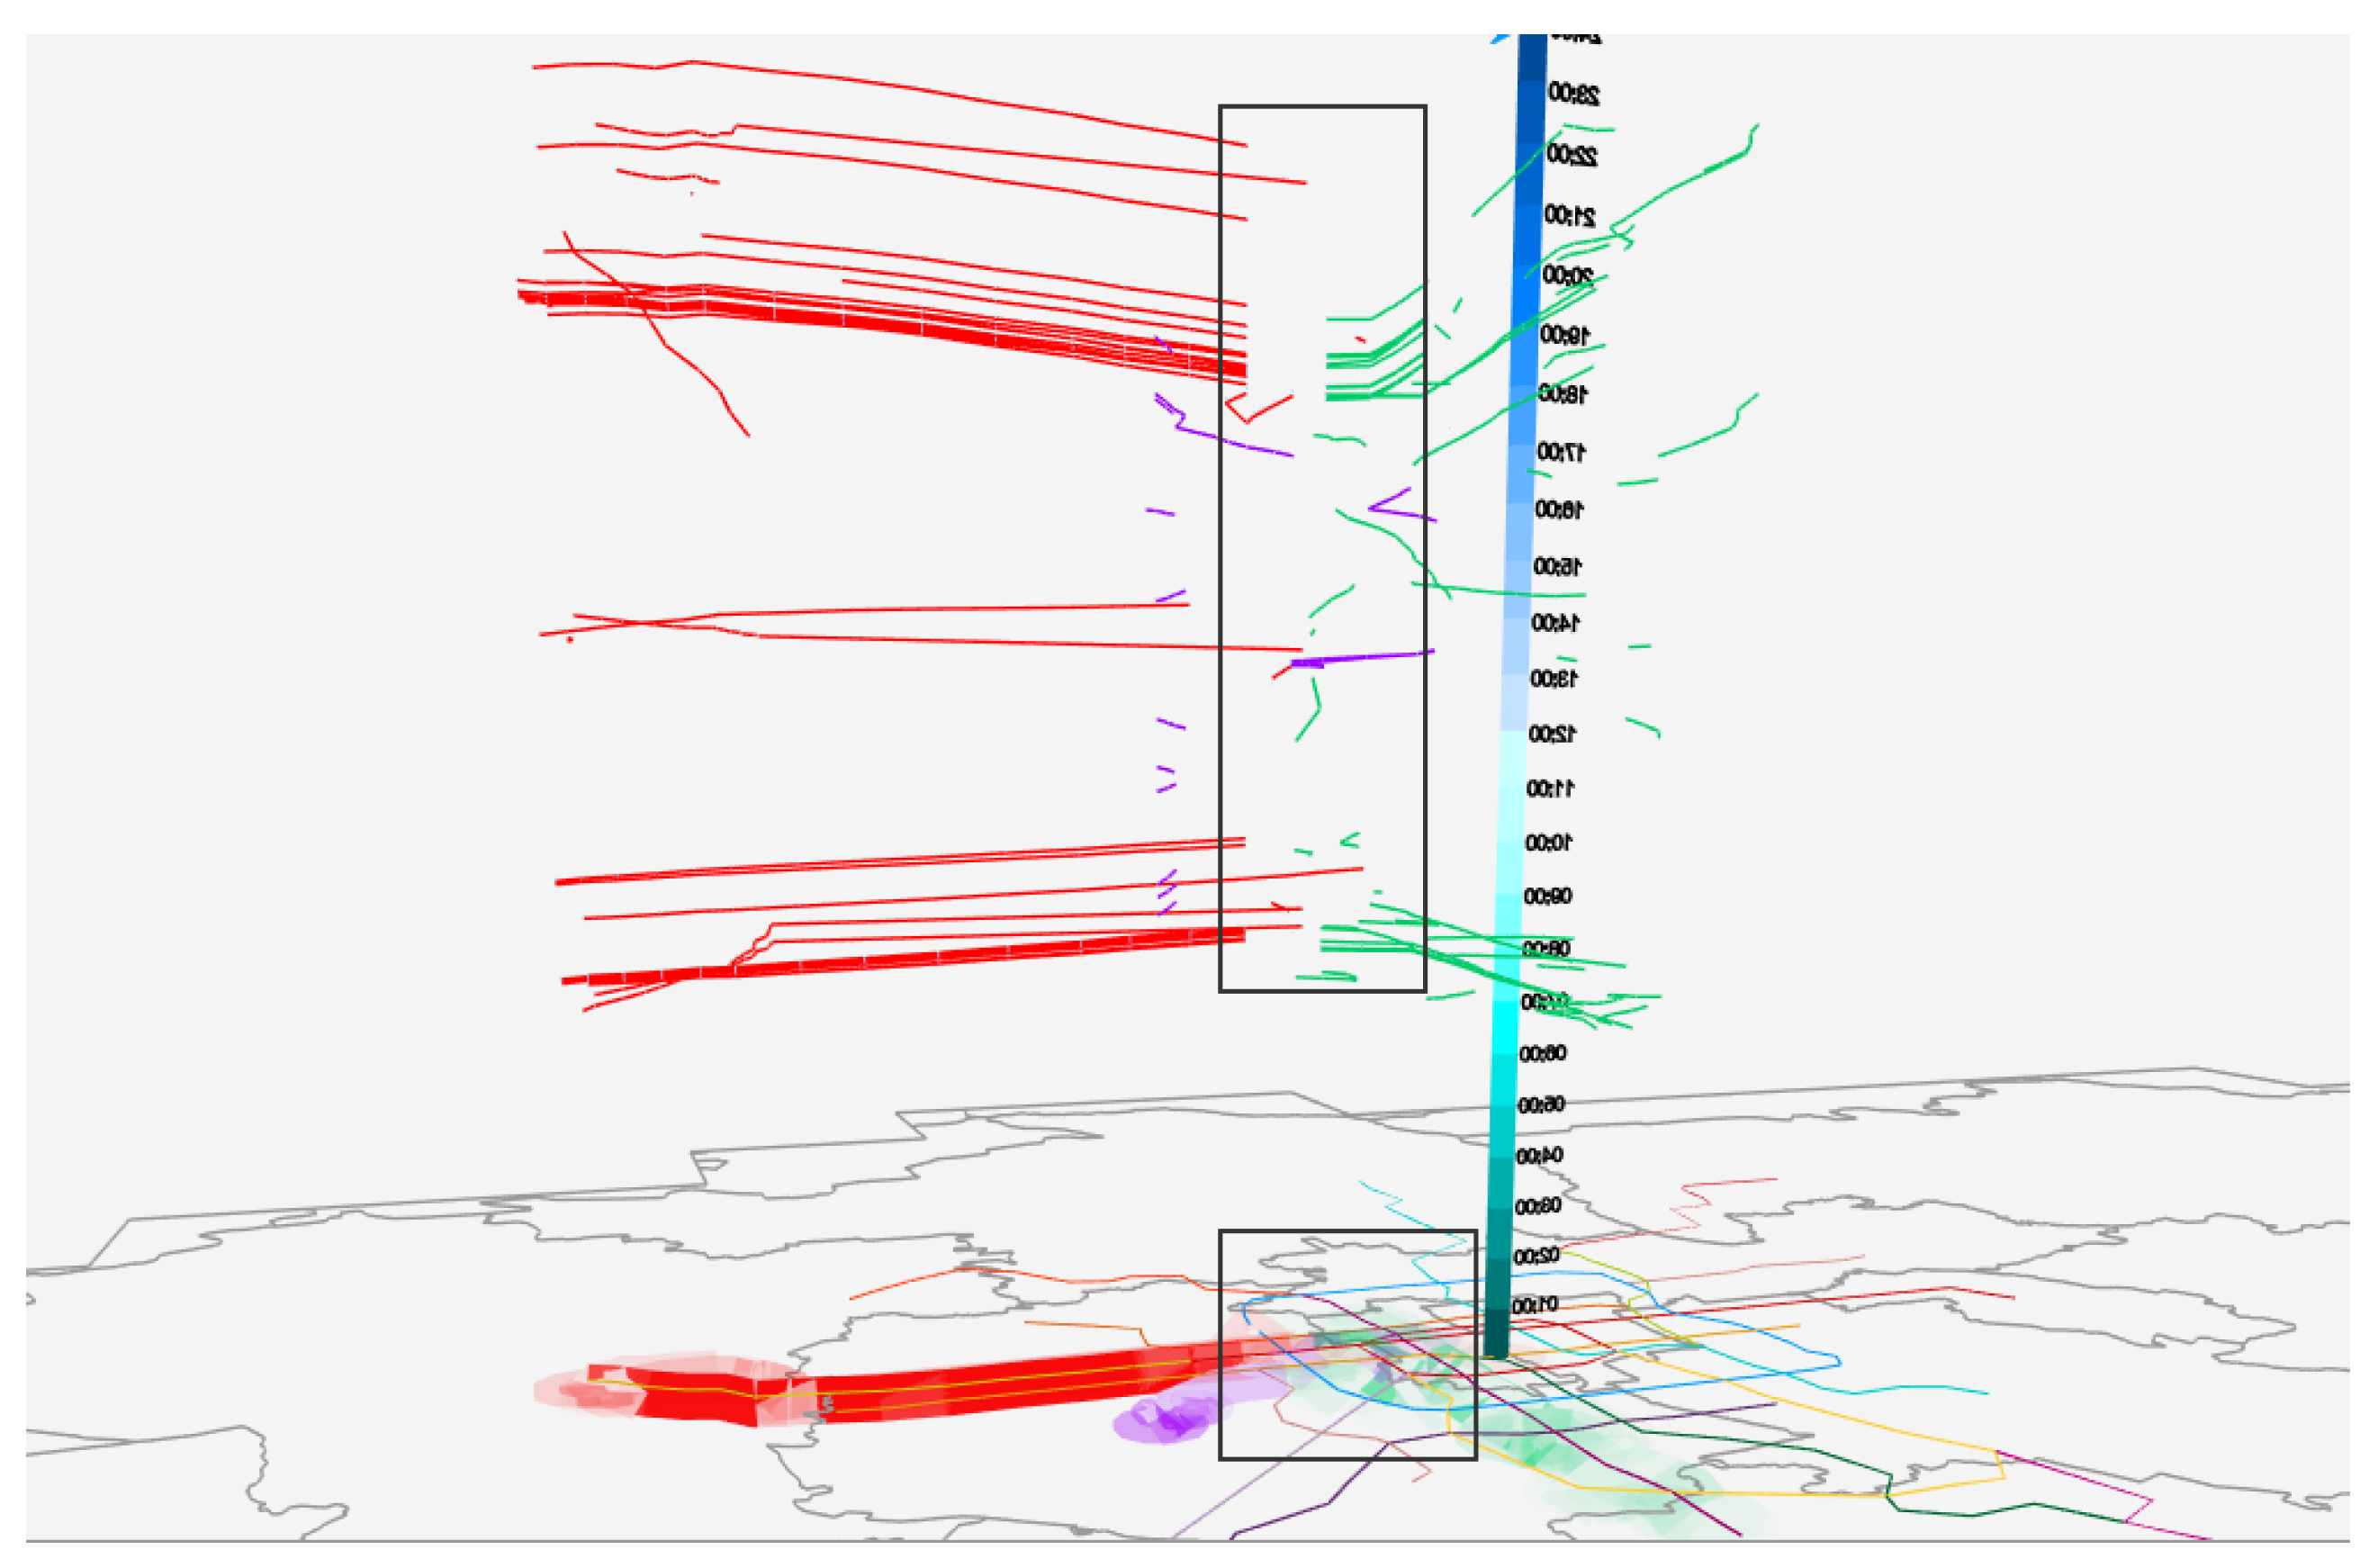
This view focuses on the spatial-temporal travel situation of specific IC cards, including the travel trajectory, travel time, travel feature distribution and relevance ranking, as shown in
Figure 5. Different colors represent different IC card numbers, 3D trajectories are used to show passengers’ spatial-temporal travel situations. Travel feature view is used to observe the distribution of features of different cards. Judging travel similarity of different card numbers based on travel features, the size of the bubble represents the value of the feature. The relevance ranking is used to display the relevance ranking of different IC card, the relevance degree is decremented from bottom to top. The length of the bar represents the degree of association, the card number of the same color is the associated card group.
In
Figure 5, it can be intuitively observed that the card numbers 15308241 and 49975974 are similar in travel features, can be found in the corresponding associated card group at the relevance ranking window. The travel feature window and the relevance ranking window can be hidden by corresponding buttons. From the 3D trajectory, as shown in
Figure 6, card numbers 15308241 and 49975974 have no overlap on spatial-temporal trajectory, it seems that there is no association between them, but it can be seen their destination is in the same area. It can be observed from
Figure 2a that they have strong similarity in travel time, so it can be seen that the two cards may be associated cards with the same travel time rule, from different places to the same place. According to the analysis, the card number 15308241 usually departs from Tiantongyuan subway station and arrives at Yonganli subway station, card number 49975974 usually departs from Linheli subway station and arrives at Dawanglu subway station, while Yonganli and Dawanglu are just near Guomao, so we can deduce that they work near Guomao. They may be colleagues.
3.3.3. Passenger Origin-Destination Chord View
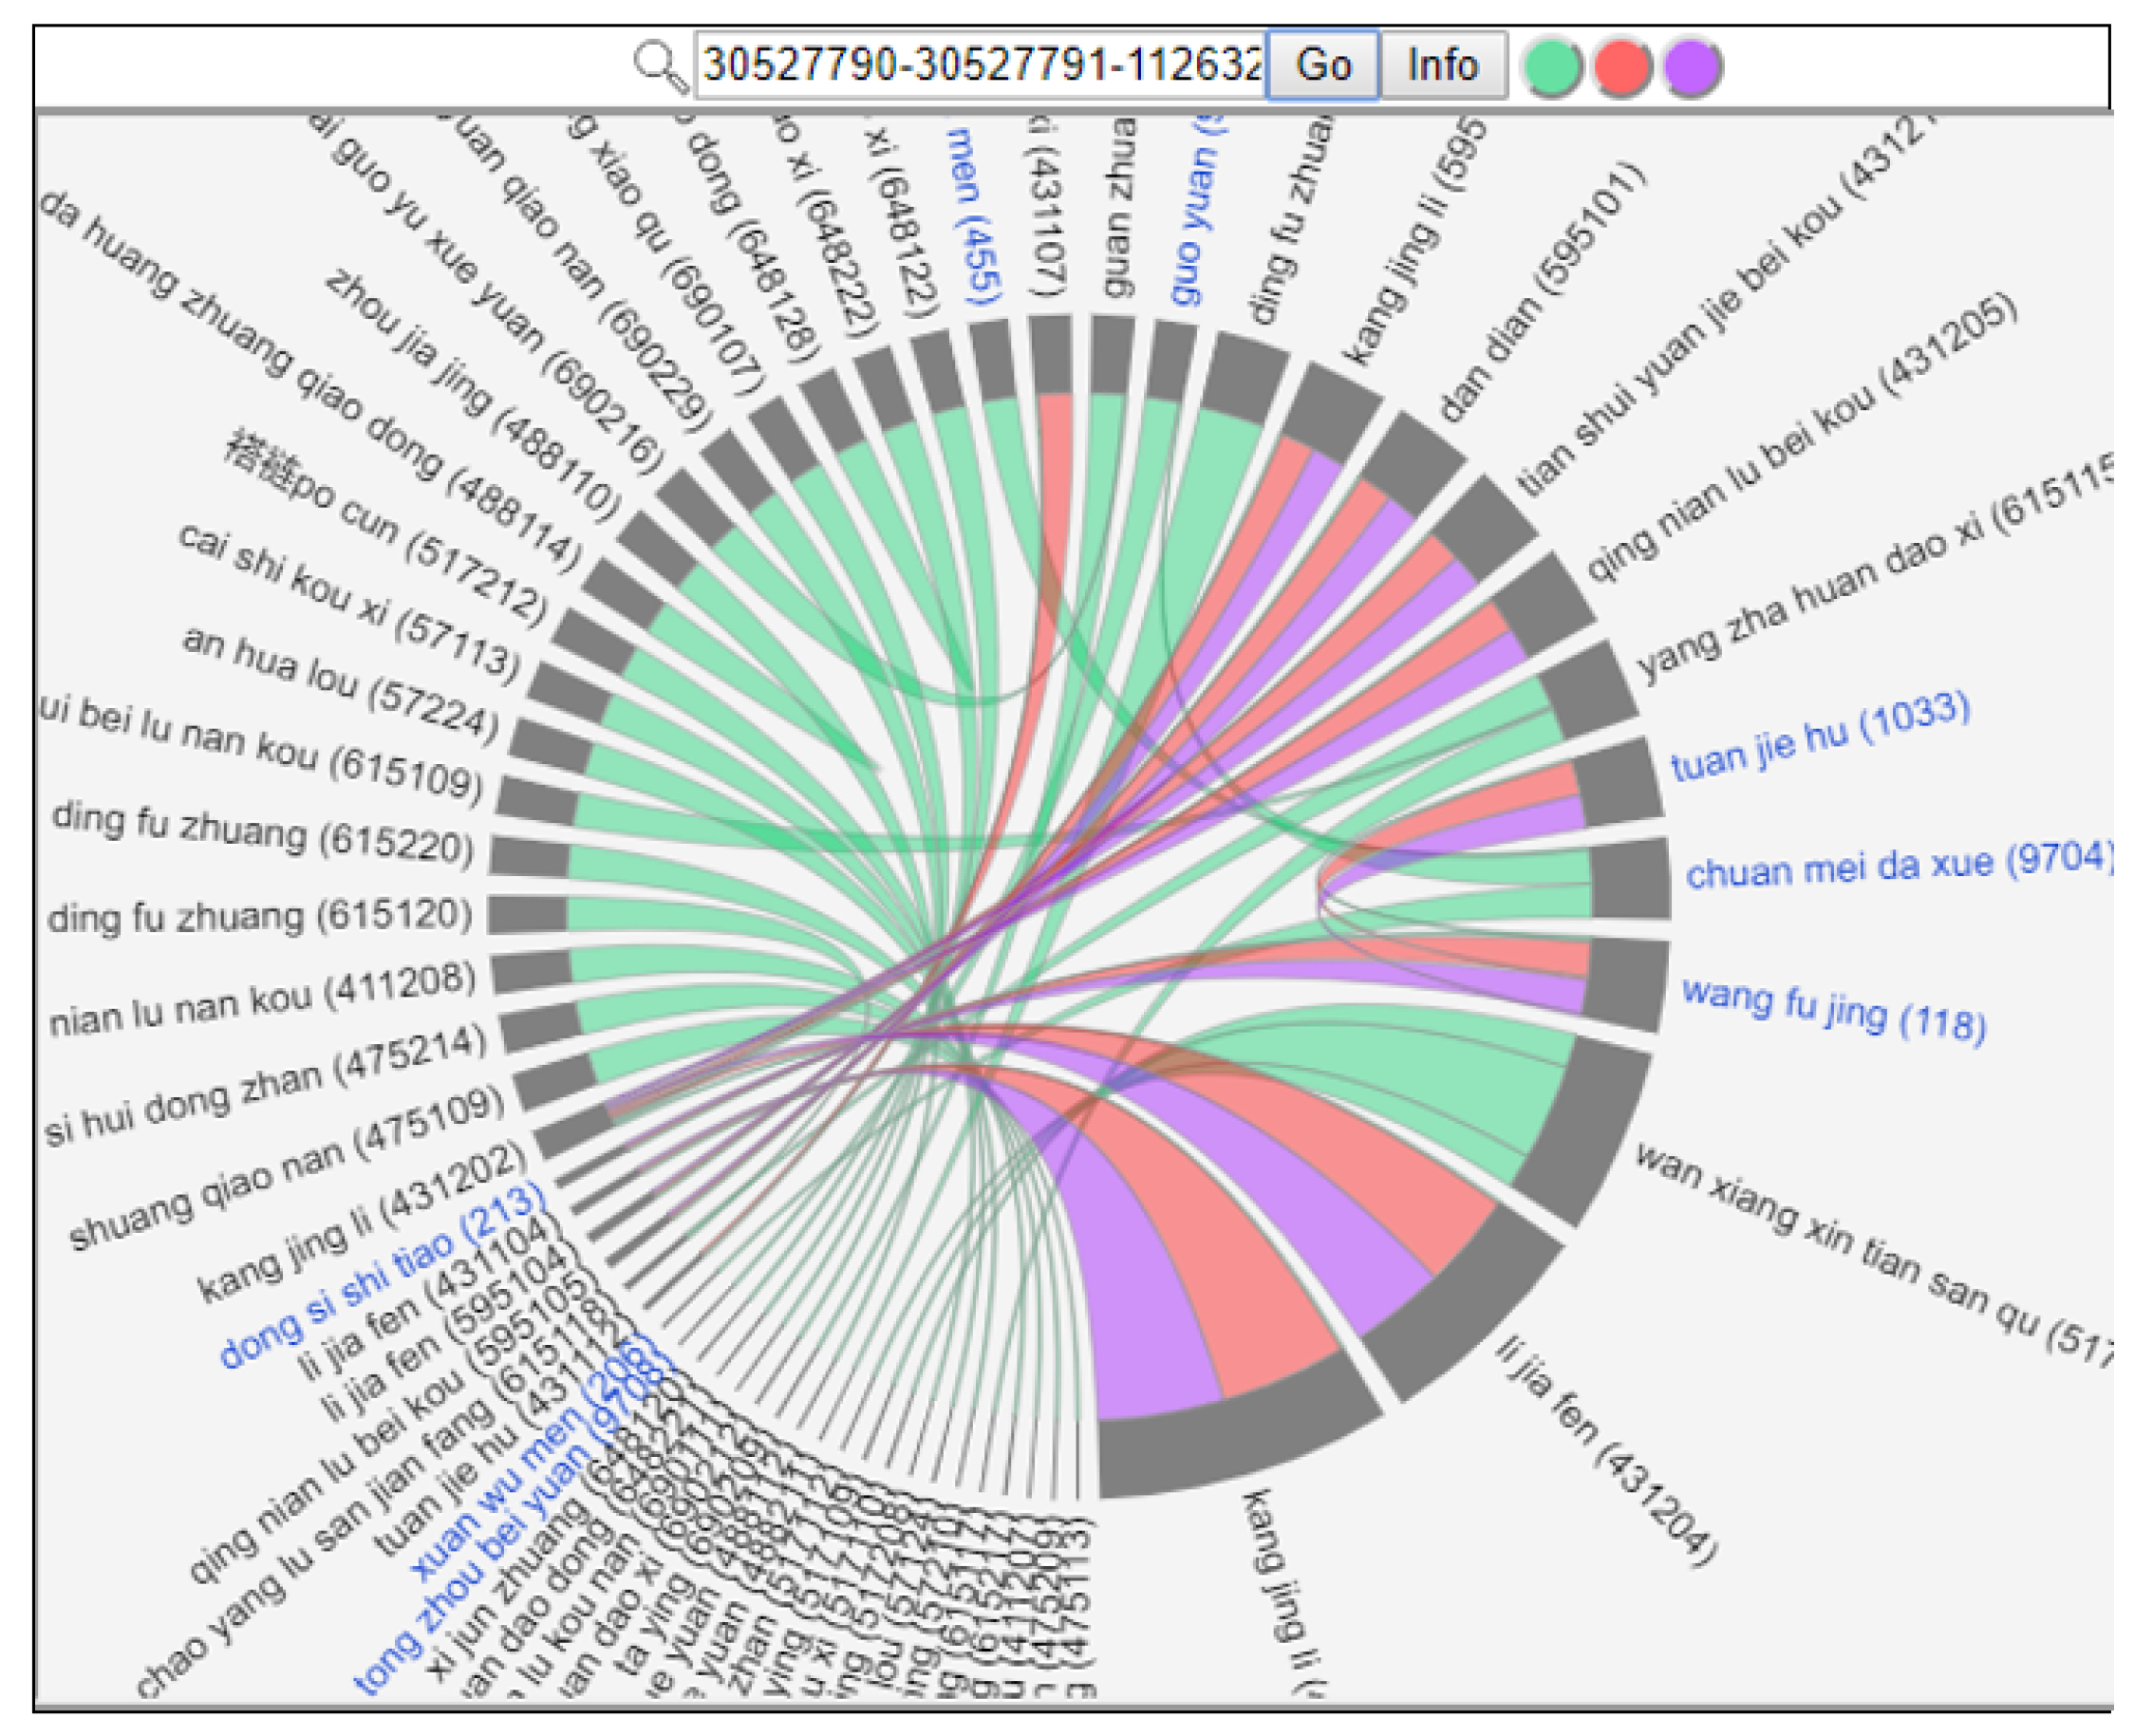
This view visualizes the distribution of passengers’ entry stations and exit stations; it can be used to analyze the areas where the specific passengers often appear. So that users can better schedule and manage specific stations, as shown in
Figure 7. Different colors represent different passengers, gray arcs represent stations, the size of the station and the weight of the chord represents passengers entering and leaving the station. From this figure, we can visually observe that the card represented by red and the card represented by purple are similar on the entry stations and exit stations, the ratio of entry and exit is almost the same, the card represented by green is different from them on the entry stations and exit stations. Click on the circular icon indicating the card number in the upper right corner to view the distribution of the entry stations and exit stations of the specified card. The ink blue chord represents the entry stations and the light blue string represents the exit station.
Figure 8 is the distribution of entry station and exit station of card numbers 30527791 and 1126321 in one month. In this figure, the color of the arc block represents the IC card number to which the chord view belongs. In comparison, it can be found that the exit stations of the card numbers 30527791 and 1126321 are similar.
3.3.4. Passenger Travel Vehicle Bubble Chart View
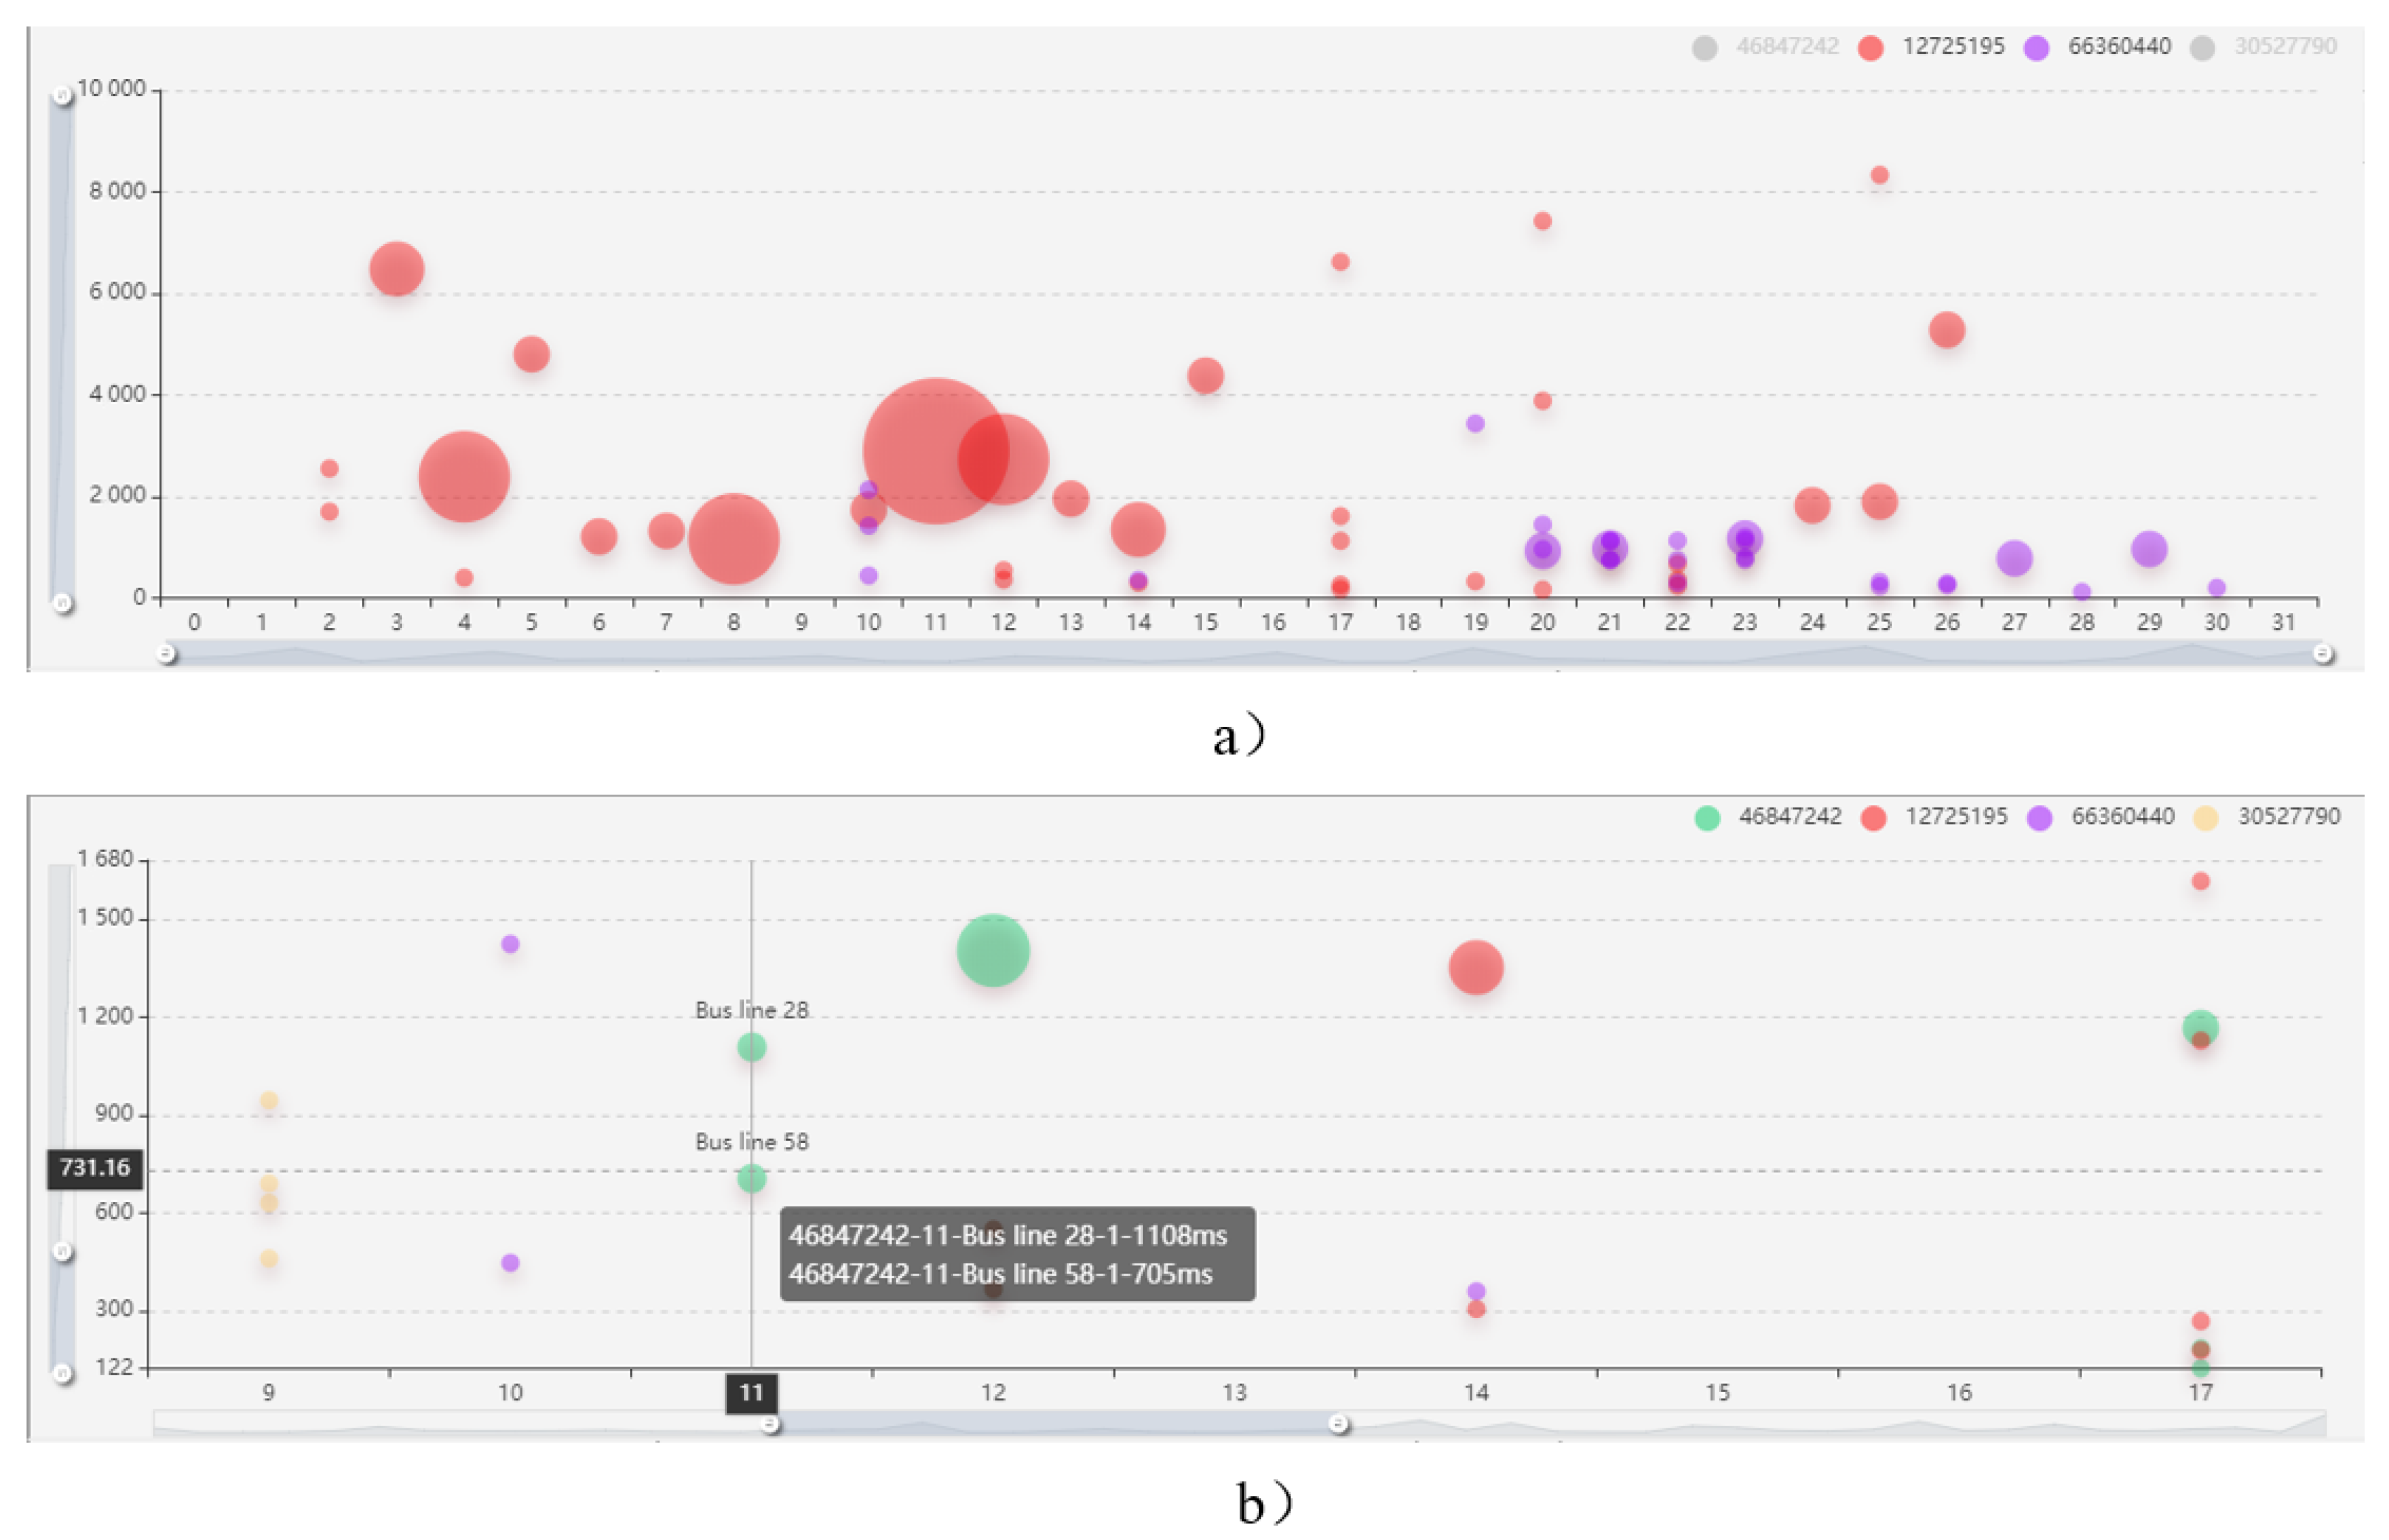
This view visualizes the distribution of vehicles used by passengers for travel. It mainly includes the line number of the vehicle, the frequency of rides and the travel time, as shown in
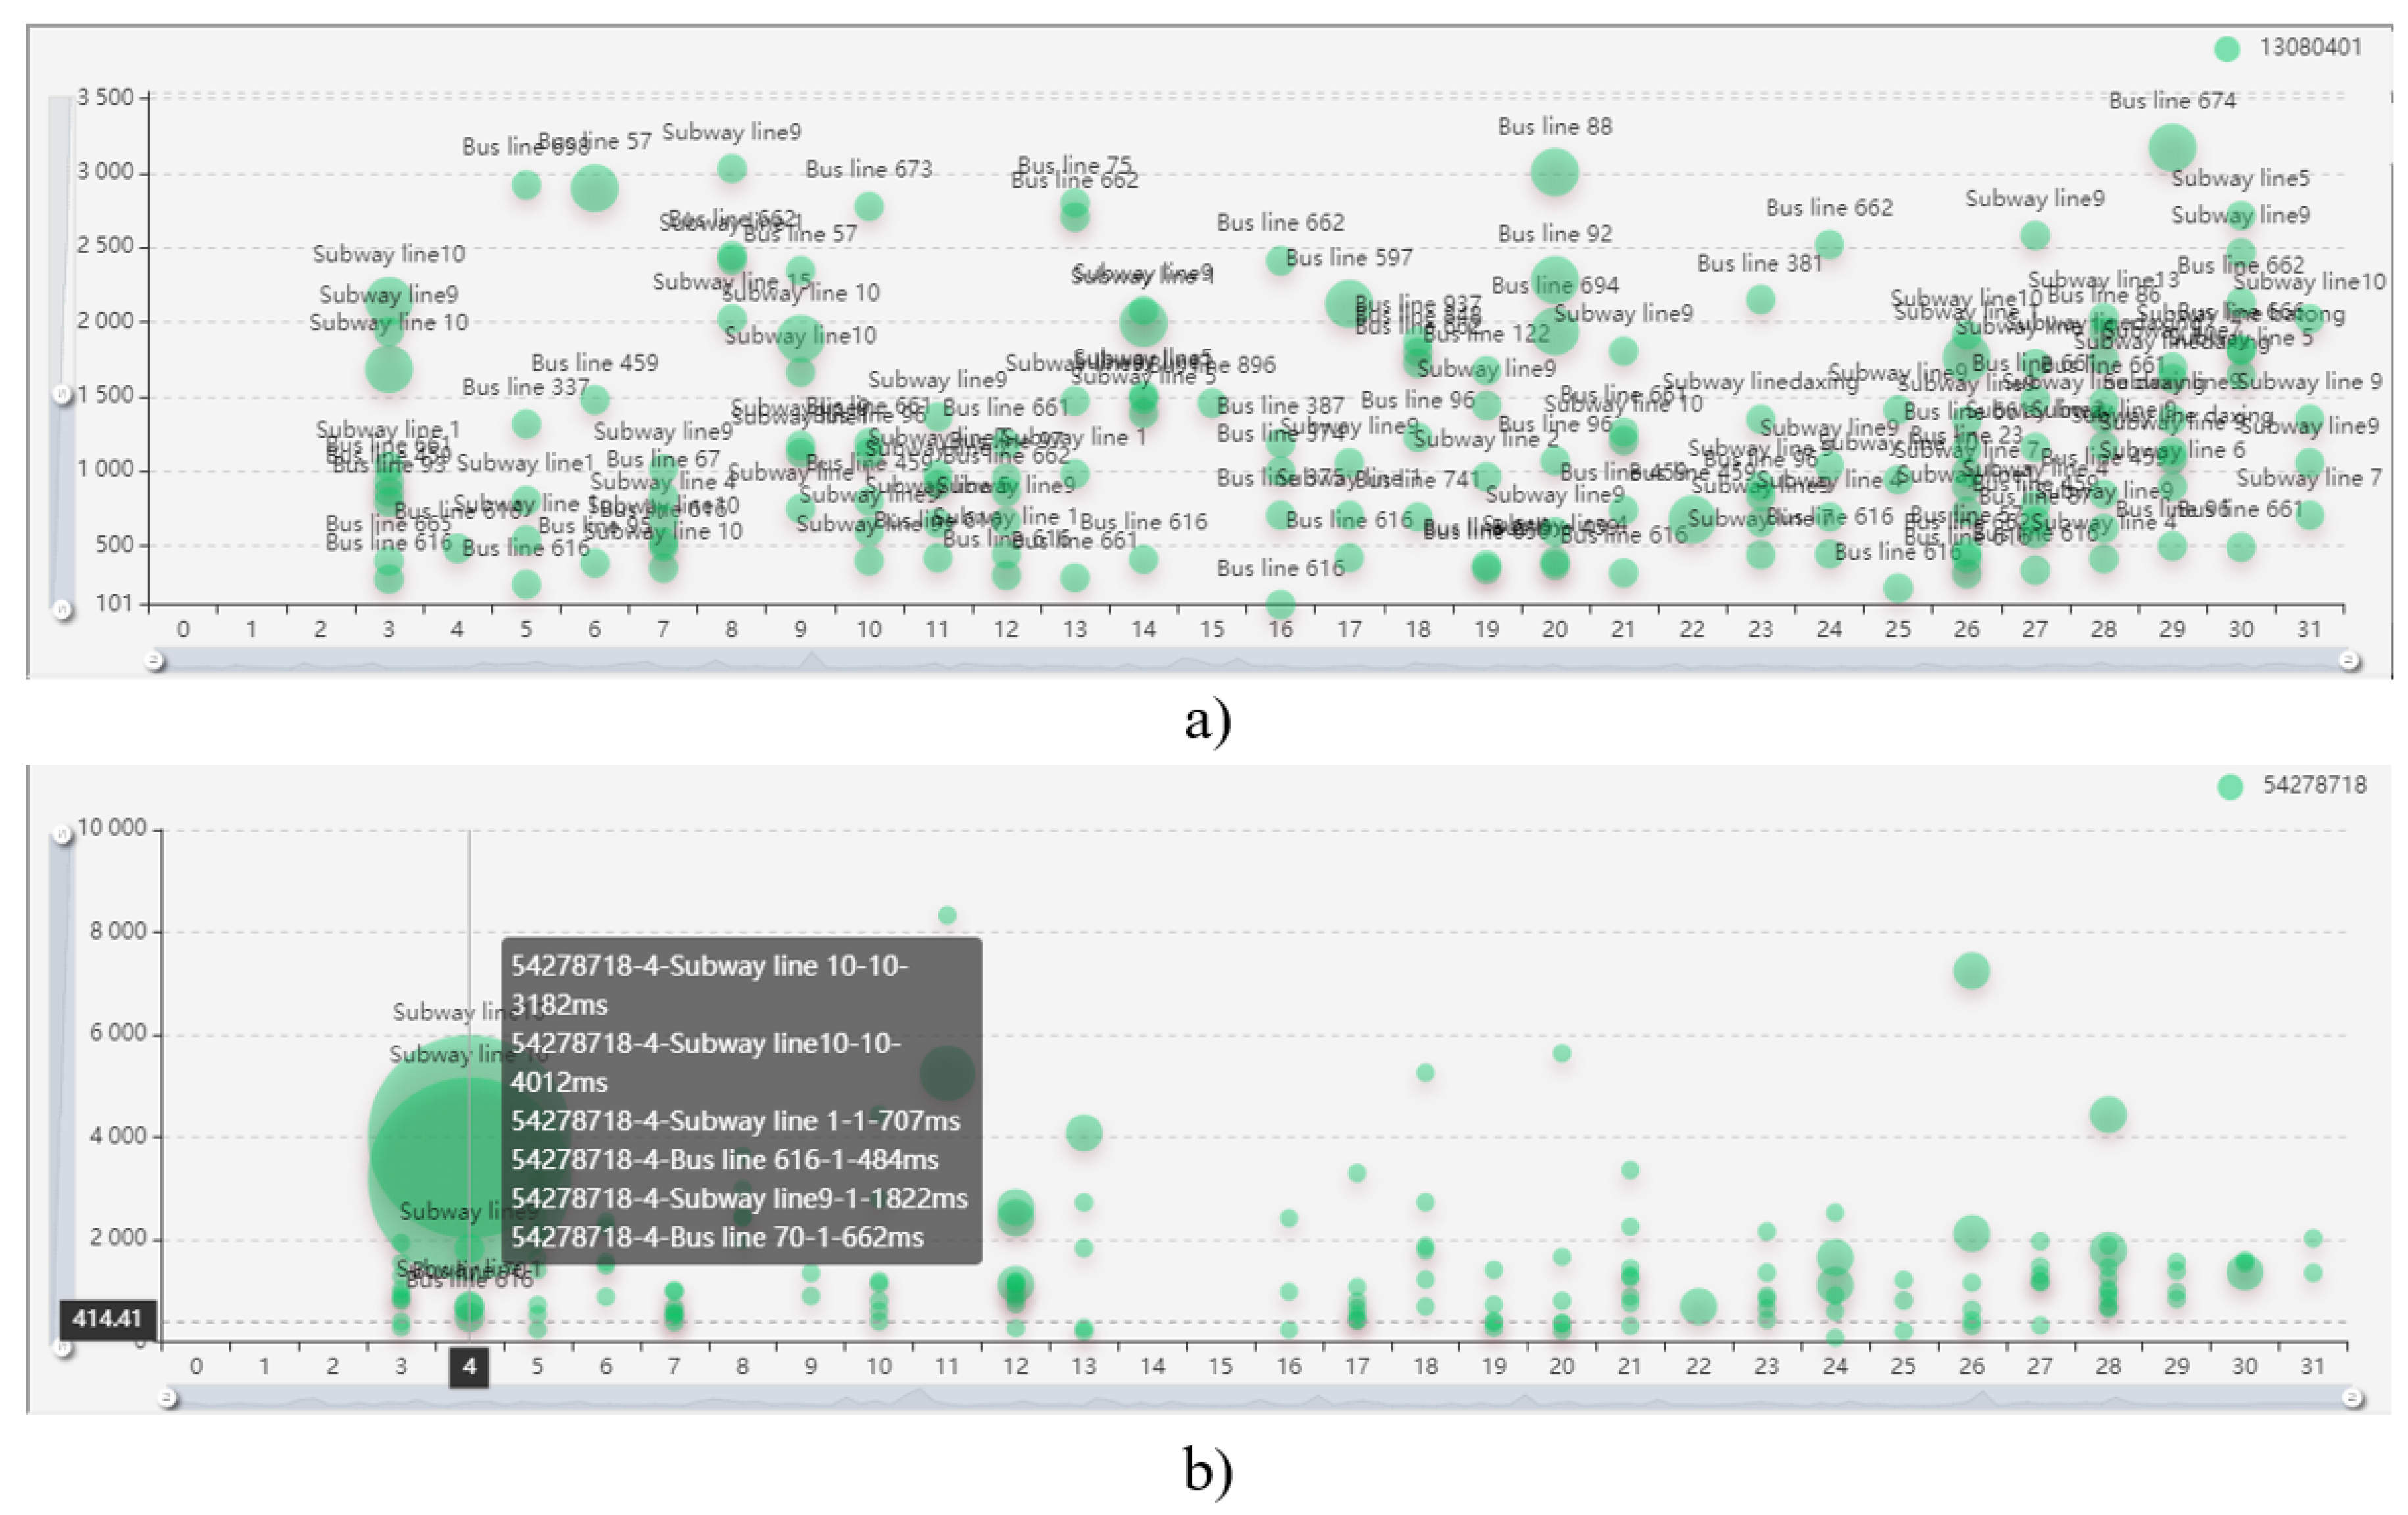
Figure 9. The horizontal axis represents 31 days in August 2015, the vertical axis represents the travel time of the vehicle. The longer the travel time, the higher the bubble. Different colored bubbles represent different passengers, and the size of the bubbles represents the frequency of riding. The more frequent the ride, the larger the bubble.
As shown in
Figure 10, the bubble chart view supports interactive operations such as zooming in, zooming out and moving the visible range. It also supports display or hide bubble by the card number indicator icon in the upper right corner of the view. Hover the mouse over the bubble to display a description of all the trips for the card number of the day: card number-date-vehicle line number-number of rides-ride duration;
Figure 10b shows the situation in which passengers with card numbers 12725195 and 663704040 ride on a transportation.
3.3.5. Passenger 2D Travel Trajectory View
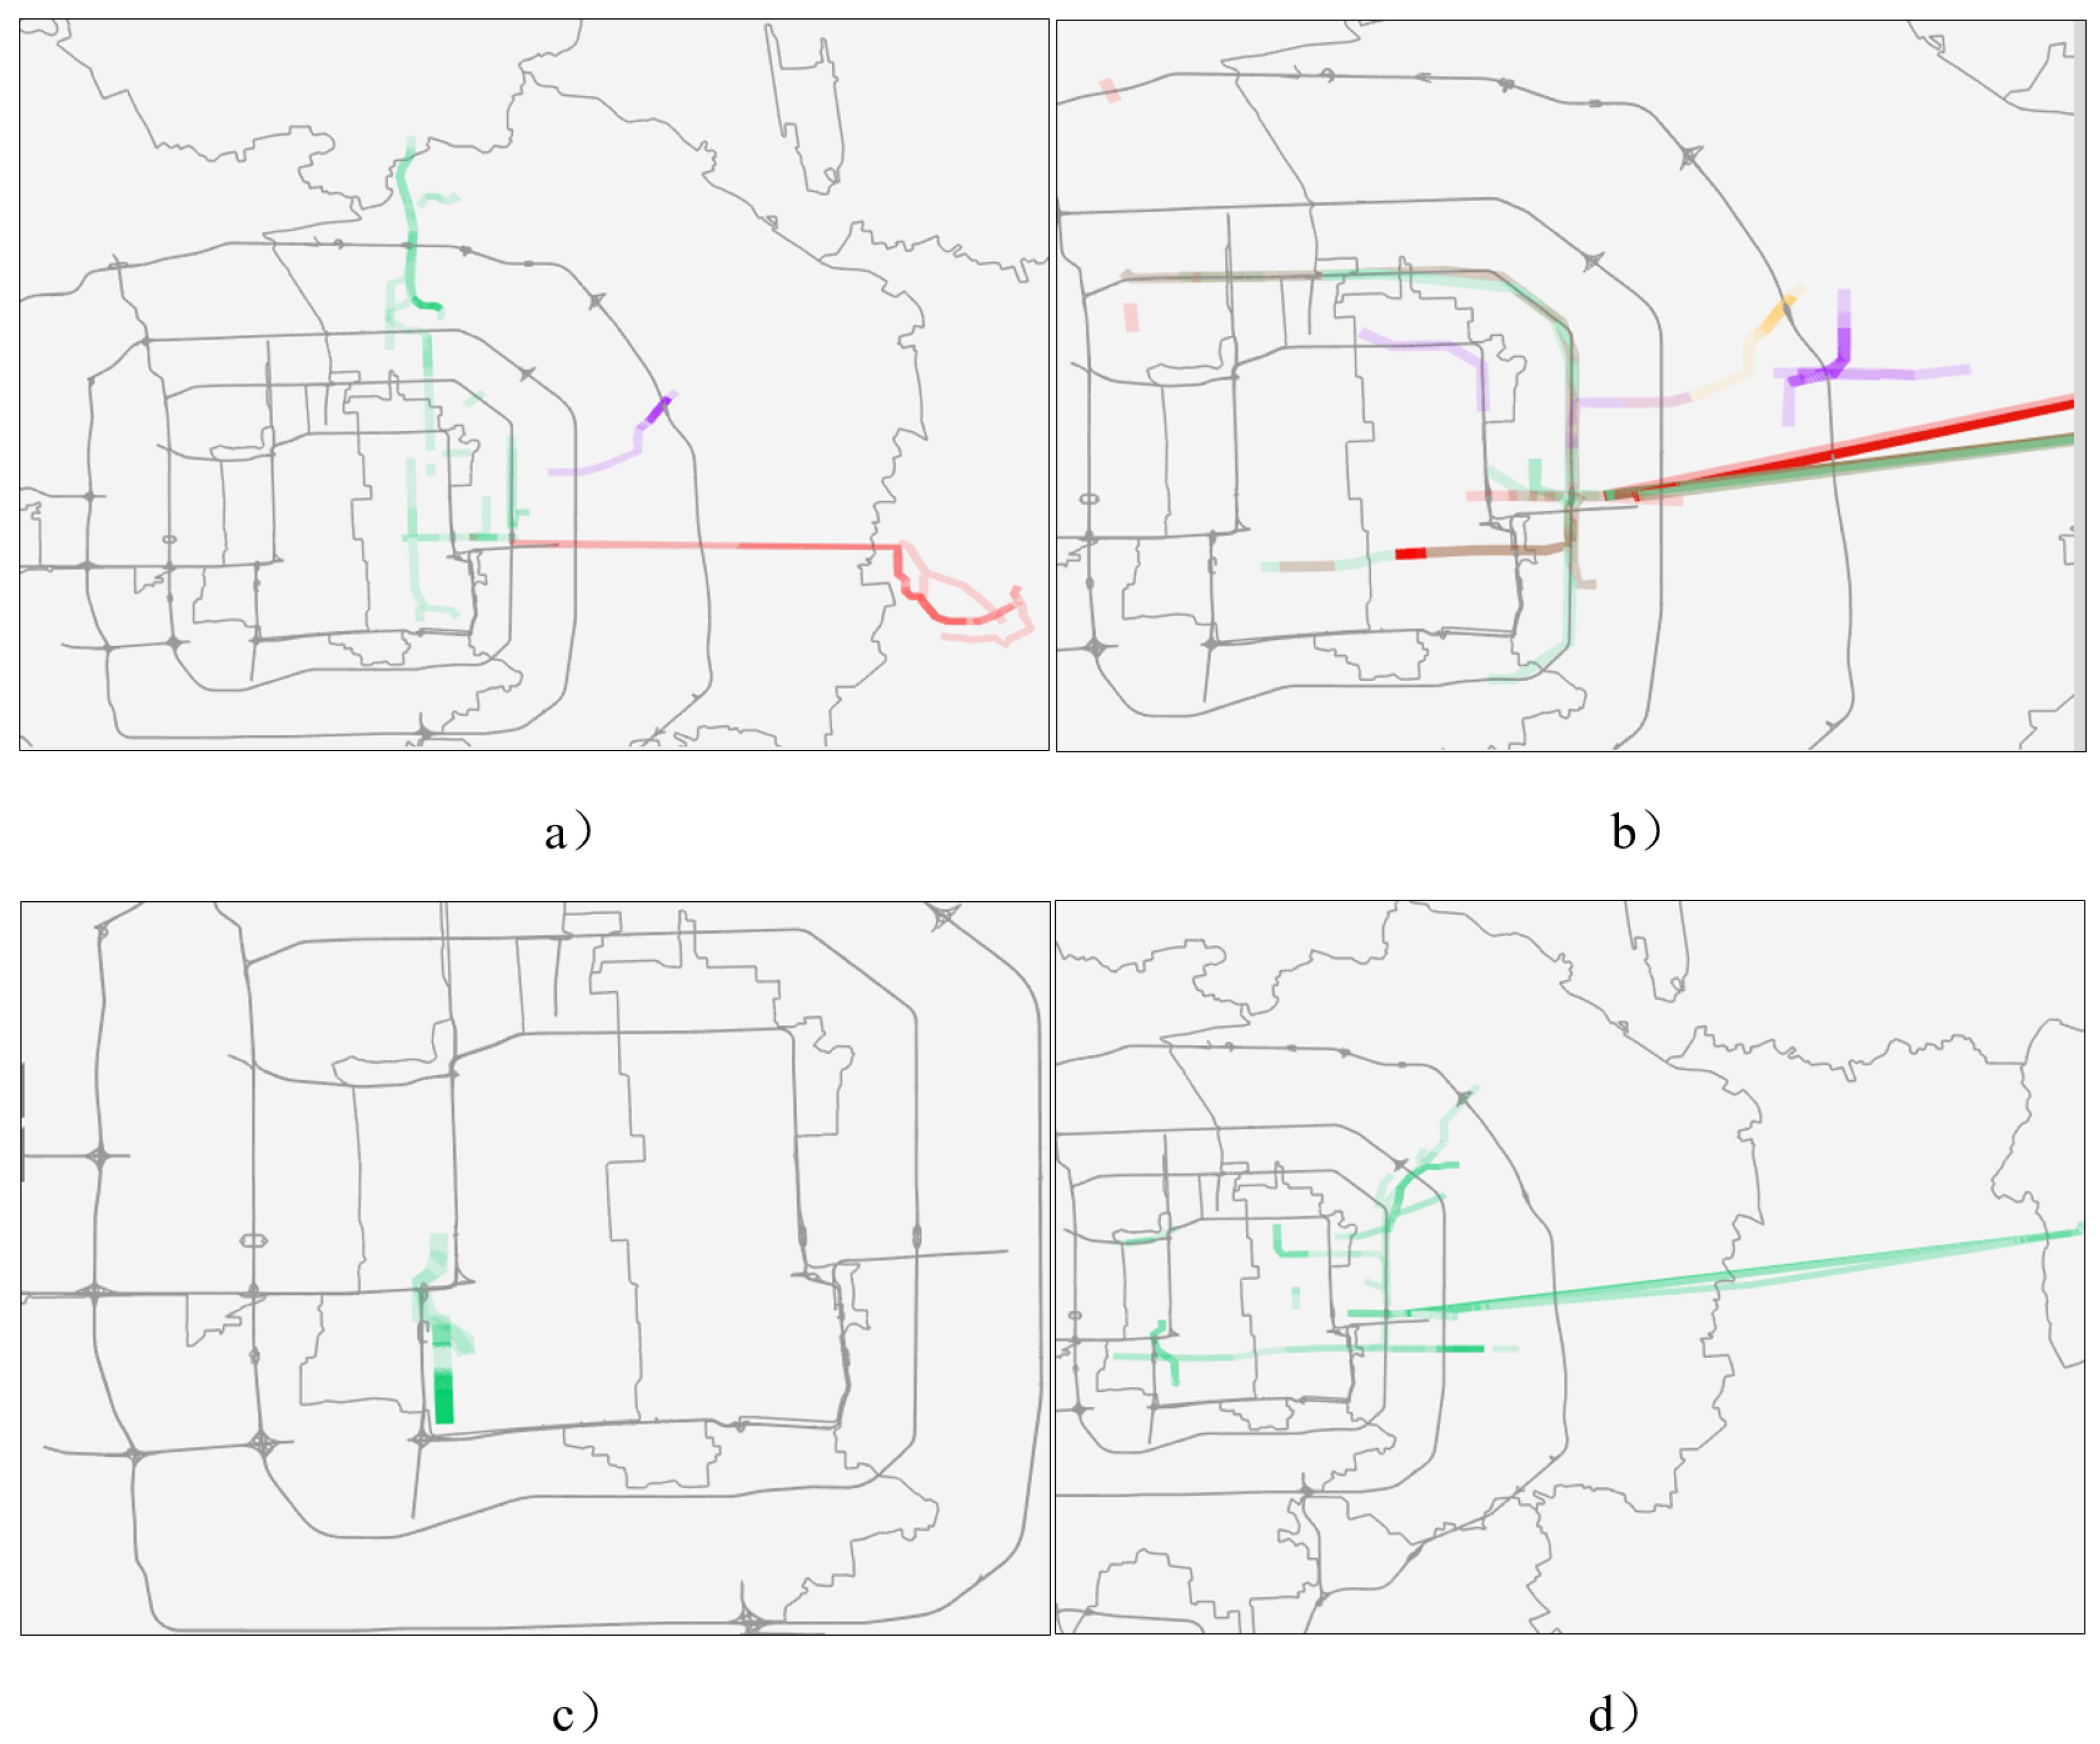
This view is different from the 3D trajectory view, the 2D trajectory is separated from the spatial-temporal characteristics, focusing on the frequency of the specific passenger’s travel trajectory. This view can clearly observe a passenger’s active area, explore the similar situation of passengers traveling. Different colors represent different passengers’ travel, the heat of the trajectory heat map represents the frequency of the trajectory.
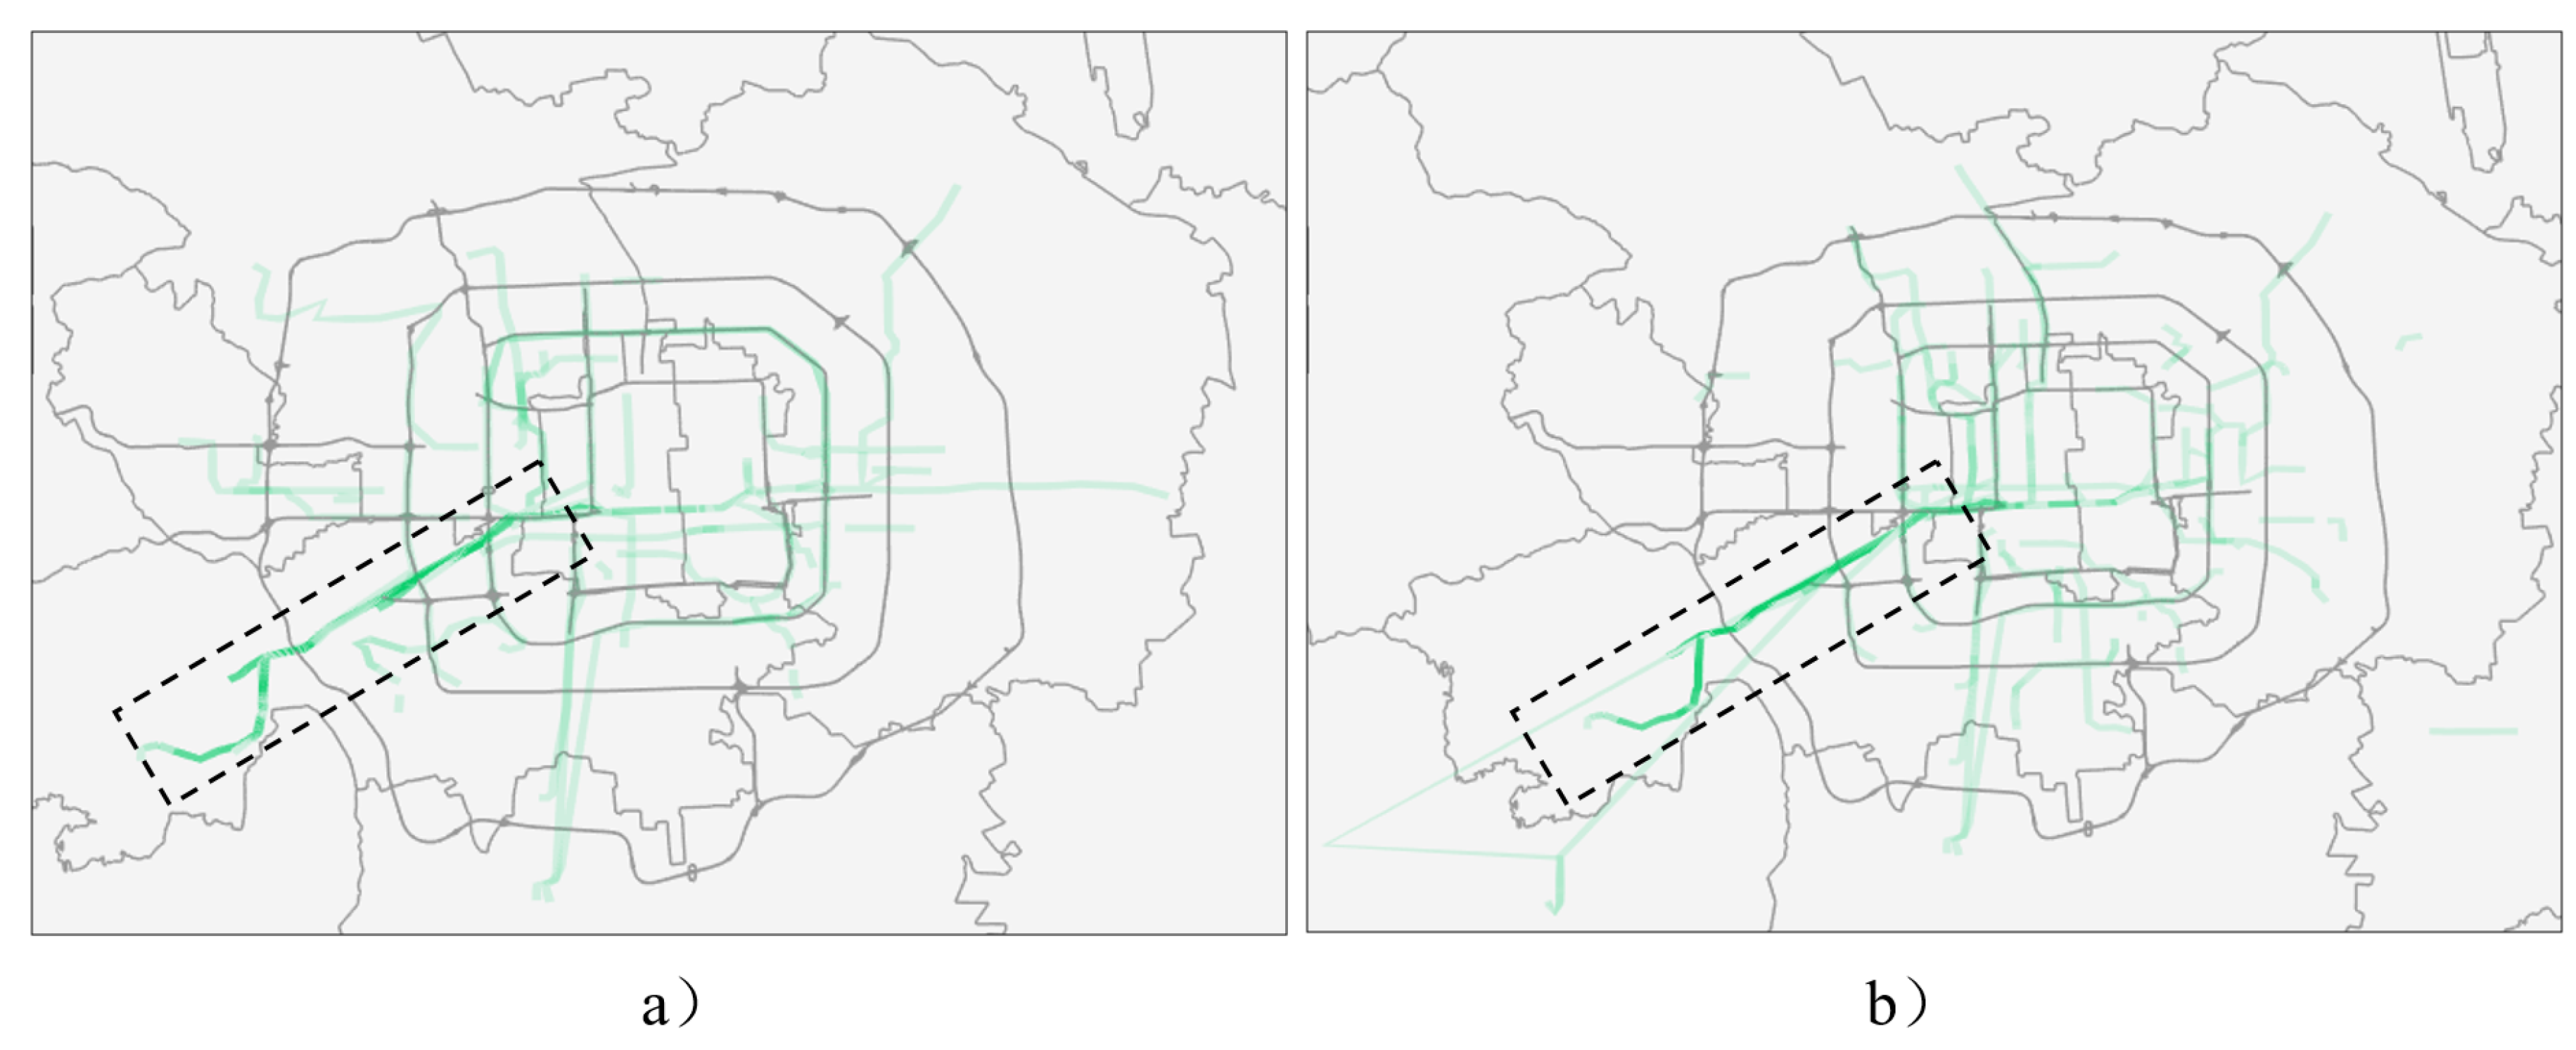
Figure 11a shows the trajectory of three different IC cards, the destination areas of the green and red cards are adjacent, the purple card is a normal card.
Figure 11b shows the overlapping of the red and green card travel trajectories.
Figure 11c,d separately show the distribution of the two dimensional travel trajectory heat map of a normal card and an abnormal card.
4. Experimental Results and Discussion
Our system is divided into front-end and back-end from the system architecture. The front-end is mainly responsible for interactive operations and displaying the results of visual exploration. The front-end part mainly uses HTML, CSS and JavaScript programming languages, and also uses some frameworks such as jQuery.js, D3.js and three.js. The back-end is mainly responsible for data processing and storage. Due to the large amount of data in the data set, we use the Hadoop cluster to complete the tasks of data preprocessing, travel feature extraction, cluster analysis of travel groups and passenger travel correlation analysis, and then save the data into the database. Our Hadoop cluster contains 8 nodes that support large file storage, streaming data access, and can also detect and quickly respond to hardware failures. The back-end part mainly uses Java and Python programming languages.
To verify the effectiveness of our method, we use two real cases to verify the validity of our method. One is the analysis of normal passengers and another is the detection of potential anomalies. We use the Beijing public transport system data from 1 August to 31 August 2015. The data contain more than 100 million pieces of passenger travel information.
4.1. Normal Travel Analysis
The management department analyzes the travel of normal passengers to get the travel rules of normal passengers, and can better serve normal passengers in the public transportation system. More importantly, analyzing passengers who may be associated can determine if they have an association and deduce their relationship.
Most passengers travel with a certain regularity, and there are fixed patterns in travel time distribution and travel area distribution, and also have certain preferences for the choice of travel vehicles. These characteristics can be seen when using our method to analyze normal passengers. By analyzing the travel of normal passengers, it is possible to summarize the travel rules of passengers and find out the association between different passengers. We can deduce their relationship based on the association between passengers.
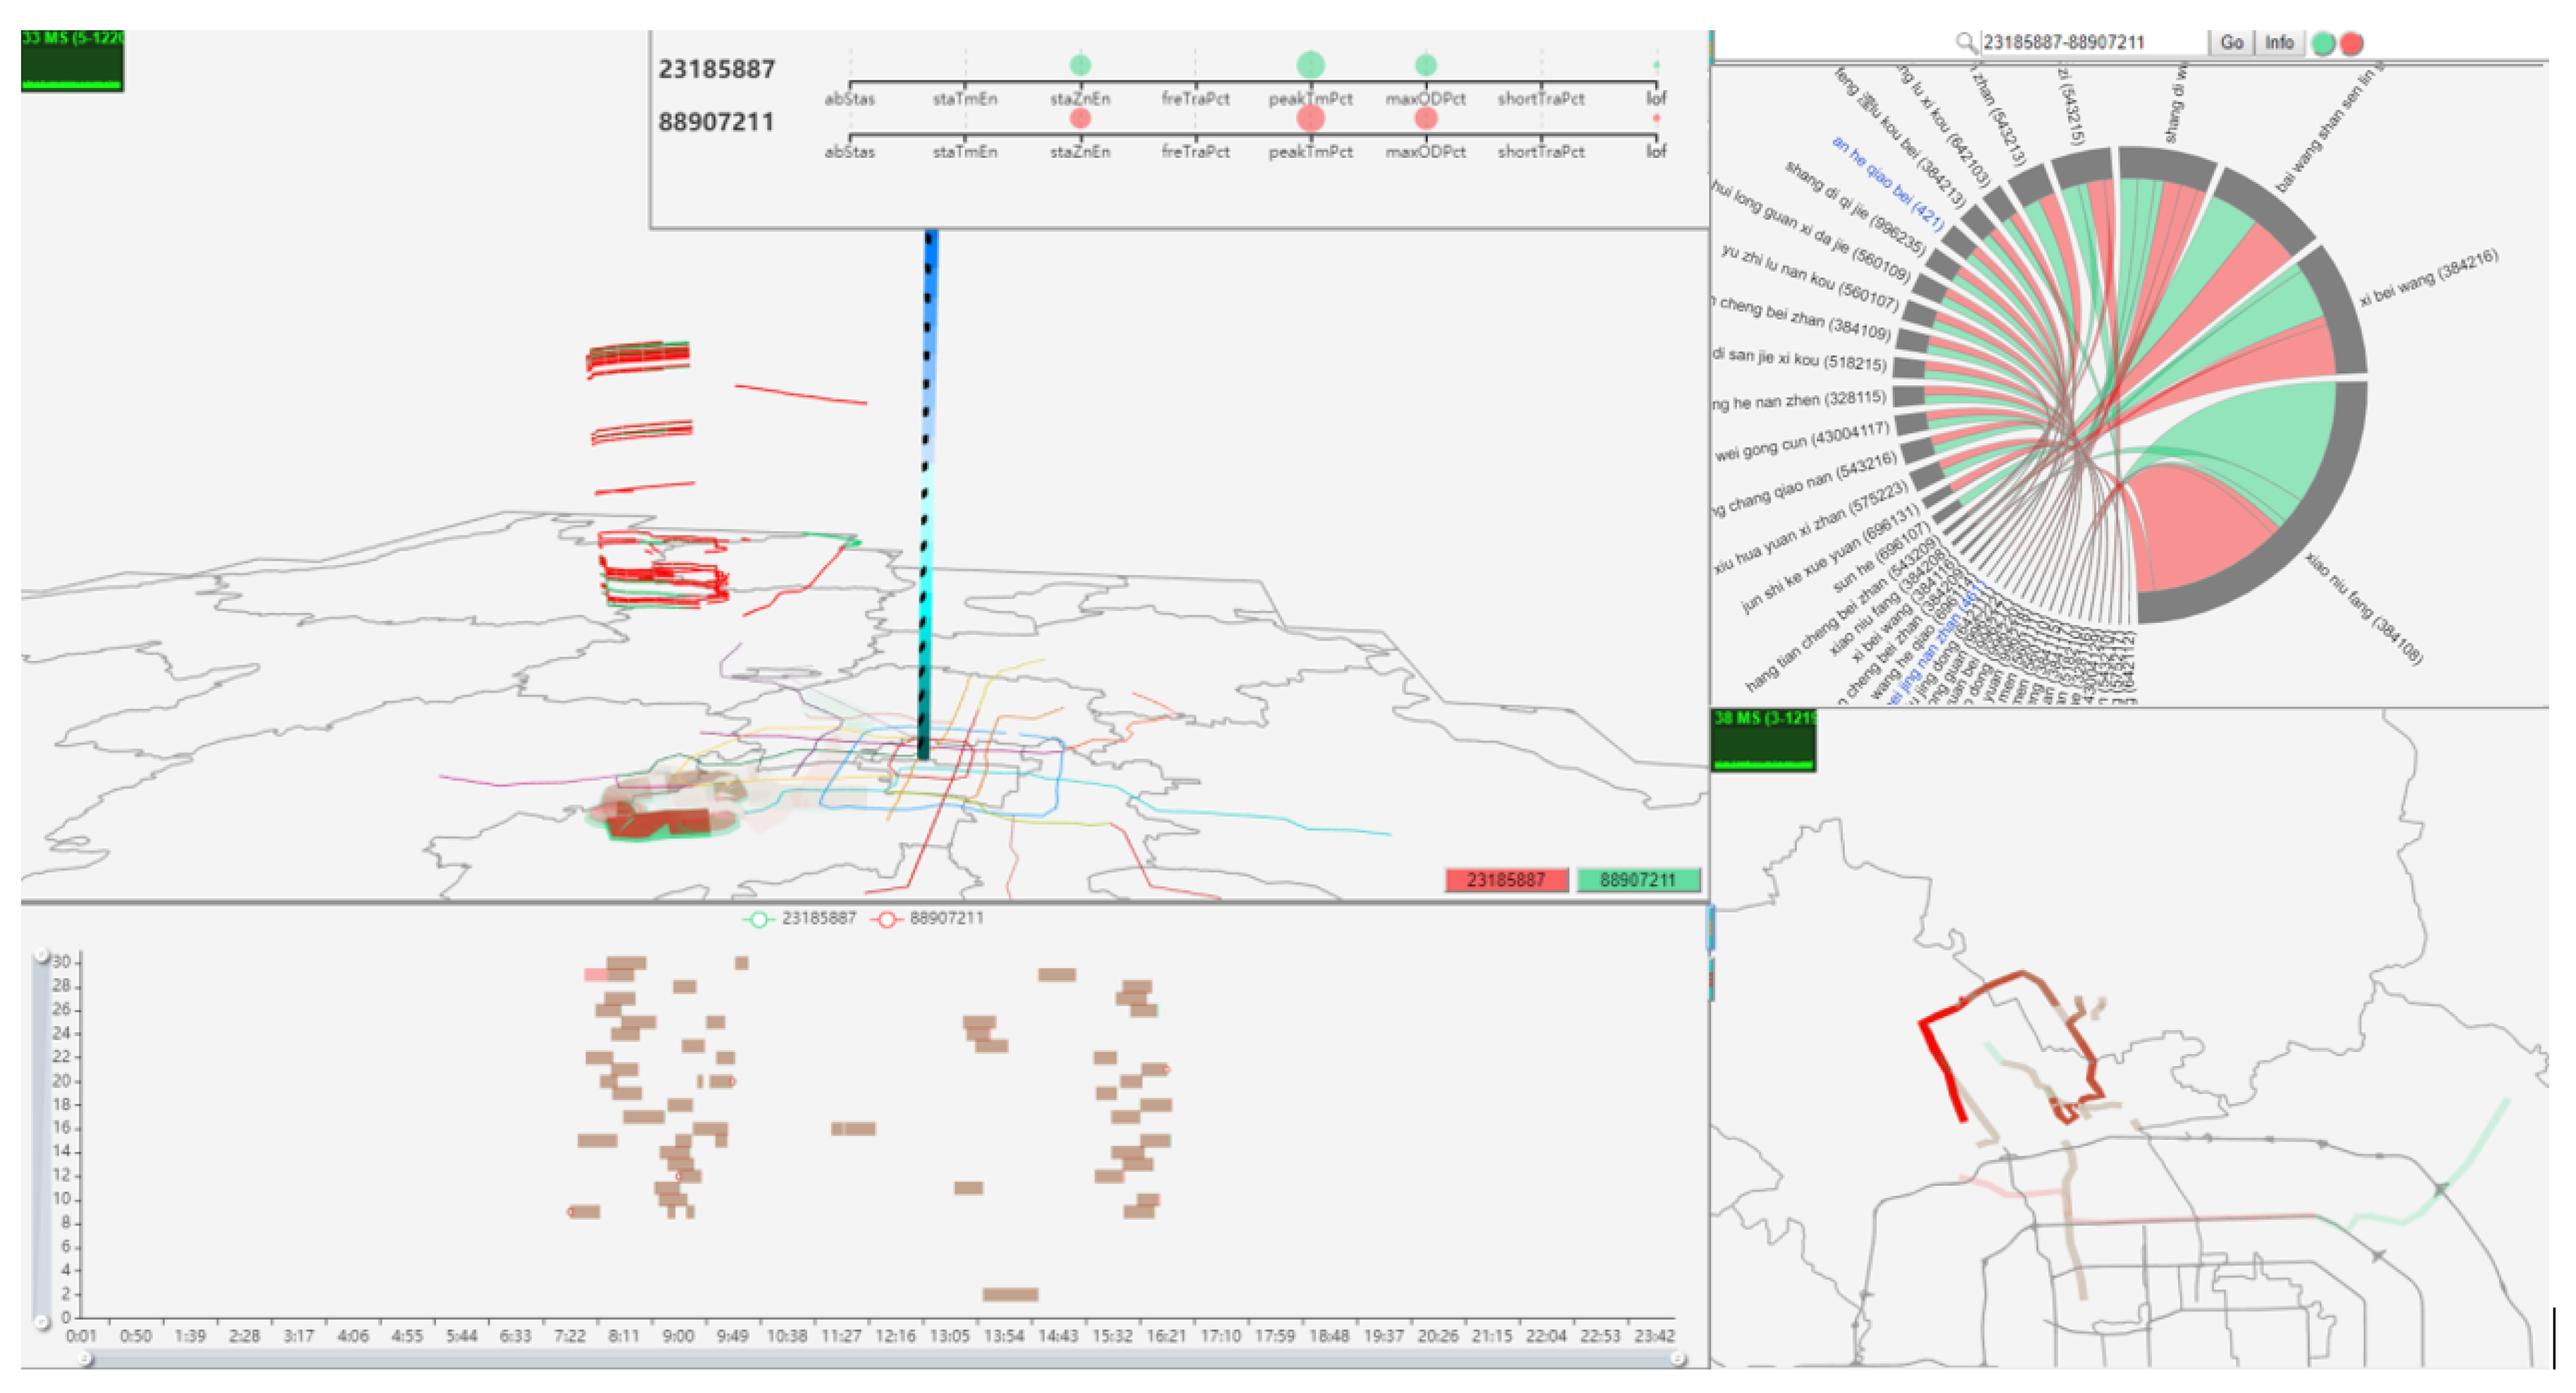
We explored the distribution of passenger travel near Xierqi and found that card numbers 23185887 and 88792712 have the characteristics of infrequent travel, but have the most frequent travel routes. We infer that they may be normal passengers and use our method to explore the association between them to deduce their relationship.
The result is shown in
Figure 12. It shows the travel of two normal cards with card numbers 23185887 and 88792712. It can be visually observed that there are overlaps on the 3D trajectory; their 2D trajectory and the chord view of the entry and exit stations are similar. Their travel time is shown in the brown part of the picture, almost completely overlapping, going out from 7:00 to 8:30 in the morning and returning from 15:00 to 17:00 in the afternoon. It seems that they are not office workers. The initial inference is that they are the elderly who exercised in the morning and afternoon.
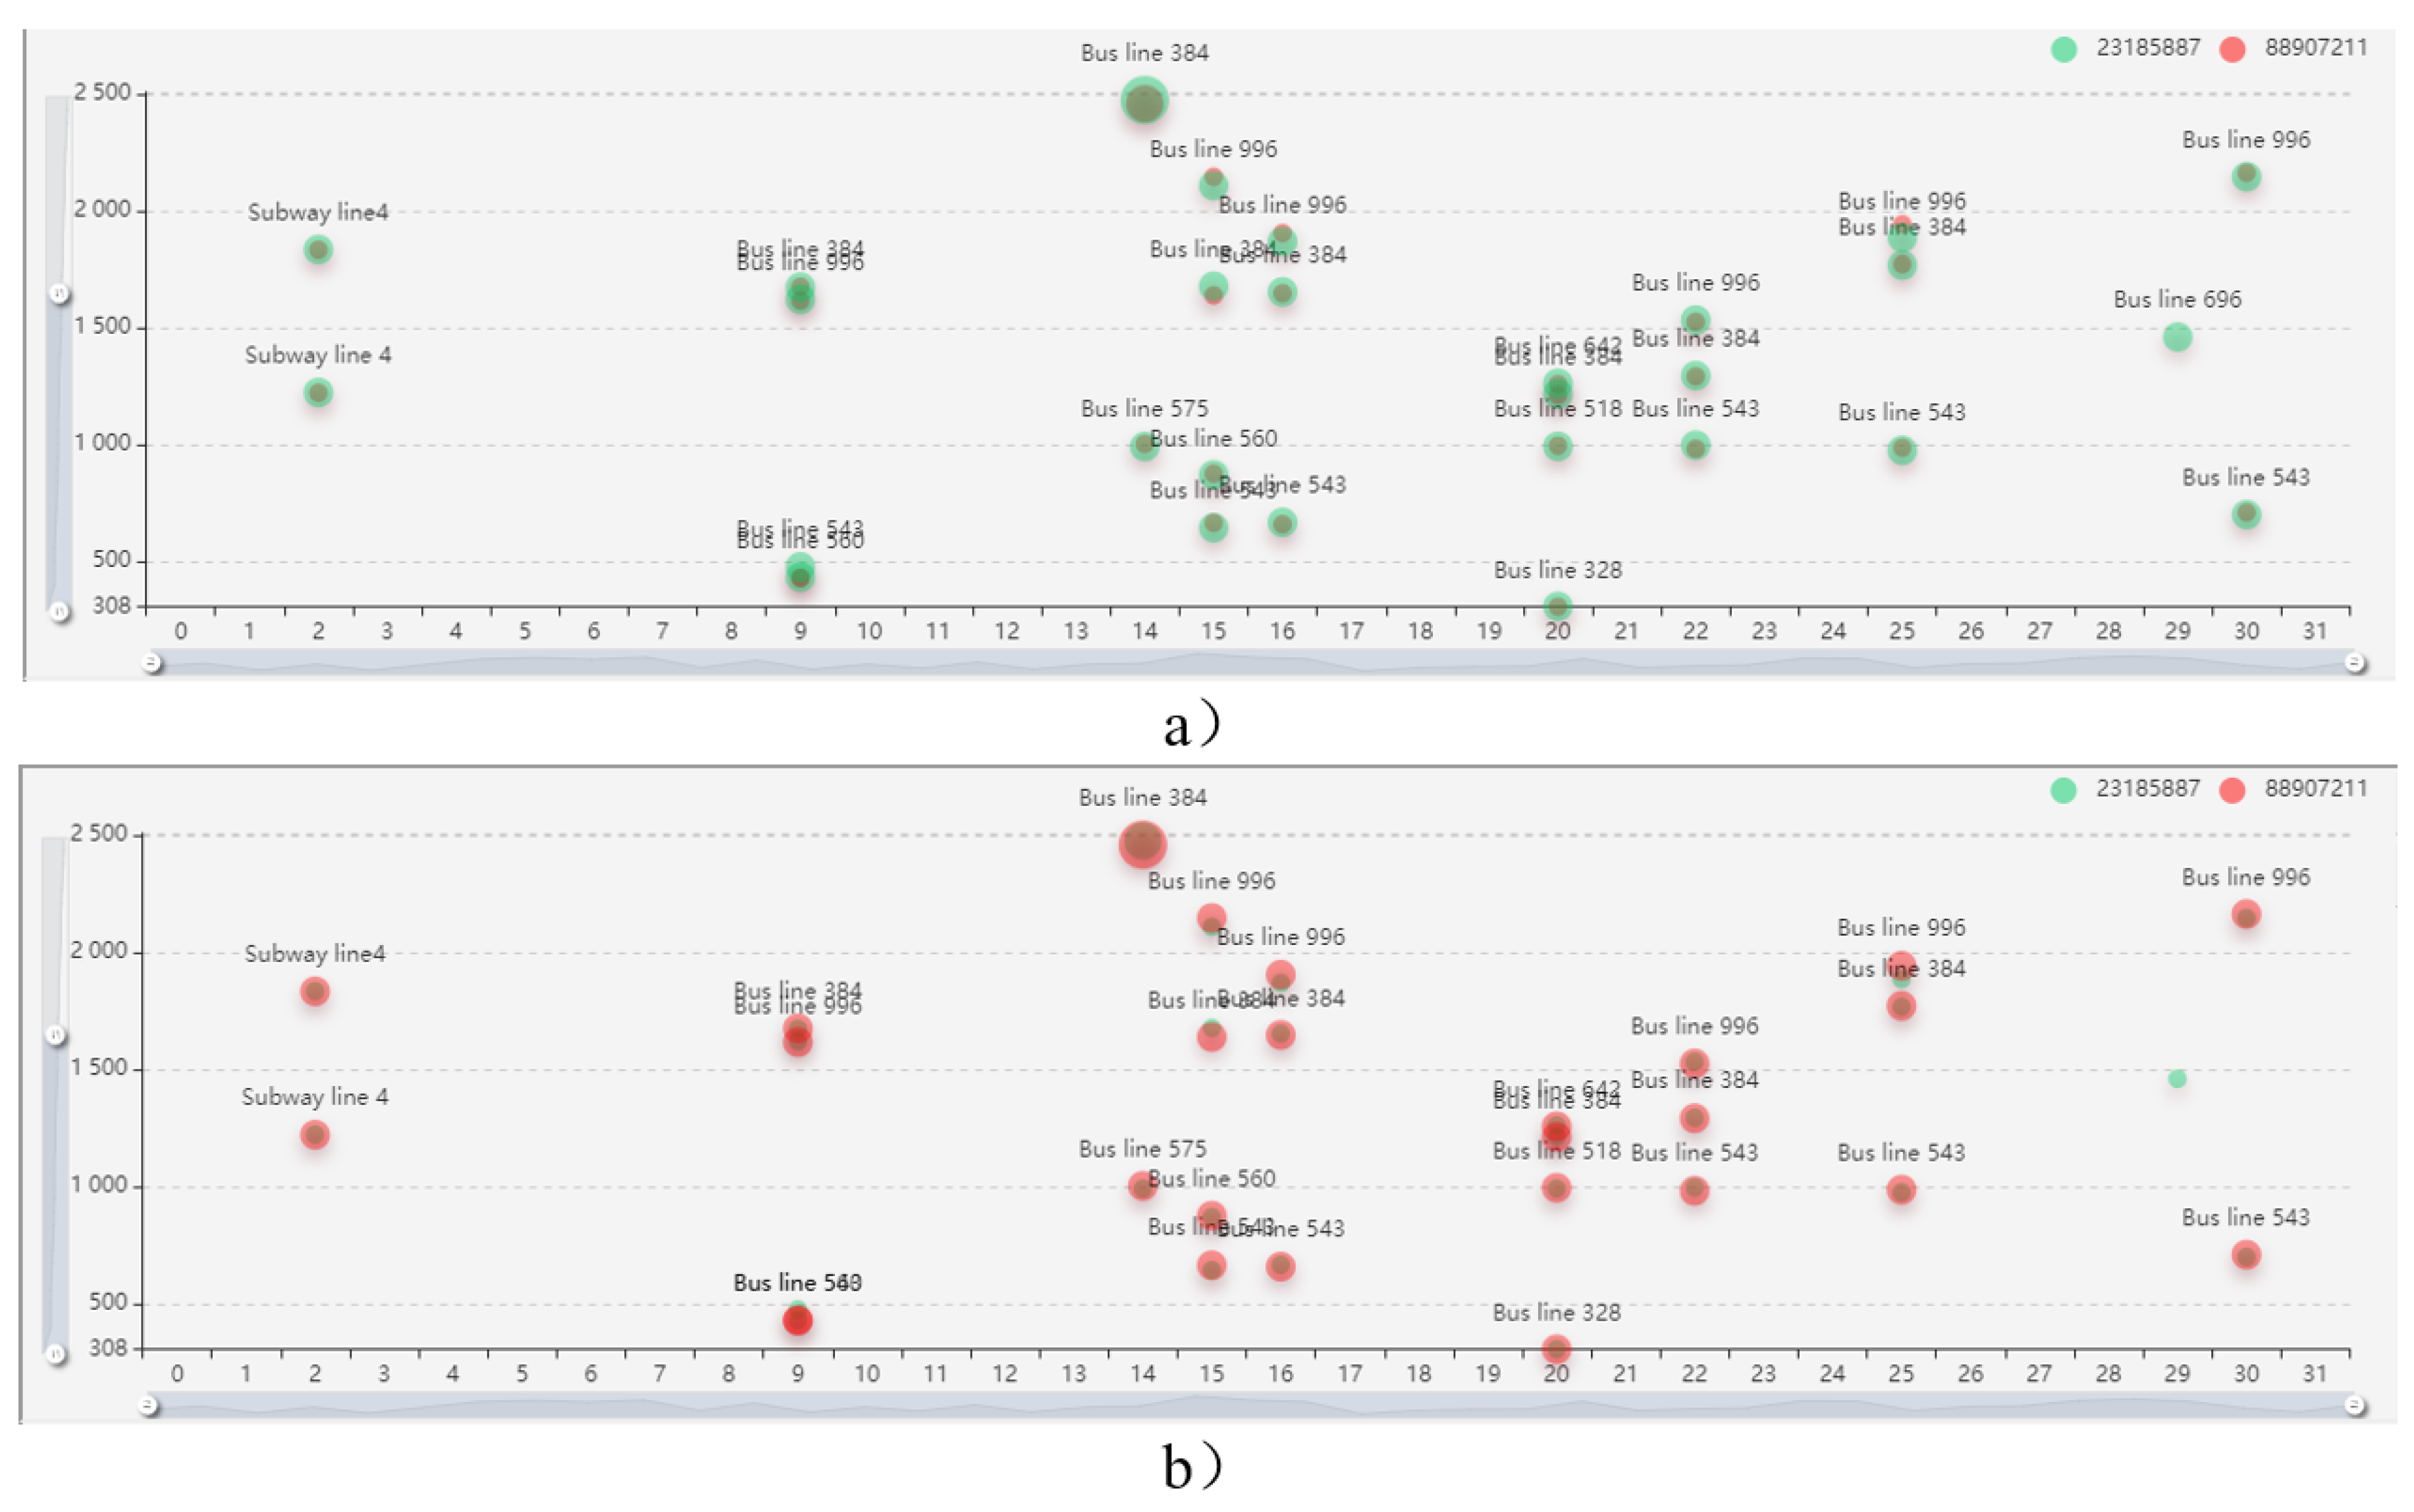
From
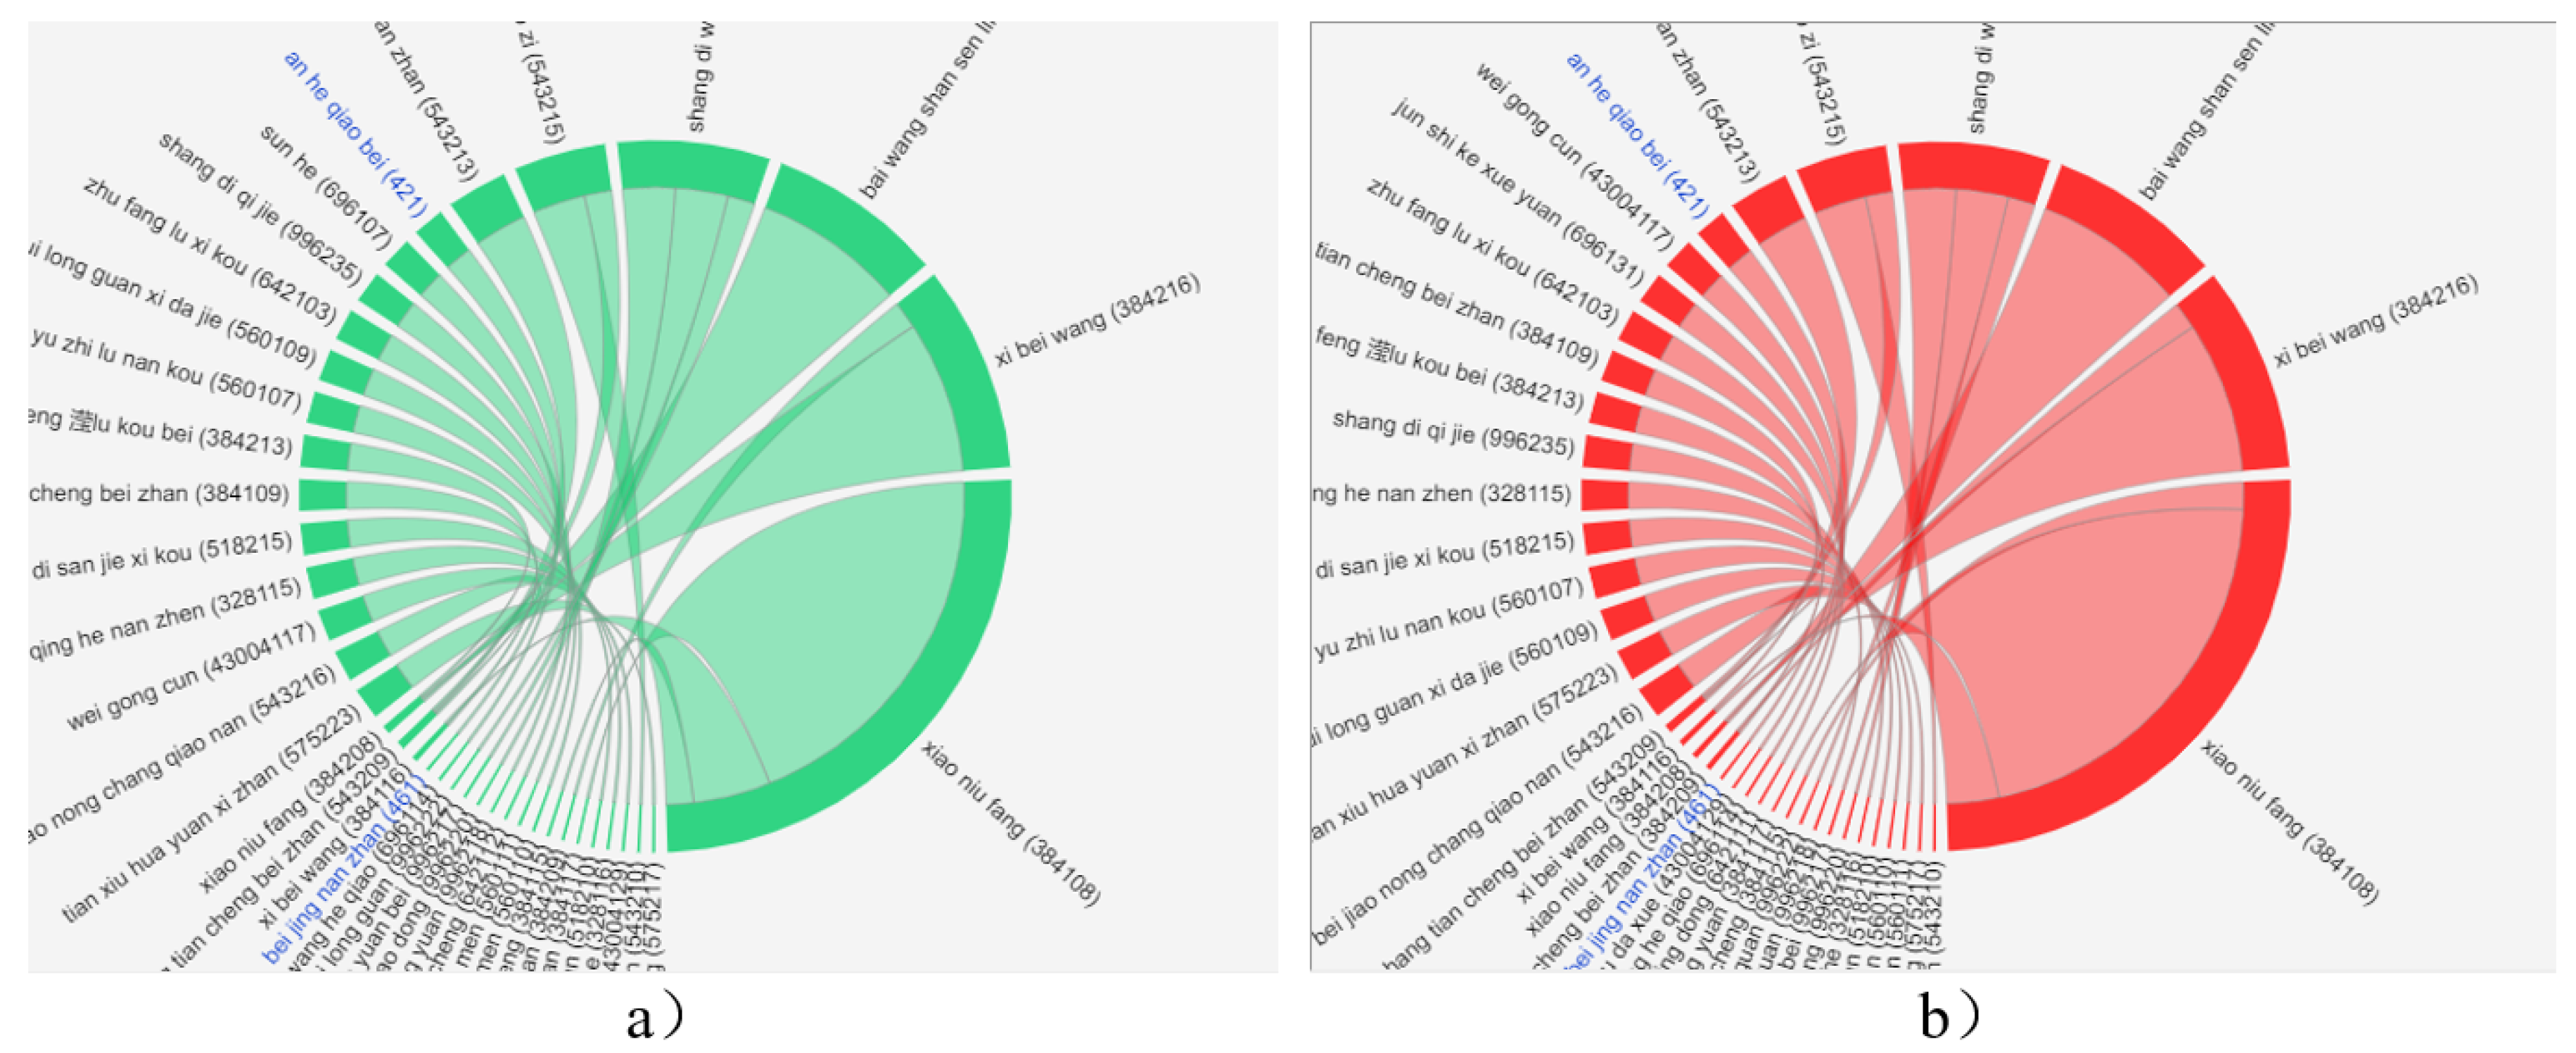
Figure 13, the bubble chart view shows that the card numbers 23185887 and 88907211 have similar preferences in the choice of travel vehicles. They usually travel by bus 384, bus 543, bus 560 and bus 996. Due to the similarity of their travel time, it can be inferred that they are likely to be passengers traveling together every day, maybe friends living in the same community, or maybe a couple. Further analysis of the distribution of entry station and exit station of the two cards, as shown in
Figure 14, found that their travel stations are almost the same, the most frequent route taken is bus 384 from Xiaoniufang to Forest Park and from Forest Park back to Xiaoniufang. Therefore, we can be sure that they live near Xiaoniufang and exercise in the forest park every day. It has been verified that the area of the Xiaoniufang does belong to the residential area. This case can verify that our method is very suitable for analyzing the association of normal passengers.
4.2. Potential Anomaly Detection
When the management department has mastered some abnormal passenger information, analyzing the degree of association of these passengers can determine whether they belong to the same group, so that the management department can better maintain public safety and ensure the normal operation of the public transportation system.
Abnormal passenger travel is very different from normal passengers, there is no fixed pattern in travel time distribution and travel area distribution, and the regularity of the vehicles used is chaotic. These characteristics can be seen when using our method to analyze abnormal passengers.
In the public transportation system, thieves often appear. The thief’s target is valuables such as passengers’ mobile phones and wallets. When passengers’ wallets are stolen, the IC cards they put in their wallets are also stolen together. Since the use of an IC card does not require identity verification, and the owner cannot freeze the IC card, a thief who steals the IC card will use it. We can obtain the card number through the identity information of the owner, find out the cards that may be associated with this card by filtering the feature values, analyze the travel information of these cards, determine whether these cardholders belong to the same abnormal group, and deduce the relationship between them. Card number 13080401 was a card lost by a passenger and was identified as an abnormal card. By filtering the feature values, we found that card number 54278818 may be associated with card number 13080401. They are suspected to belong to the same anomalous group. We use our system to determine if they belong to the same group. Through analysis, we can determine whether the two cards are abnormal cards and determine whether they are associated cards. It can be seen from the 3D trajectory that their travel is irregular and there is no way to know the specific situation. To further explore suspicious anomaly cards, we explore the travel of card numbers 13080401 and 54278818 using our method. Since these two cards appear at many stations, it is difficult to display them in the same chord view, they are explored separately.
As shown in
Figure 15, from the feature value of two cards, it can be seen that the card number 13080401 and the card number 54278718 have similarities. From the
value, the card number 54278818 has a higher probability of abnormality than the card number 130800401, it can be initially determined that they are abnormal cards.
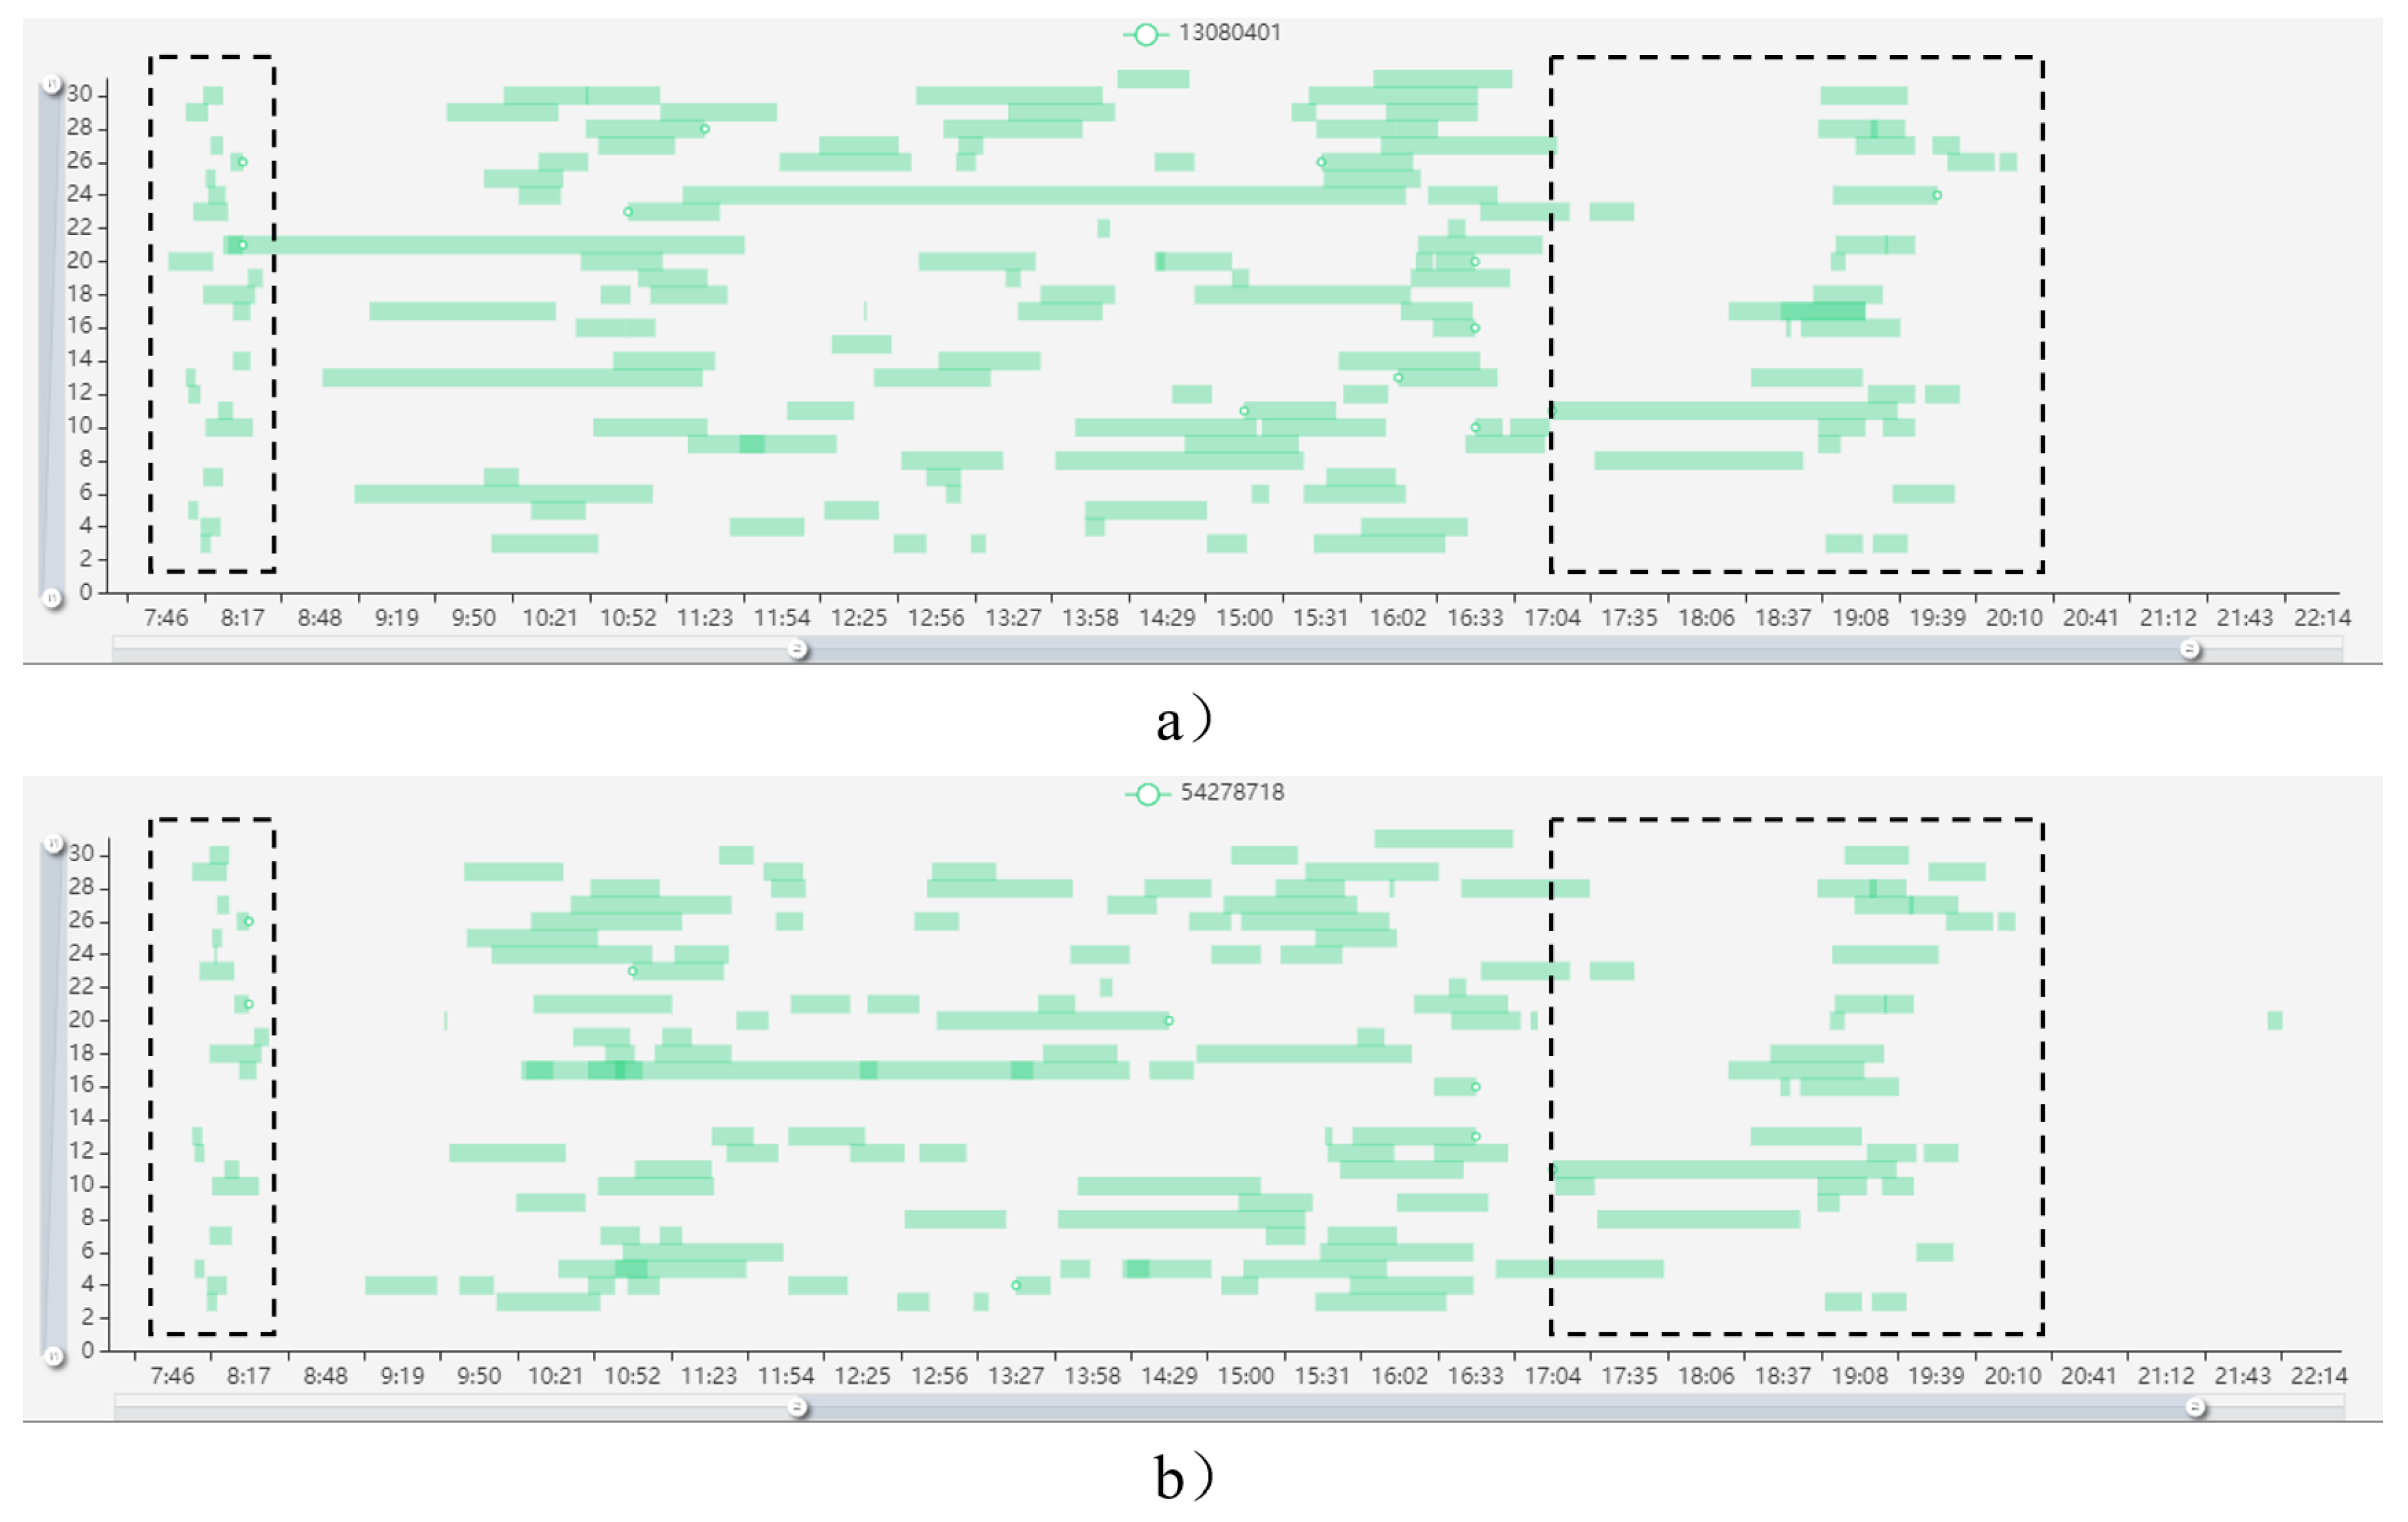
As shown in
Figure 16 and
Figure 17, both cards have similar travel characteristics in both travel time and travel trajectory. As shown in the pixel matrix view, both of them going out from 7:30 to 8:30 in the morning and back home from 17:00 to 20:00 in the evening. It can be seen that their travel time is regular in the morning and evening. Although there is a small amount of time distribution in the intermediate time period, most travel time distributions are very similar and they have the characteristics of travel time dispersion. From the two dimensional trajectory, their trajectories are very similar, including the degree of chaos of the trajectory and the heat of trajectory travel. It can be concluded that the dotted line is the trip they leave from home in the morning and return home in the evening. We can guess that the two passengers are doing some irregular activities, such as begging, stealing, and so forth.
There are a lot of entry stations and exit stations for these two cards, as shown in the passenger origin-destination chord view. It can be found that they have two stations with a higher frequency of visits: Beijing West Railway Station and Beijing West Railway Station South Square Bus Station. Beijing West Railway Station belongs to the hotspot of abnormal activity.
As shown in
Figure 18a,b, the ratio of entry of the two stations is 2.72% and 9.52%, the ratio of exit of the two stations is 14.29% and 9.52%. In the Beijing West Railway Station area, the total ratio of public transportation entry and exit is 12.24% and 23.81%. It can be judged that although these two cards have visited Huoying or Lishuiqiao, they have frequent activities near Beijing West Railway Station.When a card is an abnormal card, it will also be reflected in the origin-destination chord view, as shown in
Figure 18c.
From the travel vehicle bubble view, we can also see some clues. In
Figure 19b, there is a bubble in the bubble view of the travel number 52427718. It can be found that the passenger took subway line 10 about 20 times on 4 August. This behavior is very suspicious and consistent with the characteristics of abnormal behavior. This is the place where 54278818 is more unusual than 130800401. In addition, the vehicle selection with card number 130800401 is confusing, with no rules, which is consistent with the travel characteristics of abnormal behavior, as shown in
Figure 19a.
In summary, it can be concluded that they are most likely to be the abnormal passengers active near Beijing West Railway Station and have been to Huoying and Lishuiqiao. This case can verify that our method is very effective in potential abnormality detection.
5. Conclusions and Future Work
This paper proposes a multi-view interactive visual analytics method for travel of specific IC cards. It provides a method of visually analyzing the travel of passengers, allows interactive visual exploration of passenger travel at different angles, such as trajectory, time of travel, and vehicles that have been taken. More importantly, it is possible to explore the association of passengers and deduce the relationship of passengers. Based on the Beijing public transportation system data, we present two cases, which analyze the travel of normal passengers and abnormal passengers respectively, determine the association between them, and deduce their relationship. Experimental results verify the effectiveness of our method. In addition, our method can be used in many fields. It can be used in public transportation management to help management departments analyze passenger travel patterns, formulate more scientific plans, better schedule public transportation, and provide better services to passengers. It can also be directly applied in the field of criminal investigation, using the travel information of a criminal to dig out the passengers associated with him, so as to find his partner and arrest the entire criminal gang. It can also be extended to commercial applications. By analyzing the travel information of passengers and the association between passengers, it can infer the hotspots of passengers and the number of people traveling together to determine the needs of shared travel, such as carpooling and bicycle sharing.
This paper provides a visualization tool combined with data mining technology to analyze the association between passengers, but it also has some limitations. The passenger 3D travel trajectory view uses the 3D visualization method. Therefore, it takes a long time to draw a large number of trajectories, so that it takes a while to wait. In future work, we will optimize algorithms, improve operational efficiency, and combine our system with artificial intelligence technology to make our method more automated and intelligent, so as to obtain more accurate analysis results more conveniently and quickly.
