1. Introduction
The ability of a device to interact with biological systems is often driven by the surface chemistry and topography. Therefore, technologies that enhance the adhesion, growth, and interaction of living cells on various device surfaces of pivotal importance. Plasma treatment of surfaces is one of the core technologies used to alter surface chemistry and provides the bulk of the surfaces used in cell culture ware [
1]. Using either vacuum plasma systems or cold atmospheric pressure plasma treatments creates a range of hydrophilic surface finishes that enhance cell adhesion [
2,
3,
4]. Cold atmospheric plasma systems offer a number of advantages including in line manufacturing capability, rapid treatment, flexible scaling, and low maintenance requirements and these systems are compatible with a range of different polymer substrates [
5,
6]. In biological applications, the use of a nonthermal plasma can also allow the disinfection of surfaces without chemical additives or high temperatures [
7,
8,
9]. The use of low temperature vacuum plasma devices to deposit carbonyl, carboxyl, and amine functionalities onto nonreactive hydrophobic surfaces is now a well-established industrial practice and underpins the biocompatibility of disposable plastic plates, flasks, and bottles of the cell culture market [
1,
10]. Despite the ubiquitous nature of these tissue culture treatment surfaces, there are still significant differences observed between various commercial surface treatments [
11,
12] and the simple carbonyl, amine, and carboxylic acid functionalities deposited on the surface do not fully replicate the complex interfaces found in vivo. These differences have driven advances to deposit larger, more complex molecules onto device surfaces. While higher energy plasma devices can be used to deposit thick layers of biocompatible ceramics such as hydroxyapatite [
13], these techniques have limited applicability to temperature sensitive surfaces and cannot be used to apply proteins or polysaccharide layers.
In order to overcome this limitation, a range of protein coatings and application approaches have been developed to further improve the biocompatibility and functionality of cell culture surfaces. These coatings are traditionally applied using well-established multistep protocols [
14,
15]. The first step is often the creation of reactive sites on the substrate surface using a plasma treatment similar to those used in cell culture ware [
16,
17,
18]. Aseptic wet chemical techniques are then used to apply the target biomolecule as a thin aqueous layer on the surface and the materials are then incubated for 1–24 h under laminar flow hoods. The excess liquid is then carefully extracted without scratching the surface and various washing or fixing steps then follow. In some instances, linker chemicals can be used to selectively tether biomolecules to the target surface [
19]. These techniques allow for the attachment of collagen, fibronectin, laminin, and other materials to plastic, glass, or ceramic cell culture ware. Similar technology is also used to attach enzymes and antibodies to various surfaces for biosensor and diagnostic applications [
20]. The overall multistep coating processes are complex, labor intensive, and require complex aseptic manufacturing lines.
Recent developments in plasma chemistry have shown that nonthermal helium plasma sources operating at atmospheric pressure can be used to deposit large functional molecules on to various surfaces in a single step [
21,
22,
23]. This opens the door to a range of surface modification options that are rapid, scalable, and economical while also retaining functional chemistry. BioDep is a recently developed single step, cold plasma process to deposit various biomolecule coatings onto surfaces [
24,
25]. The technique uses a low energy plasma of inert gas to simultaneously activate both the target surface and a stream of aerosol particles that contain the biomolecule of interest as it passes through the plasma. As the activated aerosol droplets contact the target surface, the biomolecules contained within are deposited as a dry, coagulated coating. By controlling the applied power and time spent in the plasma, the interaction of the biomolecule with the plasma can be adjusted to maximize coating adhesion and minimize any unwanted denaturation [
24]. A pervious study suggested that this process could be used to apply protein layers onto microplates for cell culture applications. That preliminary study suggested that the deposited layer contained chemically intact layers of protein [
25]. In this study, collagen layers were applied onto 6-well microplates and the properties of the deposits were compared to those achieved by traditional wet chemical deposition techniques. The structure and integrity of the protein coatings are probed in detail using a combination of electrochemical, surface science, and biological techniques in order to determine if the collagen is structurally altered by the plasma treatment and the potential of the plasma process to replace traditional laboratory-based microplate coating techniques is examined.
2. Materials and Methods
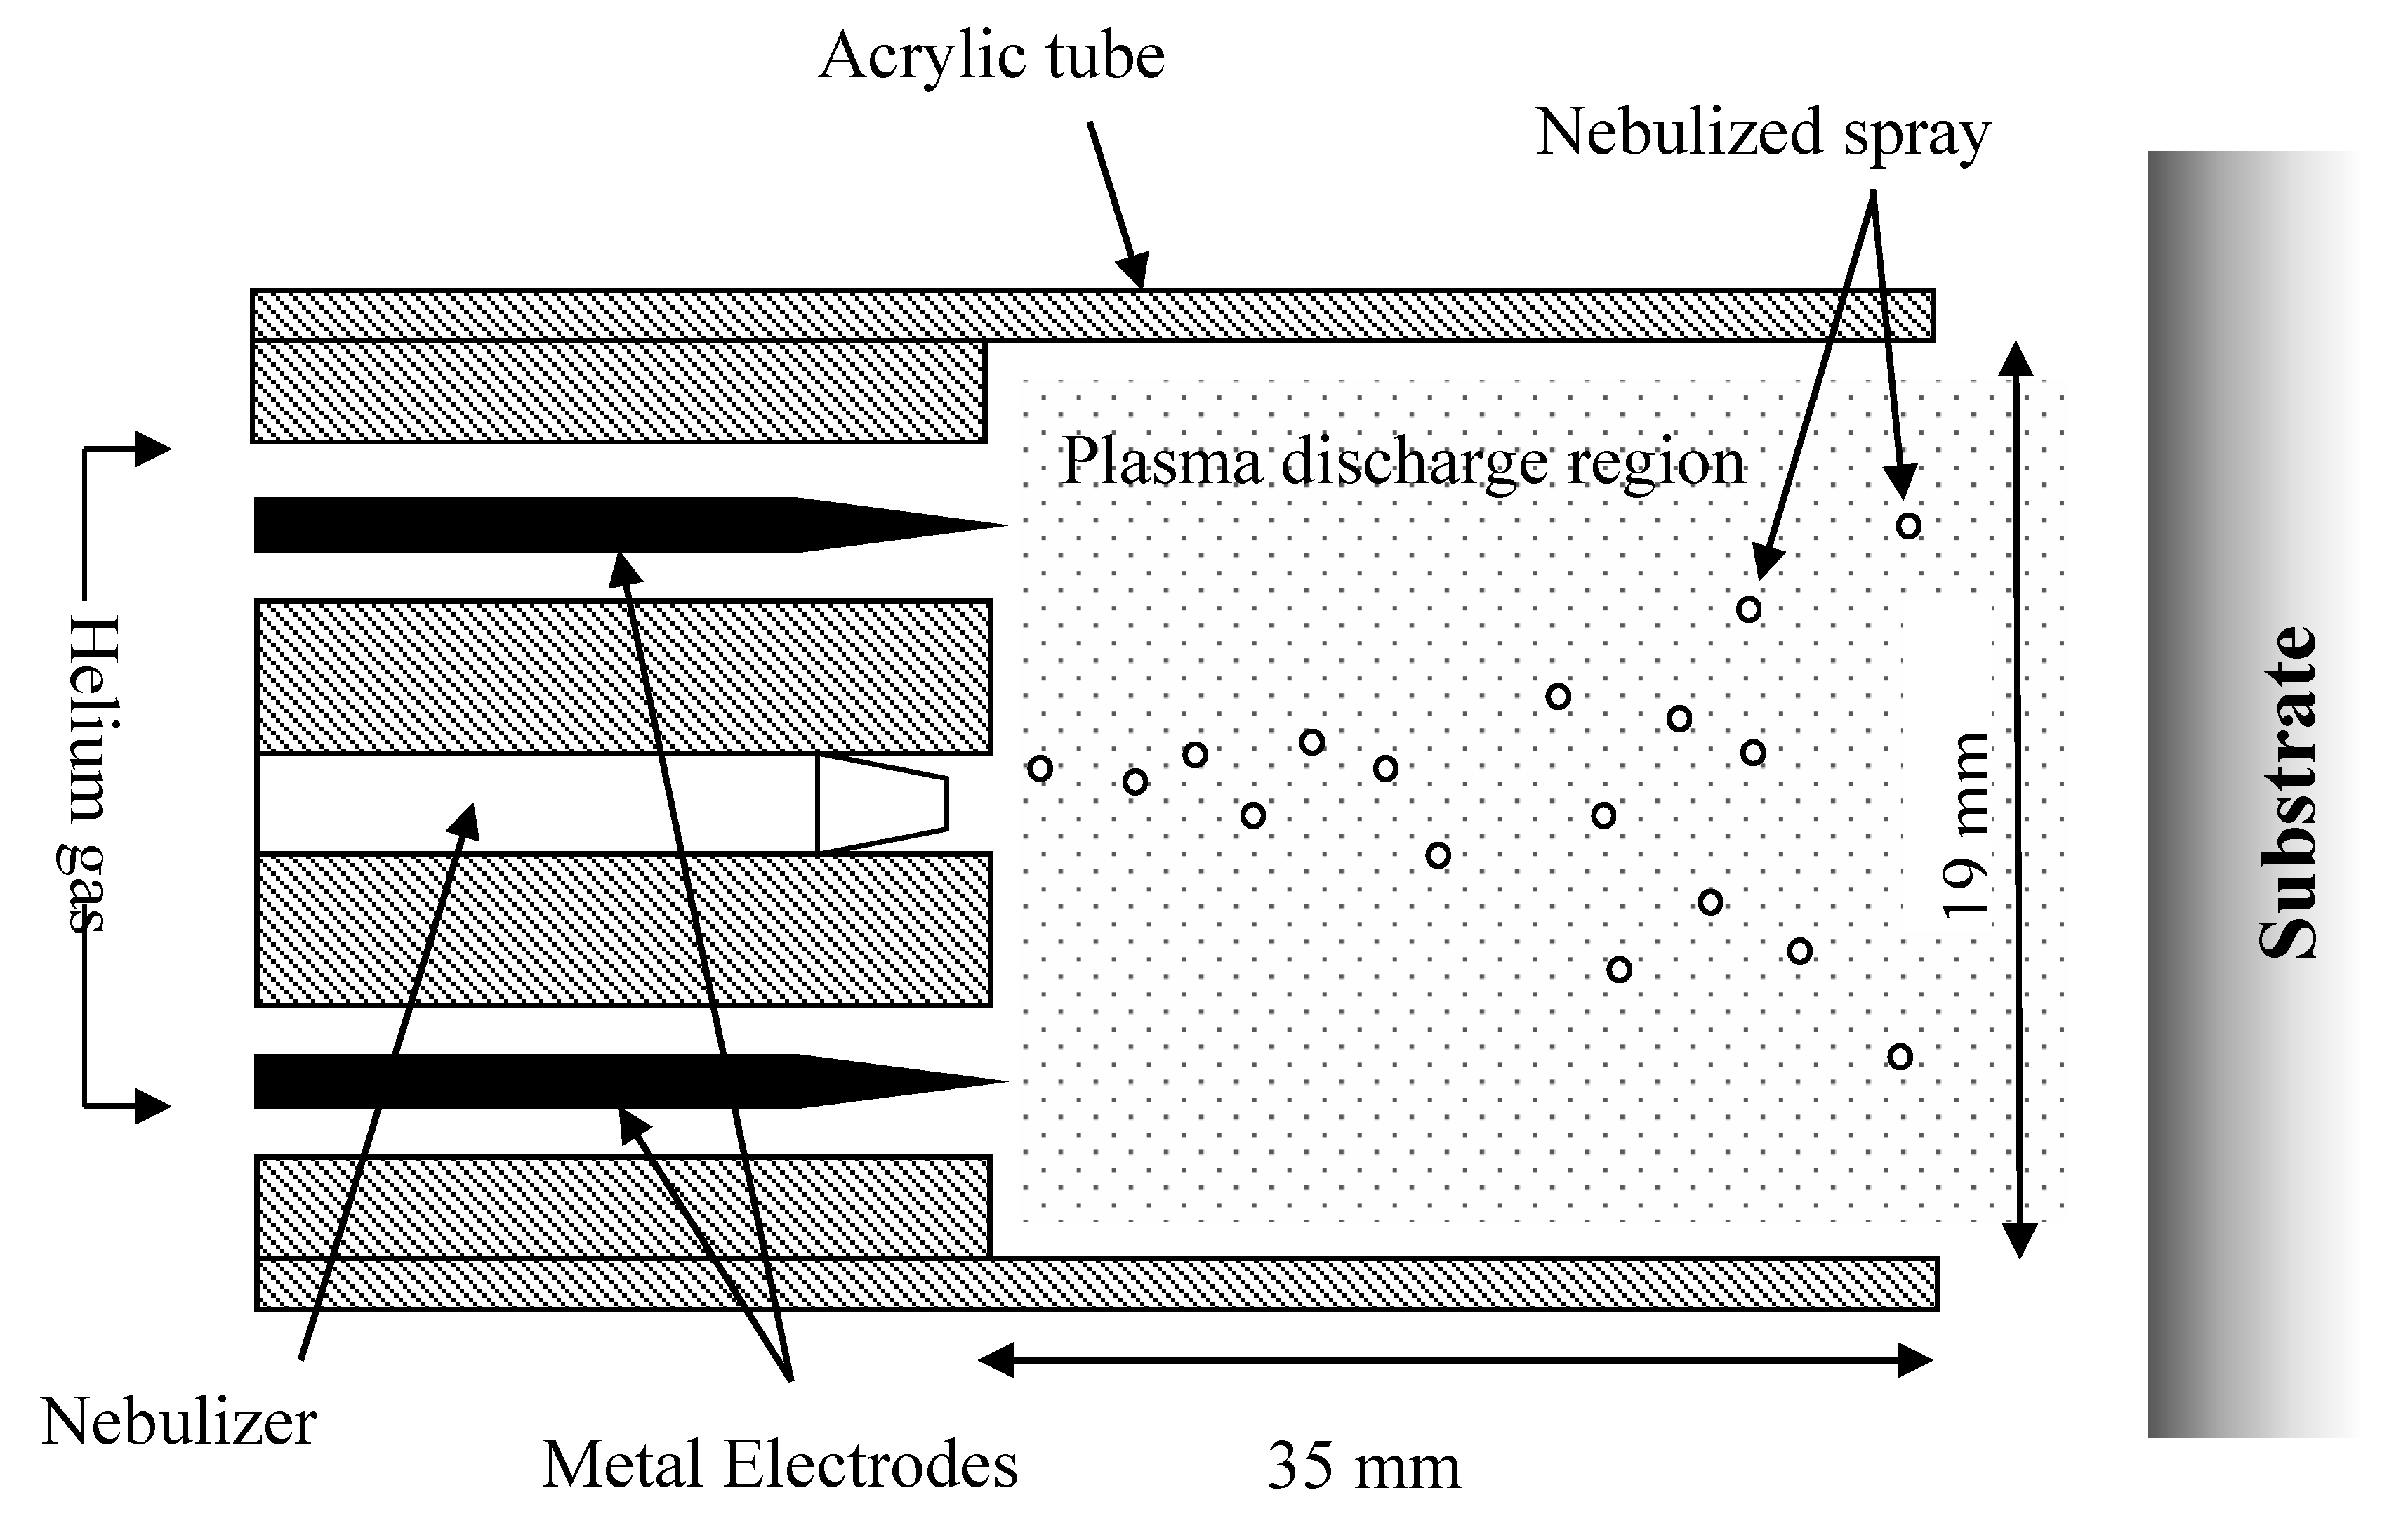
Plasma Deposition of Collagen Film. Plasma deposition was carried out using a purpose-built deposition system comprising a G2000 High Voltage power supply (Redline, Baesweiler, Germany) connected to a custom build Teflon deposition unit that encased two metal electrodes, as shown schematically in
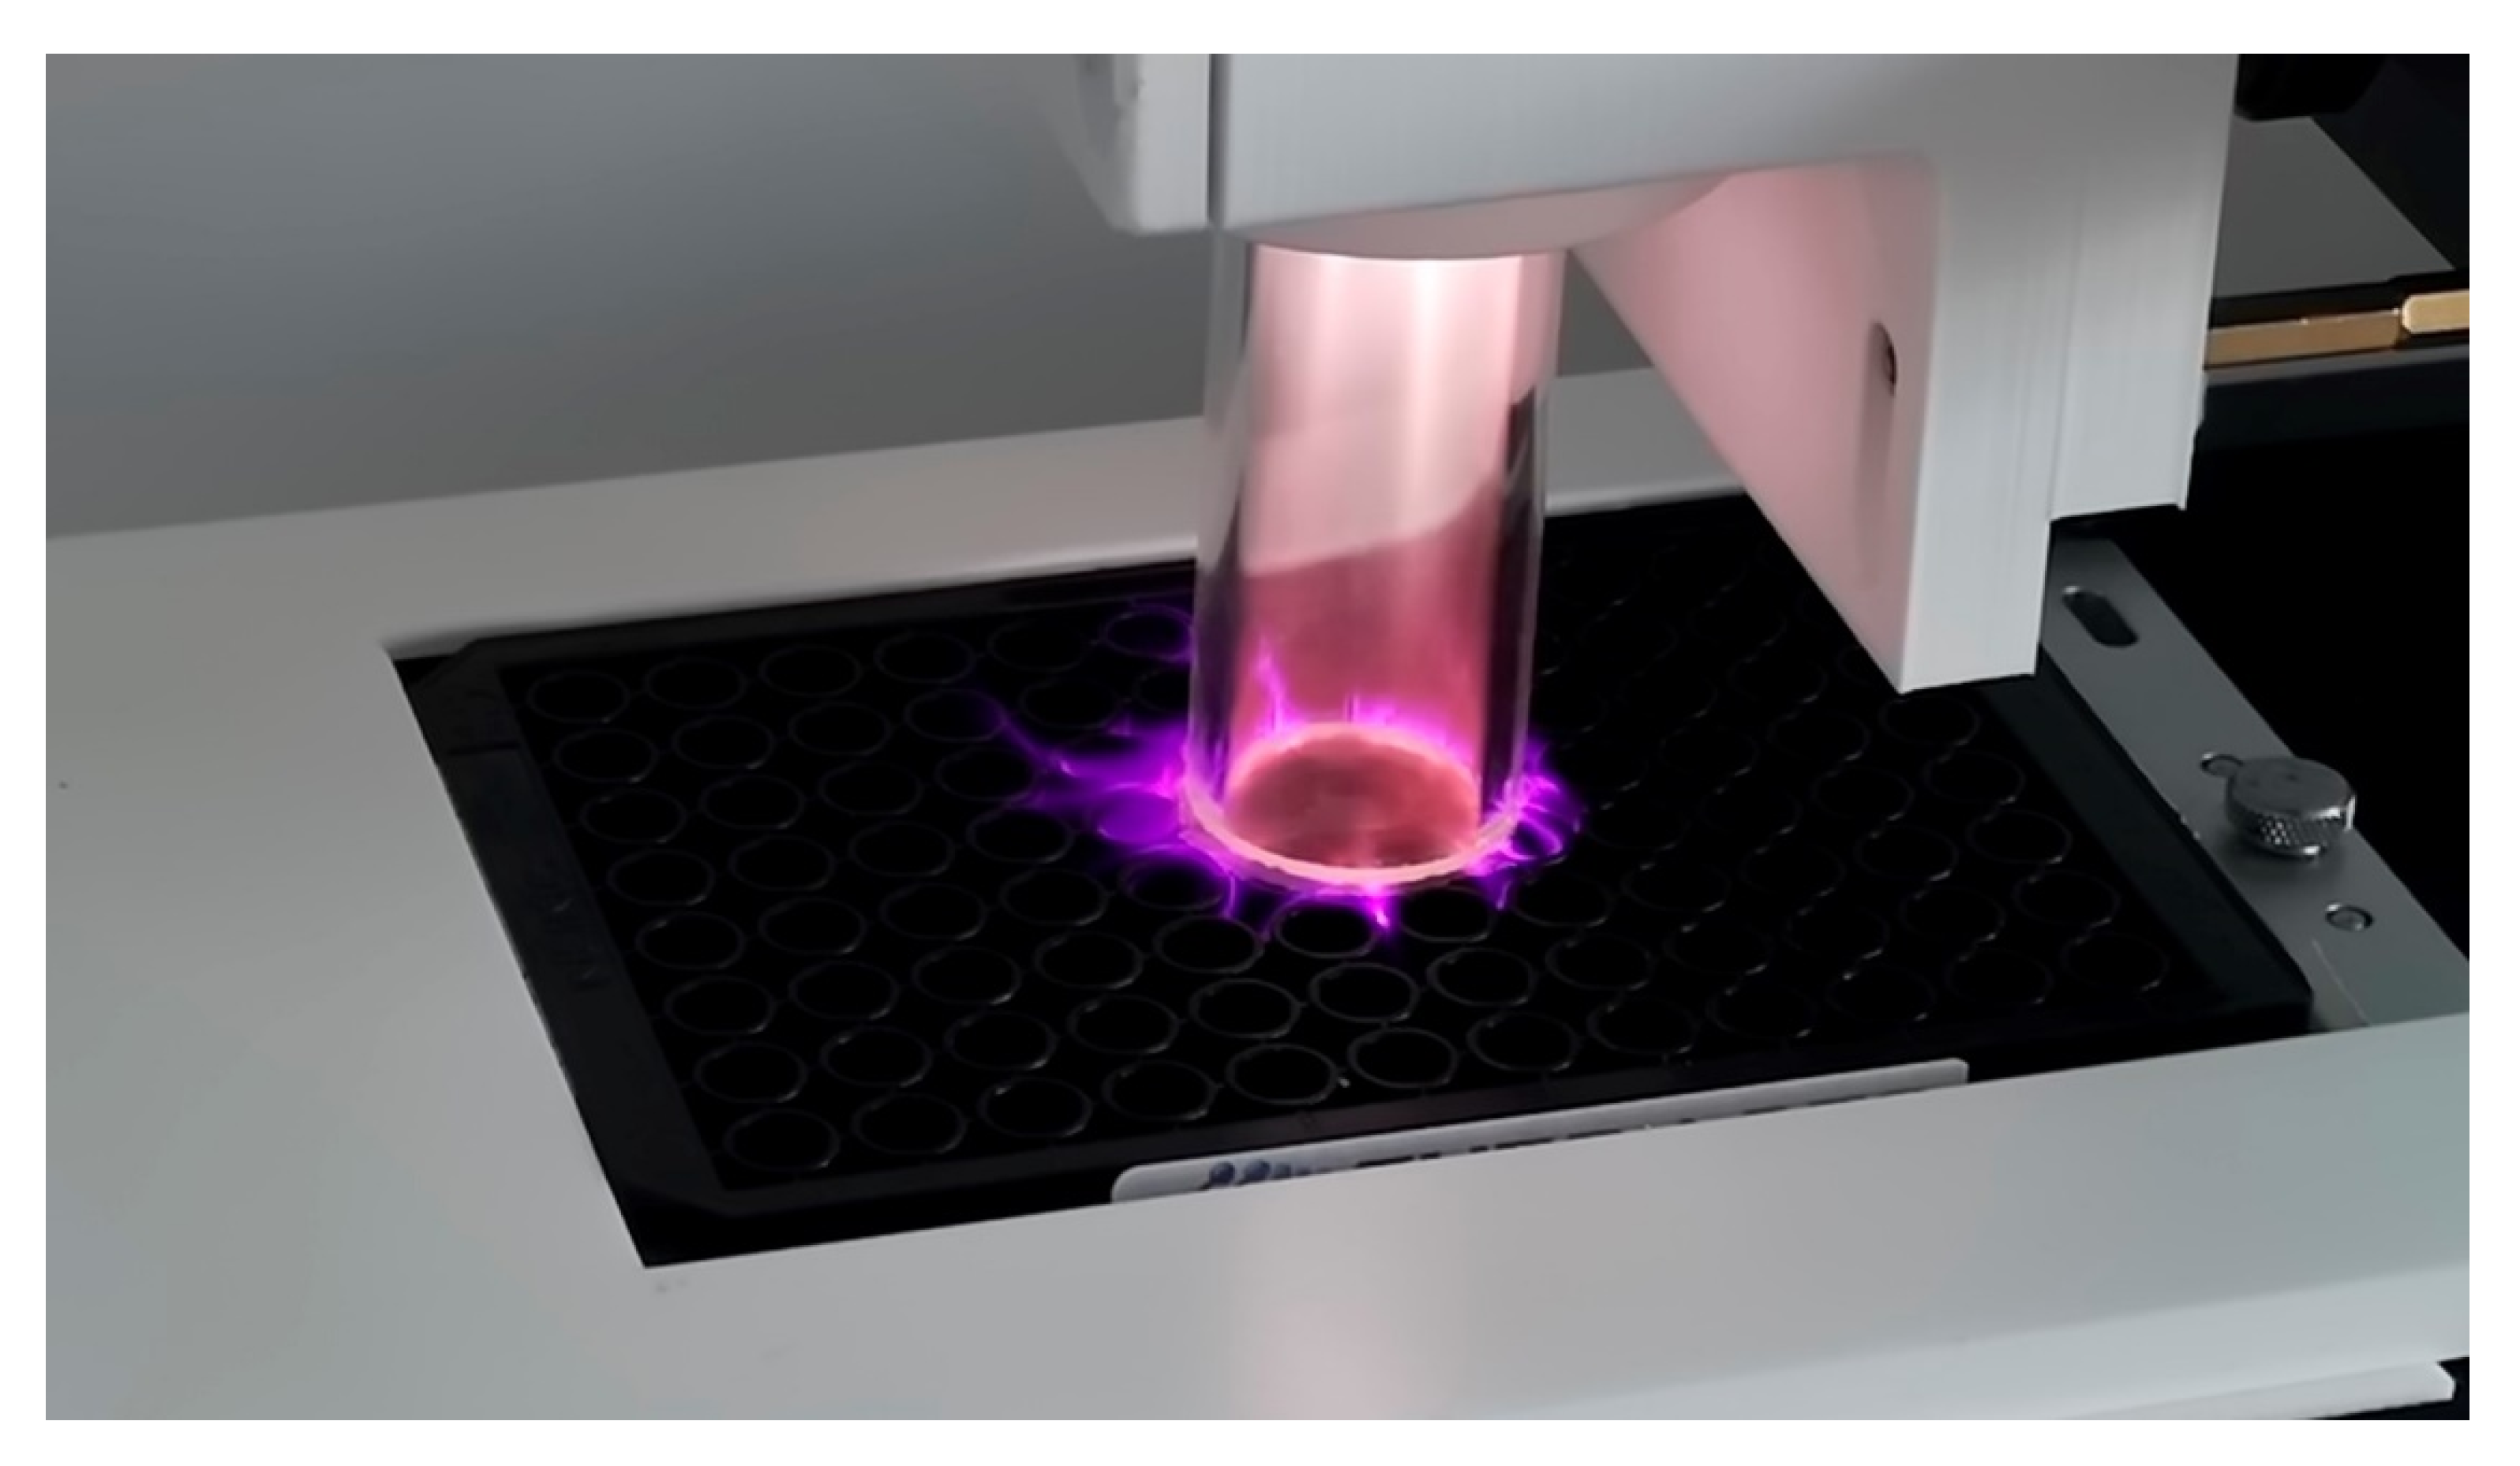
Figure 1. The plasma was operated at an input voltage of 160 V and 20.1 kHz. A pneumatic nebulizer T2100 (Burgener Research, ON, Canada) was placed between the electrodes and this was connected to a syringe pump to provide a constant flow of protein solution at 40 uL/min. The liquid was nebulized using a helium flow of approximately 3 slm. In addition, a separate helium flow of 6 slm was provided to the metal electrodes to create the plasma discharge. The plasma discharge was combined with the nebulized droplet spray in an acrylic tube (19 mm inner diameter × 35 mm length) and this is shown in
Figure 1 and
Figure 2. In order to coat the surface evenly the plasma head was mounted on a computer numerically controlled table and moved in a desired pattern. For the 6-well plates being coated the acrylic chamber, at the bottom of the plasma head, descends into each individual well and circles the well before rising and repeating this on the next well. For coating of flat surfaces, a raster pattern was used (4.5 mm step size, and width dependent on size/no. of samples) over the target surface with a gap height of 2 mm.
The applied voltage was measured using a TT-HVP 40 high voltage probe (Testec, Frankfurt, Germany), with a ratio of 1 V per kV, which was directly connected to the high voltage output of the G2000 power supply. Current measurements were made using a Pearson 4100 current monitor placed around the HV cable and readings from both voltage and current were collected on a TDS 2014C digital oscilloscope (Tektronix, Beaverton, OH, USA) and analyzed using Microsoft Excel.
Wet Chemical Deposited Film. A wet chemical deposition approach was used as a direct comparison with the plasma deposited collagen film. The 6-well plates and rat tail collagen protein (Type 1, 3 mg/mL) were purchased from Thermo-Fisher Scientific. Gold-coated silicon electrodes (AmsBio) were prepared by sonicating in acetone for 5 min, rinsing with methanol and deionized water, and drying under nitrogen. An even collagen film was deposited onto both substrates by drop casting 100 µL of the collagen onto the surface with a surface density of 76 µg/cm2. These were left to dry overnight at room temperature before testing.
Spectroscopy. Fourier transform infra-red (FTIR) spectroscopy was conducted using a Perkin Elmer Spectrum 2000 instrument (Waltham, MA, USA) operating in single beam mode using 64 scans and a 2 cm−1 resolution.
Optical emission spectroscopy (OES) was carried out using a USB4000 UV/VIS spectrometer (Ocean Optics, Duiven, The Netherlands). The fiber optic and collimating lens were mounted horizontally to the discharge and using a quartz tube to allow light transmission. A minimum of four measurements were carried out under each test regime.
Electrochemistry. A three-electrode electrochemical cell was used for all electrochemical experiments. The working electrode was a gold-coated silicon slide. The counter electrode was a large area coiled platinum wire and a silver/silver chloride (Ag/AgCl in 3 M KCl) acted as the reference electrode. All electrochemistry experiments were carried out on CHI760E workstation (CH Instruments, Inc., Austin, TX, USA). The three redox active probes that were used to investigate the surface properties were ferrocenemethanol (1 mM), ferri/ferrocyanide (1 mM), and ruthenium hexamine (1 mM). The supporting electrolyte for all redox probes was aqueous 0.1 M LiClO4.
Microscopy. Scanning Electron Microscopy (SEM) images were taken using a Hitachi S300N SEM (Hitachi, Tokyo, Japan) at an accelerating voltage of 5–10 kV and a probe current of 35 mA. The samples were mounted on a high purity aluminum slab using conductive carbon tape.
Atomic Force Microscopy (AFM) images were taken using a Bruker Dimension 3100 AFM (Bruker, Karlsruhe, Germany), at room temperature, using an Adama Diamond tip. The data acquired was analyzed using Gwyddion software.
Surface Energy. Contact angle measurements were conducted using a Kruss TVA100 (Hamburg, Germany) which uses a top view method to determine contact angle measurements and facilitated direct measurements of contact angle within the well of a microplate. Measurements were taken using a 1 µL water or hexadecane droplet taken at equilibrium, 60 s after placing the droplet on the surface and surface energy was then determined using the method of Owens and Wendt [
26].
Gel Electrophoresis. The SDS-PAGE analysis was performed using 4–12% hand-cast gels. Protein concentrations of all samples were adjusted to 1 mg/mL by mixing with loading buffer (2.5% of sodium dodecyl sulphate (SDS), 10 mM of Tris-HCl, 1 mM of EDTA, and 0.002% of bromophenol blue) with 5% of β-mercaptoethanol, used as a reducing agent to break down the disulfide bonds in the proteins. All samples were heated for 5 min at 100 °C before electrophoresis. Then, 10 µL samples and a marker were added to the wells in the gel. The gels were run at 200 V for 1 h and stained with Coomassie brilliant blue overnight. The gel was destained three times using 10% acetic acid solution washes over a 24 h period. Gel imaging was performed using G Box Chemi XRQ (Syngene, Cambridge, UK) for visual analysis.
MTT Cell Culture Assay. The human hepatoma (HepG2-ATCC) cell line and the human epithelial carcinoma (HeLa) cell line were obtained from the laboratory of Prof. Richard O’Kennedy at Dublin City University. A cryovial of each cell line was thawed at 37 °C and resuspended in prewarmed cDMEM (Dulbecco’s Modified Eagle Media; 10% (v/v) Fetal Bovine Serum; 1% (w/v) Penicillin-Streptomycin). Cells were centrifuged (1200 rpm; 3 min), the pellet resuspended in 10 mL of cDMEM (37 °C), added to a T25 cell culture flask and incubated overnight in a humidified atmosphere (37 °C; 5% CO2). Cell growth was monitored by examining cells under a Nikon Eclipse E400 Microscope. After 24 h of growth, cells were subcultured into a T75 cell culture flask and a subculture routine was implemented to ensure optimal cell growth conditions were maintained. When HepG2 and HeLa cells reached 75% confluency, media was removed from the cell culture flasks, cells were rinsed with sterile Dulbecco’s PBS and incubated with 2 mL of 0.5% (w/v) Trypsin (37 °C; 5% CO2; 5 min) until they were no longer adherent to the flask. cDMEM was added to inactivate the trypsin and the cell suspension was centrifuged (1200 rpm; 5 min). Cells were resuspended in 1 mL cDMEM.
An MTT (3-(4,5-dimethylthiazol-2-yl)-2,5-diphenyltetrazolium bromide) assay ab211091 (Abcam, Cambridge, UK) was used to assess the metabolic activity of the cells when coated on the various 6-well cell culture plates. The assay was carried out according to the manufacturer’s guidelines. Briefly, HepG2 cells were plated at a density of 7.5 × 10⁵ cells/mL and 2 mL of cell suspension was added to each well. HeLa cells were plated at a density of 5 × 10⁵ cells/mL and 2 mL of cell suspension was added to each well of the 6-well culture plate. Cells were grown for 24 h (37 °C; 5% CO2) before supernatants were removed and serum free media was added (500 µL/well). MTT reagent was added to each well (500 µL/well) and the plate was incubated for 2–3 h (37 °C; 5% CO2). MTT solvent (1.5 mL) was added to each well, sealed, and placed on the orbital shaker for 15 min. Absorbance was measured at 590 nm on Tecan Safire II plate reader.
3. Results
Characterization of the Plasma Discharge. The current and voltage measurements were consistent with previous descriptions of nonthermal helium plasma discharges at atmospheric pressure [
24,
27]. As shown in
Figure 3, the applied power was provided as a pulsed discharge with a damped pseudo-sinusoidal wave form. The peak voltage was 5.28 kV (peak-peak) and the corresponding current was 0.10 A. The low current flow confirms that the plasma was not arcing to ground through the formation of high energy streamers. Instead, the system produced a low level glow and the current values observed are typical of glow like discharges as described by Massines [
28]. Using Equation (1):
the plasma discharge power was determined to be 4.25 W. Previous studies of similar systems have established that these conditions generate a cold atmospheric pressure plasma discharge capable of depositing thin film coatings [
14,
19,
25,
29]. Upon addition of the collagen spray through the nebulizer, the plasma was visibly quenched, and the power delivered was reduced to 4.01 W. This was mainly driven by a reduction in the delivered current to a maximum of 0.08 A.
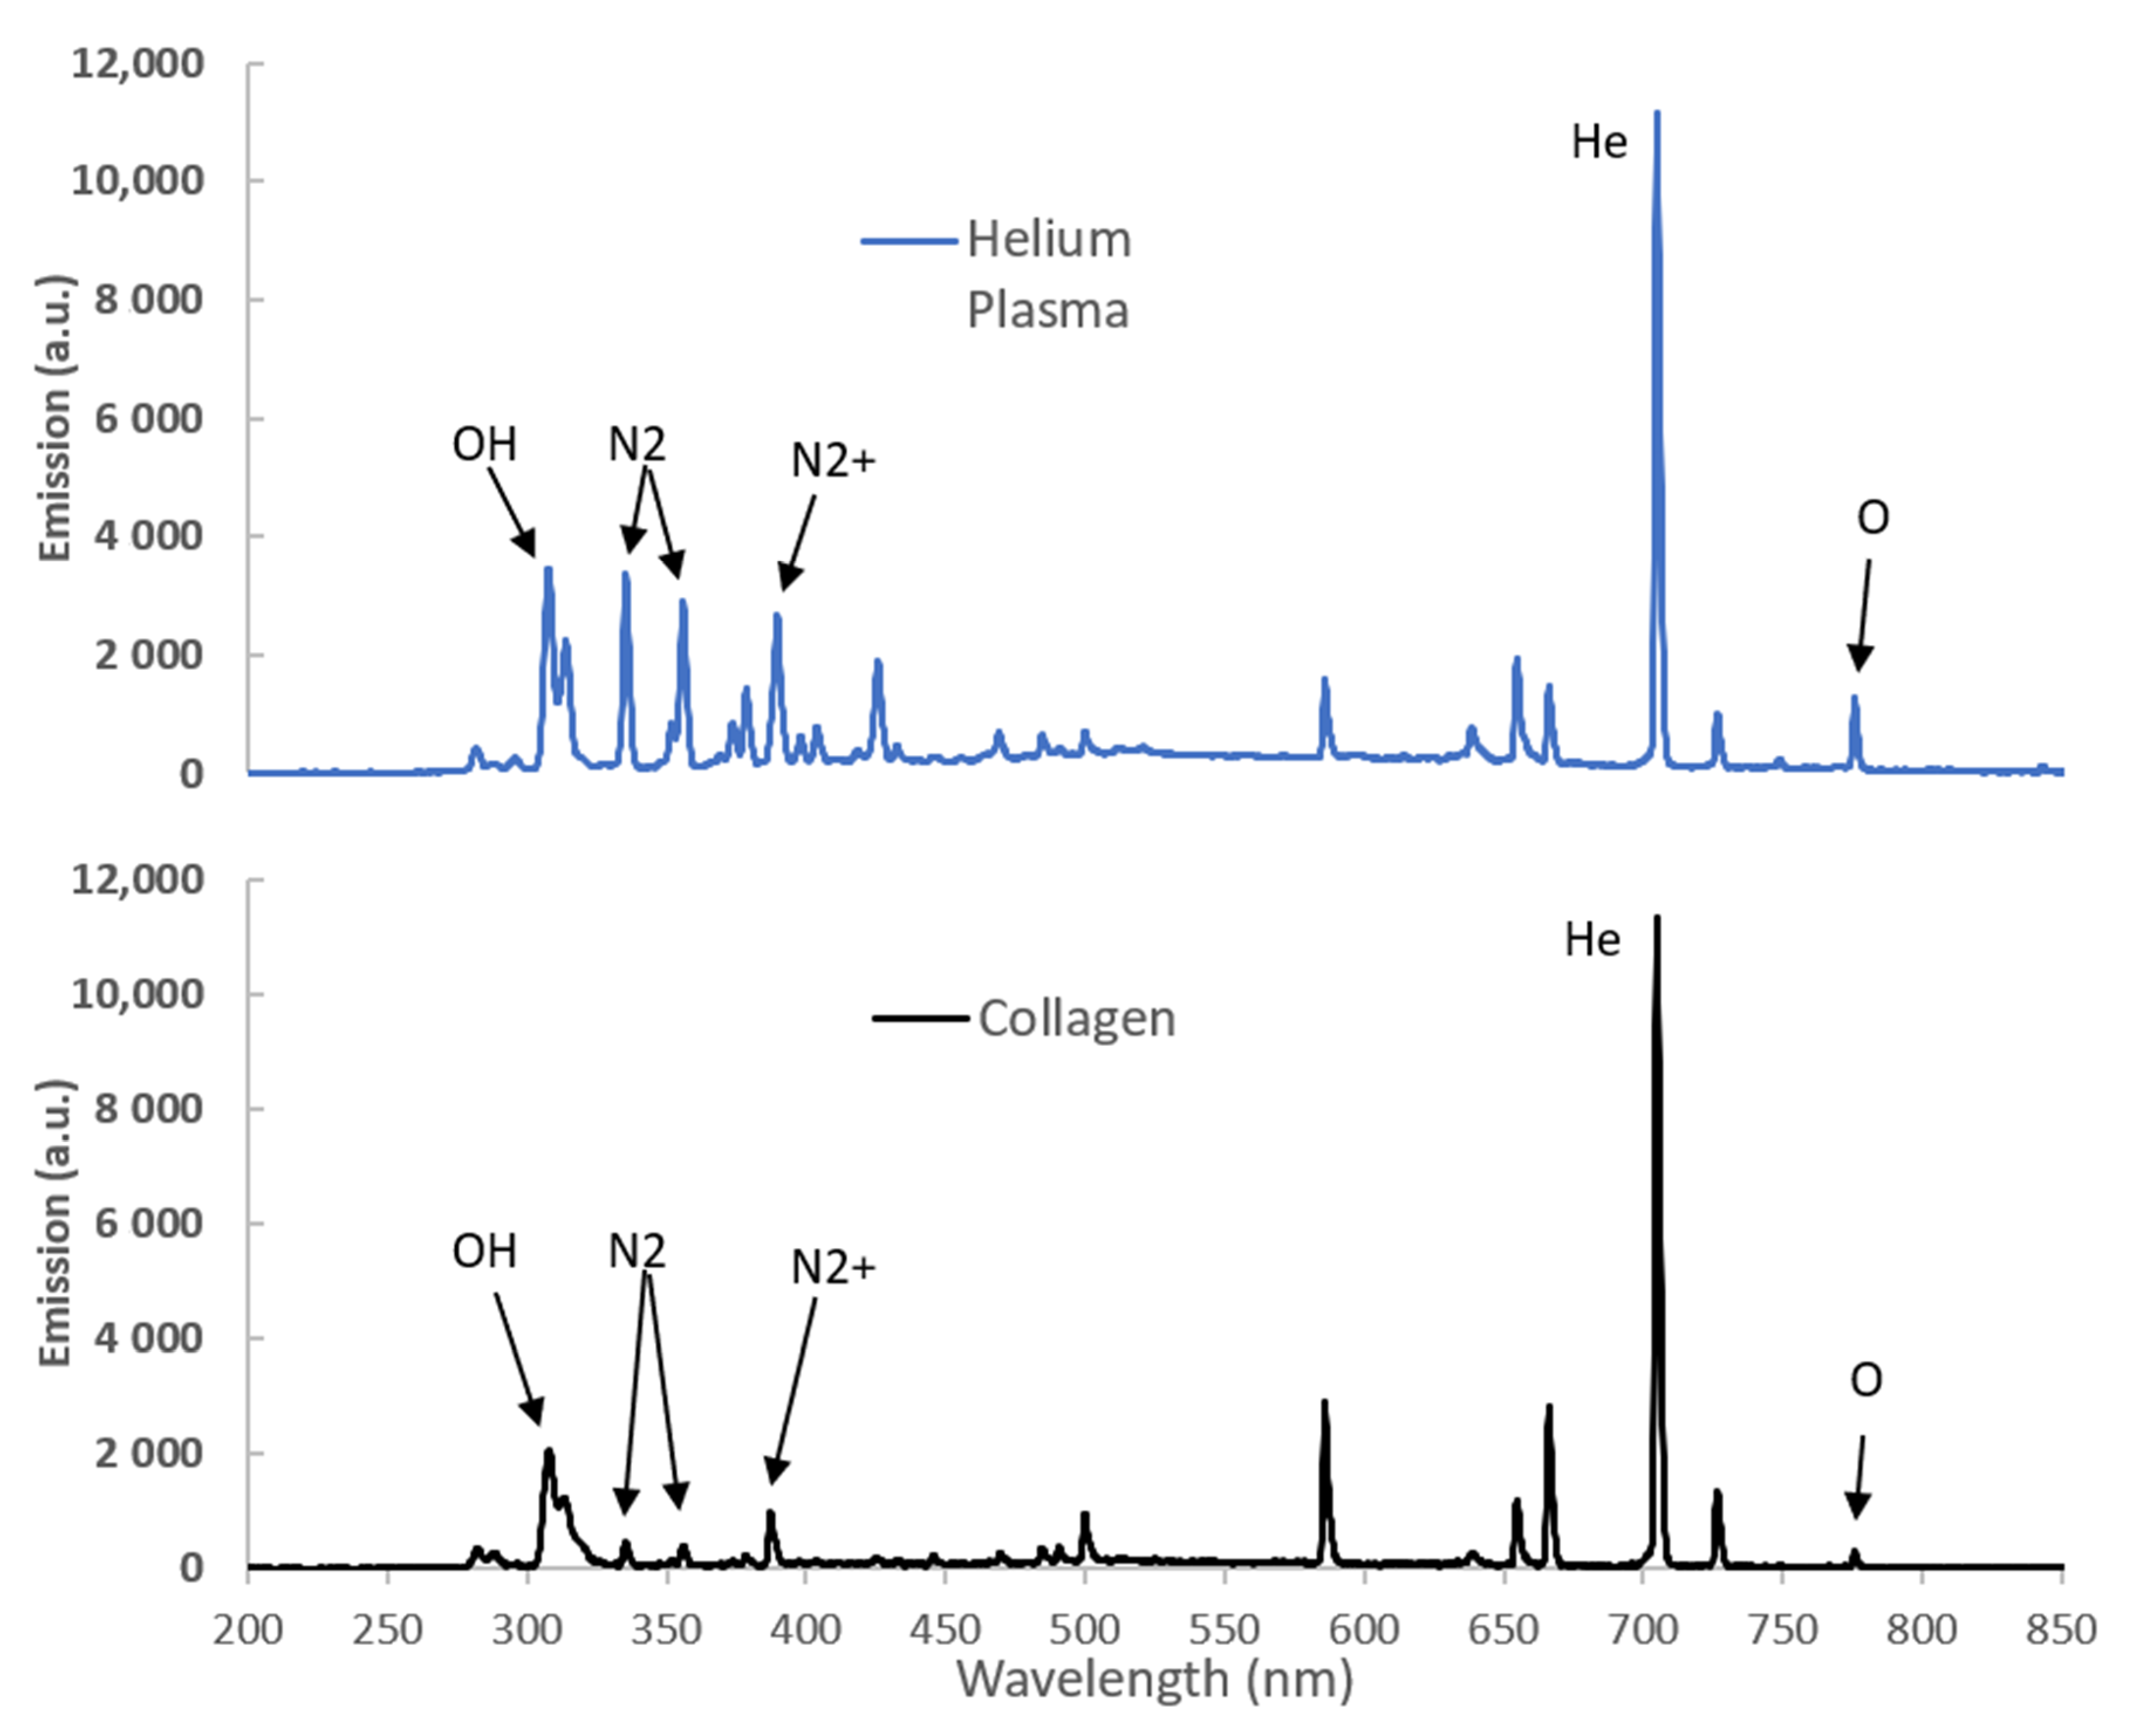
Optical emission spectroscopy was used to examine discharge properties with and without precursor flow. A typical spectrum for a helium plasma in the spectral range of 200–850 nm is shown in
Figure 4 and produced a spectrum that is typical of atmospheric pressure helium discharges with a mixture of helium and nitrogen derived features. The helium plasma produced a series of intense emission lines which can be ascribed to both nitrogen molecular (N
2 at 300–450 nm), nitrogen molecular ion lines (N
2+ at 358, 391, 419, and 427 nm) and helium (588, 667, 706, and 727 nm) species in the plasma.
Addition of the collagen spray did not produce any additional peaks in the spectrum. The emission intensity dropped upon addition of the collagen, as seen in
Figure 4. The decrease in emission intensity is primarily around the N
2 and N
2+ peaks between 300 and 435 nm. These peaks are normally assigned to the reaction associated with Penning ionization of the nitrogen molecules due to helium metastables [
30]. The decrease in emission intensity is therefore most likely due to consumption of the helium metastables caused by plasma quenching due to the interaction with the water droplets and the nitrogen species as the collagen solution is introduced. This decrease in ionization rate will reduce the production of free electrons [
31] and in turn reduce the possible damage caused to the collagen by the plasma.
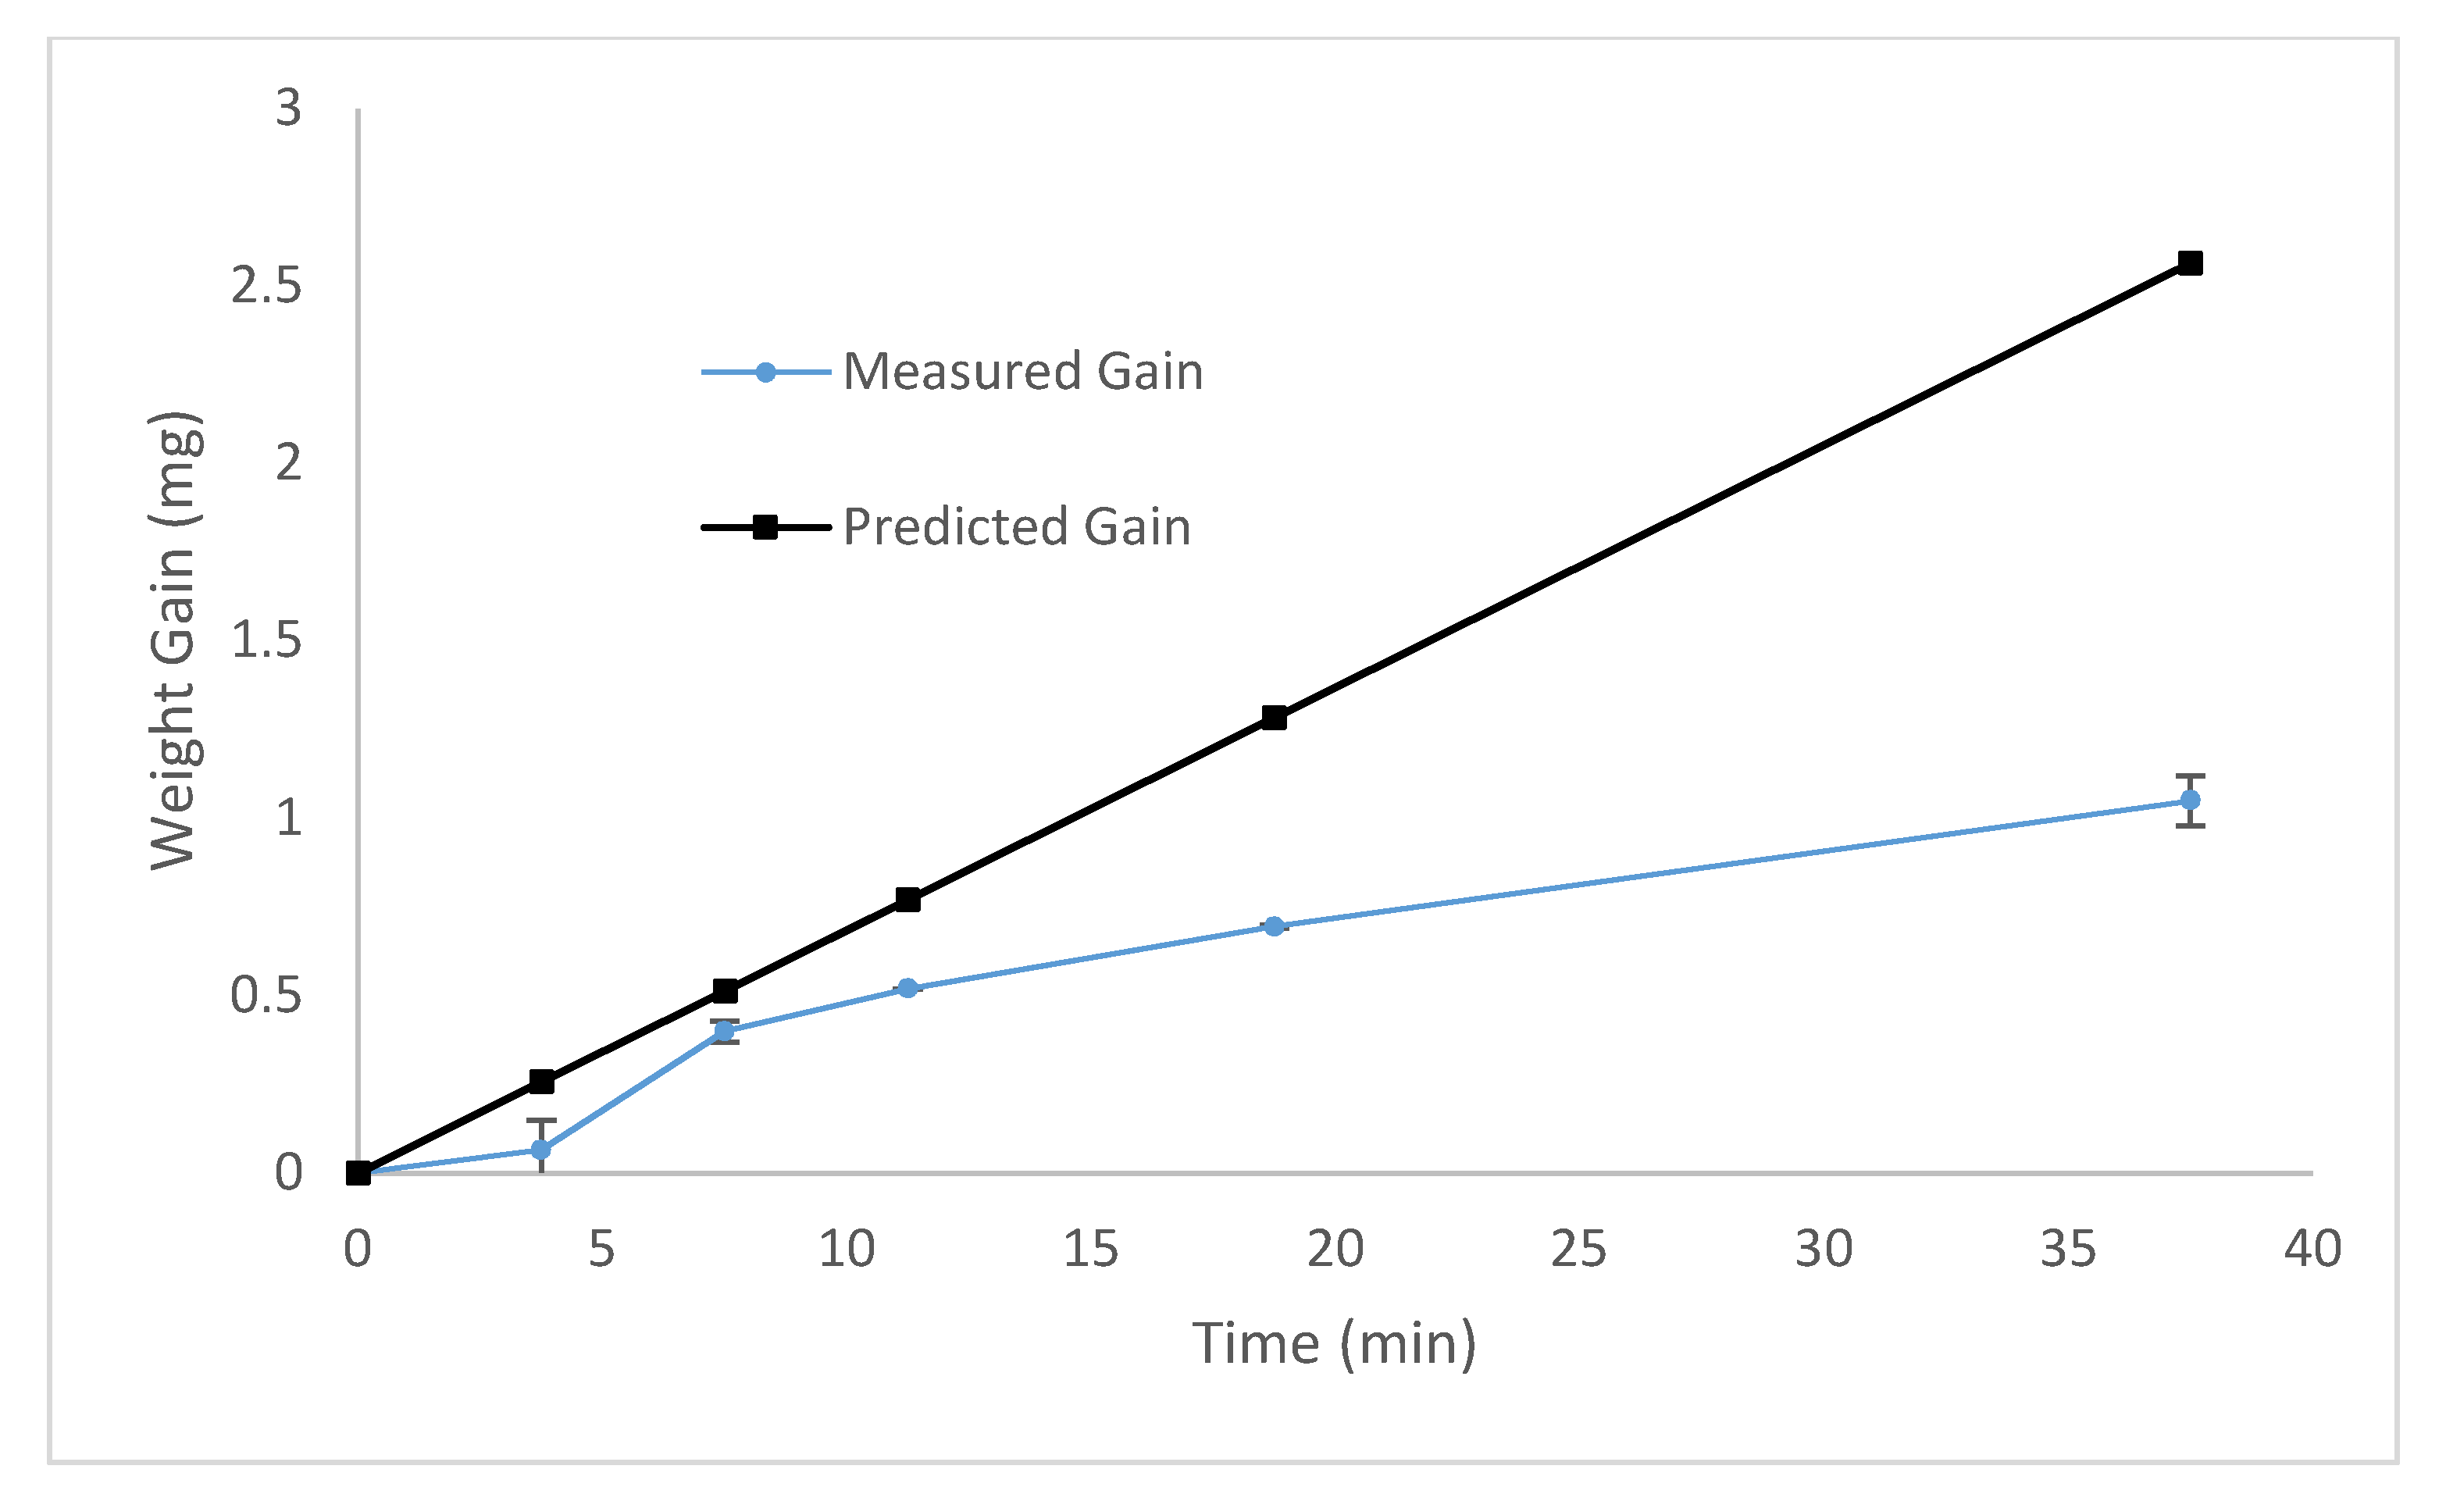
Analysis of Collagen Films. Gravimetric analysis was used to measure the deposition rate of the plasma coating. In order to remove any potential variability arising from ablation or cross-linking of the polystyrene substrate, a series of coatings were deposited onto double polished four-inch silicon wafers and the weight gain was measured.
The result was plotted against a theoretical deposition rate of a process with 100% efficiency, shown in
Figure 5. There was an average deposition efficiency of 40–50%, with a relatively linear increase in deposition mass with time. If the plasma process had been 100% efficient, then the plasma coated microplates would generate a collagen loading of 3.5 ug/cm
2. This is significantly less than the 76 µg/cm
2 produced using the traditional wet chemical method, representing a more protein efficient process.
The physical structure of the collagen films deposited via wet chemical deposition and via the plasma deposition method were compared using standard surface analytical techniques. None of the films were visible via optical microscopy, indicating that both coatings were optically clear. Therefore, higher magnification SEM and AFM techniques were used to probe the surfaces in more detail.
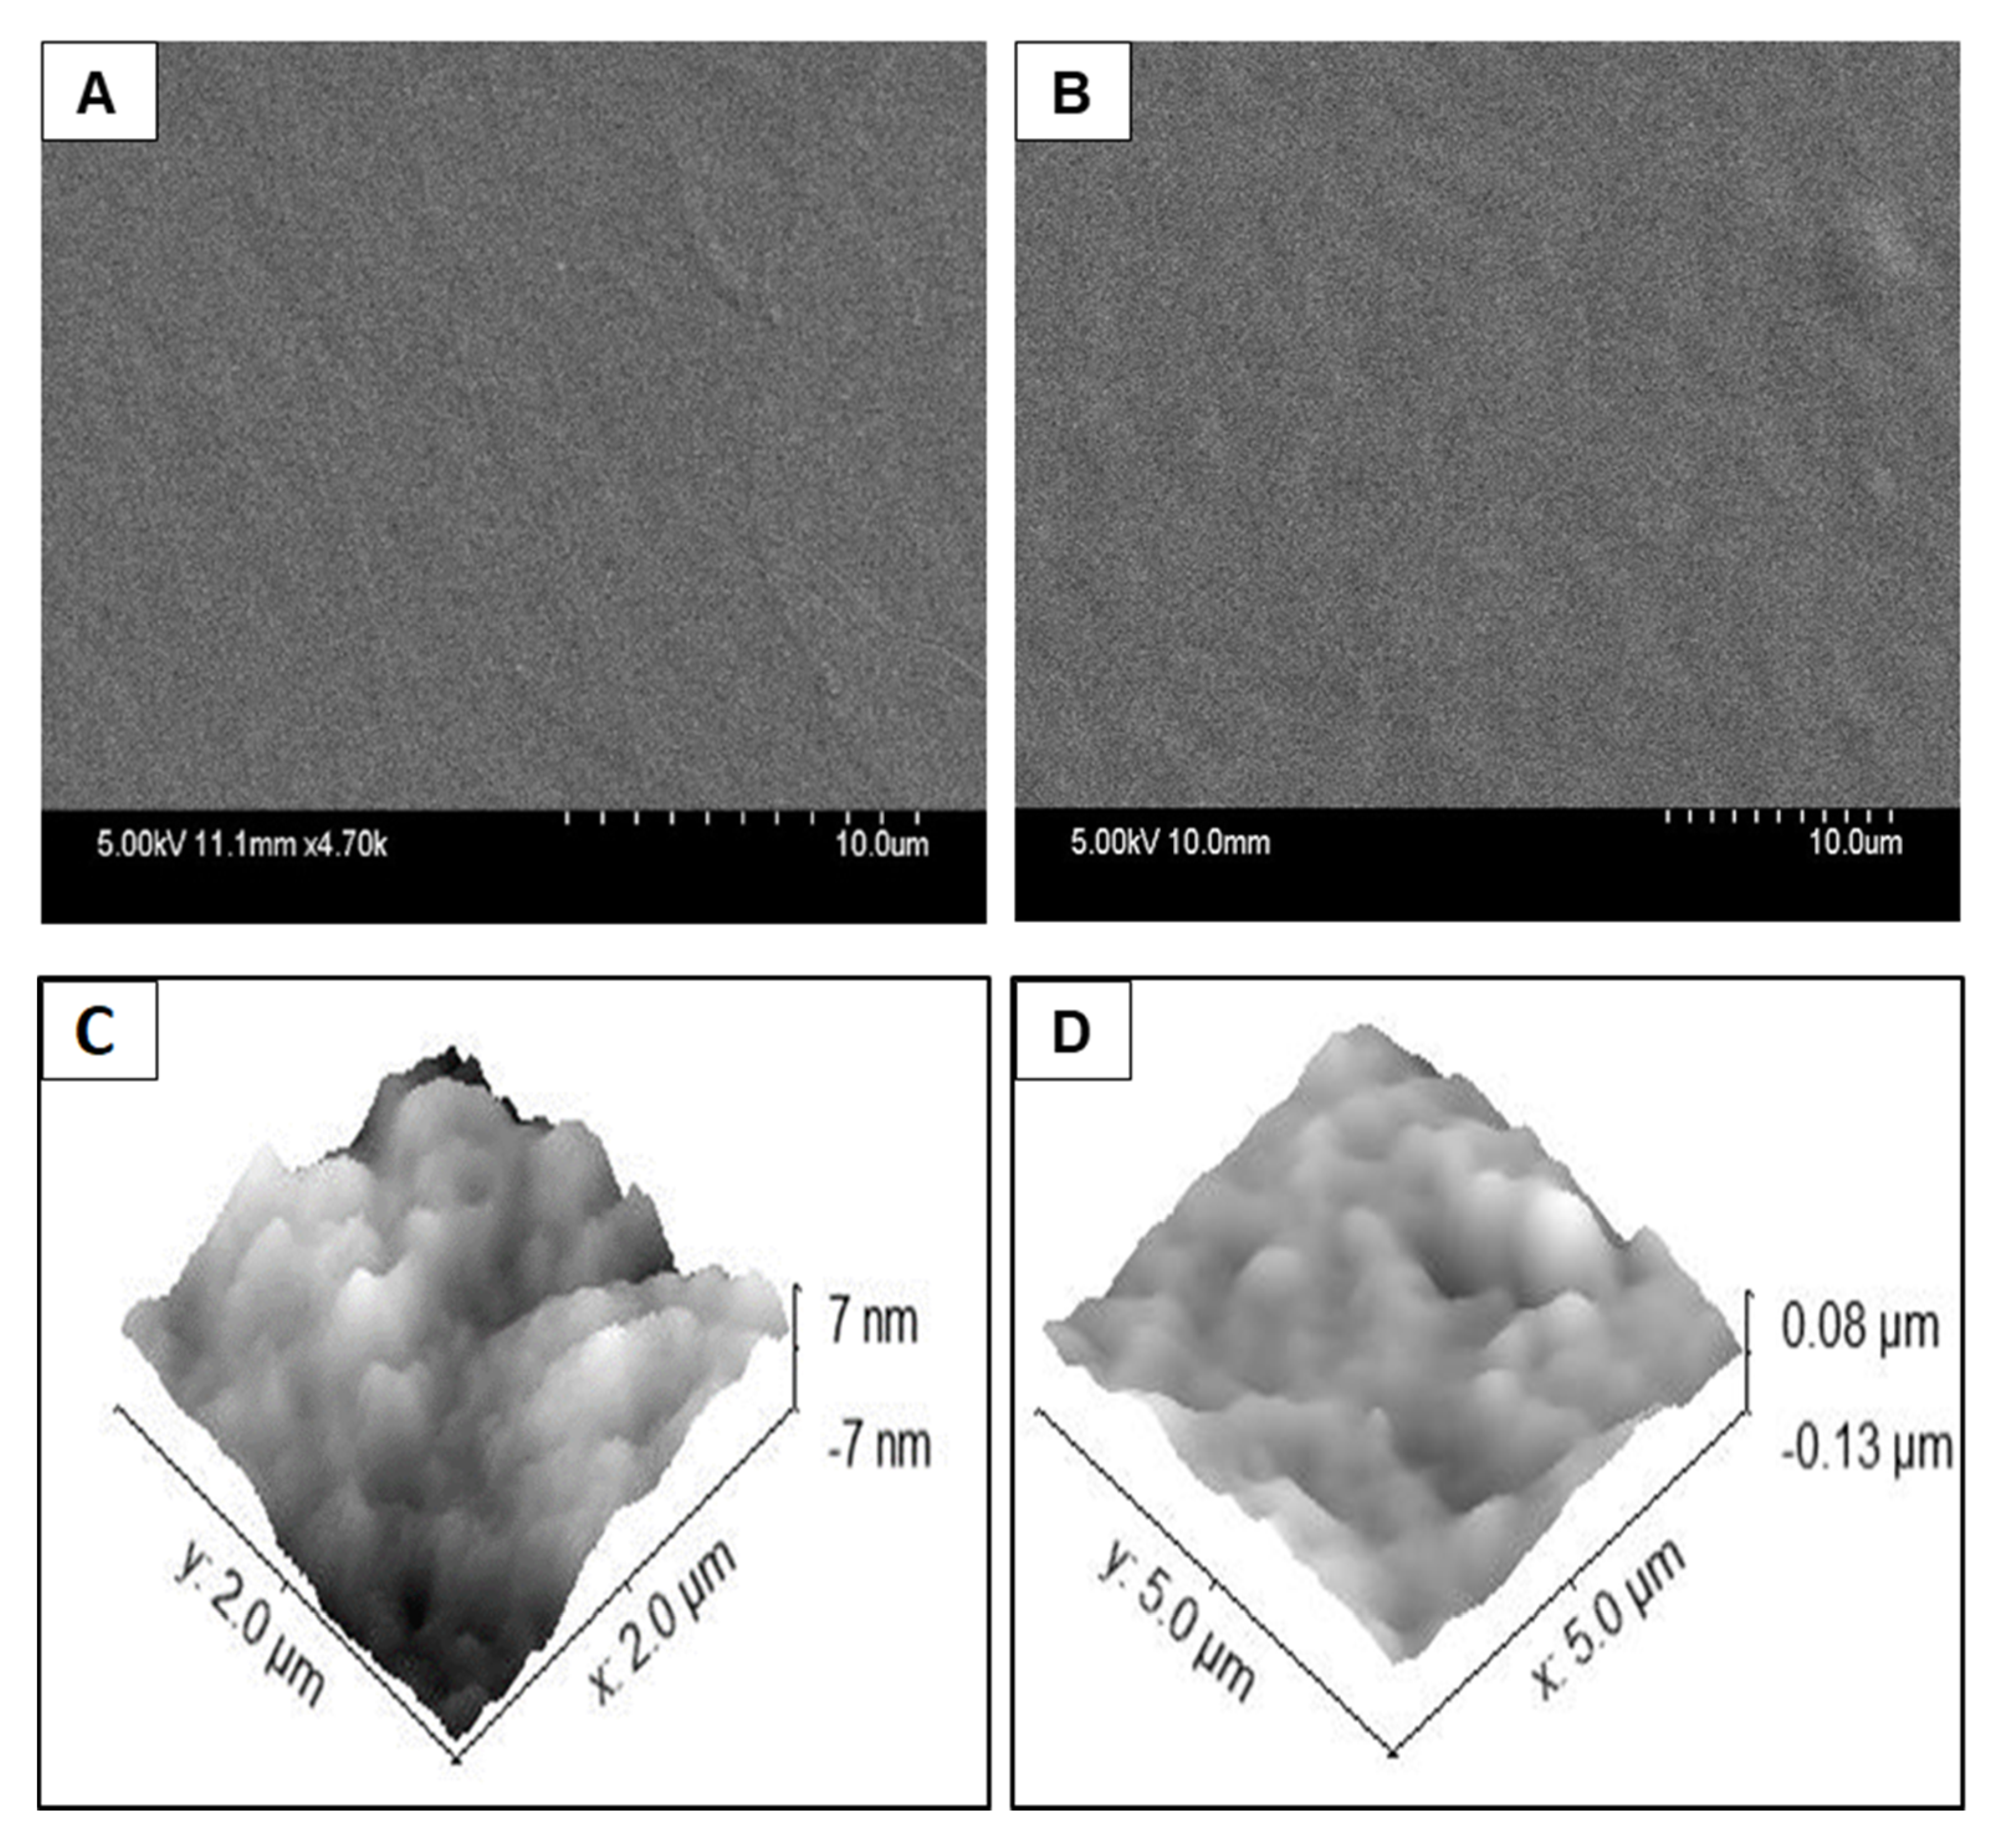
Figure 6A,B shows SEM images of the collagen delivered via plasma coating process or the wet chemical coating, respectively. There were no macroscopic features on any of the plates indicating that there is a continuous, uniform layer across the entire surface. Deposition results in subtle changes in the morphology compared to the pristine polystyrene, but surface texture modification is more noticeable from the wet chemical deposited film (
Figure 6B).
Figure 6C,D shows the AFM images of the plasma deposited collagen coating and the wet chemical coating, respectively. The plasma deposited collagen film displayed broad, textured features of 10 nm or less. This correlates with the SEM images and indicates a continuous coating of the collagen.
Figure 6D shows that the film deposited using the wet chemical method has greater texturing and relatively larger features (80 nm compared to 10 nm) were observed across the surface. These images indicate that the underlying polystyrene plate was successfully coated with a layer of the collagen using either method.
Surface Chemistry. Water and hexadecane contact angle measurements were recorded on each surface and the surface energy was calculated using the method of Owens and Wendt [
26]. As shown in
Table 1, the hexadecane readings were consistent across all surfaces, indicating that the dispersive component of surface energy was highly consistent. In contrast, the water contact angles varied significantly. Both coated surfaces were considerably more hydrophilic than the uncoated polystyrene. The wet chemical coating was slightly more hydrophilic than the plasma coating, which might be due to the higher level of collagen present, as determined gravimetrically.
The surface chemistry of plasma deposited collagen coatings and air-dried collagen coatings were probed using FTIR spectroscopy and typical spectra are shown in
Figure 7. In accordance with previous reports [
23,
25], the plasma appears to have no detectable effect on the chemical structure of the protein; there were no changes in peak heights or positions. The spectra collected from the two collagen coatings were effectively identical with no additional features or shifts evident in either spectrum. The spectra are dominated by the anticipated amide peaks at 3325, 3087, 1653, 1554, and 1241 cm
−1 along with the anticipated C-H
x features below 3000 cm
−1 [
32].
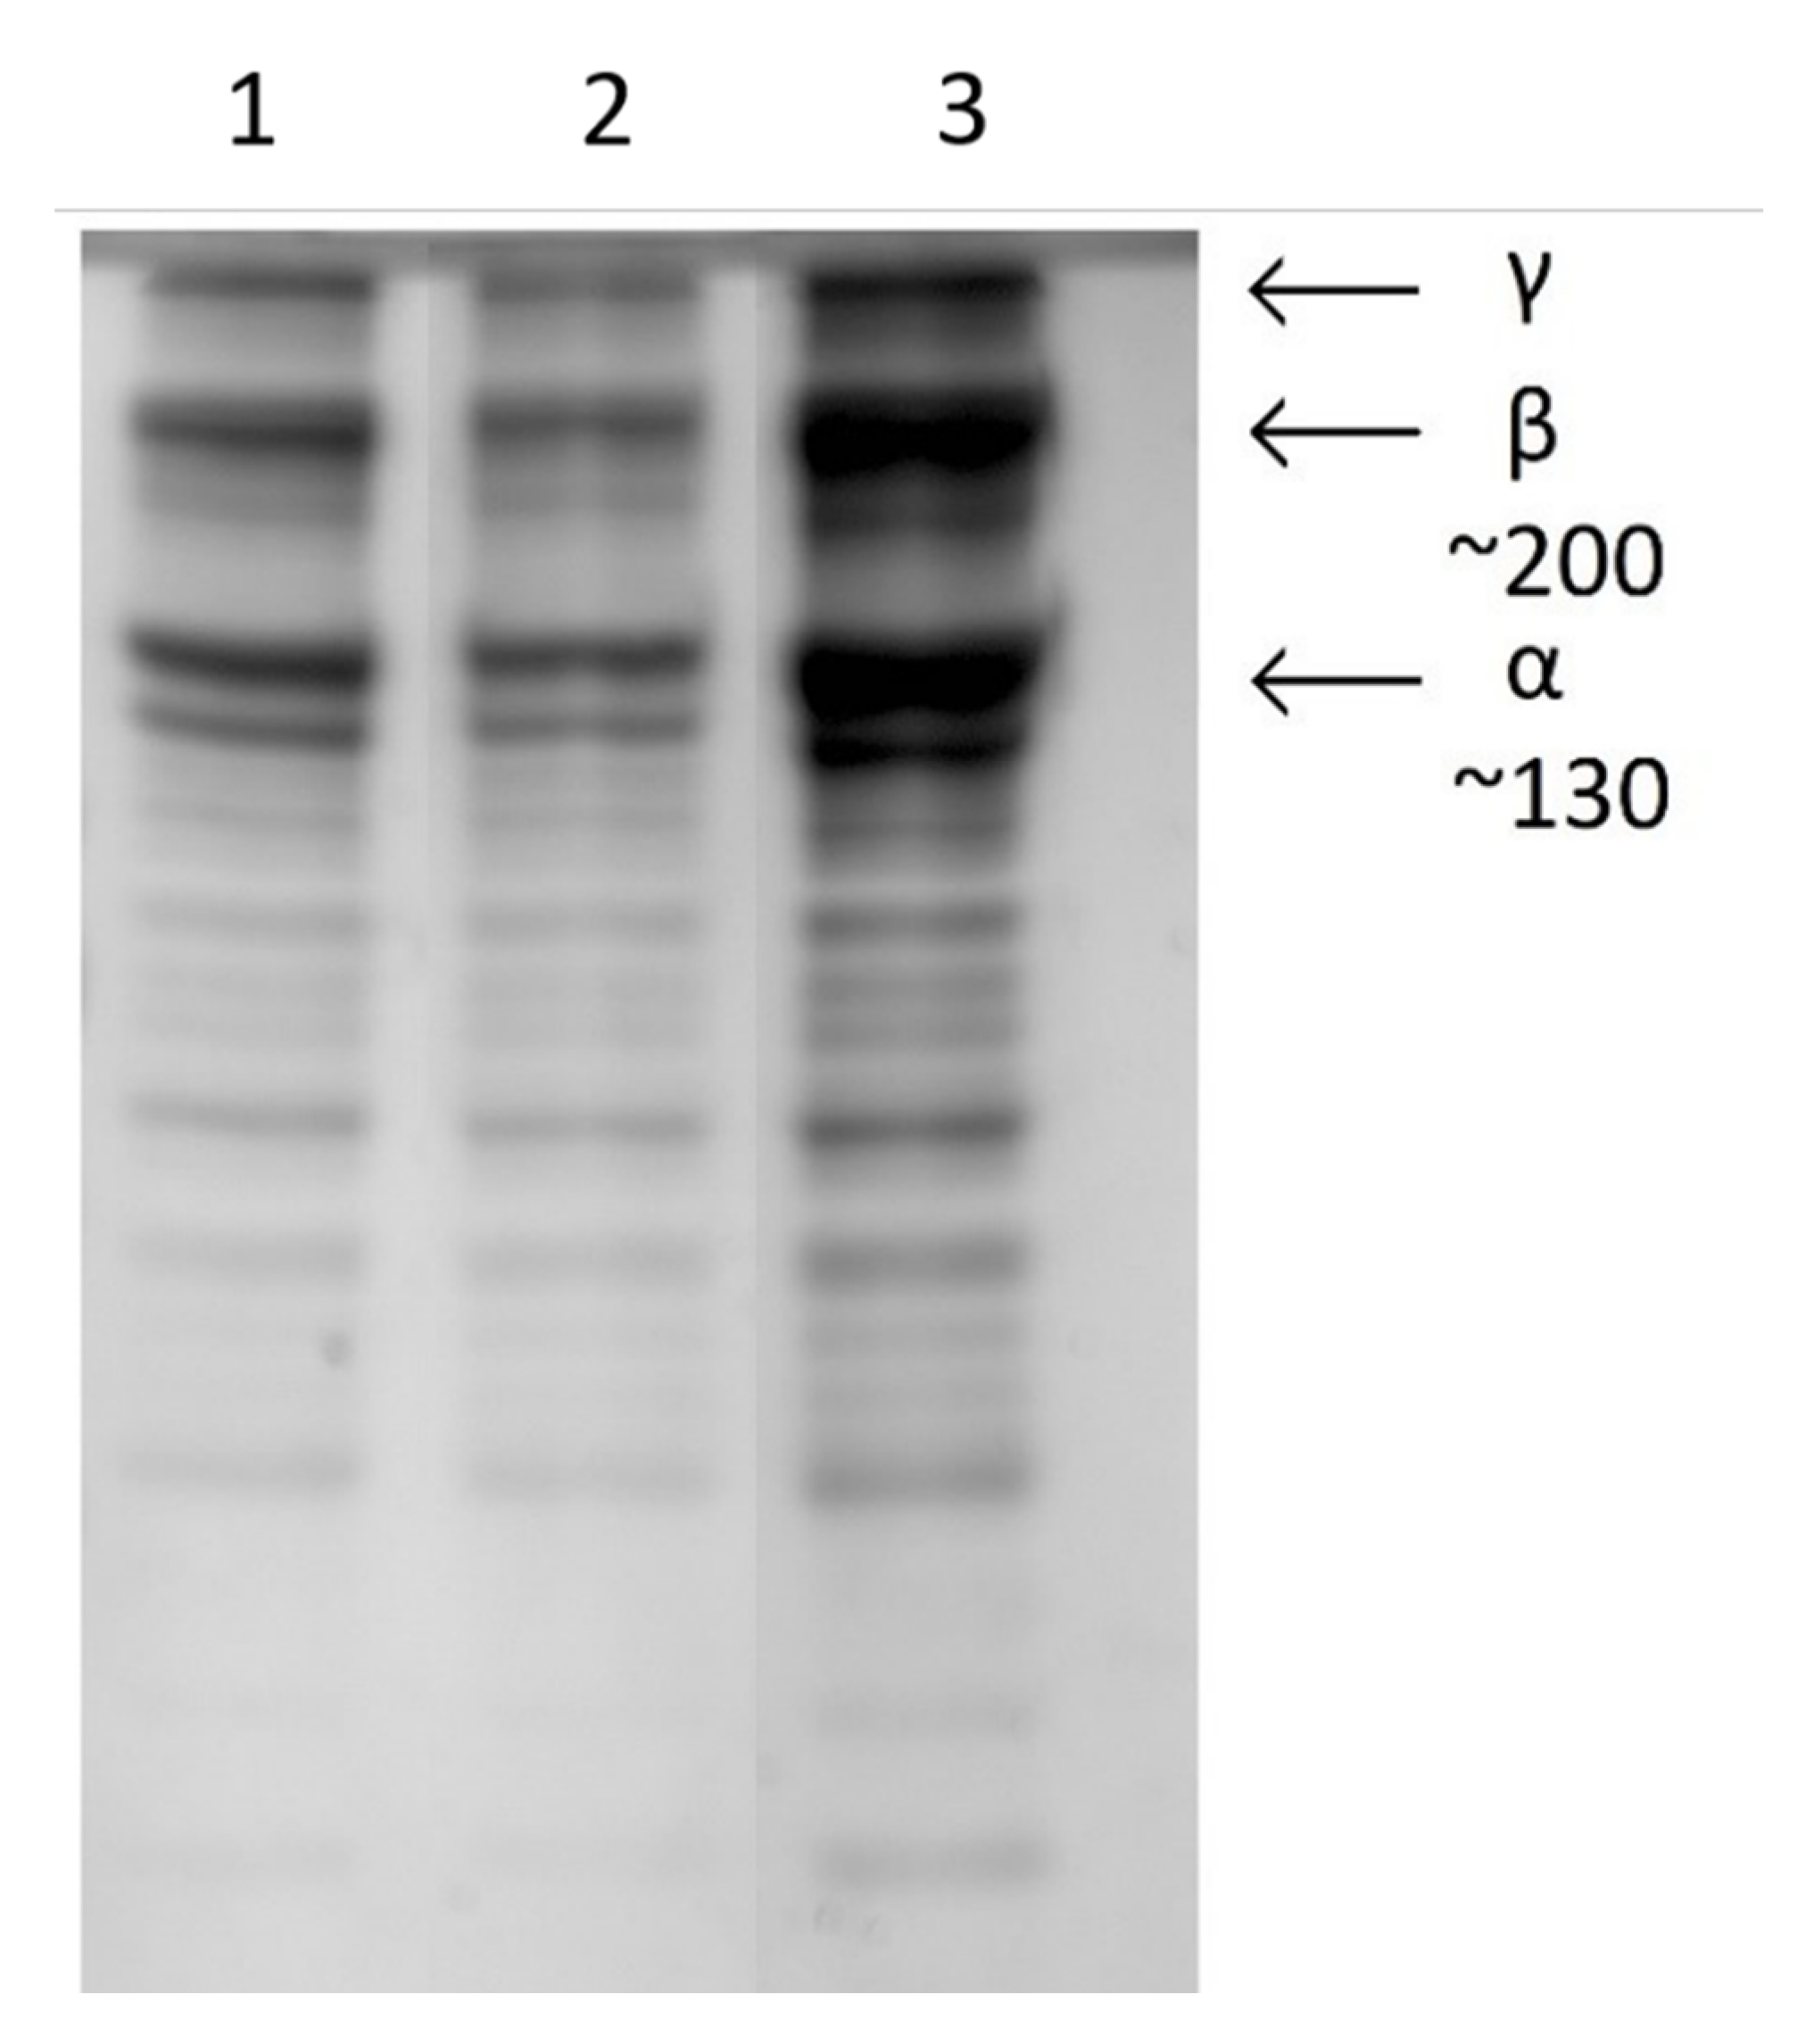
Gel electrophoresis was used to investigate the effect of plasma on the protein structure. Collagen samples were sprayed into a solution of 0.02 M acetic acid with the plasma either turned off (sprayed liquid collagen sample) or with the plasma powered on (plasma deposited collagen). Undiluted collagen was also run as a control.
Figure 8 shows that all samples displayed identical bands typical of a collagen molecule. The chromatographs are dominated by the pair of α chains, a strong band associated with the β-sheet, and a γ component. The increased intensity of the bands in lane 3 were associated with the undiluted collagen control sample. No additional features or alterations of the plasma treated sample were observed in the gel, indicating that this protein structure is not altered by the plasma process.
Electrochemical Properties of film. In order to investigate the effect of the underlying substrate on the film morphology and to facilitate electrochemical measurements, collagen films were deposited using the plasma process and the wet chemical method on gold on silicon electrodes.
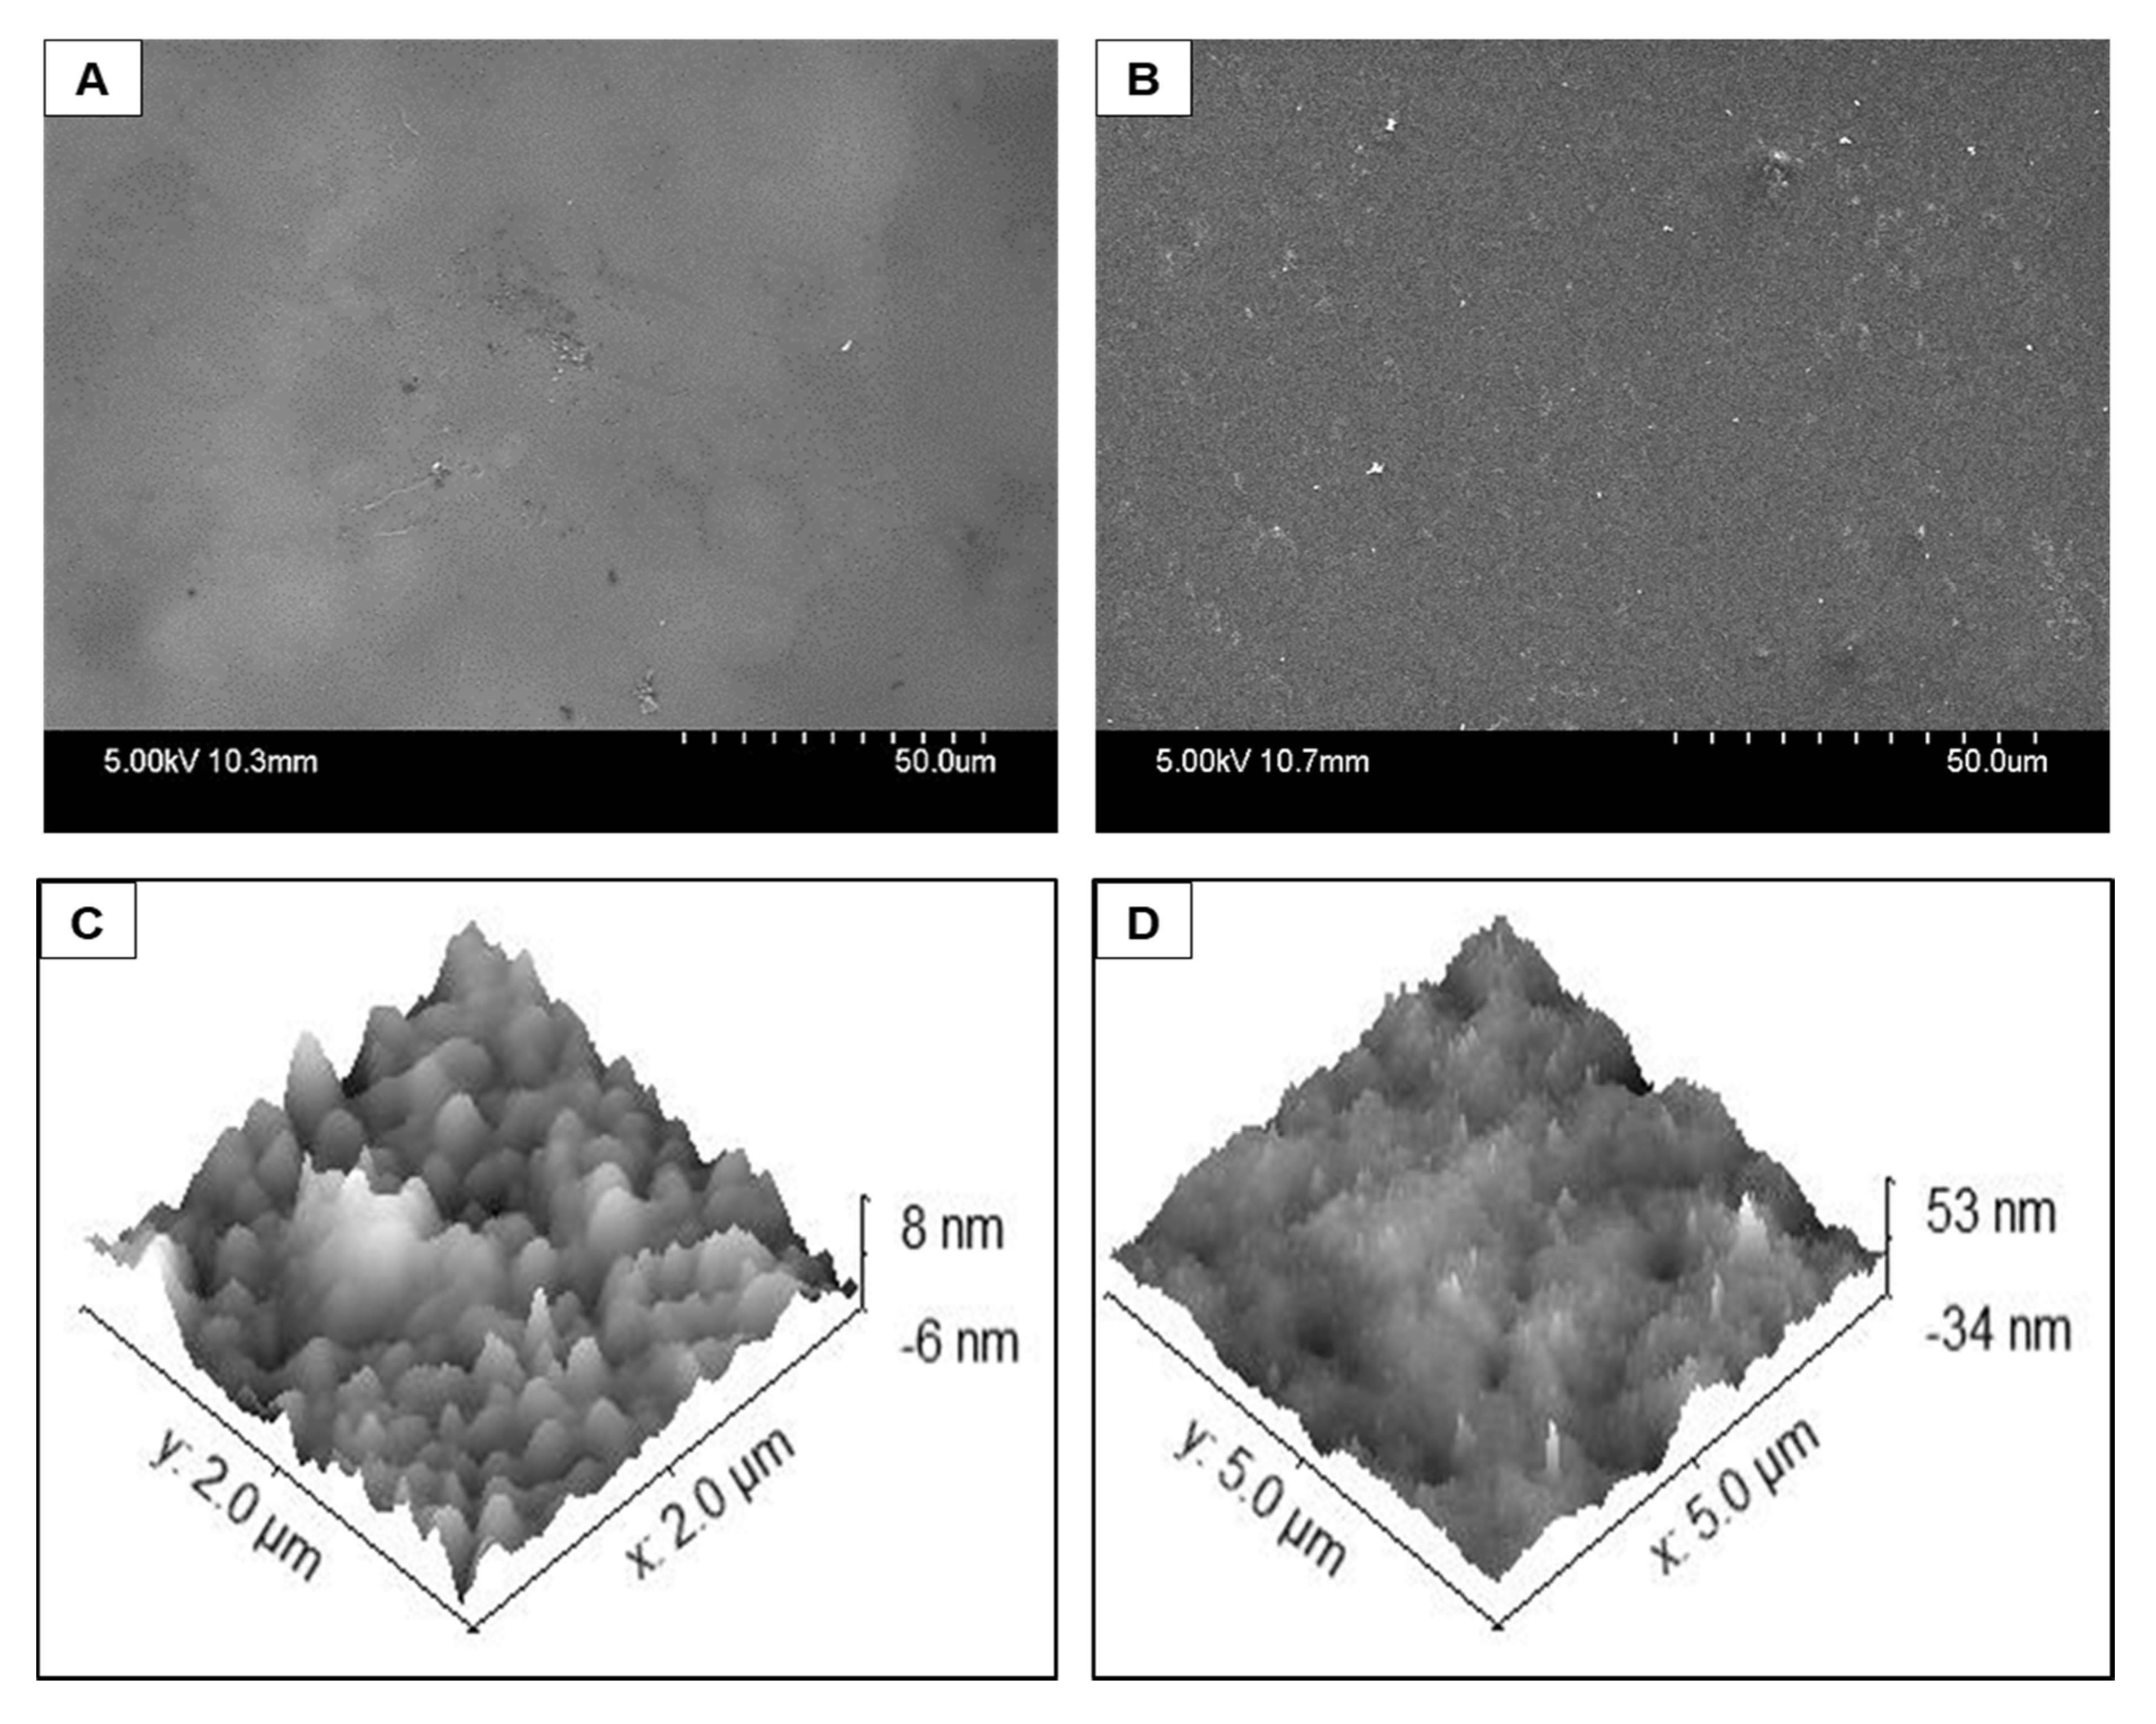
Figure 9A,B shows the SEM images of the plasma deposition method and the wet chemical method on gold, respectively. For the plasma deposited collagen film, similar shadowing to the polystyrene plates was observed on the surface, indicating a similar change in the texture occurred on both substrates. For the wet chemical deposition, the shadowing was also present, but additional larger features are present perhaps due to some aggregation of collagen fibrils in the deposition solution.
Figure 9C,D shows the AFM images of the plasma deposition and wet chemical deposition, respectively, on a gold surface. The plasma deposited film shows a continuous layer with features less than 10 nm in height and was very similar to the plasma deposited collagen film on the polystyrene substrate. The wet chemical film on gold again produced rougher features of 50–60 nm in height. Overall, the SEM and AFM imaging confirm the presence of continuous collagen films on both the polystyrene and gold surfaces but that the plasma deposited films contain less protein aggregates and they are of a smaller size than the wet chemical method.
By using redox probes in solution that have different physical dimensions and charges, electrochemical techniques such as cyclic voltammetry can provide powerful insights into the coverage of thin films and their barrier properties. For example, the isoelectric potential of collagen is typically approximately 4.7 [
33] so that at the neutral pH used here, it is expected to be negatively charged and so the film is likely to repel the negatively charged ferrocyanide probe and perhaps preconcentrate the positively charged ruthenium hexamine probe.
Ferricyanide [Fe(CN)
6]
4−/5−, ferrocene methanol [FcMeOH]
0/1+, and ruthenium hexamine [Ru(NH
3)
6]
2+/3+ were used to investigate size and charge effects. As well as the barrier properties, by varying the scan rate, the rate of heterogeneous electron transfer across the electrode/film interface can be measured which depends strongly on the interfacial properties [
34]. At bare gold, each of the electroactive probes gave voltammetric responses that were consistent with those expected for reversible electron transfer reactions involving a solution phase reagent. These voltammograms were fitted to a reversible model under semi-infinite linear diffusion control by varying the standard heterogeneous electron transfer rate constant, k
o’, so as to minimize the sum square residuals between the experimental and model currents.
The other model inputs, i.e., the diffusion coefficient of the probe in solution and its formal potential, E
o’, were extracted from the experimental cyclic voltammograms recorded at slow scan rates so that the responses were not influenced by the rate of heterogeneous electron transfer. In all cases, the peak currents were within 3% of the experimental values and the anodic, E
pa, and cathodic, E
pc, peak potentials were reproduced to within 5 mV. As shown in
Table 2, the rate of heterogeneous electron transfer depends significantly on the identity of the probe used.
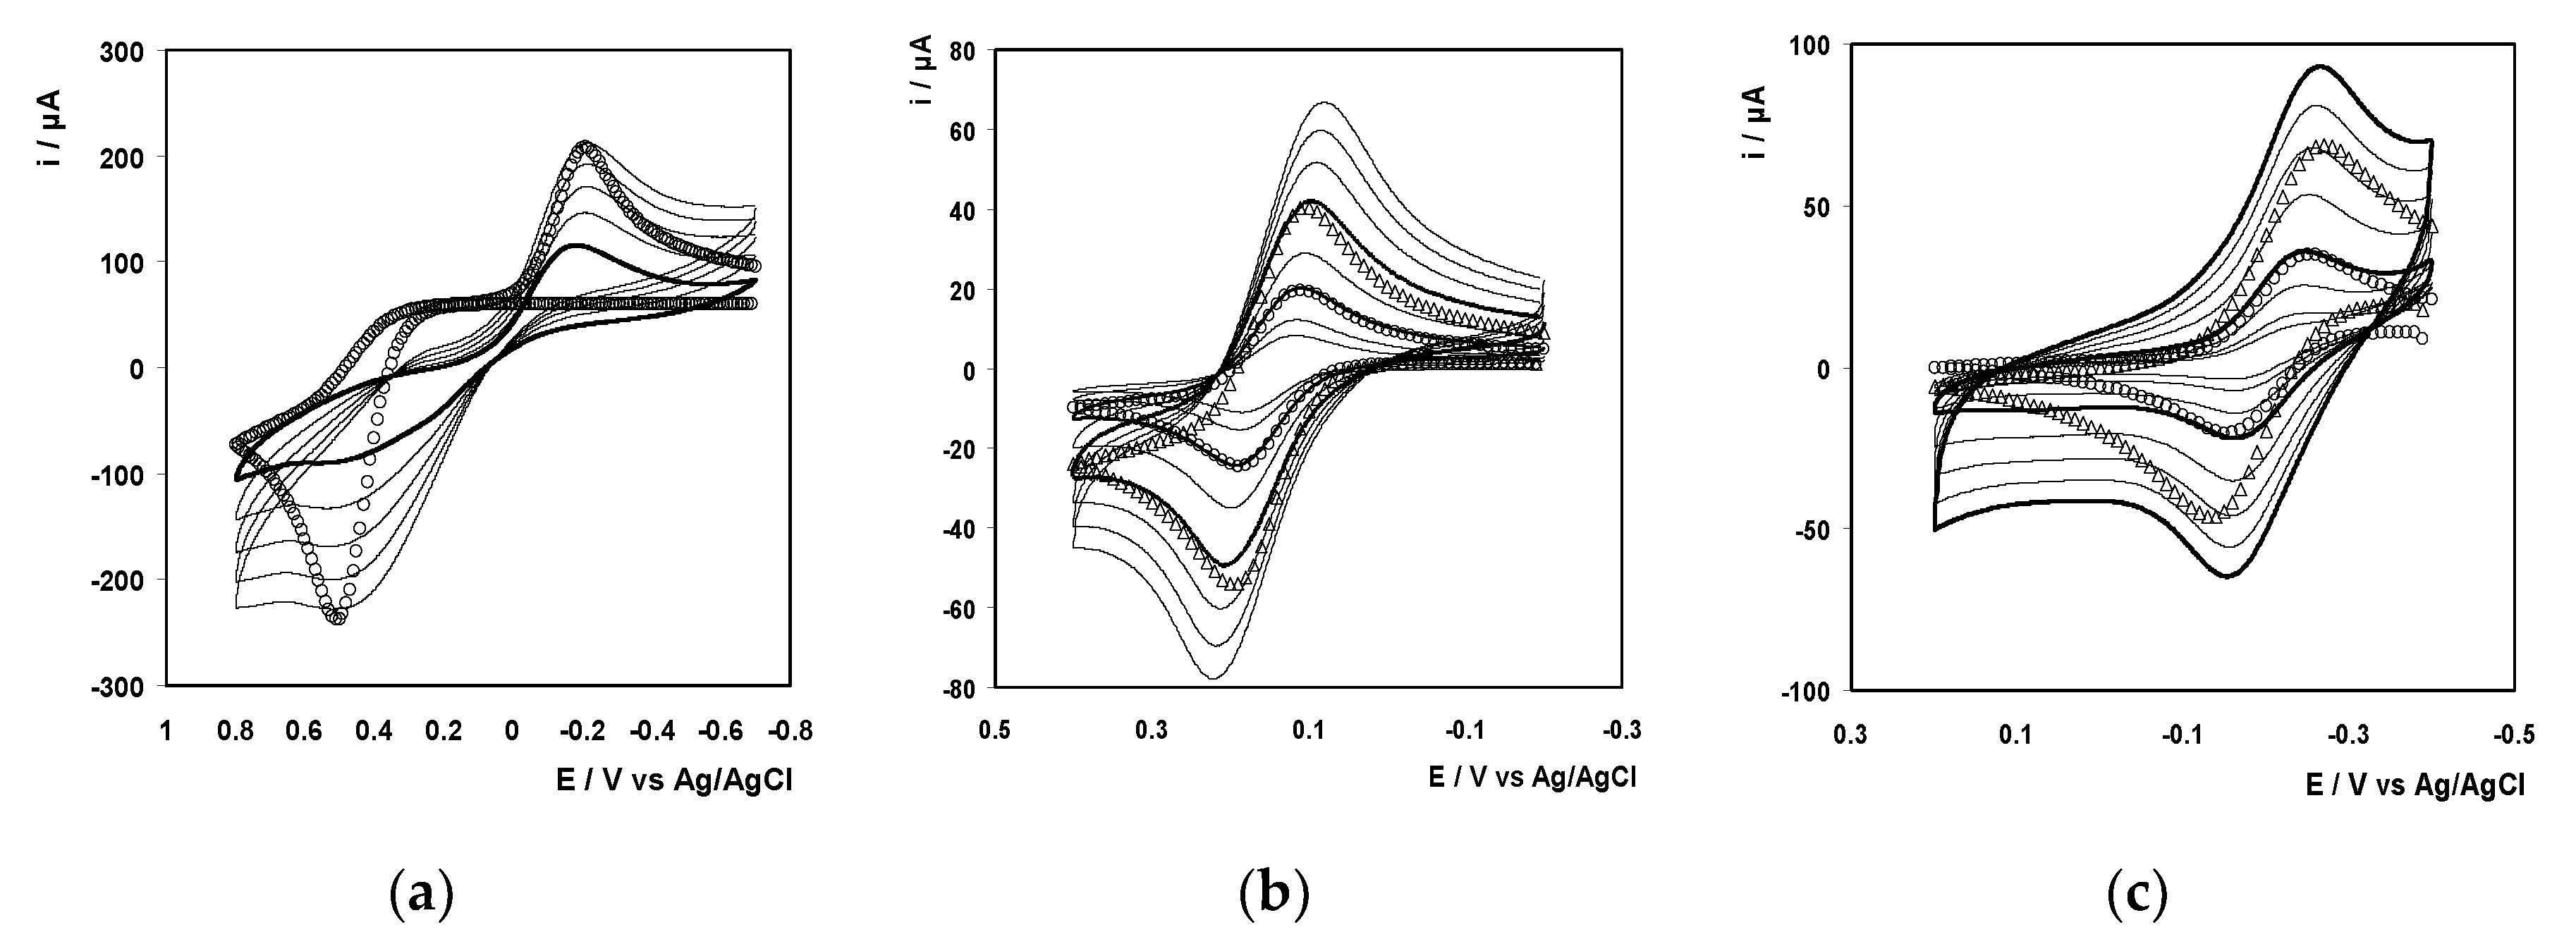
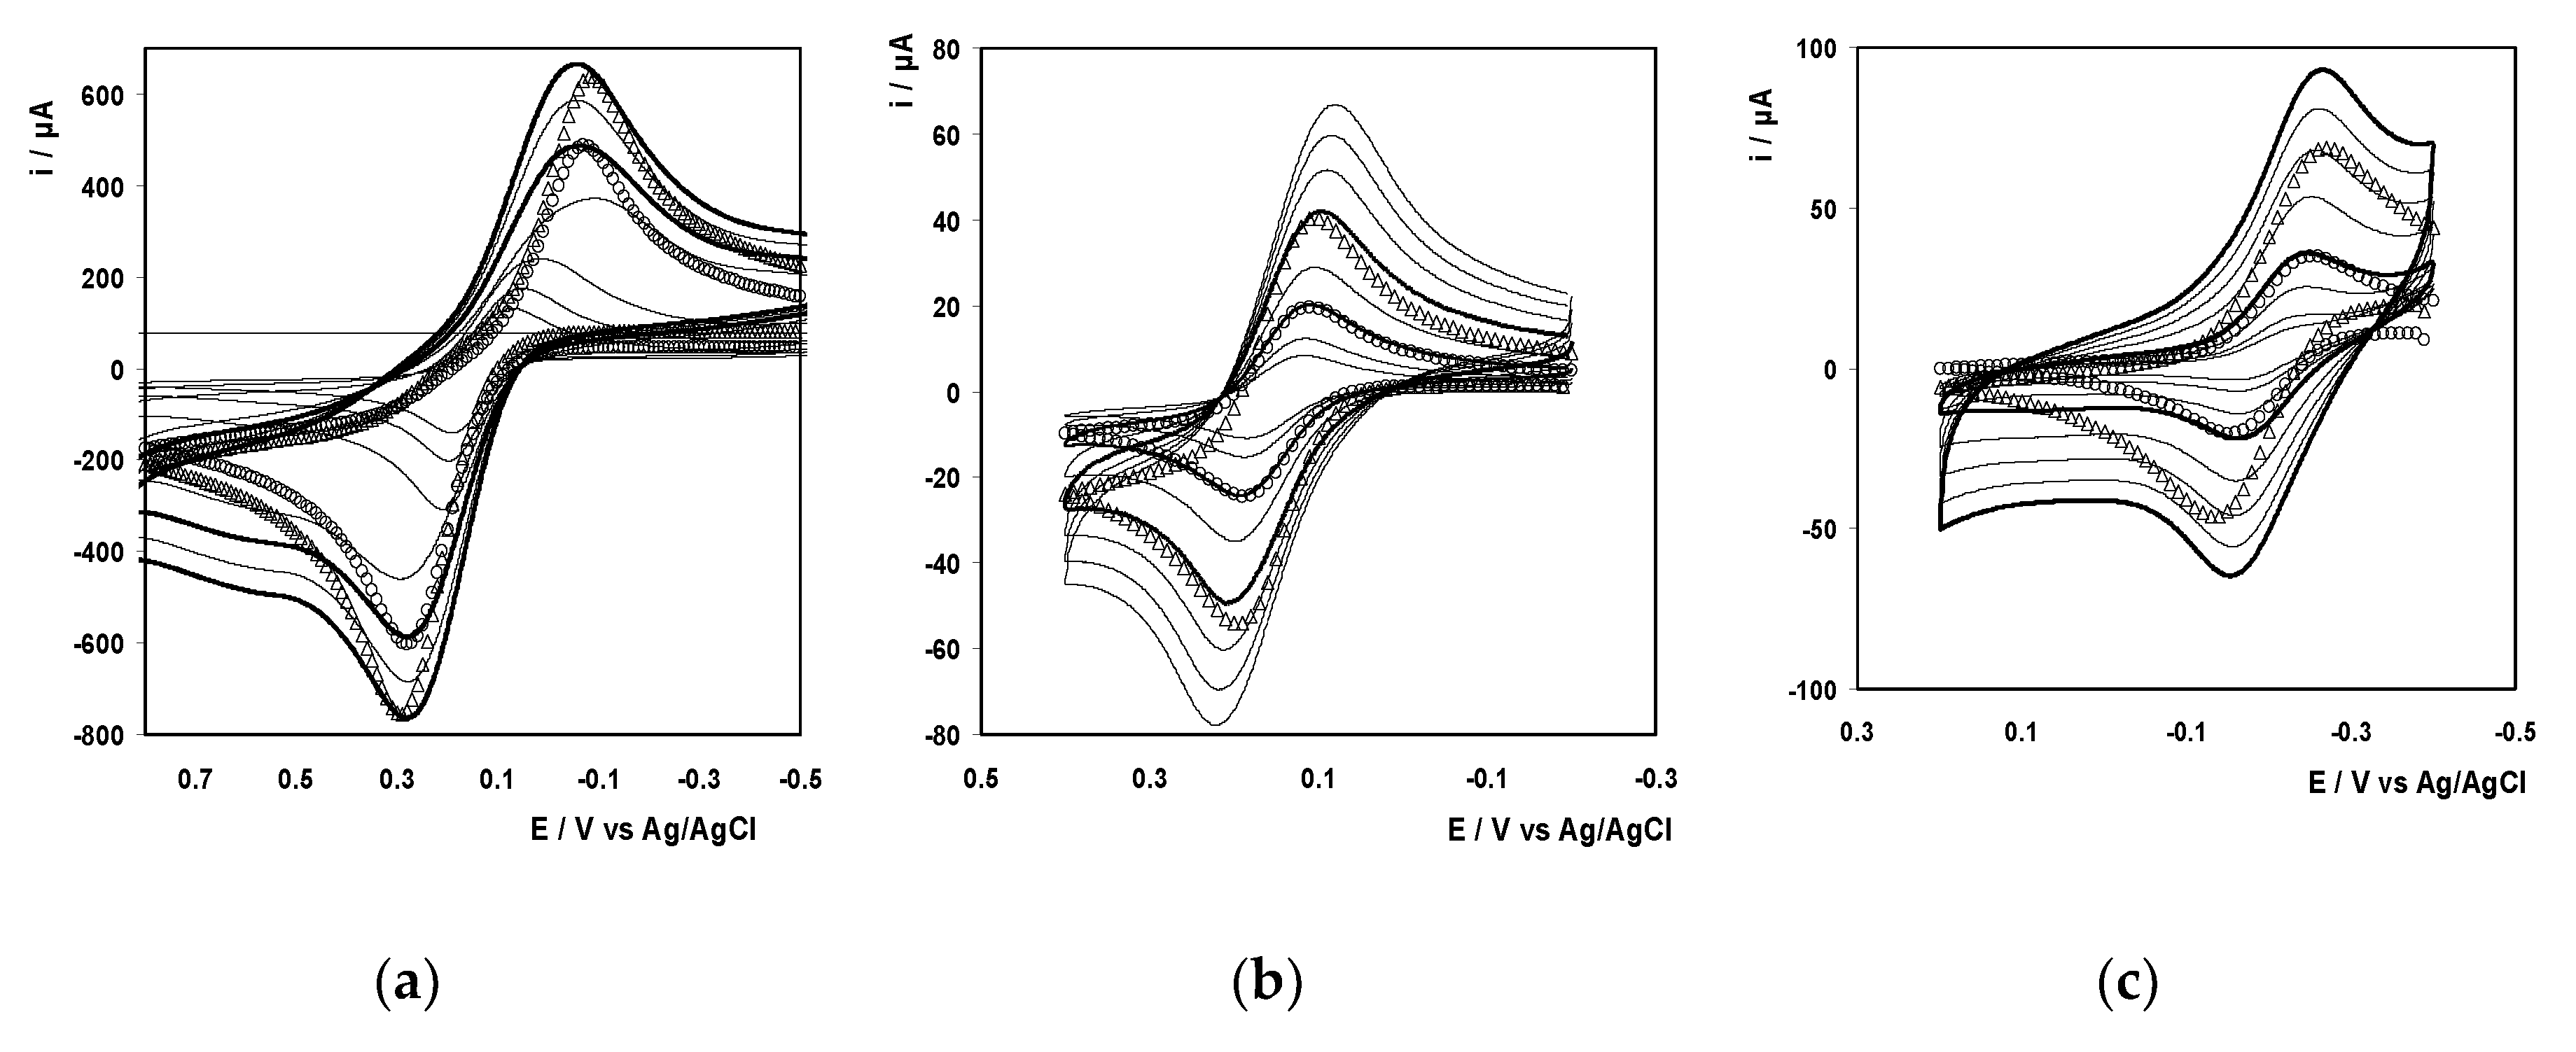
Cyclic voltammograms were taken for each of the electroactive probes at the gold electrode modified with a rat tail collagen film, using the wet chemical deposition method. The effect of film formation on the general properties of the voltammetric response depends markedly on the identity of the probe. For example, for ferrocyanide at a scan rate of 500 mV/s, the difference between E
pa and E
pc, i.e., ΔE
p, increases by more than 180 mV following collagen deposition. The CVs obtained at the collagen modified electrodes were also fitted to a classical diffusion-controlled model and the best fits are shown as open circles in
Figure 10. In fitting these voltammograms, reproducing the experimental peak potentials is achieved by varying k
o’ and in all cases satisfactory agreement between experimental and model peak potentials is obtained.
Significantly, while ko’ for the ferrocene methanol and ruthenium hexamine agrees with the bare electrode value to within experimental error, the electron transfer rate constant for ferrocyanide is approximately 20 times lower at the collagen modified surface. This result does not arise because of differences in mass transport between bare and coated electrodes and suggests that electron transfer occurs through the nonconducting collagen layer. The impeding of electron transfer could arise due to electrostatic repulsion of the negatively charged probe by the negatively charged collagen layer or physical blocking by a continuous, nonporous film.
For ferrocene methanol and ruthenium hexamine, the model accurately reproduces the general features of the voltammogram as well as the peak potentials. In contrast, for ferrocyanide, the experimental currents away from the peak potentials deviate from those predicted by the model indicating that the collagen film changes the nature of mass transport to the electrode surface. However, to reproduce the experimental peak currents for all three probes, a normalization factor was required. This factor reflects changes in the area available for electron transfer as well as changes in the interfacial concentration of the probe, e.g., repulsion of ferrocyanide and preconcentration of ruthenium hexamine. For both the ferrocyanide and ferrocene methanol, the normalization factors are less than unity, 0.80 and 0.70, respectively, i.e., the experimental peak currents are lower than predicted. This result suggests that the effective electrode area and/or the interfacial concentration of the probes are lower compared to the bare electrode. In contrast, the factor for ruthenium hexamine is 1.1 suggesting that the positively charged probe preconcentrates in the negatively charged collagen film and, based on the indistinguishable bare and coated ko’ values, undergoes facile electron transfer.
Figure 11 illustrates voltammograms obtained at electrodes functionalized with the plasma deposited collagen film. The k
o’ values for ferrocene methanol and ruthenium hexamine are within 20% of those found at the bare electrode. This result suggests that the plasma deposited collagen film does not present a significant barrier to electron transfer. However, the normalization factors are both less than unity, 0.51 and 0.58, respectively. Given that the film is negatively charged and at the charges are 0/1+ and 2+/3+ for ferrocene and ruthenium hexamine, respectively, it seems unlikely that the interfacial concentration would be lower than that found at a bare electrode. Thus, it appears that the area available for electron transfer at the plasma deposited collagen film is approximately 50–60% of the corresponding bare electrode. For ferrocyanide, the rate of electron transfer is actually higher at the plasma deposited layer, 4.12 ± 0.32 × 10
−4 s
−1, compared to either the bare, 1.60 ± 0.12 × 10
−4 s
−1, or wet chemical collagen film, 8.10 ± 10
−6 s
−1, suggesting that the plasma deposited collagen film increases the rate of heterogeneous electron transfer perhaps by changing the reorganization energy due to changes in solvation. These effects will be more pronounced for ferrocyanide given that it undergoes an inner sphere electron transfer reaction whereas the other two probes are outer sphere. The normalization factor for the plasma deposited collagen film, 0.82, is indistinguishable from that found for the wet chemical films, 0.80.
The combined results indicate that employing this plasma deposition process produced collagen films that show generally similar properties to those produced using conventional wet chemical processes in terms of their overall charge and porosity. However, the electron transfer properties of the plasma deposited films are superior to those of the wet chemical films for the negatively charged, inner sphere couple, [Fe(CN)6]4−/3−, where the electron transfer rate is enhanced by a factor of approximately 2.6 compared to the bare electrode.
Cell Culture
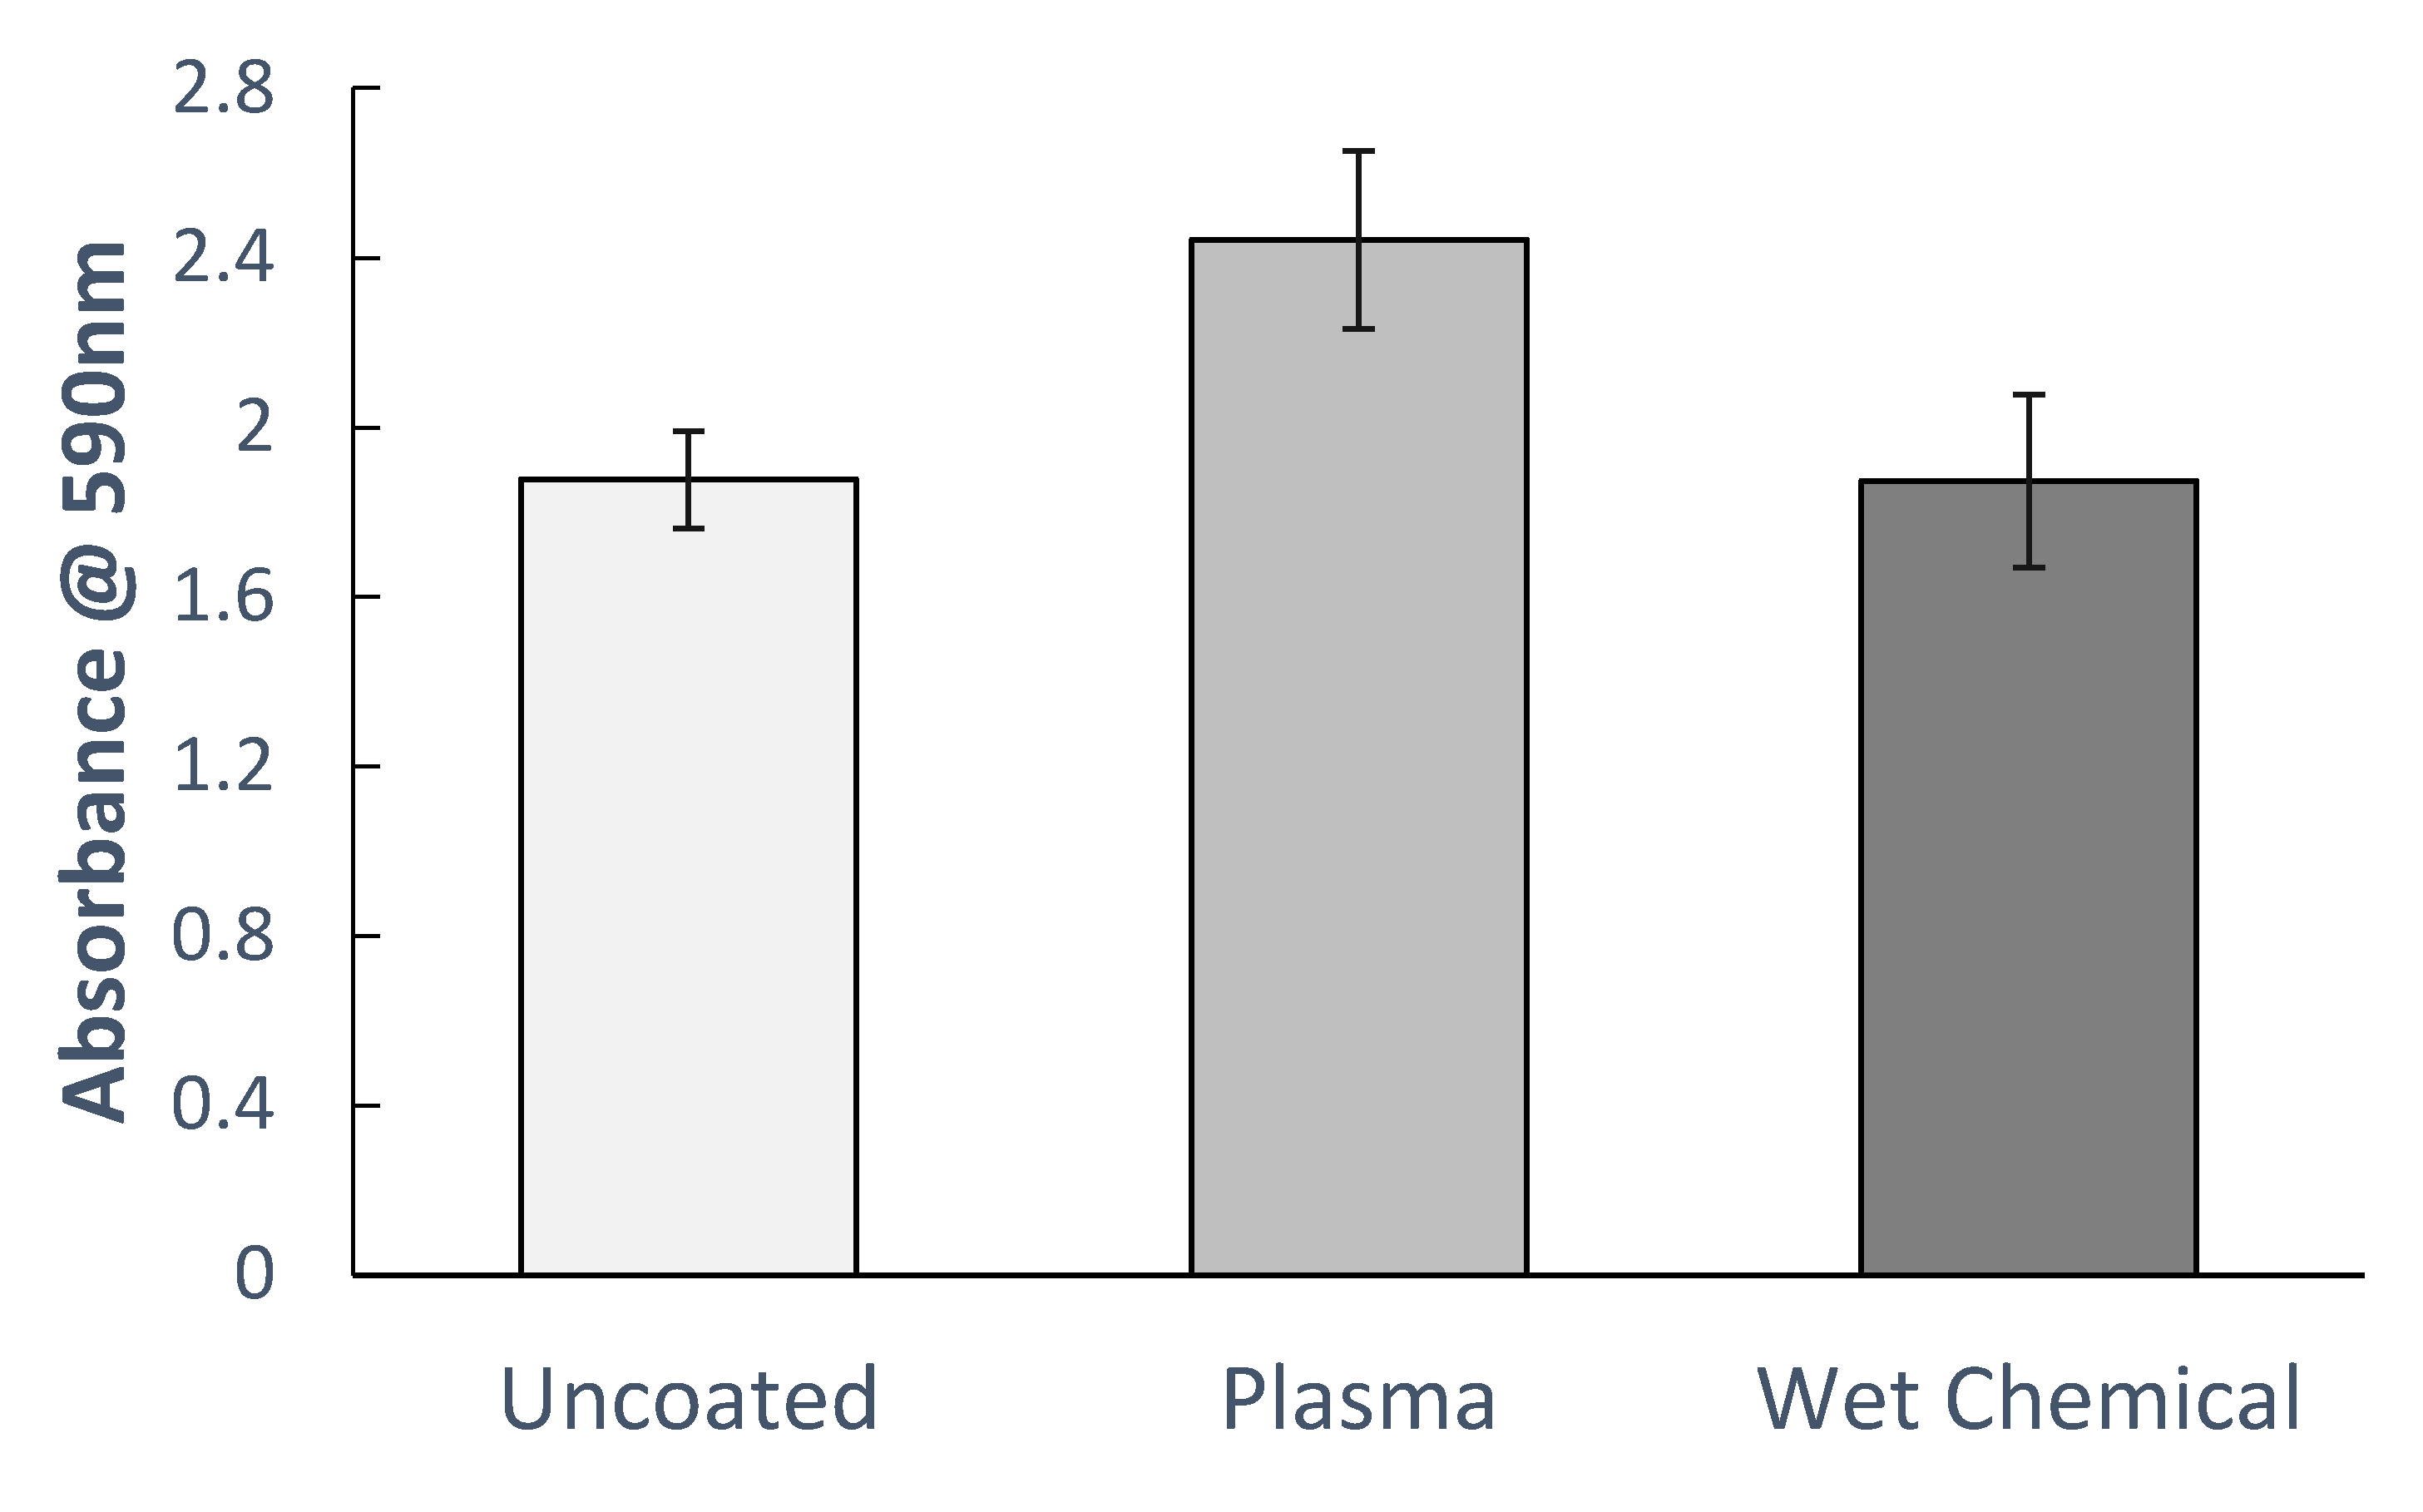
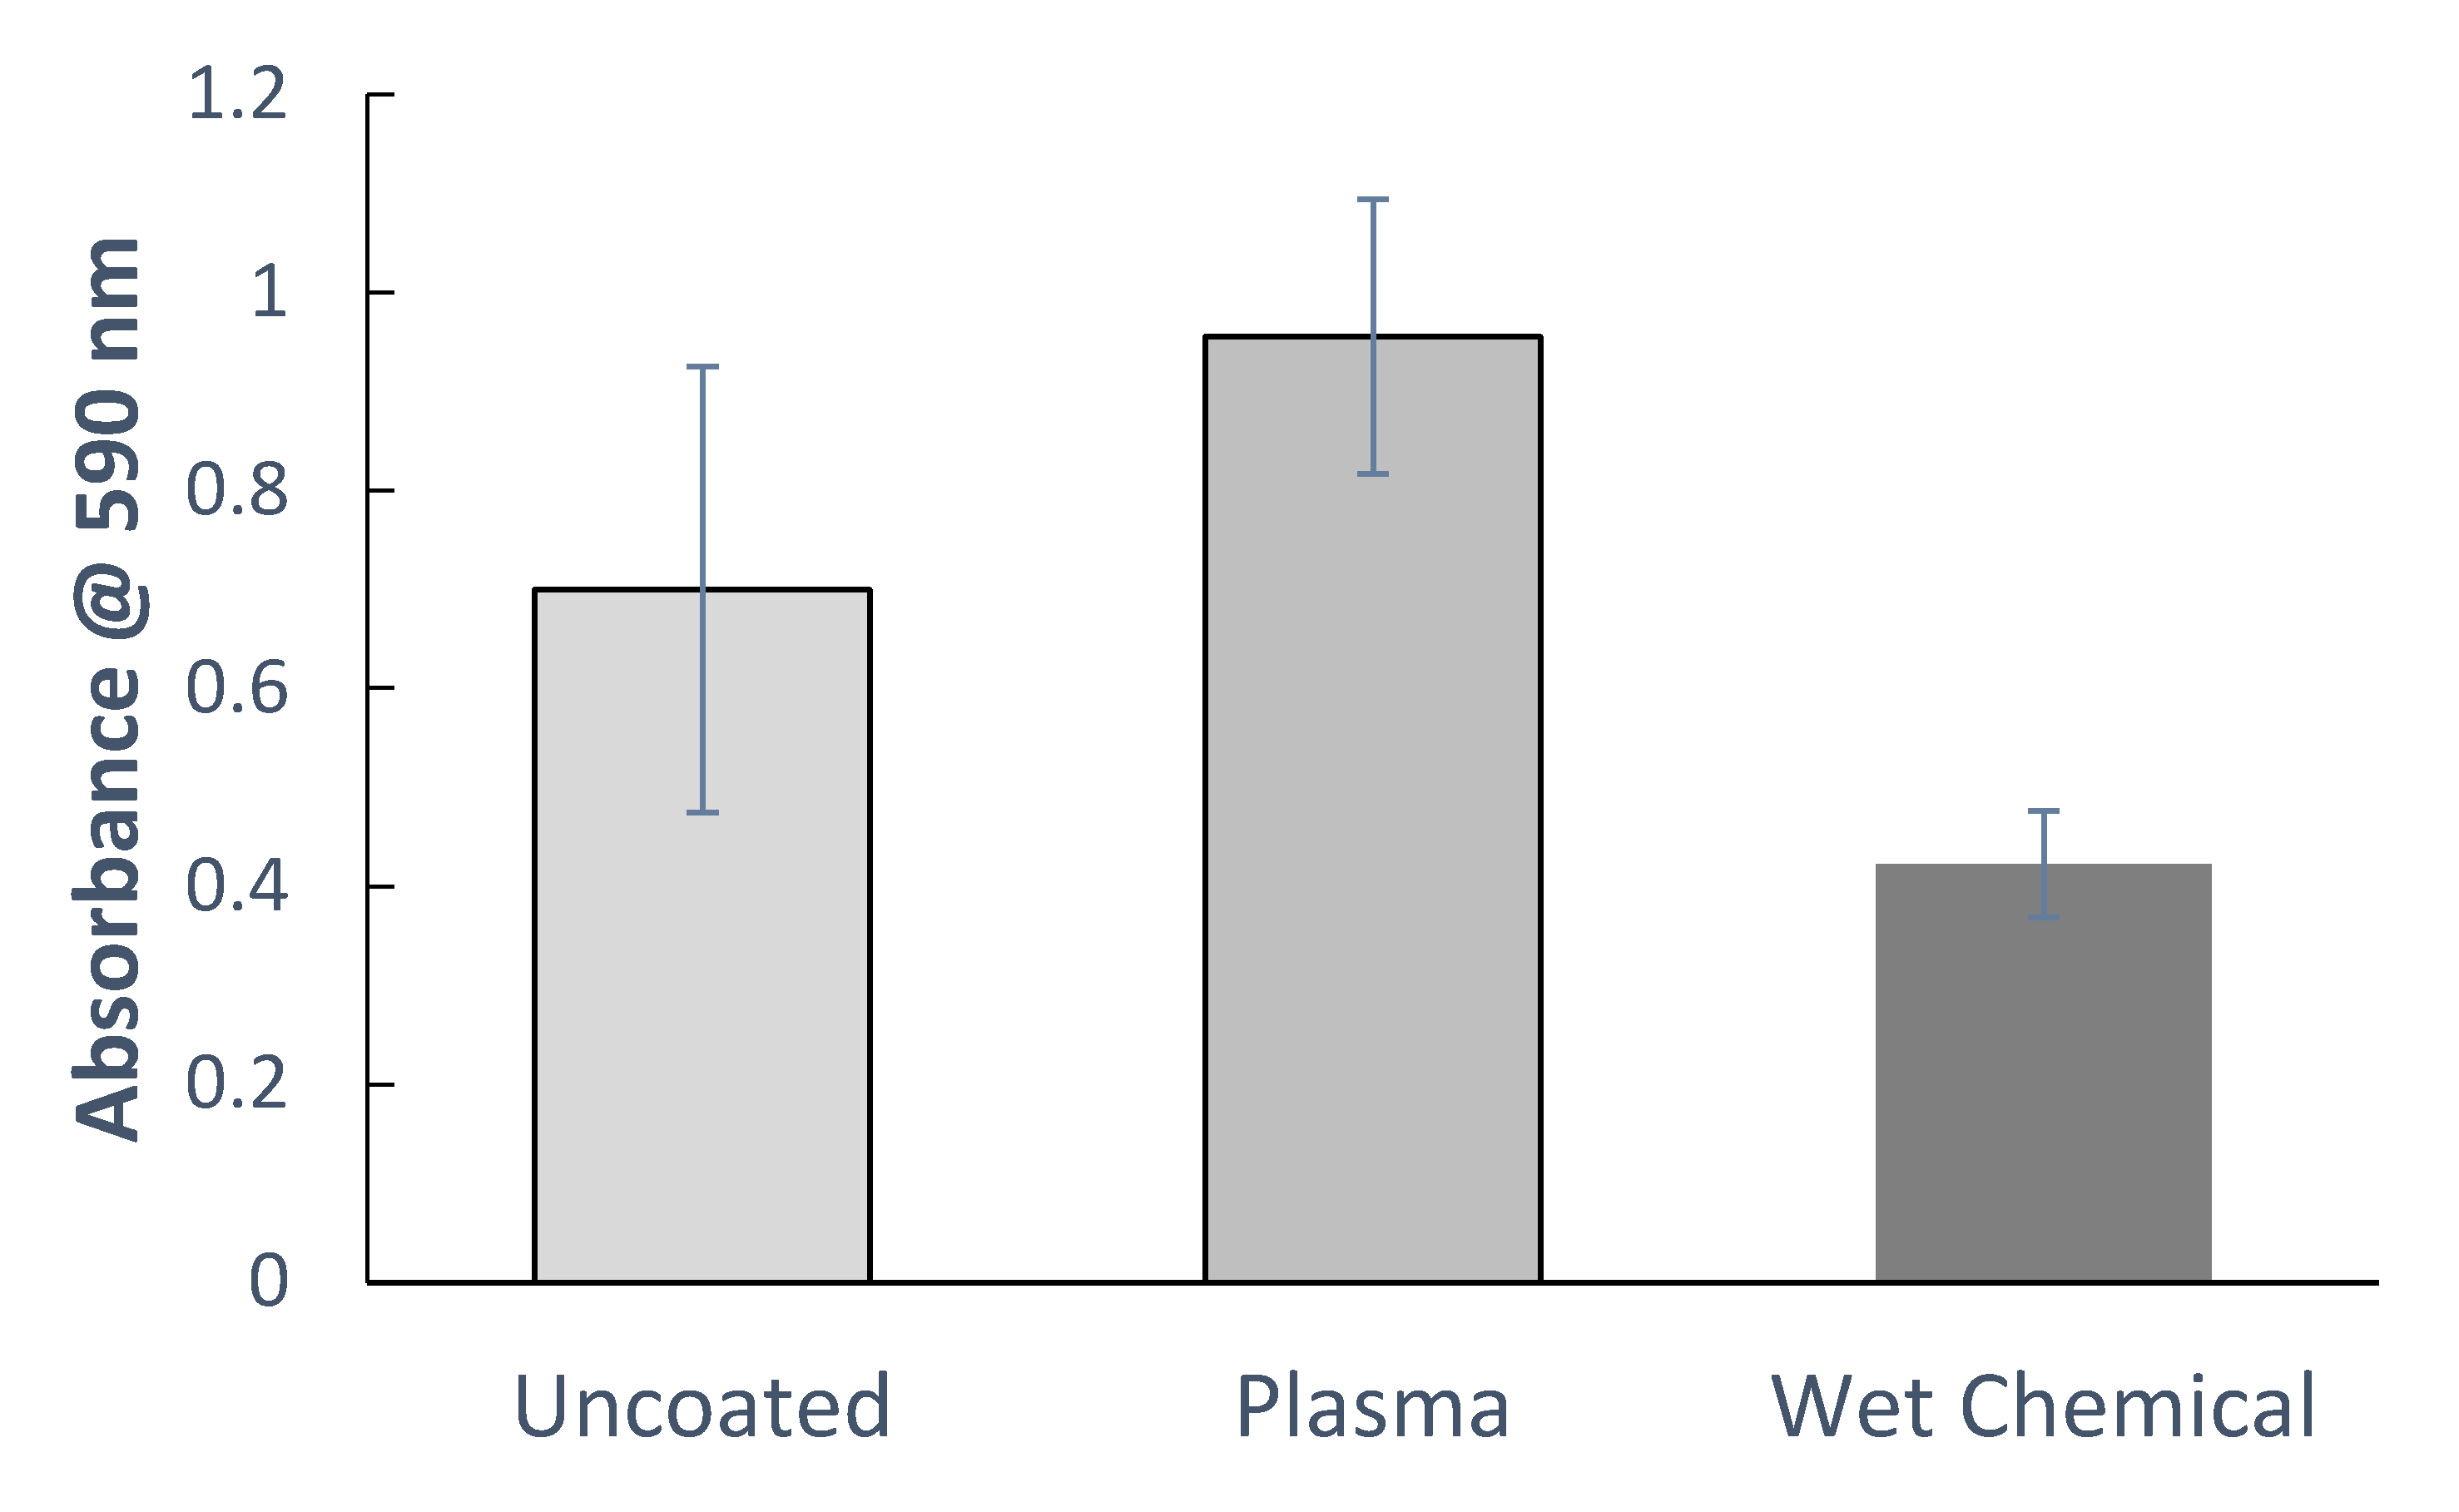
A series of collagen functionalized microplates were prepared using a controllable plasma deposition process and the traditional wet chemical protocol, with untreated polystyrene microplates used as controls. All plates were seeded with cells and the metabolic activity was determined after 24 h using the MTT assay. This assay measures the metabolic activity of the cells present and acts as a proxy for cell proliferation and activity [
35]. The absorbance readings demonstrated that the metabolic activity for cells seeded onto plasma deposited plates significantly exceeded that of cells seeded onto control polystyrene or wet chemical prepared collagen plates for both HeLa (
p < 0.01) and HepG2 cell lines (
p < 0.05) (
Figure 12 and
Figure 13).
4. Discussion
The electrical and optical emission data demonstrates the formation of a nonthermal helium plasma discharge. There was no evidence of high energy streamers or arcs detected and the current measurements were consistent with a glow like discharge [
28]. Given the absence of high energy arcs, the delivered power within the system was significantly less than 10 W. This low power regime limited the potential for the plasma discharge to fragment or disrupt any molecules it may contact. Such systems have previously been shown to be capable of producing controlled soft polymerization [
13,
14,
15,
16]. As evidenced by OES, the reactive nitrogen species present within the plasma were quenched by the introduction of the aqueous aerosol mist, which minimized any destructive species within the plasma. Numerous publications have now determined that such atmospheric helium plasma systems are capable of depositing functionally intact coatings on a range of surfaces [
21]. Recent studies have shown that such plasma systems are also capable of depositing functional biological coatings [
22] and in particular collagen coatings [
23,
36]. This may be in part limited to the transient nature of the contact with the helium plasma, which minimizes the potential for process mediated structural modifications. Previous studies of how proteins interact following prolonged exposure to helium plasma jets have suggested that the plasma can induce reactions involving the thiol group of cysteine residues [
37]. However, no evidence of such reactions has been detected at this point in this deposition system. As the structure and biological activity of the protein has been maintained without measurable denaturation, it is unlikely that the hydrogen bonding within the molecule has been degraded. Instead, the coagulation may simply involve hydrogen bond formation between adjacent native protein molecules in the deposited layer [
38]. Although still speculative, such a mechanism would result in a thin film coating in which the biological activity of the protein is maintained, and the collagen layers deposited by the plasma systems have been shown to promote biological responses and are biocompatible in a manner expected from the native protein.
The surface analysis strongly supports the creation of a continuous nanolayer of collagen on the surface and this layer is comparable to the collagen layer produced through traditional bench top wet chemical techniques. No evidence of adverse altered structure, porosity, coverage, chemical composition, or protein integrity was detected as a function of the plasma deposition process. The main differences between the two coating approaches are the processing time and coating thickness. The plasma process was capable of coating a microplate in under 2 min, whereas the wet chemical technique required overnight incubation under aseptic environment to produce a coating. Preliminary cell culture experiments suggest that the plasma coating will promote the proliferation of a number of cell lines and seems to outperform the wet chemical process.
Switching from a wet chemical approach to a plasma coating process offers the opportunity to replace a complex, multistep process with a single step manufacturing process with significantly higher throughput, reduced biologic usage and potential to radically reduce costs. The coating applied herein took less than 100 s per plate and used less than 5% of the collagen solution when compared to the traditional approach. This opens the possibility for large area, aseptic manufacturing systems to be replaced with a controllable, cost effective, compact plasma device with flexibility for biologic coatings. This work was limited to collagen, however, further validation with other proteins and molecular structures are required to challenge the full flexibility of this low power deposition process.
Significantly, this approach may also be applicable to wound care. By using a cold atmospheric pressure plasma device to deposit biologics, it may be possible to combine the benefits of plasma medicine [
39,
40,
41,
42,
43] with targeted local delivery of biologic therapeutics at a wound site [
36]. Such an approach could allow for significant benefits across a range of clinical conditions.

 ,
, 


