Article

Analysis of Local Damages Effect on Mechanical Responses of Underwater Shield Tunnel via Field Testing and Numerical Simulation

1
State Key Laboratory of Geomechanics and Geotechnical Engineering, Institute of Rock and Soil Mechanics, Chinese Academy of Sciences, Wuhan 430071, China
2
School of Engineering Science, University of Chinese Academy of Sciences, Beijing 100049, China
3
Faculty of Electrical Engineering, Mathematics & Computer Science, Delft Institute of Applied Mathematics, Delft University of Technology, Van Mourik Broekmanweg 6, 2628 XE Delft, The Netherlands
*
Author to whom correspondence should be addressed.
Appl. Sci. 2020, 10(18), 6575; https://doi.org/10.3390/app10186575
Submission received: 6 August 2020 / Revised: 4 September 2020 / Accepted: 11 September 2020 / Published: 21 September 2020
(This article belongs to the Special Issue Nondestructive Testing (NDT): Volume II)

Abstract

:
The investigation of concrete structural performance is crucial to maintain the stability of infrastructure. In order to assess structural stability, this work focuses on the development of an integrated framework to detect damaged conditions in the field and analyze their effect on mechanical performance through nondestructive testing (NDT) technology and numerical models. First, a ground penetrating radar (GPR) and an infrared camera work collaboratively to identify the damaged positions of the concrete structure, with parameters calibrated by laboratory experiments. Then, a finite element model is established to study structural mechanical performance based on field conditions and detected results. In addition, the influenced regions induced by local damage are studied under different boundary conditions. As a case study, the devised method was employed in the Nanjing Yangtze River tunnel for stability assessment and disaster prevention. The detected results of the damaged conditions agree well with the actual conditions in the field. Numerical results show that the circumferential stress component is more significant than that observed longitudinally. The effect of local damage on stress implies a positive correlation with the rise of water pressure, in which the maximum stress response to the variation of water level is 45KPa per meter.

1. Introduction

The construction of underground structures has developed rapidly in recent years and plays an important role in the development of the Chinese national economy [1]. As an important feature of infrastructure, it is of great significance to estimate the stability of concrete structures, especially for underground construction. Complicated environmental factors make underground constructions more vulnerable to external interference and can induce disasters [2,3]. Previous studies have demonstrated that the stress concentration occurs around damaged positions and induces leakage disasters [4,5]. Thus, the present study focuses on the mechanical response of a concrete structure under the effect of local damage. A typical underwater concrete structure, the Nanjing Yangtze River tunnel, was selected as a case study. Field investigation showed that damage induced by grouting hole leakage is an important factor influencing structural stability. However, there has been limited research on the detection of local damage induced by grouting holes and its influence on the overall stability of structures [6]. Numerical simulation in light of field investigation is vitally important for disaster prevention. It is of great significance to combine field investigation with mechanical response analysis [2,3,7]. Based on the current research, this work developed an integrated framework to detect the damage conditions of the concrete structure and analyze the influence of local damage on structural mechanical performance through nondestructive testing (NDT) technology and numerical models.
Our framework consists of three modules—accurate testing in the field, numerical analysis, and reliable evaluation. Accurate testing provides fundamental information for numerical modeling. The existing methods, presented in the past few years, that are used to detect the status of structures can be divided into two categories—manual testing and automatic monitoring [8,9]. Manual testing is a comprehensive method, but the testing process takes a long time. In recent years, automatic detection methods, such as sensor monitoring and automatic photographic equipment, have developed as a reliable technology to maintain the stability of tunnels [10,11]. These methods have been widely used in tunnel engineering for the detection of damage conditions [12,13]. However, these studies have mainly focused on the detection of lining cracks and segmental joint openings [6], and commonly ignore the influence of grouting holes. Based on the status of the research and the complicated field conditions, nondestructive testing (NDT) technology has been carried out to determine the local damage conditions of tunnel structures. The common application of this method is to reflect the internal status of an object without causing any damage [14,15]. According to the detection information obtained from NDT results, numerical simulation is then carried out to study the impact of local damage on structural mechanical performance. As it is one of the most important components of the framework, various numerical models have been developed in recent years. Most of these numerical models based on discrete element theory, finite element theory, and the coupling of these two theories [7,16]. The combined application of field detection results with numerical simulation is of great significance to stability assessment, which has remained an underlying problem in previous studies [17]. Along this line, in the present study, a numerical model developed on the basis of finite element theory is applied to study the structural mechanical response to local damage. In addition, the influence of local damage is discussed under different boundary conditions, including various water pressure and damage positions.
The study was structured as follows. Firstly, the methodology of the framework used for the structural stability assessment was devised. Then, the devised integrated method was employed in an underwater shield tunnel as a study case. To obtain highly reliable detected results in the field, a laboratory experiment is also carried to calibrate the testing parameters of the NDT technology. Subsequently, numerical analysis was carried out to assess the impact of local damage on structural mechanical response. Finally, as an important application, the NDT and numerical results provide a significant reference to assess the stability of the case study.

2. Methodology for Structural Stability Evaluation

The purpose of this section is to develop the framework used to evaluate the stability of a concrete structure under the effect of local damage, combining the field detection data with numerical analysis. The field detection results provide necessary information to numerical modeling. Then the numerical model is used for the investigation of mechanical behavior and stability evaluation in the following section.

2.1. Framework for Local Damage Assessment

There have been plenty of studies on the reliable techniques used to test the actual status of tunnels in the field. Furthermore, numerical simulation is a common method used to analyze the mechanical response of structures under various boundary conditions [7,9]. Numerical simulation in light of field investigation data is vitally important for preventing disasters [18], which remains a challenge. In order to overcome the existing problems, a workflow used to evaluate structure stability under the impact of local damage was developed in this study, as demonstrated in Figure 1.
Nondestructive testing (NDT) technology was adopted to detect the actual status of the structure and to determine damage positions in the field, because a number of previous studies have indicated that this method has high accuracy in testing the internal conditions of an object without causing further damage [14,19]. In order to ensure the reliability of detection results, the different wave phase patterns for the geophysical inversion results were calibrated via an experiment in advance. Based on the NDT results, numerical simulation was carried out to further analyze the impact of local damage on structural mechanical response. The effects of different water pressure and damage positions were discussed. In order to prevent disasters, reinforcement and support measures should be applied to the damaged region, which is determined through the numerical results.

2.2. Procedure of Local Damage Detection

There is no doubt that in-site detection is an irreplaceable method of evaluating structural status and preventing abnormal conditions. The existing research shows that NDT methods have developed into a reliable technology for field detection [20,21]. In recent years, tunnel accidents caused by the leakage of grouting holes have attracted attention, e.g., the leakage accident that occurred in the Nanjing Yangtze River tunnel on 24 May 2018. Unlike previous applications, we used multiple NDT equipment methods—a ground Penetrating Radar (GPR) and a thermal infrared camera—to work synergistically to detect the status of the grouting holes. This is because conditions that filled with water but did not leak out cannot be determined if only IR is used. Inversely, it is difficult to determine whether water has overflowed and whether to take supporting measures if only GPR is used. Therefore, both of these methods are indispensable. The detection procedure was formalized as shown in Figure 2. First, GPR is adopted to invert the internal conditions of grouting holes. The launcher receiver moves across the surface of a fire-proof plate from left to right. According to the differences in the filling medium in the holes, the inversion results are classified into three categories to reflect the typical conditions in the field—empty, filled with water, and filled with grout. Empty holes are defined as safe and no further testing and analysis is required. Infrared cameras locate damage by determining whether there is water leaking in holes.
The GPR is an instrument used to detect the boundaries of different mediums through electromagnetic waves [22]. The type of GPR used in the present experiment and field detection is a Zond-12e, produced by Latvia. The electromagnetic wave spreads in the semi-infinite space with a spherical surface. The practical detection zone is an ellipse, and the detection zone is related to relative permittivity, which is expressed as follows:
{ a   =   λ 4 + d ε r 1 b   =   0.5 a
where a and b are the semi-major axis and semi-minor axis of the ellipse, respectively; d is detection depth; λ is the wavelength of electromagnetic wave; and ε r is the relative permittivity.
The thermal infrared camera is used to determine the leakage position through the difference in infrared energy between water and the structure [23,24]. The type of GPR used in our study is an Inf-Rec R500, developed by Nippon Avionics company in Yokohama, Japan. The radiant energy is turned into an electrical signal and identified by the detector, calculated as follows:
{ L λ   =   L λ 1 + L λ 2 L λ 1   =   ζ λ L b λ ( T o ) L λ 2   =   ρ λ L b λ ( T u )
where L λ 1 is the radiance of the object and L λ 2 is the radiation emitted by the surroundings and reflected by the object. T u and T o are the temperature of the environment and on the surface of the object, respectively. ζ λ is surface emissivity. ρ λ is surface albedo.
If the hole is leaking, the leaking water would lower the temperature around the hole. Thus, infrared thermography would express a clear lower temperature boundary. On the contrary, if it is not leaking, the temperature distribution expressed in infrared thermography is uniform.

2.3. Numerical Analysis Based on the Field Testing Data

In this work, the beam-spring model was adopted for tunnel modeling in the framework of the finite element method (FEM), which was first proposed by Koizumi and Murakami [25]. The tunnel lining is considered as a beam model, and some special springs are arranged outside the lining of tunnel surface to simulate the influence of resistance induced by surrounding rock. The stiffness of nonlinear springs is related to the geotechnical properties of the surrounding rock. The stress-relative displacement relationship is given in Figure 3a, where u is the relative displacement of the non-linear spring, describing tensile as positive and compression as negative. F t and F c are tensile stress and compressive stress respectively. k is the stiffness factor of nonlinear springs. It is obvious that the strength of tensile and compressive springs is different, which is consistent with the properties of rock. The stress boundary conditions of the improved model are introduced according to field conditions, as shown in Figure 3b, in which water pressure and soil pressure are calculated respectively.
P i w   =   γ w h i
where γ w and hi are the unit weight of water and water level of an individual section i, respectively.
If the center point of section i is regarded as the coordinate origin, and y represents the vertical coordinate, the recommended forms of soil pressures are expressed as follows:
{ P i u p   =   j = 1 n h j ( γ j s γ w ) P i b o t   =   P i u p + G F d P i s i d e   =   j = 1 n ( h j + d 2 y ) ( γ j s γ w ) λ j
where P i u p , P i b o t , and P i s i d e represent the soil pressure located in the top, bottom, and side of the tunnel structure. n represents the number of geological layers, h j ; γ j s is thickness and unit weight of soil layer i. d is tunnel diameter. G and F are gravitational and buoyant forces, respectively.
Based on the properties of geological layers in the field, the external loads applied on the numerical model are calculated according to Equations (3) and (4). In addition, a hole is used to represent the damaged conditions determined by NDT detection, and it is defined with no mechanical properties.

3. Characteristics of the Study Site

To employ our developed integrated workflow, the Nanjing Yangtze River tunnel, a typical underground structure, was selected as a case study. The geological conditions and structural characteristics of this project are introduced in this section.

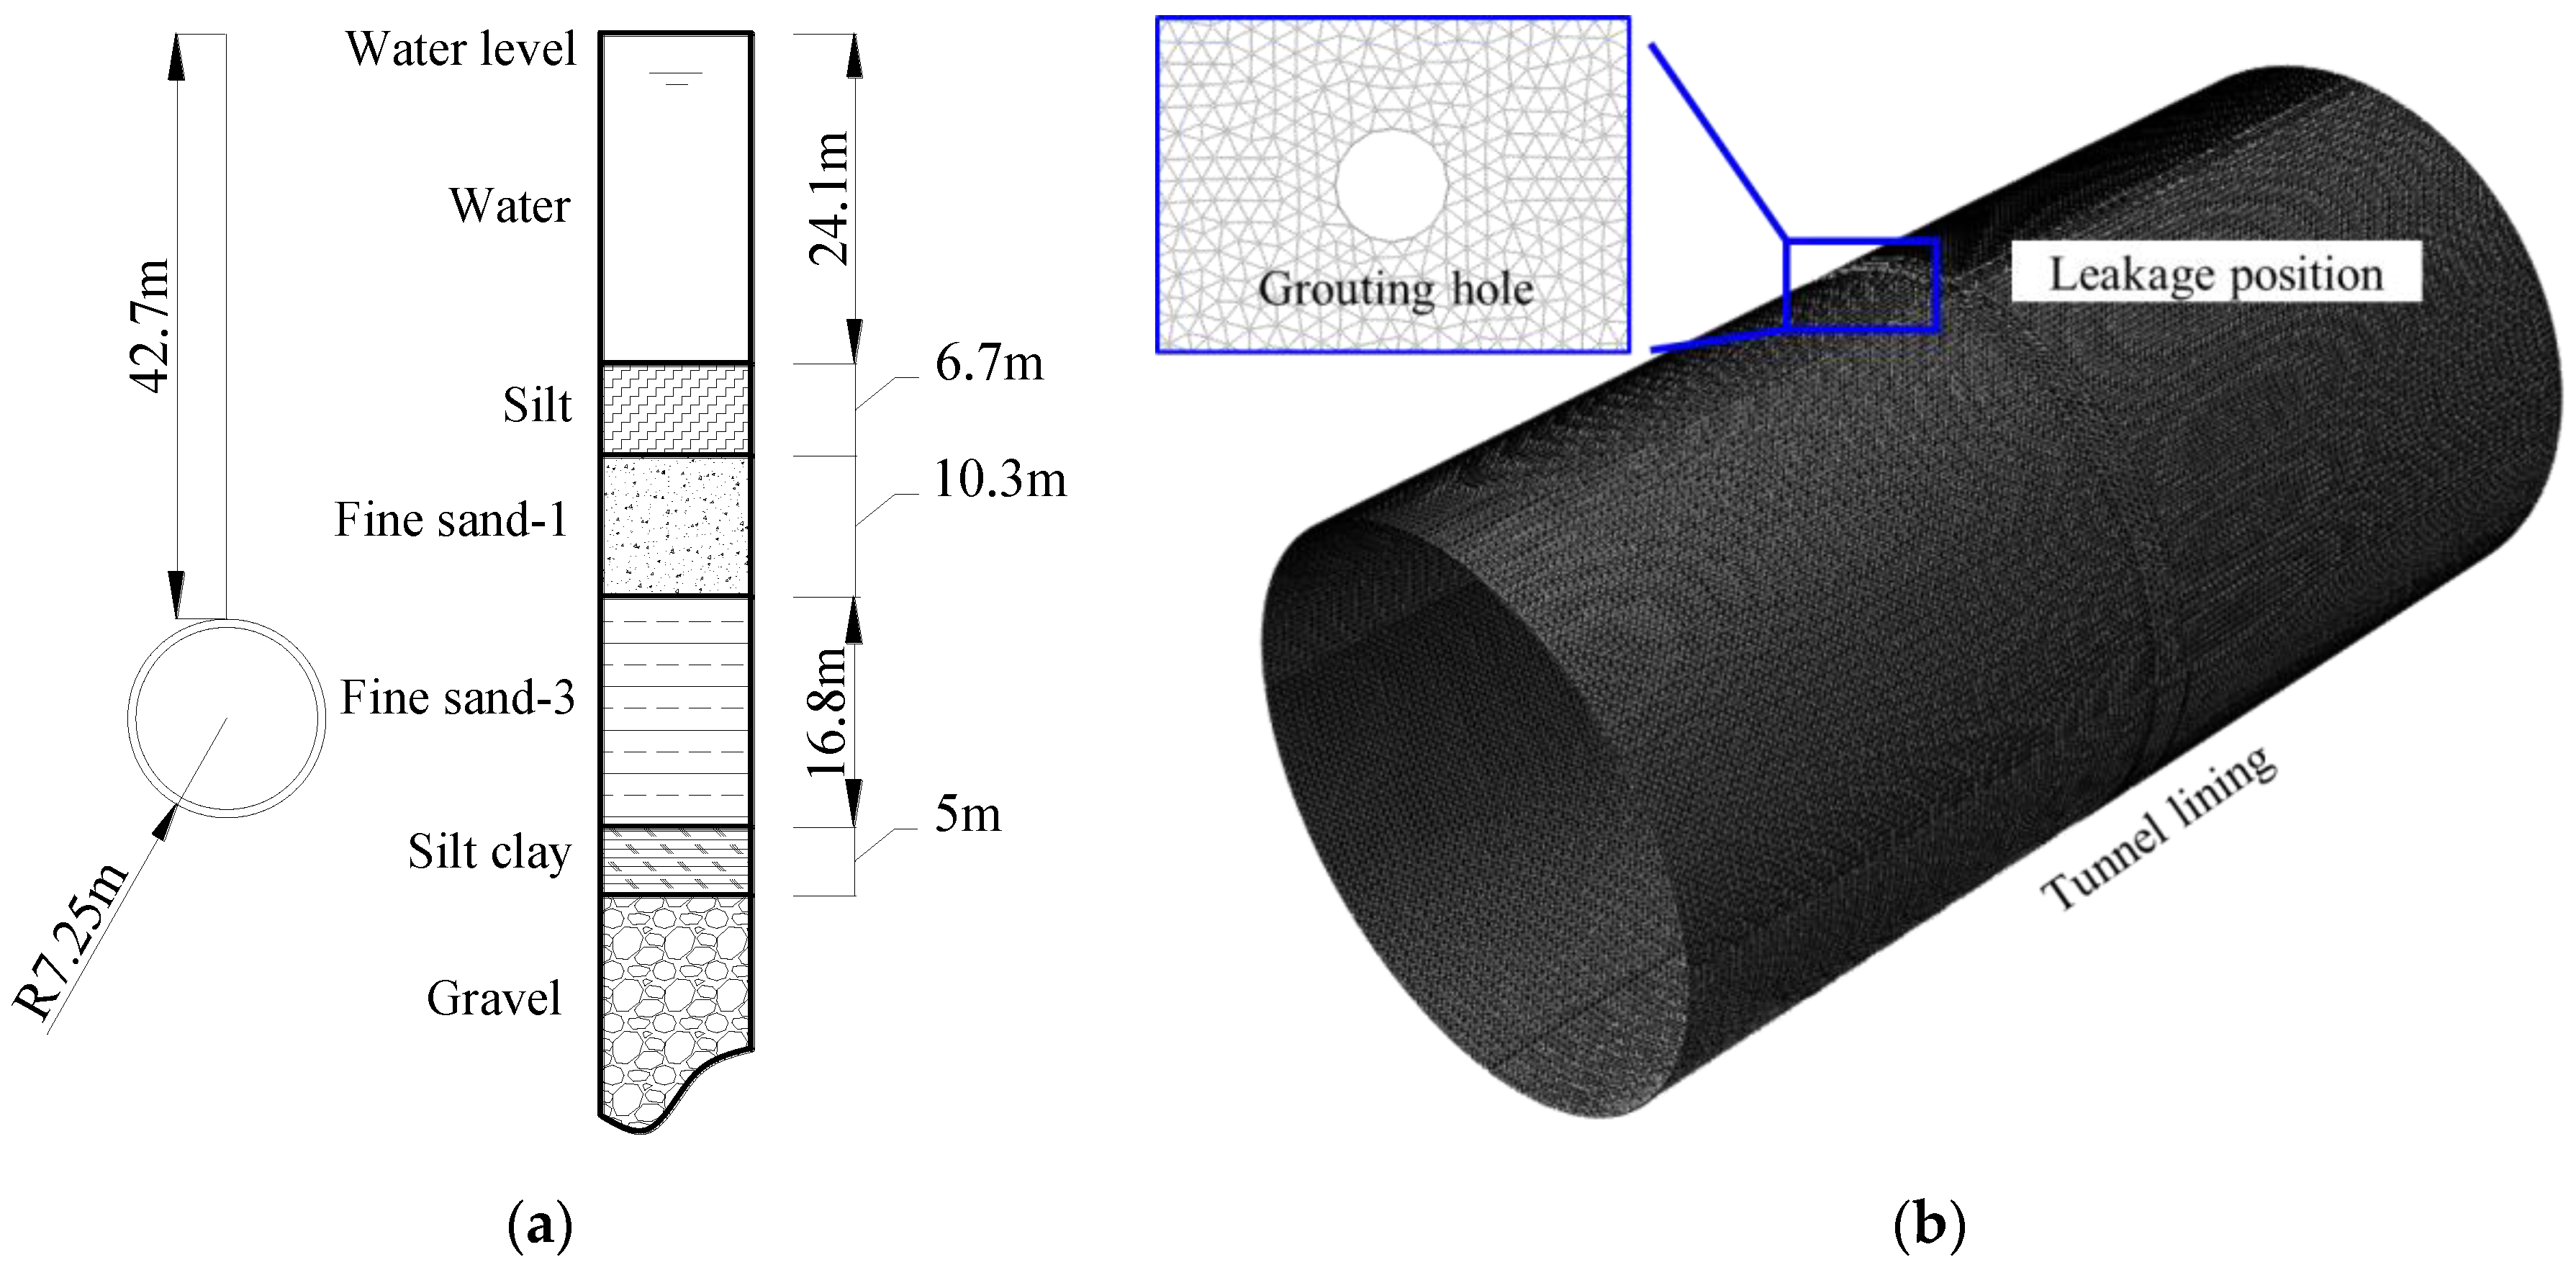
3.1. Geological Conditions

One of the longest underwater shield tunnels in the world, the Nanjing Yangtze River tunnel is located in Jiangsu province, China. The geographical coordinates of this tunnel are N 32°04′1.12″, E 118°43′27.39″. This structure is not only impressive in length, but is also famous for the complex geological strata crossed by the tunnel’s major structure and its large diameter. As shown in Figure 4, field investigation demonstrates that the main geological strata traversed by the tunnel are sand layers and clay layers, such as silty clay, medium and coarse sand, and no obvious fault structures. The topographic slope is gentle and the relative altitude difference is not more than 10 m. In addition, the highest water level in the study site is 72 m.

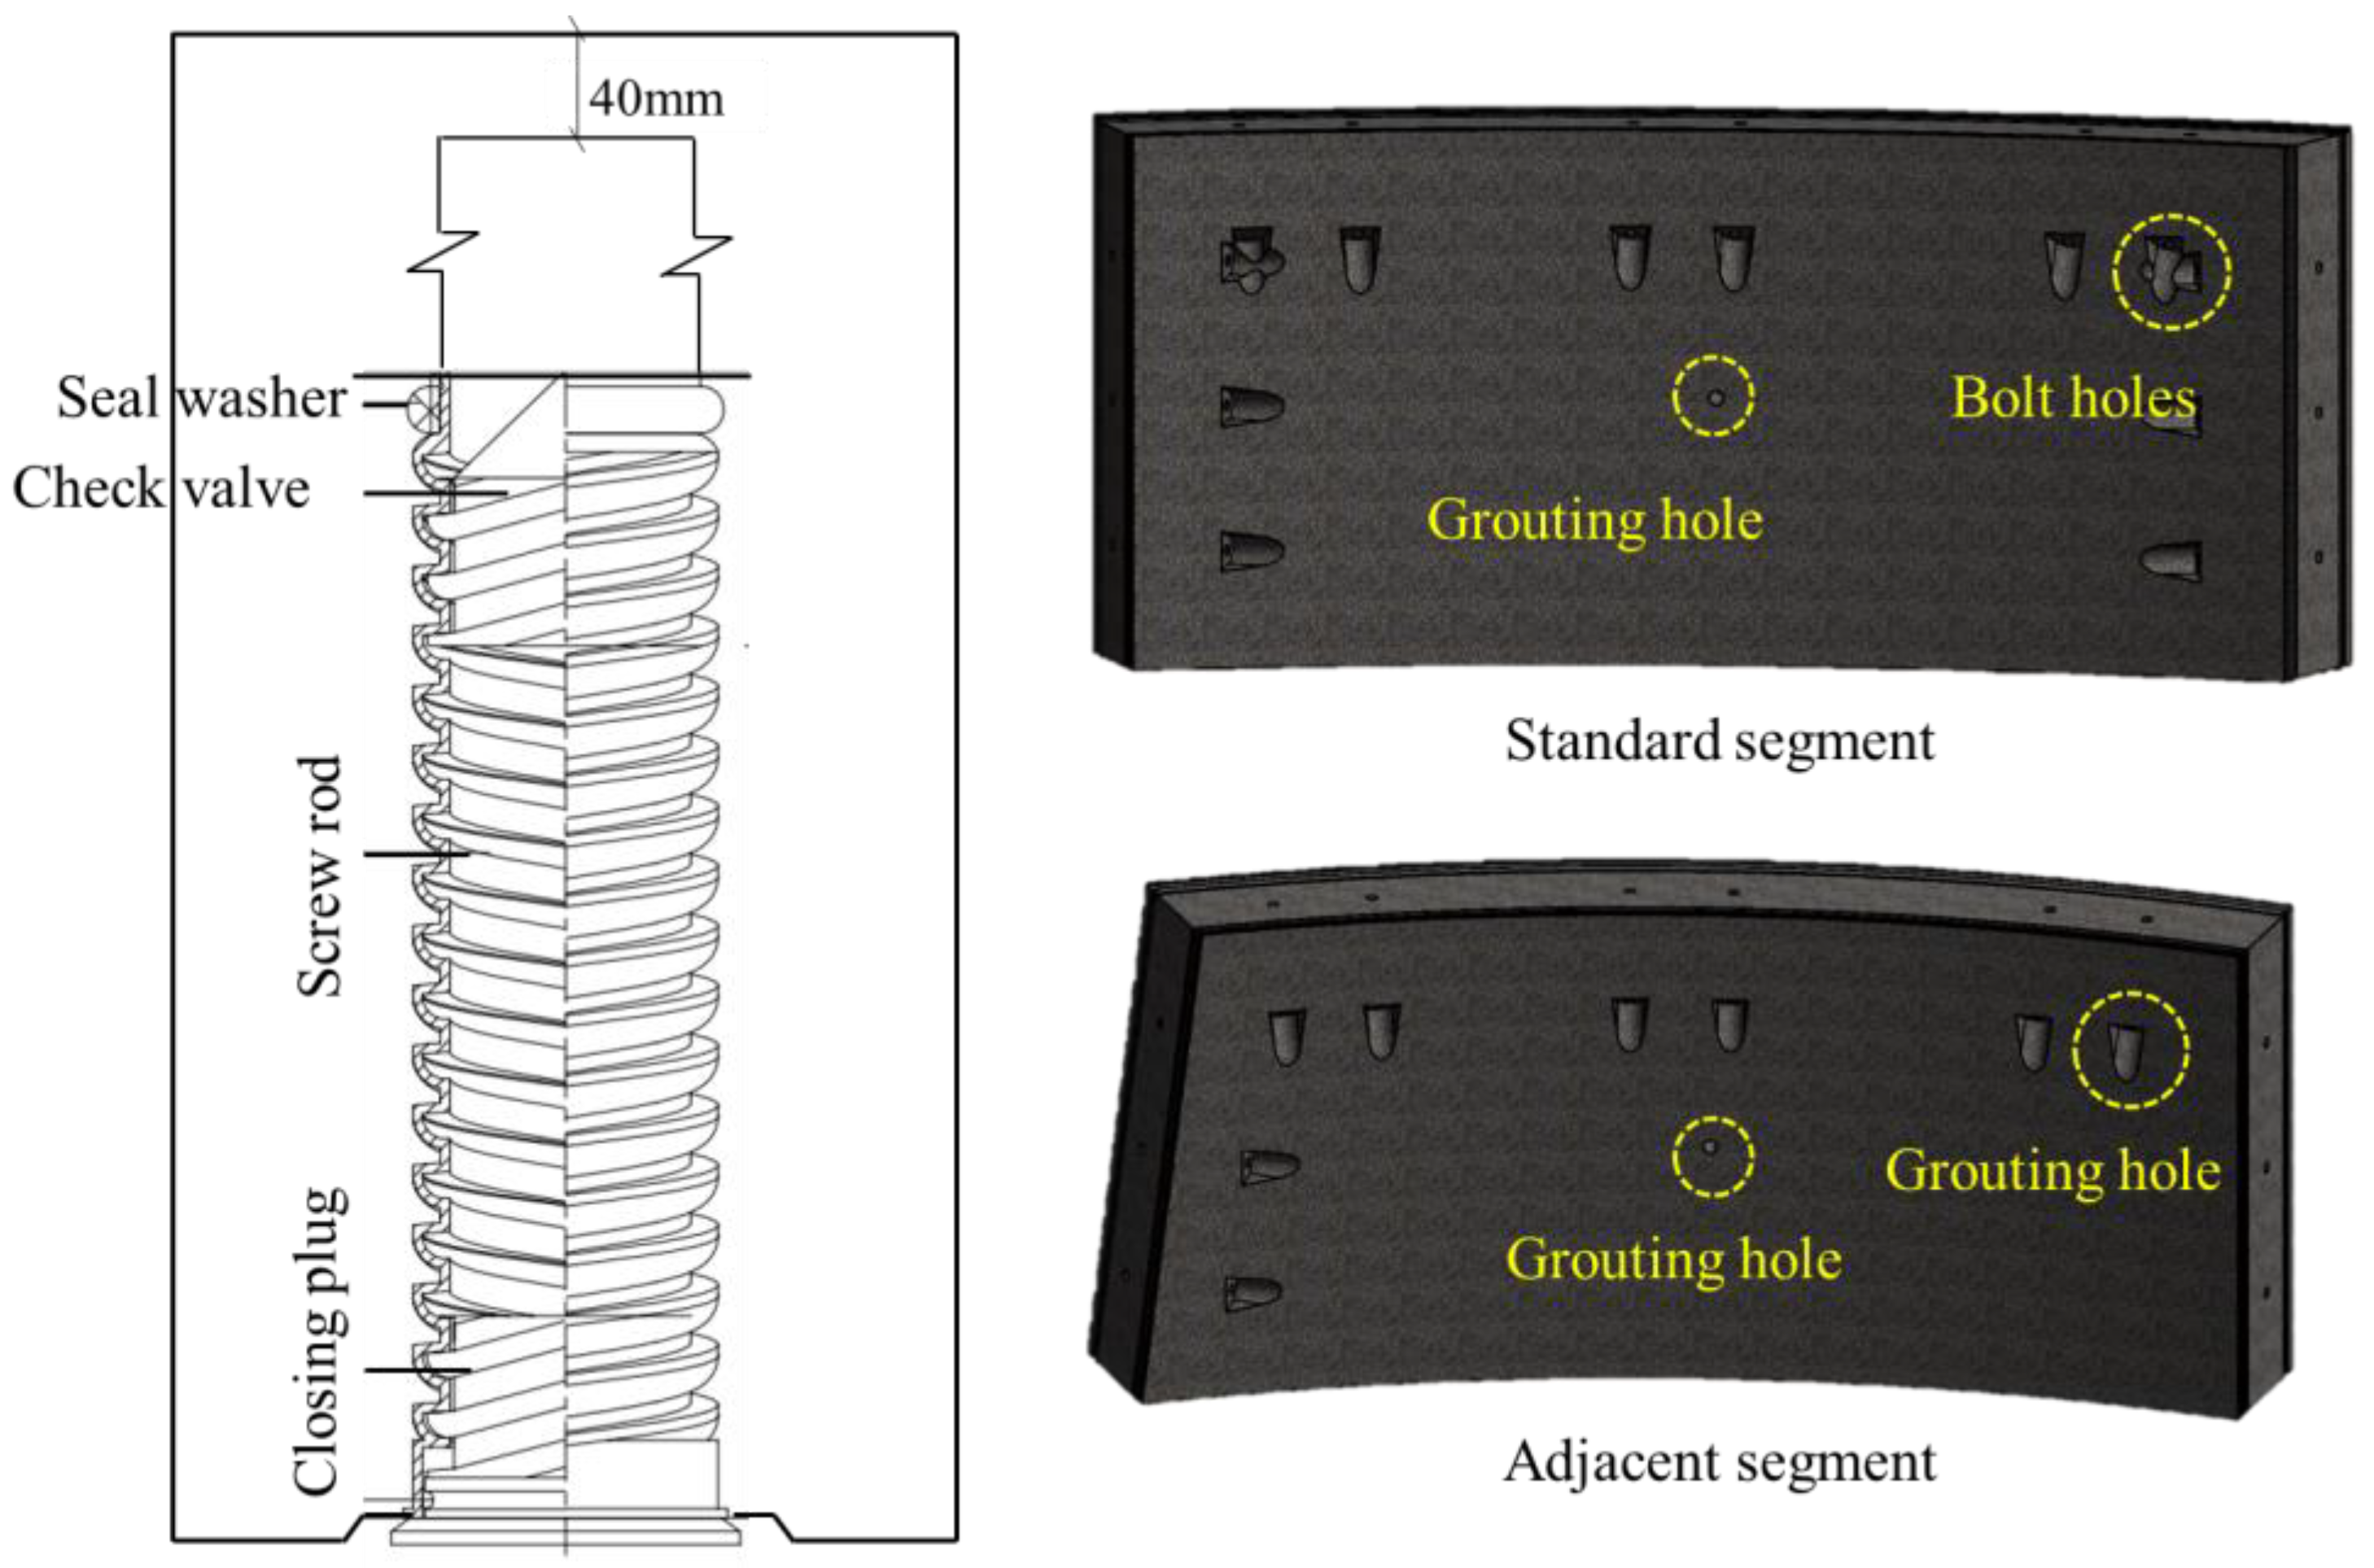
3.2. Construction Technology

The Nanjing Yangtze River tunnel is distributed in the direction of southwest to northeast, with a length of 7014 m. This project is composed of a northern line and a southern line, both of which have a diameter of 14.5 m. As the main supporting features, each concrete ring consists of ten segments with a width of 2 m and a thickness of 0.6 m. These segments are divided into three categories according to their functions and construction consequences, seven standard segments, two adjacent segments, and one key segment. All of them are linked by straight bolts. In order to connect the tunnel lining and surrounding rock into a whole structure, backfill grouting technology has been adopted to fill the space between them after assembly.
As shown in Figure 5, there is a grouting hole prefabricated in the center of every segment. The diameter of the grouting hole is 64 mm, and the thickness of the concrete protective cover is 40 mm. A screw rod with double thread and two packing washers is applied to plug the used grouting holes, which is made of synthetic material and will age with time. In the long term, various disasters could be caused by the aging of the blocking material, such as crack extensions and leakage disasters. In order to prevent local damage and maintain the stability of the tunnel, it is vitally important to test the status of grouting holes and perform further analysis of its impact on structural mechanical performance. Accordingly, an integrated workflow is presented to maintain the stability of the tunnel, introduced as follows.

4. Application of NDT in Identification of Local Damage

In order to ensure the reliability of detection results, laboratory testing is designed to calibrate the different wave phase patterns, which provide an important reference for geological inversion in the field.

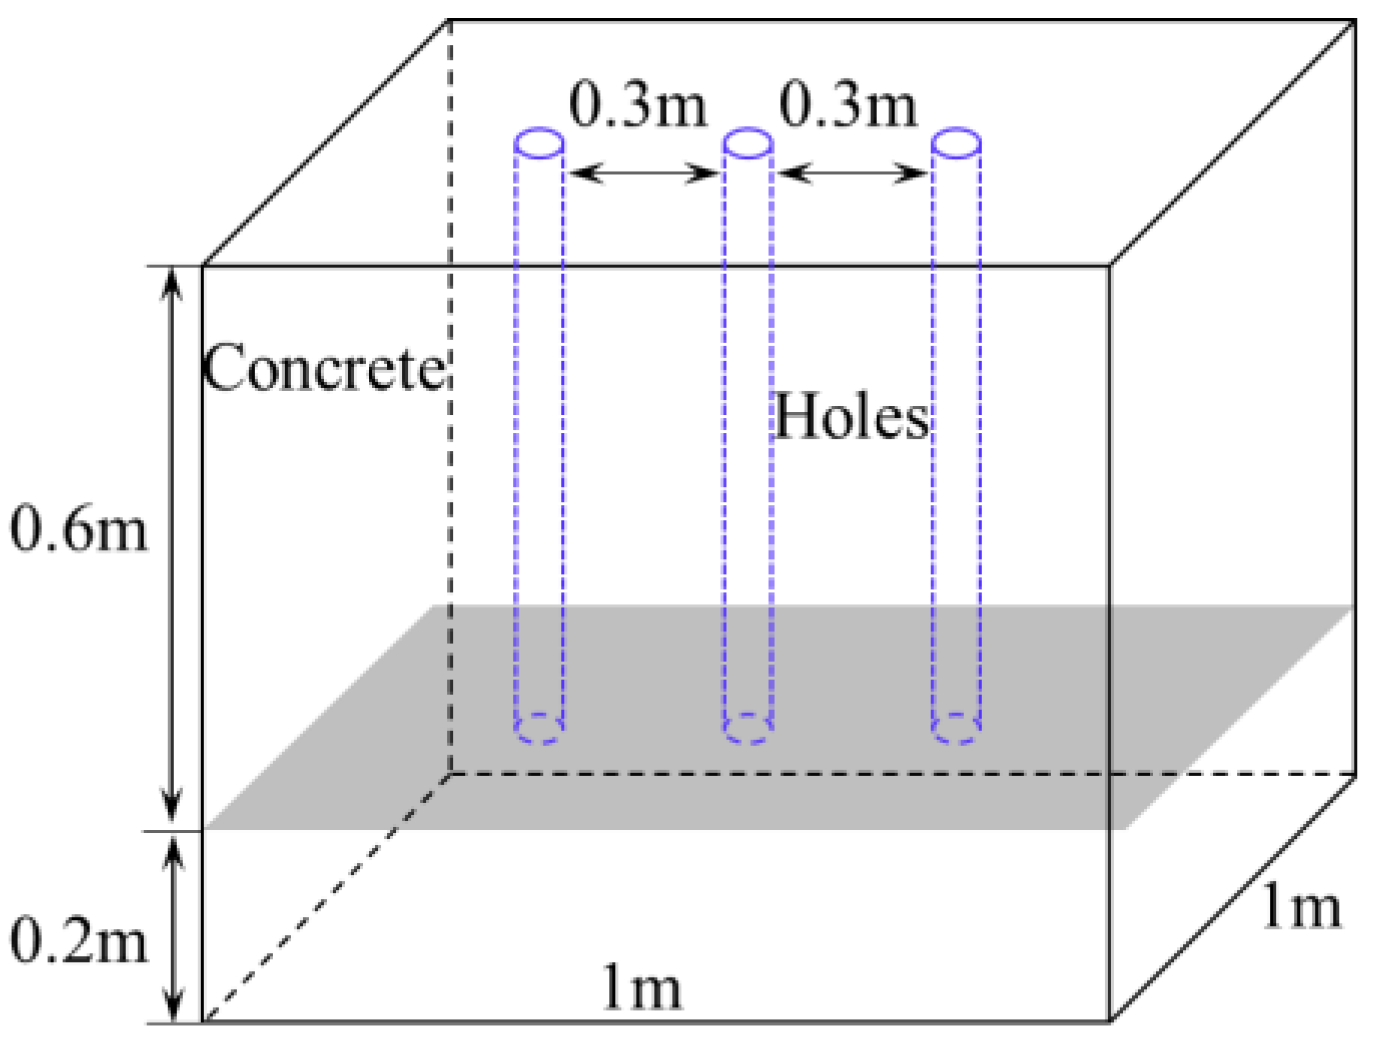
4.1. Parameter Calibration in Laboratory Testing

The experiment in the laboratory was designed according to the field conditions. An experimental model, made of concrete (C60), was set up to represent a concrete segment, as shown in Figure 6. The size of this model was 100 cm × 100 cm × 80 cm. Some holes were prefabricated in this model through PVC pipes to represent grouting holes, and the pipes were demolded after molding. The holes were numbered as No. 1, No. 2, and No. 3. To simulate the different conditions of grouting holes, we maintained a clean and dry condition for the No. 1 hole, to represent an empty status as would be found in the field, and injected some water and grout into No. 2 and No. 3, respectively. Then, the holes were covered with a fire-proof plate to simulate the field conditions. The parameters of the GPR and infrared camera are shown in Table 1 and Table 2.
The GPR was placed on the top of every hole to invert conditions in the holes, as displayed in Figure 7. Based on our designed experiment, three different patterns of electromagnetic waves in the grouting holes were obtained, as shown in Figure 8. The inversion results show that the electromagnetic wave was distorted due to effects of the filling medium in the holes. The wave band tends to bulge upward, and it decreases as the detection depth increases. In addition, the difference in the filling medium has a significant influence on the strength and range of detected signals. There was an obvious abnormal signal response in the empty hole, exceeding 50 cm, which was greater than that of the other mediums. The boundary of the hole bottom was clear in the empty hole. In contrast, there was a minimal abnormal signal response in the grout-filled hole, with a value less than 25 cm. The detected signals were gentle, and it was difficult to identify the hole boundary. The characteristics of the detected signals in the water hole were different to the other two mediums. This wave band bulged upward at first and then exhibited a gentle trend. The boundary of hole bottom was also not clear. The three wave phase patterns calibrated by the laboratory experiment provided an essential reference for geological field inversion.

4.2. Field Testing and Geological Inversion

Based on the calibration results obtained by laboratory testing, the GPR was applied for field investigation. The typical geophysical inversion results in grouting holes were obtained, as shown in Figure 9. Subsequently, the infrared camera was adopted to further detect the status of grouting holes filled with water and grout. The infrared detection results included two classes, as expressed in Figure 10a,b. The characteristics of temperature distribution were uniform in the former case, thus indicating the current state of the structure is safe. However, the temperature distribution expressed an obvious low temperature boundary in the latter case, due to the influence of leakage water. In order to verify the reasonability of the derived method, manual testing in the field was carried out to check the actual status of leakage in the grouting holes. For example, the actual condition of a damaged position was checked, as shown in Figure 10c, which expressed great agreement with the detected results, shown in Figure 10b.

5. Numerical Simulation on the Basis of NDT Results

The field detection results denoted local damage occurring in several positions, which has a great influence on tunnel stability. Based on the detected results, numerical analysis was employed to further analyze the influence of local damage on structural mechanical performance. As an important application, the analytical results were applied to predict the future behavior of the structure and prevent disasters.

5.1. Model Setup

The beam-spring model was used for numerical modeling in this section. In particular, the shell elements were used to represent the tunnel lining, and non-linear springs were used to simulate the effect of surrounding rock. The geological conditions in the middle of the river were obtained through core-drill sampling technology and selected as an example to determine the external load applied in the numerical model, as displayed in Figure 11a. It can be seen that various layers are crossed by the tunnel section in a vertical direction and the water level of this section is 42.7 m in the field. The parameters used to describe physical properties of geological layers are listed in Table 3. Thus, several numerical models with local damage at different positions were established on the basis of the finite element method, with parameters determined based on field measurements. One of these models, in which the damage was located at hole crown of the tunnel, has been presented as an example. The size of the numerical model is consistent with the actual scale, described in the above sections. As shown in Figure 11b, a three-dimensional numerical model of a 50-m long damaged section in the middle of the whole structure was established. In this model, the tunnel lining was discretized into triangular elements. The load applied on the model was calculated, as shown in Equations (3) and (4).

5.2. Mechanical Behavior under Various External Loads

Water pressure is a dynamic load that varies with the seasons, and the concrete lining may incur damage in any position. Based on this, the effects of water pressure and damage positions on structural mechanical response are discussed respectively in this section.

5.2.1. The Effect of Water Pressure

In order to analyze the mechanical response of a damaged structure to the variation of water pressure, the control variates method was employed in this study [26]. The damage position remains the same, and different water pressure loads are calculated according to Equation (3) and applied to the numerical model. The numerical results under water pressures of 427 KPa, 457 KPa, and 487 KPa were obtained, as displayed in Figure 12a, in which C describes circumferential stress and L is used to describe longitudinal stress. The characteristics of stress distribution under different water pressures are described in the same coordinate system. Numbering the nodes clockwise from the top of the hole, the curves of stress under different water pressures were calculated based on the numerical results, as displayed in Figure 12b. These figures indicated that the local damage decreases the stress circumferentially, but increases the stress longitudinally. These figures indicate that local damage causes an increase in the circumferential stress, and the longitudinal stress is greater than the circumferential stress. The effect of local damage diminishes with distance until it can be ignored. Furthermore, the stress response to the variation of water pressure changes in different directions. In detail, the longitudinal stress expresses a positive correlation with the increase of water pressure, but the contrary occurs in the circumferential direction. The maximum response value of stress longitudinally was 45 KPa in the case of water level changes per meter.

5.2.2. The Effect of Different Damage Positions

Similarly, the control variates method was applied to study the stress response under different damage positions. In this section, the mechanical performance is discussed when damage disasters appeared in the spandrel and hance of the tunnel hole. In addition, the effect of hole crown damage on stress distribution is analyzed in the above section. Keeping the water pressure constant, at 487 KPa, the numerical results under different damaged positions were obtained, as shown in Figure 13, where Figure 13a is the stress distribution diagram in different positions and Figure 13b shows the stress curves obtained from different models. The numbering method for nodes along the hole was consistent to the above analysis. These figures indicate that the characteristics of stress distribution in different damaged positions were similar, but the magnitude of stress varied with different positions. The value of stress in the hance of the tunnel hole was the largest, followed by the spandrel, and the arch crown. Thus, it is easier to develop concrete cracks in the hance of the hole than that in other positions, and the most significant influence region is at about 21.8 cm.

5.3. Stability Evaluation Using the Numerical Results

The numerical results indicate that the local damage causes stress concentration of the tunnel lining, which can easily induce crack propagation and reduce the service life of the structure. In order to ensure the stability of the structure, it is critical to evaluate structural stability and prevent disasters.
The numerical results, shown in Figure 12 and Figure 13, indicate that the tensile stress value is 1.74 MPa when water pressure is 487 KPa. The maximum stress response value longitudinally is 45 KPa in the case of water level changes per meter. Based on this, the maximum stress under the largest water pressure—of which the value is 500 KPa, as determined through field investigation results—can be calculated. Thus, the maximum value of stress distributed around damaged positions is about 1.79 MPa. Subsequently, the maximum tensile stress theory (MTST) was adopted as a criterion to evaluate the state of the concrete structure [27]. Based on MTST, a crack would develop if the tensile stress reached the ultimate strength. The criterion results can be expressed as
K σ u σ t
where σu is ultimate strength and the value of concrete (C60) is 2.85 MPa. σt is the tensile stress of the material. K is the safety factor. Industry standards have indicated that the critical value of the safety factor is 1.5 [28]. This means the structure is safe if its safety factor is over 1.5; otherwise, the structure is unsafe.
Thus, the safety factor around damaged positions in the study site is 1.57, which is greater than the critical value. The structure is therefore considered safe. In order to prevent disasters, it is critical to take measures to support and reinforce the influenced region. Considering that steel is a material with high strength and a low price, it was selected to reinforce the damaged positions, as shown in Figure 14. A steel plate was installed for the purpose of anchoring, and the distance from the center of the hole to the side of the steel plate was 25 cm, which is larger than the radius of the influenced area.

6. Conclusions

This study focused on the development of an integrated framework used to evaluate the stability of a concrete structure under the effect of local damage. Three modules comprise the integrated assessment method—accurate testing in the field, numerical analysis, and reliable evaluation. Some main conclusions are summarized as follows.
(1)
In contrast with the existing methods, multiple forms of NDT equipment, specifically a ground penetrating radar (GPR) and a thermal infrared camera, were used synergistically to determine the local damage positions. This is a novel application, designed to distinguish the different kinds of medium filling holes in the structure through GPR. The inversion results were calibrated via laboratory experiments in advance, and they can be divided into three patterns—empty, grouted, and filled with water.
(2)
The numerical analysis was introduced to study the impact of local damage on structural stability. The characteristics of stress distribution were discussed under different water pressures and damage positions, which showed a positive correlation between stress and the rise of water pressure. Furthermore, the stress mechanical response varied with different positions. The circumferential stress component is more significant than stress in the longitudinal direction.
(3)
As a promising application, the detected results and numerical results obtained from the derived method were adopted to assess structural stability. The maximum tensile stress theory was introduced as the criterion to evaluate the state of the concrete structure, and the tunnel structure was determined to be stable. Even so, disaster prevention measures have also been suggested in this study.

Author Contributions

X.T. wrote the main part of the manuscript and took part in the results analysis of experiments and field testing. W.C. contributed to the conception of the study and provided financial support. L.W. contributed to the numerical modeling and results analysis. J.Y. conceived and designed the experiments. All authors have read and agreed to the published version of the manuscript.

Funding

This research was funded by National Natural Science Foundation of China, grant number U1806226.

Acknowledgments

The authors gratefully acknowledge the support of the National Natural Science Foundation of China (Grant No.U1806226). The third author is grateful for the financial support from the China Scholarship Council (CSC). The authors are grateful to the reviewers and editors for their valuable comments and suggestions that helped to improve the quality of the paper.

Conflicts of Interest

The authors declare no conflict of interest.

References

  1. Cosimo, M.; Marco, M. On the relationship between transportation infrastructure and economic development in China. Res. Transp. Econ. 2020, 100947. [Google Scholar] [CrossRef]
  2. Yoo, C. Effect of Water Leakage in Tunnel Lining on Structural Performance of Lining in Subsea Tunnels. Mar. Georesour. Geotechnol. 2016, 35, 305–317. [Google Scholar] [CrossRef]
  3. Wu, H.; Xu, Y.-S.; Shen, S.-L.; Chai, J.-C. Long-term settlement behavior of ground around shield tunnel due to leakage of water in soft deposit of Shanghai. Front. Arch. Civ. Eng. China 2011, 5, 194–198. [Google Scholar] [CrossRef]
  4. Li, X.; Ji, Z.; Zhu, H.; Gu, C. A feasibility study of the measuring accuracy and capability of wireless sensor networks in tunnel monitoring. Front. Struct. Civ. Eng. 2012, 6, 111–120. [Google Scholar] [CrossRef]
  5. Huang, H.; Li, Q.-T.; Zhang, D. Deep learning based image recognition for crack and leakage defects of metro shield tunnel. Tunn. Undergr. Space Technol. 2018, 77, 166–176. [Google Scholar] [CrossRef]
  6. Wang, L.; Chen, W.; Tan, X.; Tan, X.; Yang, J.; Yang, D.; Zhang, X. Numerical investigation on the stability of deforming fractured rocks using discrete fracture networks: A case study of underground excavation. Bull. Int. Assoc. Eng. Geol. 2019, 79, 133–151. [Google Scholar] [CrossRef]
  7. Tan, X.; Chen, W.; Wu, G.; Wang, L.; Yang, J. A structural health monitoring system for data analysis of segment joint opening in an underwater shield tunnel. Struct. Heal. Monit. 2019, 19, 1032–1050. [Google Scholar] [CrossRef]
  8. Li, X.; Yan, Z.; Wang, Z.; Zhu, H. Experimental and analytical study on longitudinal joint opening of concrete segmental lining. Tunn. Undergr. Space Technol. 2015, 46, 52–63. [Google Scholar] [CrossRef]
  9. Huang, Z.; Fu, H.; Chen, W.; Zhang, J.; Huang, H. Damage detection and quantitative analysis of shield tunnel structure. Autom. Constr. 2018, 94, 303–316. [Google Scholar] [CrossRef]
  10. Bremer, K.; Meinhardt-Wollweber, M.; Thiel, T.; Werner, G.; Sun, T.; Grattan, K.; Roth, B. Sewerage tunnel leakage detection using a fibre opticmoisture-detecting sensor system. Sens. Actuators A Phys. 2014, 220, 62–68. [Google Scholar]
  11. Yu, Z.; Peng, H.; Zeng, X.; Sofi, M.; Xing, H.; Zhou, Z.; Yu, Z. Smarter construction site management using the latest information technology. Proc. Inst. Civ. Eng. Civ. Eng. 2019, 172, 89–95. [Google Scholar] [CrossRef]
  12. Zhou, Z.; Ou, J. Development of FBG Sensors for Structural Health Monitoring in Civil Infrastructures. Sens. Issues Civ. Struct. Health Monit. 2005, 197–207. [Google Scholar] [CrossRef]
  13. Montero, R.; Victores, J.G.; Martínez, S.; Jardón, A.; Balaguer, C. Past, present and future of robotic tunnel inspection. Autom. Constr. 2011, 59, 99–112. [Google Scholar] [CrossRef]
  14. Alani, A.M.; Tosti, F. GPR applications in structural detailing of a major tunnel using different frequency antenna systems. Constr. Build. Mater. 2018, 158, 1111–1122. [Google Scholar] [CrossRef]
  15. Štefanič, M.; Stankovski, V. A review of technologies and applications for smart construction. Proc. Inst. Civ. Eng. Civ. Eng. 2019, 172, 83–87. [Google Scholar] [CrossRef] [Green Version]
  16. Wang, L.; Yang, D.; Tan, X.; Yang, J. The impact of various crack geometrical parameters on stress field over tip under different mixed loading conditions and inclination angles. Theor. Appl. Fract. Mech. 2019, 102, 239–254. [Google Scholar] [CrossRef]
  17. Chang, T.; Lee, C.-L.; Carr, A.; Dhakal, R. Numerical evaluations of a novel membrane element in simulations of reinforced concrete shear walls. Eng. Struct. 2019, 199, 109592. [Google Scholar] [CrossRef]
  18. Moazam, A.M.; Hasani, N.; Yazdani, M. Three-dimensional modelling for seismic assessment of plain concrete arch bridges. Proc. Inst. Civ. Eng. Civ. Eng. 2018, 171, 135–143. [Google Scholar] [CrossRef]
  19. Verma, S.K.; Bhadauria, S.S.; Akhtar, S. In-situ condition monitoring of reinforced concrete structures. Front. Struct. Civ. Eng. 2016, 10, 420–437. [Google Scholar] [CrossRef]
  20. Huws, D.G.; Davis, A.M.; Pyrah, J.R. A nondestructive technique for predicting the in situ void ratio for marine sediments. Mar. Georesour. Geotechnol. 2000, 18, 333–346. [Google Scholar] [CrossRef]
  21. Richards, A.F.; Chaney, R.C. Nondestructive measurement of the existing state of consolidation in marine soils. Mar. Georesour. Geotechnol. 1997, 15, 305–321. [Google Scholar] [CrossRef]
  22. Liu, J.-L.; Hamza, O.; Davies-Vollum, K.S.; Liu, J.-Q. Repairing a shield tunnel damaged by secondary grouting. Tunn. Undergr. Space Technol. 2018, 80, 313–321. [Google Scholar] [CrossRef] [Green Version]
  23. Fahmy, M.; Moselhi, O. Automated Detection and Location of Leaks in Water Mains Using Infrared Photography. J. Perform. Constr. Facil. 2010, 24, 242–248. [Google Scholar] [CrossRef]
  24. Hunaidi, O.; Chu, W.; Wang, A.; Guan, W. Detecting leaks in plastic pipes. J. Am. Water Work. Assoc. 2000, 92, 82–94. [Google Scholar] [CrossRef] [Green Version]
  25. Koizumi, A.; Murakami, H.; Nishino, K. Study on the analytical model of shield tunnel in longitudinal direction. Doboku Gakkai Ronbunshu 1988, 1988, 79–88. [Google Scholar] [CrossRef] [Green Version]
  26. Tan, X.; Chen, W.; Yang, J.; Wang, L. Stability Evaluation of Concrete Structure Considering the Local Damage Using Nondestructive Detection and Numerical Analysis. IOP Conf. Ser. Earth Environ. Sci. 2020, 455, 012119. [Google Scholar] [CrossRef]
  27. Zehnder, A.T. Fracture Mechanics: Lecture Notes in Applied and Computational Mechanics; Springer: Berlin, Germany, 2019. [Google Scholar]
  28. Ministry of Housing and Urban-Rural Construction of the People’s Republic of China. Code for Design of Concrete Structure 2018; China Building Industry Press: Beijing, China, 2018.
Figure 1. The workflow of the developed methodology.
Applsci 10 06575 g001
Figure 2. Scheme of nondestructive testing for a grouting hole.
Applsci 10 06575 g002
Figure 3. Methodology for the numerical modeling: (a) the force-relative displacement curve of a non-linear spring; (b) boundary conditions of the improved model.
Applsci 10 06575 g003
Figure 4. Geological profile of the Nanjing Yangtze River tunnel.
Applsci 10 06575 g004
Figure 5. Characteristics of segment structure.
Applsci 10 06575 g005
Figure 6. Schematic of the physical model for the test.
Applsci 10 06575 g006
Figure 7. Laboratory Experiment: (a) the experiment model and detection equipment; (b) the procedure for detecting the conditions in holes.
Applsci 10 06575 g007
Figure 8. The different patterns of grouting holes obtained from GPR detection results: (a) empty; (b) filled with water; (c) filled with grout.
Applsci 10 06575 g008
Figure 9. The different conditions of grouting holes obtained from field detection: (a) empty; (b) filled with water; (c) filled with grout.
Applsci 10 06575 g009
Figure 10. The field detection results of the thermal infrared camera: (a) safety conditions; (b) leakage conditions; (c) leakage of a grouting hole in the field.
Applsci 10 06575 g010
Figure 11. Numerical modeling for the study site: (a) geological conditions; and (b) numerical model.
Applsci 10 06575 g011
Figure 12. The influence of local damage under various water pressures, where C represents the direction of circumference and L represent the longitudinal direction: (a) Von Mises stress distribution; (b) Von Mises stress curves.
Applsci 10 06575 g012
Figure 13. The influence of local damage in different positions: (a) Von Mises stress distribution; and (b) Von Mises stress curves.
Applsci 10 06575 g013
Figure 14. Reinforcement measures in the study site.
Applsci 10 06575 g014
Table 1. Parameters of the ground penetrating radar (GPR).
Sensitivity (με)Detection Depth (m)Electric Voltage (V)Size (cm)Frequency (MHz)
500.620030 × 12 × 11900
Table 2. Parameters for the thermal infrared camera.
IndexValue
Equipment typeInf-Rec R500
Precision (°C)±1
Visible pixel5,000,000
Resolution ratio1280 × 960
Measurement range (°C)−40~2000
Infrared image element1,200,000
Table 3. Mechanical parameters of surrounding rocks in the site.
Ground TypesHorizontal Pressure CoefficientGround Resistance (MPa/m)Unit Weight (KN/m3)
Silt0.43519.4
Fine sand-10.405019.3
Fine sand-30.373520.2
Silt clay0.651218.6
Gravel0.258020.6

