Article

Thermal Action on Normal and High Strength Cement Mortars

1
Facultad de Ingeniería, Laboratorio de Métodos Numéricos en Ingeniería (LMNI-FIUBA), Universidad de Buenos Aires, Buenos Aires C1127AAR, Argentina
2
Instituto de Tecnologías y Ciencias de la Ingeniería “Hilario Fernández Long” (INTECIN), CONICET—Universidad de Buenos Aires, Buenos Aires C1127AAR, Argentina
3
Comisión Nacional de Energía Atómica (CNEA), Departamento ICES, Buenos Aires B1650LWP, Argentina
4
Institut für Werkstoffe im Bauwesen, Technische Universität Darmstadt, 64287 Darmstadt, Germany
*
Author to whom correspondence should be addressed.
Appl. Sci. 2020, 10(18), 6455; https://doi.org/10.3390/app10186455
Submission received: 24 August 2020 / Revised: 11 September 2020 / Accepted: 11 September 2020 / Published: 16 September 2020

Abstract

:
High temperature effect on cement-based composites, such as concrete or mortars, represents one of the most important damaging process that may drastically affect the mechanical and durability characteristics of structures. In this paper, the results of an experimental campaign on cement mortars submitted to high temperatures are reported and discussed. Particularly, two mixtures (i.e., Normal (MNS) and High Strength Mortar (MHS)) having different water-to-binder ratios were designed and evaluated in order to investigate the incidence of both the mortar composition and the effects of thermal treatments on their physical and mechanical properties. Mortar specimens were thermally treated in an electrical furnace, being submitted to the action of temperatures ranging from 100 to 600 ° C. After that and for each mortar quality and considered temperature, including the room temperature case of 20 ° C, water absorption was measured by following a capillary water absorption test. Furthermore, uniaxial compression, splitting tensile and three-points bending tests were performed under residual conditions. A comparative analysis of the progressive damage caused by temperature on physical and mechanical properties of the considered mortars types is presented. On one hand, increasing temperatures produced increasing water absorption coefficients, evidencing the effect of thermal damages which may cause an increase in the mortars accessible porosity. However, under these circumstances, the internal porosity structure of lower w / b ratio mixtures results much more thermally-damaged than those of MNS. On the other hand, strengths suffered a progressive degradation due to temperature rises. While at low to medium temperatures, strength loss resulted similar for both mortar types, at higher temperature, MNS presented a relatively greater strength loss than that of MHS. The action of temperature also caused in all cases a decrease of Young’s Modulus and an increase in the strain corresponding to peak load. However, MHS showed a much more brittle behavior in comparison with that of MNS, for all temperature cases. Finally, the obtained results demonstrated that mortar quality cannot be neglected when the action of temperature is considered, being the final material performance dependent on the physical properties which, in turn, mainly depend on the mixture proportioning.

1. Introduction

Thermal damage in cementitious composites represents a topic of key interest for controlling strength, durability and serviceability conditions of concrete structural components [1]. The most relevant thermo-physical and mechanical properties of cement-based composites (i.e., cohesion, friction, stiffness, strength, cracked configurations and durability parameters) suffer severe degradation as a result of long-term exposure to high temperatures [2,3]. Many factors influence the thermo-hygro-chemo-mechanical response of cement-based composites, which can be grouped in two main categories [4]: (i) the material or composite factors and (ii) the environmental (conditioning) factors. The first one deals with the dehydration processes in the hardened cement paste due to high temperatures [5] and with the characteristic meso-structure of the composites under investigation, such as presence of inclusions (aggregates), aggregate-matrix bonds, air bubbles/voids, fibers, etc., which leads to incompatibility of strains among components under a thermal process [6]. The second one deals with environmental and/or conditioning factors such as rate, duration, i.e., thermal history, exposure and distribution of the heating/cooling process together with the considered loading conditions which also influence the thermal effects and induced damages [7].
Many researches have already been performed with focus on the thermo-hygro-mechanical properties of cementitious composite materials affected by high temperature at several scales of applications. Recent works investigated the effect of using by-products for modifying the residual strength after high temperature exposure [8,9,10]. Some works also highlight how the addition of (nano- [11], micro- [12] and macro- [13,14]) fibers can improve the residual strength of components and structures after high temperatures exposures.
In the literature, numerical procedures are also available for describing the physico-mechanical processes resulting from the exposure to high temperatures in cement-based composites like different types of concretes and mortars. The most classical examples in this field are those based on a further development of the well-known smeared crack procedure to deal with the thermo-mechanical behavior of concrete [15,16,17]. Advanced models dealing with meso-scale descriptions [18,19,20], multi-physics [21] and multiscale approaches [22] are also available in this matter. It should be mentioned that, so far, only a few of the mentioned models are capable to accurately describe the complex response of cementitious materials under high temperatures. In this sense, it is imperative the need for an extensive experimental database that covers not only the thermo-hygro behavior of cement-based compounds but also their mechanical response when subjected to a complete spectrum of stress states including the effect of high temperatures and documenting the strain response including pre and post peak behavior.
Regarding mortars, it is well known that their mechanical response is highly dependent on the applied confinement level and this is a crucial factor to be included into constitutive relationships [23] even more they are under high temperatures, particularly over 300 ° C. The most recent works are related, on one hand, to the study of mechanical response of mortars under different confinement levels at ambient temperature [24,25] and, on the other hand, to residual peak strengths at different levels of high temperatures but they rarely present the complete stress-strain curves including lateral and/or volumetric strains [4,26,27,28,29,30,31].
The main objective of this work is to contribute with additional experimental data involving the incidence of temperature on cement mortars having different qualities. Therefore, the results of an experimental campaign aimed at investigating the damage caused by the action of elevated temperatures on the physical and mechanical properties of normal and high strength mortars are presented. Physical tests include the measurement of specific weight losses and water absorption coefficients. Mechanical tests include uniaxial compression, splitting tensile and three-points bending tests. The influence of various temperature levels (100 ° C, 200 ° C, 300 ° C, 400 ° C, 500 ° C and 600 ° C), applied through a thermal treatment in an electrical furnace, is considered. Laboratory measurements are carried out in residual state. In particular, the uniaxial compression test results include the measurement of lateral strains together with the axial ones, which are fundamental data to be considered in the development of constitutive models.
The paper is structured as follows. Section 2 reports Materials and Methods of the experimental program and outlines the key physical characteristics of the investigated mortars. Section 3 provides the specific weights and weight losses after thermal treatments in both considered mortars. Section 4 outlines the results and main conclusions of the water absorption tests. Then, in Section 5, the results of the mechanical tests for both normal and high strength mortars are presented and discussed. Finally, concluding remarks and future developments of this research are addressed in Section 6.

2. Materials and Methods

In this section, the employed materials, methods and experimental program details are presented. Two mortar mixtures were designed and evaluated in order to investigate the incidence of both the mortar composition and the effects of thermal treatments on physical and mechanical properties. Different water to binder ( w / b ) ratios were considered for achieving a normal strength mortar and a high strength one, respectively. The mixes were designed based on the corresponding compositions of two concretes with target compressive strengths of 30 MPa and 80 MPa, respectively, developed in previous experimental campaigns [14,32]. The resulting material contents were adapted for obtaining 1 m 3 of mortar, without the coarse aggregates and maintaining the same w / b ratio. The following nomenclature will be used along the document for identifying the two mortar types.
-
MNS: normal strength mortar
-
MHS: high strength mortar

2.1. Materials and Mix Design

The details of the mix proportioning of the two considered mortars are summarized in Table 1. It can be observed that the water to binder ratio for MNS was w / b = 0.49, while for MHS it was w / b = 0.35.
Two commercial locally available cements, namely CPN40 and CPN50 according to IRAM norms [33,34] were used for casting the normal (MNS) and the high strength (MHS) mortars, respectively. In particular, CPN50 is a high early-strength Portland cement, analogous to ASTM Type III. Table 2 shows the main properties of the cements used in the experimental campaign. MNS was elaborated by employing only CPN40 cement type, while the MHS binder contained CPN50 and also, blast furnace slag with a specific surface area of 440 m 2 /kg.
A suitable workability for the mixture MHS, having a w / b ratio of 0.35, was achieved by the addition of 4.3 kg/m3 of Sika Viscocrete 3085, a high range water reducing and superplasticizing chemical admixture, made of polycarboxylate polymer.
A combination of siliceous river and granitic crushed sands was used as fine aggregates, with fineness modulus (FM) of 1.97 and 3.45, respectively. Their water absorption properties and densities are highlighted in Table 3.
Concrete specimens were cast in steel molds. After 24 h, they were removed from the molds and cured in moisture curing room under 100% relative humidity and 20 ° C during 28 days. Afterwards, specimens were kept under the humidity and temperature conditions of the lab at least seven days till they were submitted to the thermal treatment.

2.2. Experimental Campaign

The experimental program was designed for evaluating certain physical and mechanical properties of the considered mortars. Concerning physical properties; specific weight (W) and capillary water absorption (CA) were measured. On the other hand, for the mechanical characterization; uniaxial compression (UC), splitting tensile (ST) and three-points bending (TPB) tests were performed. Table 4 reports an overview of the full experimental program considered for both MNS and MHS mortars. Specimens were tested at an age between 35 and 42 days. In the table, the number of samples tested per each mortar type and per each test type and considered temperature is shown.

2.2.1. Thermal Treatments

Thermal treatments consisting on a heating process followed by a controlled cooling phase were performed. Seven levels of temperatures were considered, corresponding to 20 ° C (room temperature), 100–200 ° C (low-), 300–400 ° C (mid-) and 500–600 ° C (high-temperatures). These temperature levels were mainly chosen to detailly analyze the temperature effects on mortars, which at lower levels of temperatures (up to 300 ° C) mainly consist in changes of their physical properties, while at higher temperatures (above 300 ° C) are related to the degradation of their mechanical properties. The limit of 600 ° C was imposed due to the high thermal damage induced in the mortars by higher temperatures, which turns almost impossible to evaluate any residual mechanical strength.
An electric furnace, brand Simcic S.R.L., with internal dimensions of 400 × 400 × 700 mm and a maximum thermal capacity of 1200 ° C was used (Figure 1). Temperature rise during heating followed a constant rate of 10 ° C/min up to the desired temperature. This latter was kept constant during three hours. Then, the furnace was turned off and the specimens were kept inside to prevent thermal shocks. The duration of the whole cooling process was of 24 h by leaving the specimen into the switched off furnace. The samples were weighted before being placed in the furnace and after being removed from it.

2.2.2. Capillarity Water Absorption Tests

In order to evaluate the mortars water permeability by capillary action, an absorption experiment test was conducted. Particularly, the water absorption (that one accessible through the open porosity and/or via the micro-to-meso cracks) was calculated using an electronic scale (Mettler Toledo brand, having ±0.1 g error range) according to the hydrostatic procedure described in the UNE-EN 1015-10:2000 (2007) standard [35]. Specifically, 19 cylindrical specimens (50 mm × 100 mm) were analyzed: eight samples of MNS mortars and 11 of MHS. Some of them were previously subjected to temperatures conditioning between 20 and 600 ° C, as shown in Table 4.
The capillary water absorption coefficients were measured according to UNE-EN 1015-18 (2003) [36]. The absorbed water under capillary action was obtained by leaving the bottom part of cylindrical specimens (having a diameter of 50 mm) in direct contact with water (Figure 2). The immersion depth was 5 mm. The measures were estimated by weighting the 50 × 100 cylindrical specimens before the immersion (0 h) and after immersion at 0.5 h, 1 h, 3 h, 7 h, 24 h and 48 h. No lateral sealant was used in these tests (as done in some other works in this matter, see [37,38]). All tests have been performed under controlled (constant) temperature and humidity laboratory conditions.
The following relationship, as employed in other scientific works [39,40] was employed for estimating the composites open porosity, p = W s s d W d / W s s d W w where p is the saturated accessible (open) porosity (%), W s s d is the specimen weight in air of saturated samples, W d is the specimen dry weight achieved by drying the specimen during 72 h in oven at 100 ± 5 ° C and W w is the specimen weight in water.

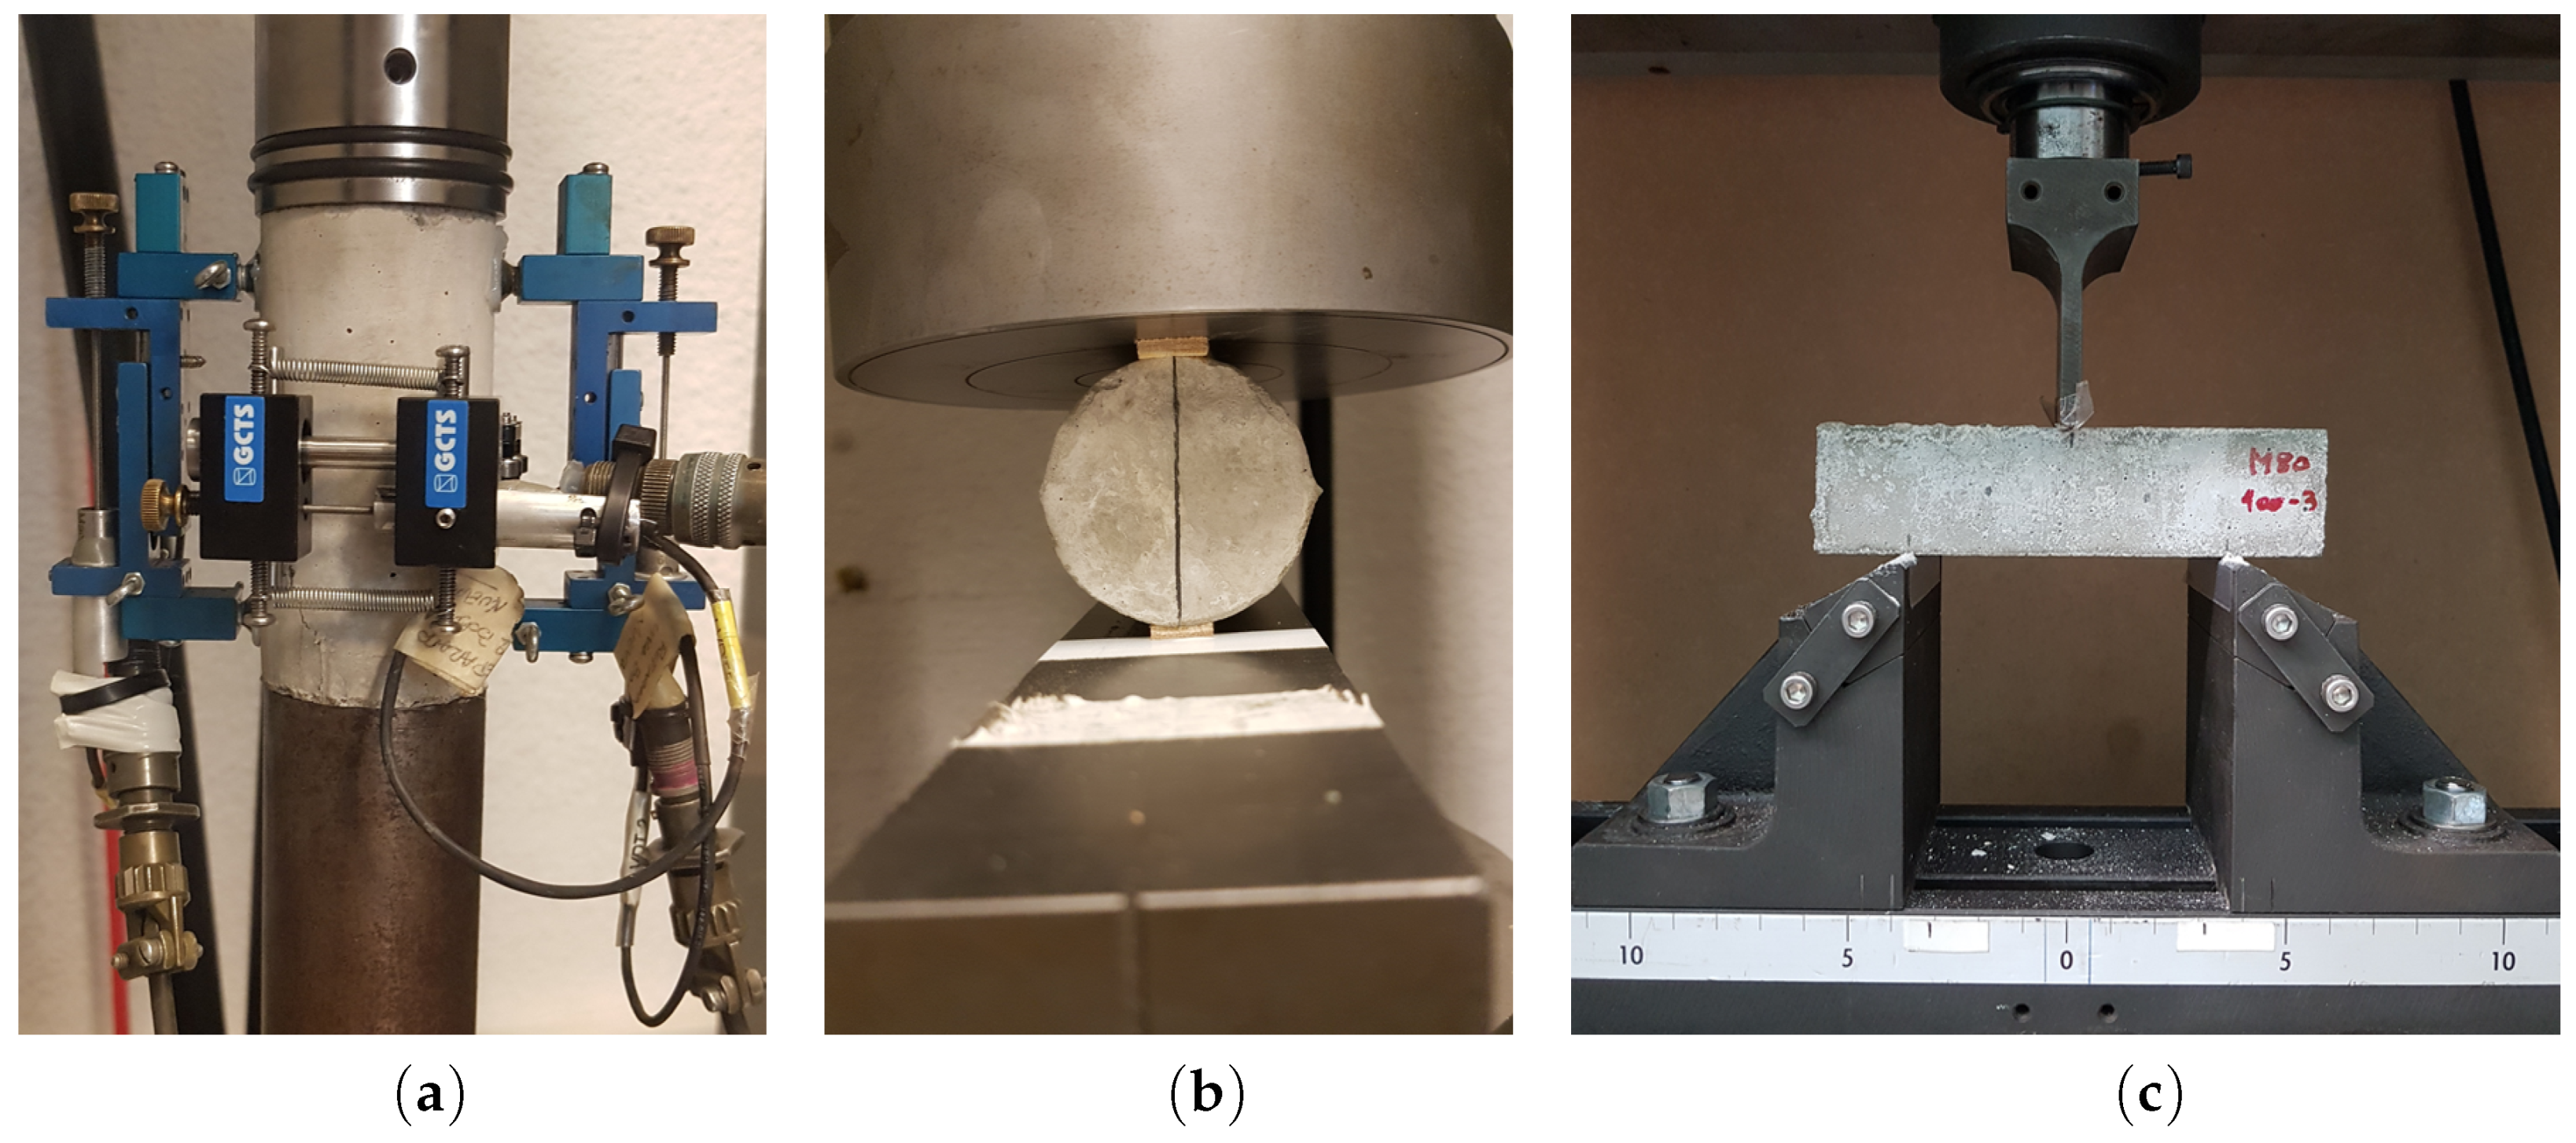
2.2.3. Mechanical Tests

After the thermal treatment, mechanical tests including uniaxial compression (UC), splitting tensile (ST) and three-points bending tests (TPB) were performed on the thermally-damaged samples. A 2000 KN closed-loop servo hydraulic GCTS testing machine with an axial stiffness of 3500 kN/mm and a stroke of 100 mm was used for the mechanical tests.
The Uniaxial Compression (Figure 3a) tests were performed following the ASTM C39-05 [41] standard procedures. Axial and circumferential strains were monitored with three Linear Variable Differential Transformers (LVDTs), all with a ±2.5 mm range. Four cylindrical specimens (50 mm diameter × 100 mm height) were analyzed per each mixture and temperature level. Tests were performed under different control steps. In the first stage, for axial stress values lower than 8 MPa, axial displacement control was applied with a rate of 0.24 mm/s. Then, circumferential strains control was applied until the end of the test, with a rate of 0.01 mm/s. Top and bottom faces of the cylindrical samples were polished using a GCTS grinder machine which led to the obtention of flat and parallel surfaces.
Splitting tensile tests were also executed in accordance with the ASTM C496-05 [42]. Instrumentation of the specimens and test set-up can be seen in Figure 3b. One LVDT (with ±2.5 mm range) was placed in each extreme face of the cylindrical samples for measuring the crack opening displacements. For each mixture 3 cylindrical specimens (50 mm diameter × 100 mm height) were tested under displacement control by adopting a rate of 0.002 mm/s. The axial load P on the sample was thus recorded during the test, together with the crack opening displacement D, considered as the average of the two instrumented LVDTs. Tensile stresses f t S T [MPa] were evaluated as f t S T = 2 P / ( π . D . L ) being D and L the specimen diameter and length, respectively.
Finally, to characterize the flexural strength of the two considered mortar types, prismatic samples were tested under bending according to the procedures described in IRAM 1622 [43] (which provisions are similar to EN 196-1 [44]). For each mixture, 4 beams (40 mm × 40 mm × 160 mm as shown in Figure 3c) were prepared and tested under three-points bending scheme. The distance between supports was 100 mm (±0.5 mm) and the vertical load was applied with a displacement rate of 0.005 mm/sec until failure (i.e., only the peak load was registered). The bending strength f t T P B [MPa] of all mixtures was calculated as f t T P B = 1.5 F f l / b 3 where b is the width of the beam cross-section, F f the applied load at fracture and l the distance between the beam-end supports.

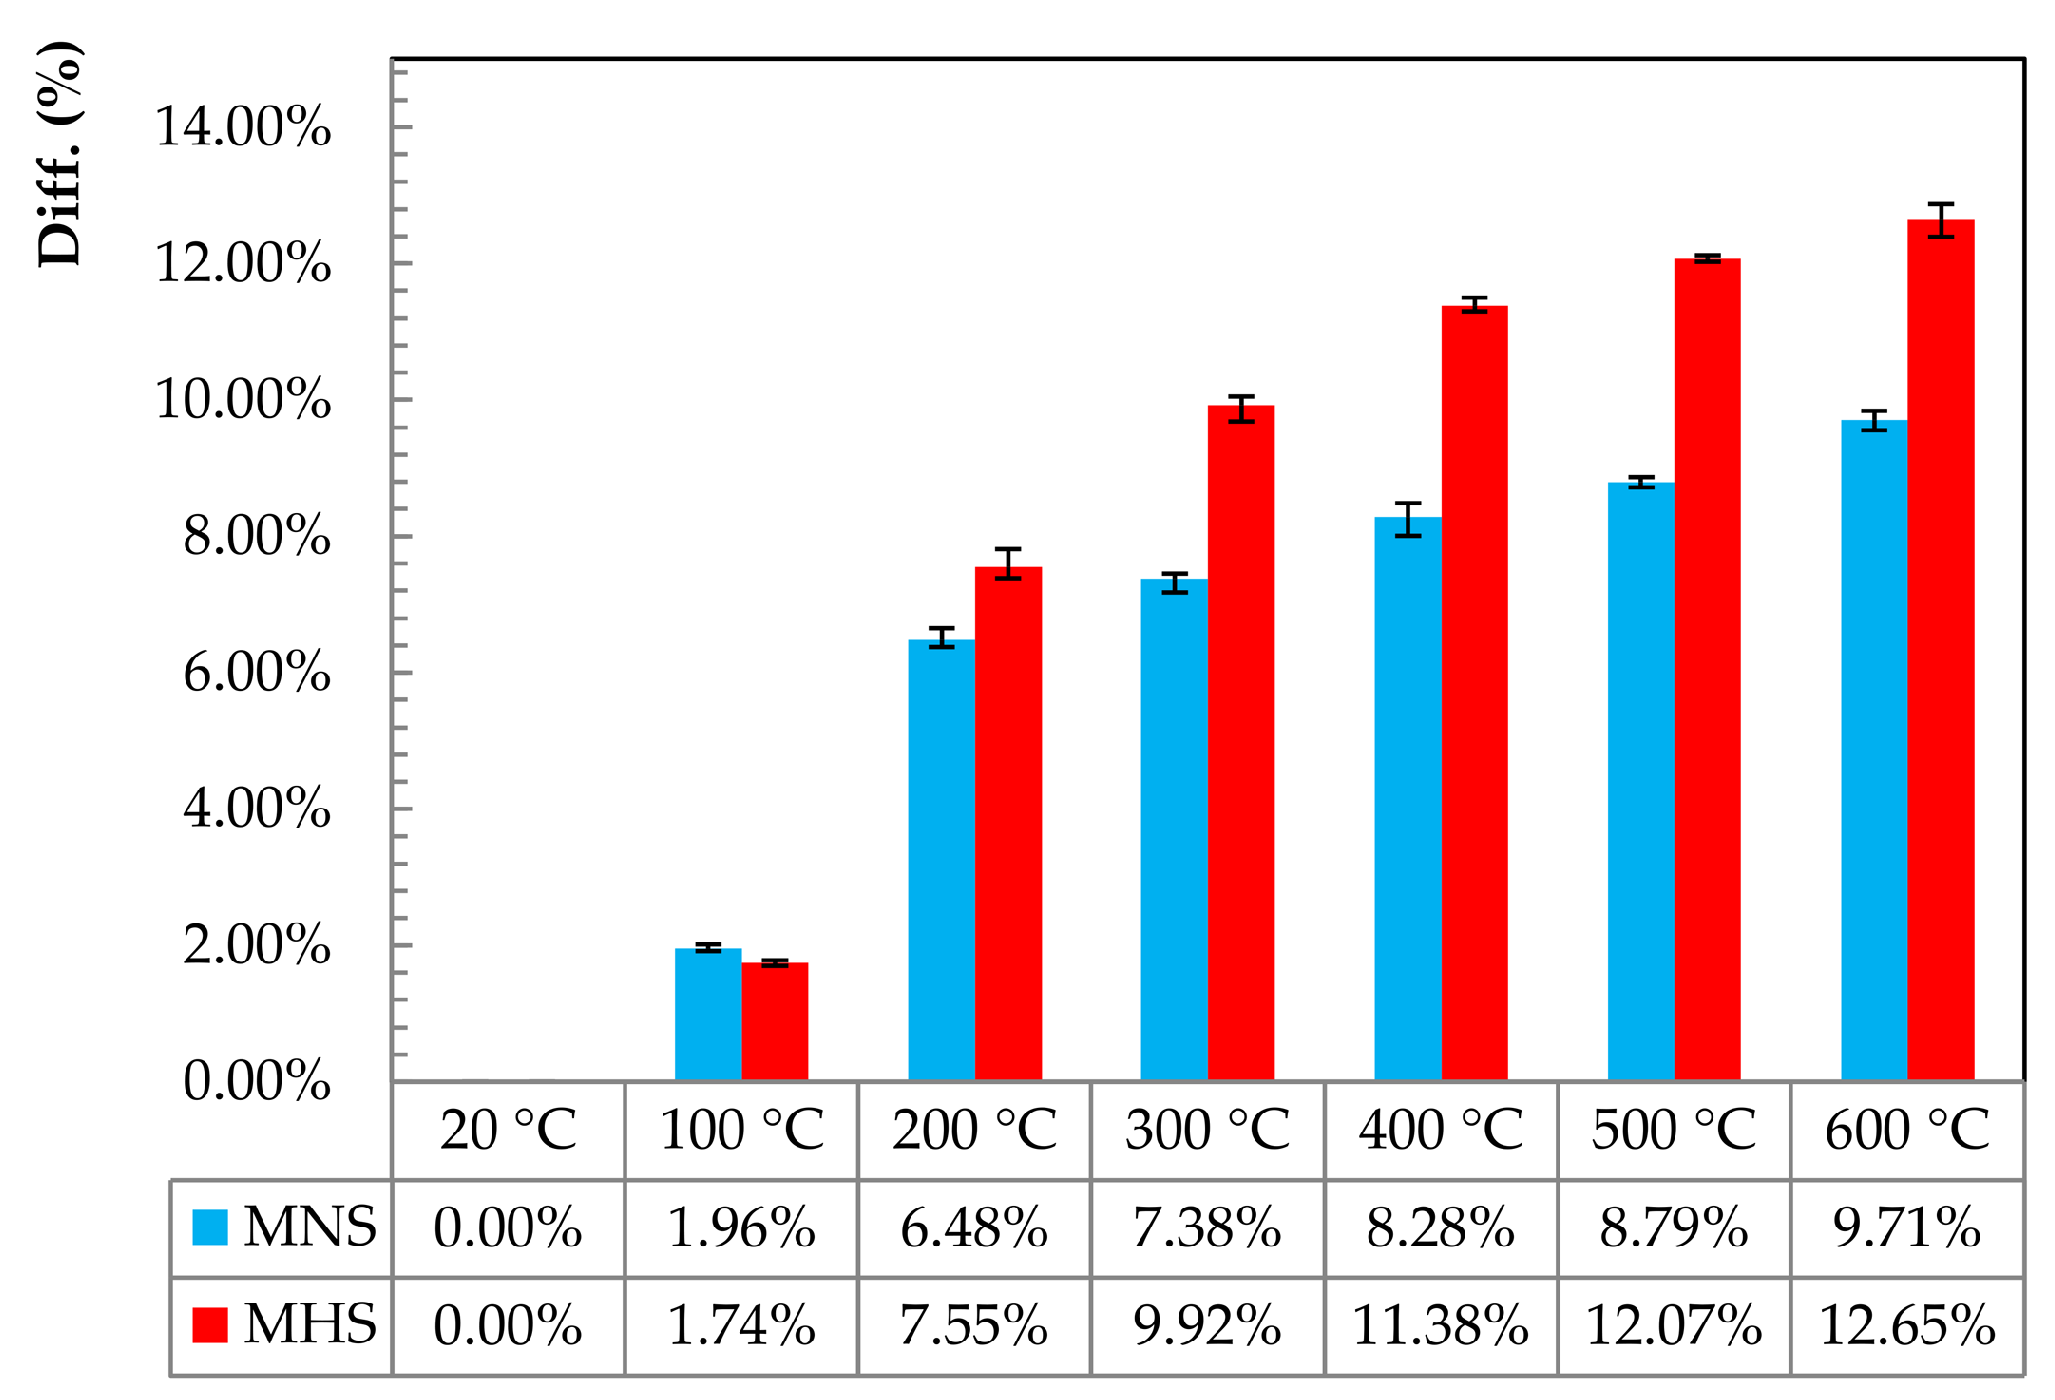
3. Thermal Damages and Weight Loss after Temperature Conditioning

Samples submitted to thermal treatments experiment a typical loss of weight, which evidences the damage suffered by mortars and concretes under the action of high temperatures. In this experimental campaign all the cylindrical specimens (50 mm × 100 mm) were weighted before and after being placed in the furnace. Four specimens per each temperature level and for each mortar type were analyzed for a total of 56 specimens.
In Figure 4 and Figure 5 the weight loss after thermal treatments is presented for MNS and MHS, respectively. The histogram views report the specific weights of the sample before and after the heating (thermal conditioning). Also the values of the D i f f ( % ) = W b e f o r e W a f t e r / W b e f o r e × 100 are addressed in these figures, where W b e f o r e and W a f t e r denote the specimen weights before and after heating, respectively. In both figures, the error bars indicate the scatter of the results, highlighting the difference between the mean value and the min/max among four sample repetitions.
Figure 6 reports the relative weight loss for both mortars. It can be observed that the high strength mortars are more affected by high temperature exposures than normal strength mortars. Samples submitted to the highest level of temperature exposure (i.e., 600 ° C) have a mean weight loss of 9.71% for MNS and 12.65 (significantly higher) for MHS. The same trend can be also observed by analyzing the mid-to-high ranges of temperature exposures (300 ° C, 400 ° C and 500 ° C). Contrarily, comparable weight loss can be seen for low temperature exposures (namely 100 ° C and 200 ° C).
This different behavior between normal- and high-strength mortars can be attributed to those parts of the non-evaporable water (trapped in closed porosity) which are normally greater in high strength composites. The latter, are characterized by being less porous and often, by having less interconnection inside the poro-structure, in comparison with normal strength mortars, and consequently, capable to store a significant amount of non-evaporable water. At mid-to-high temperatures, the occurrence of microcracks leads to a further connection of the closed porosity which allows the water to emigrate and evaporate, resulting in a higher weight loss at composite level.

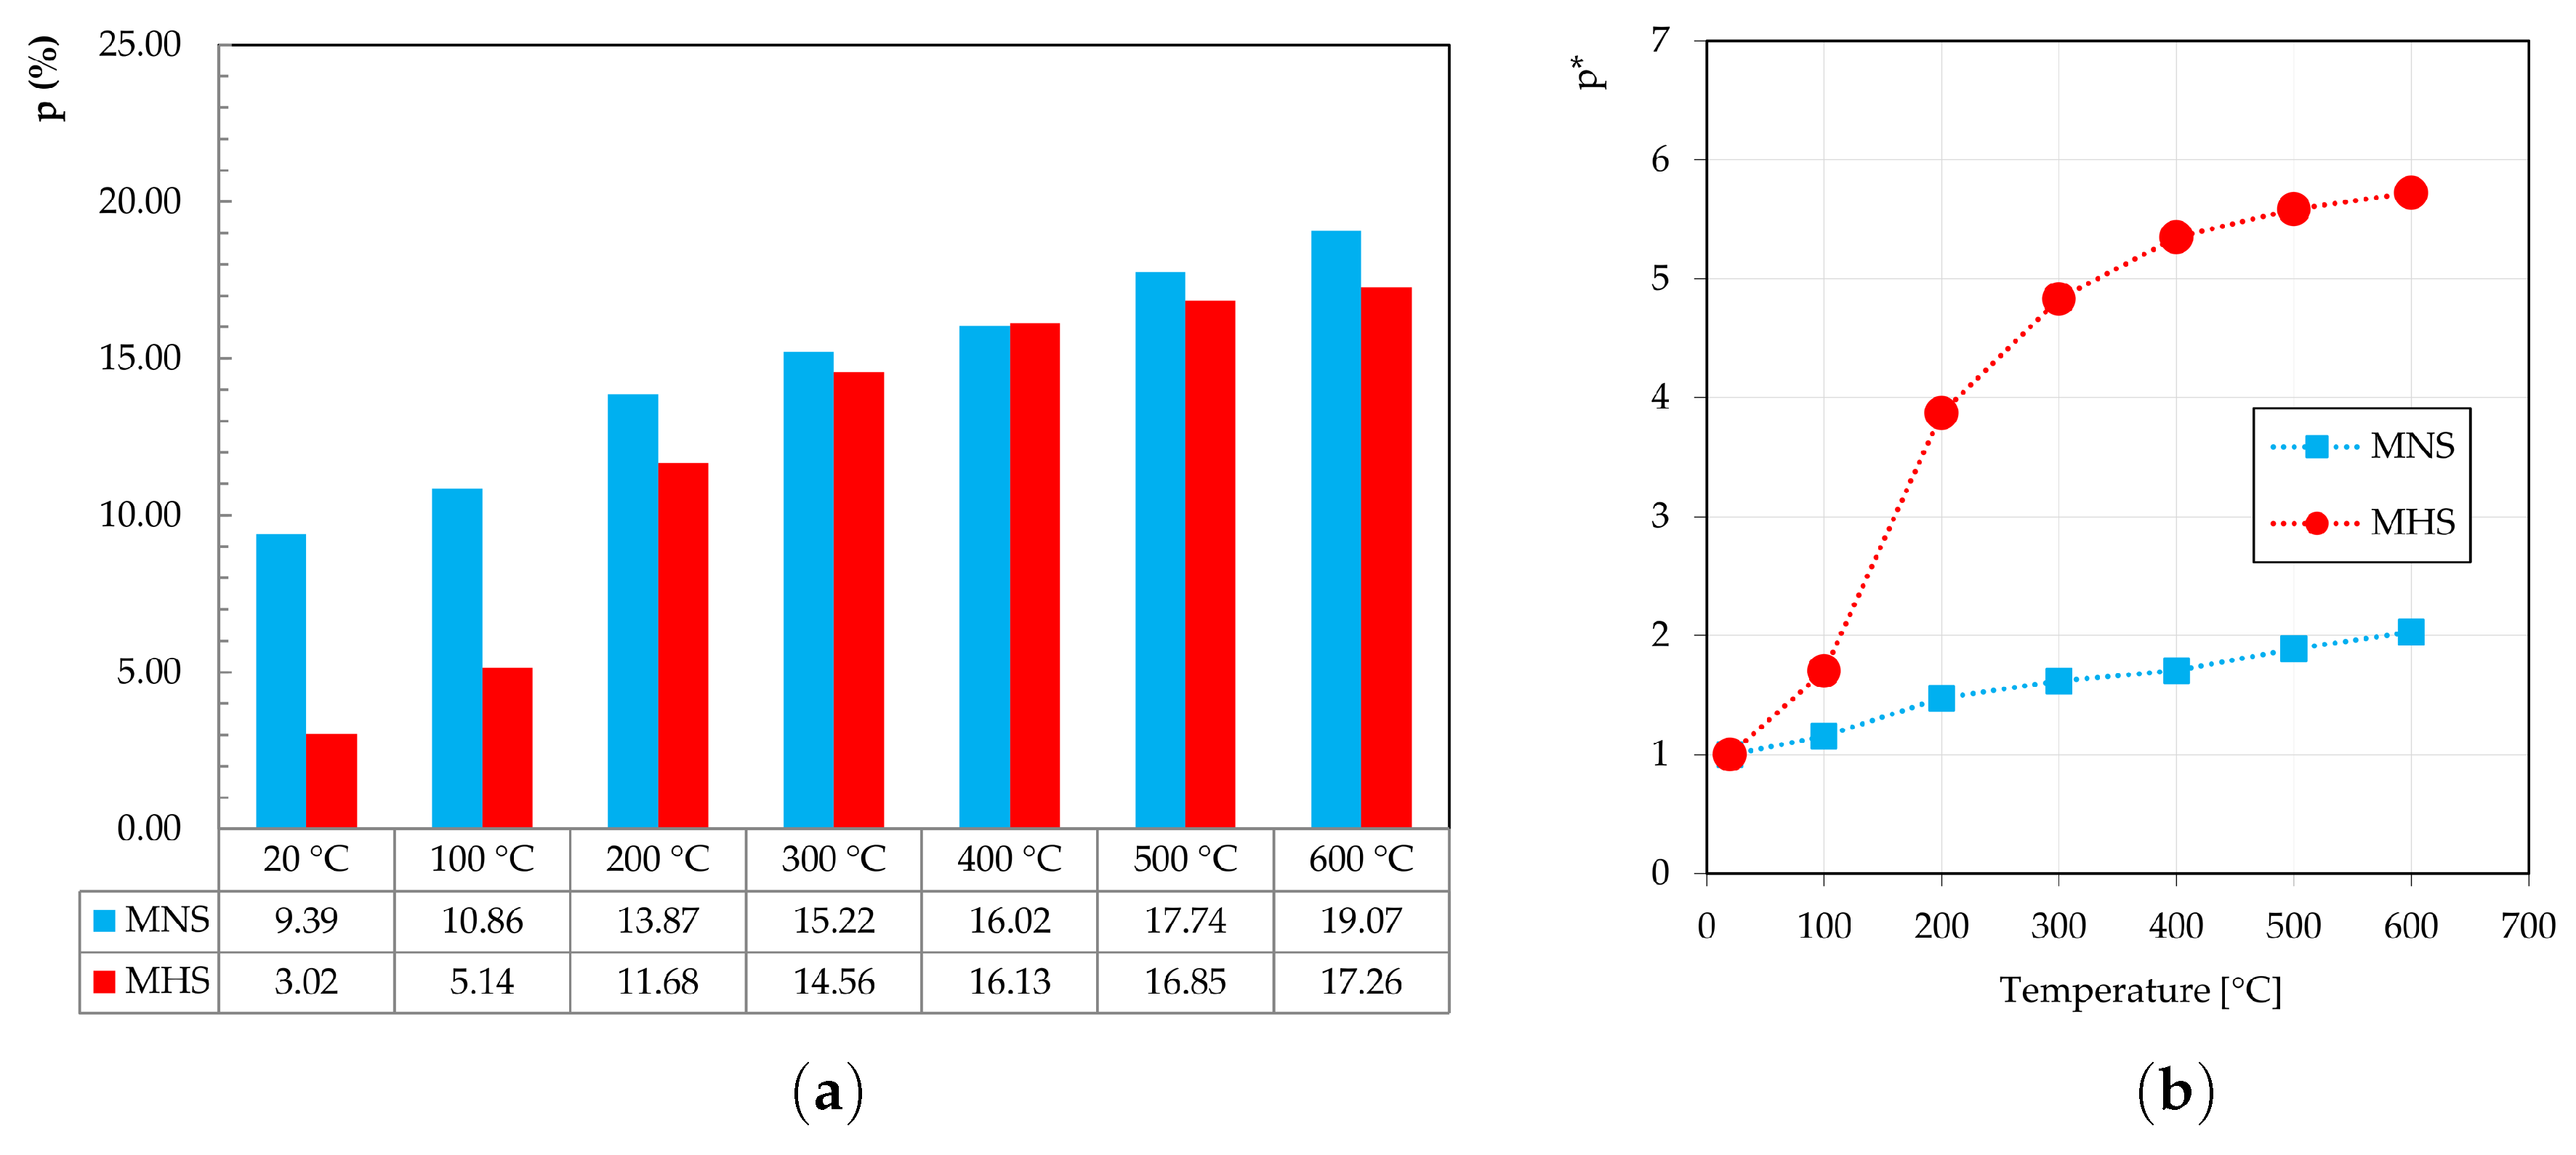
4. Capillary Water Absorption Results

In this section physical properties related to water absorption are evaluated considering the two mortar types (MNS and MHS) at different high temperature levels. In this regard, Figure 7 presents the Capillary water Absorption (CA), in kg/m 2 , of the two mortar mixtures measured at different time steps, in hours, and for different pre-conditioning thermal treatments, in degrees Celsius. The results in Figure 7 show that complete saturation was almost reached in 24 h all specimens. It can be observed in Figure 7a that CA-24 ranged from 4.54 (at 20 ° C) to 22.12 kg/m 2 (at 600 ° C) by considering increasing temperature levels for the MNS samples, while in Figure 7b CA-24 ranged from 0.58 (at 20 ° C) to 18.26 kg/m 2 (at 600 ° C) for MHS ones at increasing temperatures.
From these results, it can be noticed that, by considering the same level of temperature conditioning, normal strength mortar MNS specimens possess a much higher capillarity water absorption than the MHS samples. Actually, higher levels of capillary absorption can be directly correlated to higher volume of accessible porosity. In this sense, the w / b ratio plays a fundamental role in driving the absorption behavior of the composites, especially for those cases conditioning at low temperatures, i.e., 20 ° C and 100 ° C, where the water absorption is driven by only the open porosity of the specimens. In other words, at low temperatures of conditioning, mortars with high values of w / b are characterized by high capillary absorption and accessible porosity. Moreover, the results also demonstrate that temperature effects hugely affect the water absorption of the mortars. Although this effect is relatively much higher on MHS (since the damages due to thermally-induced cracks are more evident in high strength mortars) than on MNS, it is significant on both composites. This means that physical properties of mortars are very sensitive to medium to high temperature levels and consequently the mortar durability performance is greatly affected by thermal effects.
Finally, the values of accessible (open) porosity (p) evaluated as described in UNE-EN 1015-18 (2003) [36], are shown in Figure 8. Particularly, Figure 8a shows the p(%) values for both MNS and MHS at several temperature levels (20 ° C, 100 ° C, 200 ° C, 300 ° C, 400 ° C, 500 ° C and 600 ° C). The values of p(%) varied from 9.39% (at 20 ° C) to 19.07% (at 600 ° ) for MNS, and from 3.02% (at 20 ° C) to 17.26% (at 600 ° C) for MHS. As expected, the mixtures with higher w / b ratio (i.e., MNS mixtures) are characterized by higher values of accessible porosity than those of lower w / b ratio (i.e., MHS mixtures).
It can also be observed in Figure 8a that p(%) increased almost linearly for MNS, while for MHS the increasing of p(%) was more evident from low-to-medium temperatures (up to 300 ° ). This particular physical behavior of MHS specimens can be attributed to a higher development of microcracks in high strength mortars when temperature begins to rise.
On the other hand, Figure 8b reports the dimensionless p * , defined as p * = p ( % ) / p 20 ° C ( % ) , with p 20 ° C ( % ) the porosity of the samples at 20 ° C. This figure mainly helps to comparatively understand the effects of high temperatures in both normal and high strength mortars. Particularly, it shows how thermal treatments more affect MHS than MNS mortars, producing in the MHS ones a greater increase of the p * value measured at certain high temperature compared with p * measure at room temperature (20 ° C).
It is worth mentioning that accessible (open) porosity p(%) for specimens submitted to high temperatures represents a smeared value (i.e., equivalent or apparent open porosity) which accounts for both the open porosity of the specimens and the crack networks generated by thermal treatments and induced damages. Particularly, the micro-to-meso-structural damage, after exposure to elevated temperatures, clearly generates an increase of the water absorption to the specimens. This trend is relatively much more evident in high strength mortars (MHS), due to their higher damage sensitivity to high temperature exposure, in comparison to normal strength ones (MNS).

5. Mechanical Tests

5.1. Compressive and Tensile Strenghts

Performed mechanical tests, as described in Section 2.2.3, included uniaxial compression (UC) for determining compressive strength and mechanical behavior, and both splitting tensile (ST) and three-points bending (TPB), for determining indirect tensile strength. A total of 154 specimens were tested, according to Table 4. Mean strength results are summarized in Table 5.
Based on the UC results in Table 5, Figure 9 shows the evolution of the uniaxial compressive strength f c , normalized with respect to f c at 20 ° C, for increasing temperatures and for each mortar type. It can be observed that compressive strength mainly decreases with the increase of the acting temperatures pre-imposed during the thermal treatments.
A quite gradual reduction in compression strength can be observed in both composites (see Figure 9), i.e., at 300 ° C (mid-level) the decrease of the compressive strength was 19% for both mortar types; while significantly larger reductions occurred under high temperatures exposures (73% and 56% for MNS and MHS, respectively, at 600 ° C). It is important to remark that the obtained strength values of MHS at 100 ° C were too low, indicating some setup error in the corresponding tests.
From Figure 9, it can be concluded that compressive strength reductions of both normal and high strength mortars followed a similar trend under increasing temperatures. However, at temperatures above 400 ° C, MNS presented a higher relative strength loss.
The resulting indirect tensile strengths ( f t S T ) obtained in the splitting tensile tests and detailed in Table 5, are plotted on the left side of Figure 10, normalized with respect to ( f t S T ) at 20 ° C, for increasing temperatures and for each mortar type. The results show the clear incidence of temperature on indirect tensile strength, causing a progressive degradation for increasing thermal effects. MHS specimens were less affected under low temperatures (up to 300 ° C), while for high heat treatments they were greatly affected, presenting important thermal damages. Contrarily, strength loss in MNS mixtures, shows a more gradual (almost linear) dependence on the temperature level than the MHS ones. However, for temperatures above 400 ° C, strength loss was very similar for both mortar qualities.
On the right plot in Figure 10, the obtained flexural tensile strengths ( f t T P B ) corresponding to the three-points bending tests are presented, normalized in this case with respect to ( f t T P B ) at 20 ° C, for increasing temperatures and for each mortar type. From this plot, it can be observed that the effect of thermal treatments leads, as a general trend, to a gradual reduction of the flexural strengths as the temperature levels increase, for both MNS and MHS.
However, a different response between MNS and MHS can be observed for low temperature levels (i.e., up to 200 ° C): the high strength mortars seem to be almost unaffected by thermal treatments up to 200 ° C, and only for 300 ° C strength losses can be appreciated. On the contrary, the normal strength mortars already presented strength reductions when the specimens were submitted to 100 ° C and their strengths continuously reduced when the considered applied temperature increased. However, a quite important reduction was measured in both mortars, especially at 400 ° C and higher temperatures.
Finally, it can be concluded that strength losses in both types of indirect tensile cases considered, which at high temperatures above 400 ° C are much higher that the compressive strength loss, could be attributed to several factors, such as: (i) the chemical dehydration of hardened cement pastes (i.e., conversion of calcium hydroxide into calcium oxide) which produces the reduction of mechanical features of cementitious composites such as cohesion and inner bonds strengths; and (ii) differential strain localization meso-scale mechanisms which produce stress concentrations and propagation of internal cracks. These phenomena generally produce an overall strength reduction of the composites under investigation.

5.2. Uniaxial Compression Test Results and Discussion

Considering that one of the main objectives of the experimental campaign was to deepen the knowledge regarding the mechanical behavior of cement mortars after the exposure to moderate and high temperatures, a special effort was put on measuring and analyzing axial and lateral strains in the UC tests. The typical UC test layout with the corresponding measurement devices was showed in Figure 3. In this Section, the observed mechanical behaviors of the two considered mortar types under UC and corresponding to the seven considered temperatures are presented and analyzed based on the obtained stress-strain curves and other fundamental properties. In the following, sub-indexes “i” (in stresses and strains) indicate i = 3 axial direction while i = 1/2 lateral directions, respectively.

5.2.1. UC—About Obtaining the Mean Stress-Strain Curves

As it was mentioned before, four samples were tested for each mortar submitted to a given temperature, therefore obtaining four curves of stress vs. axial and lateral strains in each UC test. It was then necessary to determine the mean curve representative of the average mechanical behavior.
However, obtaining the average mechanical behavior curve for each case, particularly in the post peak regime, is not a trivial task. Figure 11 depicts an example of a UC test results, in this case, for MNS and 400 ° C. It can be observed the obtained axial stress vs. axial and lateral strains curves for three samples, represented by the thin black lines.
With the purpose of obtaining the mean curves, in the frame of this work a numerical approach was developed and then implemented in Python language. In general terms, each individual curve originally defined by a discrete series of points, was converted in a function f ( x ) using splines for fitting the points and afterwards, the average value was found for a given coordinate. Several particular situations were solved which details exceed the purpose of this paper. The implementation of this automatization for post processing the obtained curves, led to an important saving of time as well as to an improvement of accuracy. In Figure 11, the thickest lines in blue represent the mean curves obtained by the previously described methodology.

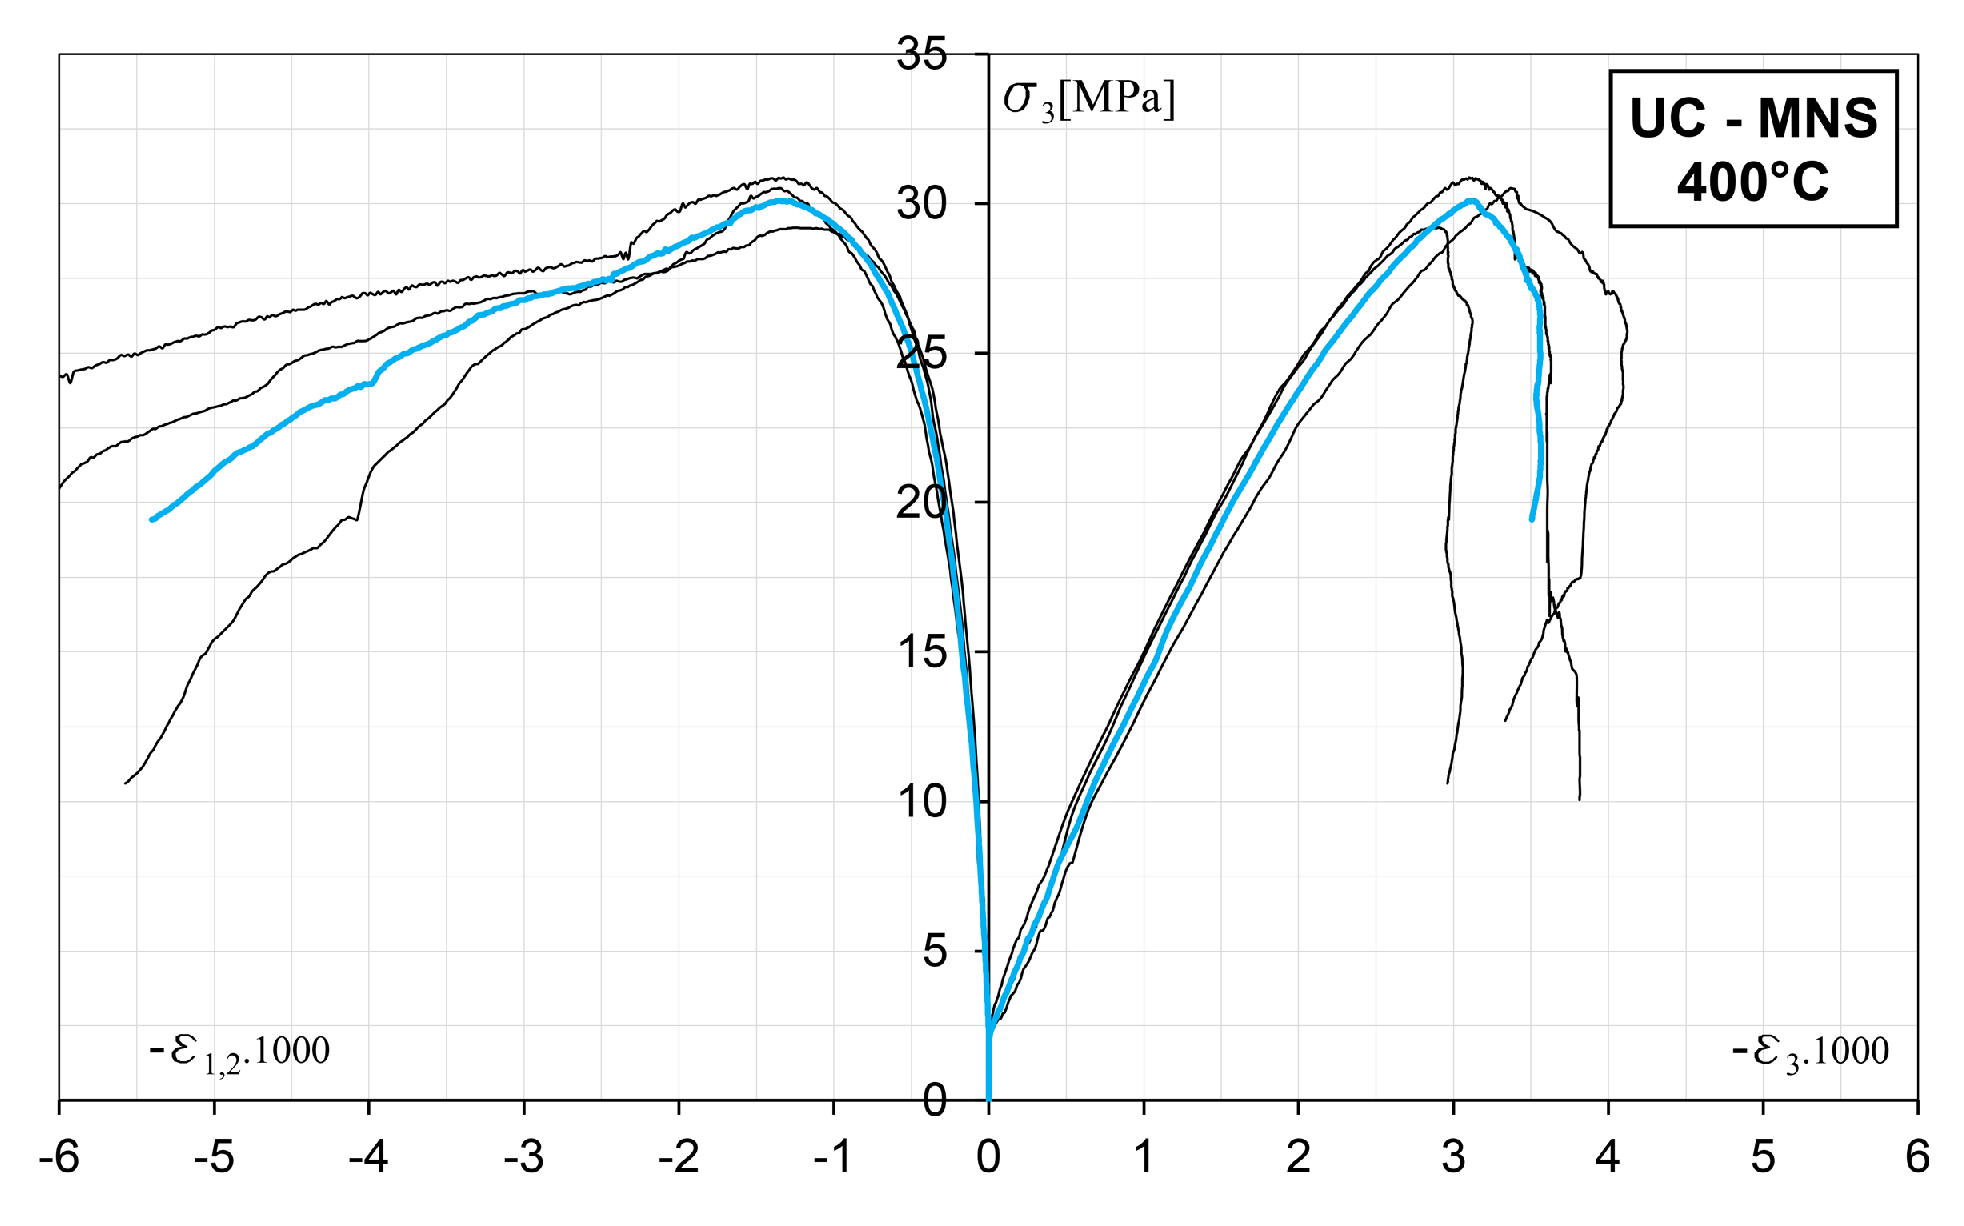
5.2.2. UC—Stress-Strain Results

The mean axial stress vs. axial and lateral strains curves, with normalized stresses in terms of the peak stress at 20 ° C for all the considered temperatures are summarized in Figure 12, for MNS in the figure on the left side and for MHS, in the figure on the right one.
From the figures, it can be seen the progressive damage caused by the action of temperatures on the mechanical behavior of both mortar types. Moreover, by comparing both mortar types, it can be observed that the incidence of the mortar quality cannot be neglected. The MHS shows a very brittle behavior in comparison with that of the MNS. In particular, it can be observed that for the MHS case, almost no post peak measures could be acquired. This is because of the typical behavior characterizing high strength mortars and concretes, with an almost linear elastic behavior in the pre peak regime and an abrupt decay after the peak, which is in general very difficult to be captured with the measurement devices. This fragile behavior is also evidenced in the smaller lateral strains of MHS in comparison with those of the MNS.
In the case of MNS, it can be observed how mixed fracture energy increases with higher temperatures, being the post peak decay much more moderate for high temperatures than for ambient temperature. Unfortunately, this cannot be verified for MHS considering the lack of post peak data. However, from 400 ° C to 600 ° C it can be seen that lateral strains are clearly larger than those corresponding to low temperatures, where an abrupt decay after peak and the interruption of the data acquisition is observed.
The damage caused by the action of increasing temperatures is evidenced not only by the decrease in peak stress, but also in the decrease of Young’s Modulus and in the increment of the absolute value of the axial strain corresponding to the peak stress. Plots in Figure 13 show the obtained values of those two properties. In particular, Young’s Modulus was obtained following ASTM-496-02 [45] as
E c = σ 2 σ 1 ε 2 0.050 × 10 3
being σ 2 the stress corresponding to 40% of the peak load, σ 1 the stress corresponding to an axial strain equal to 0.050 × 10 3 and ε 2 the longitudinal strain produced by σ 2 .

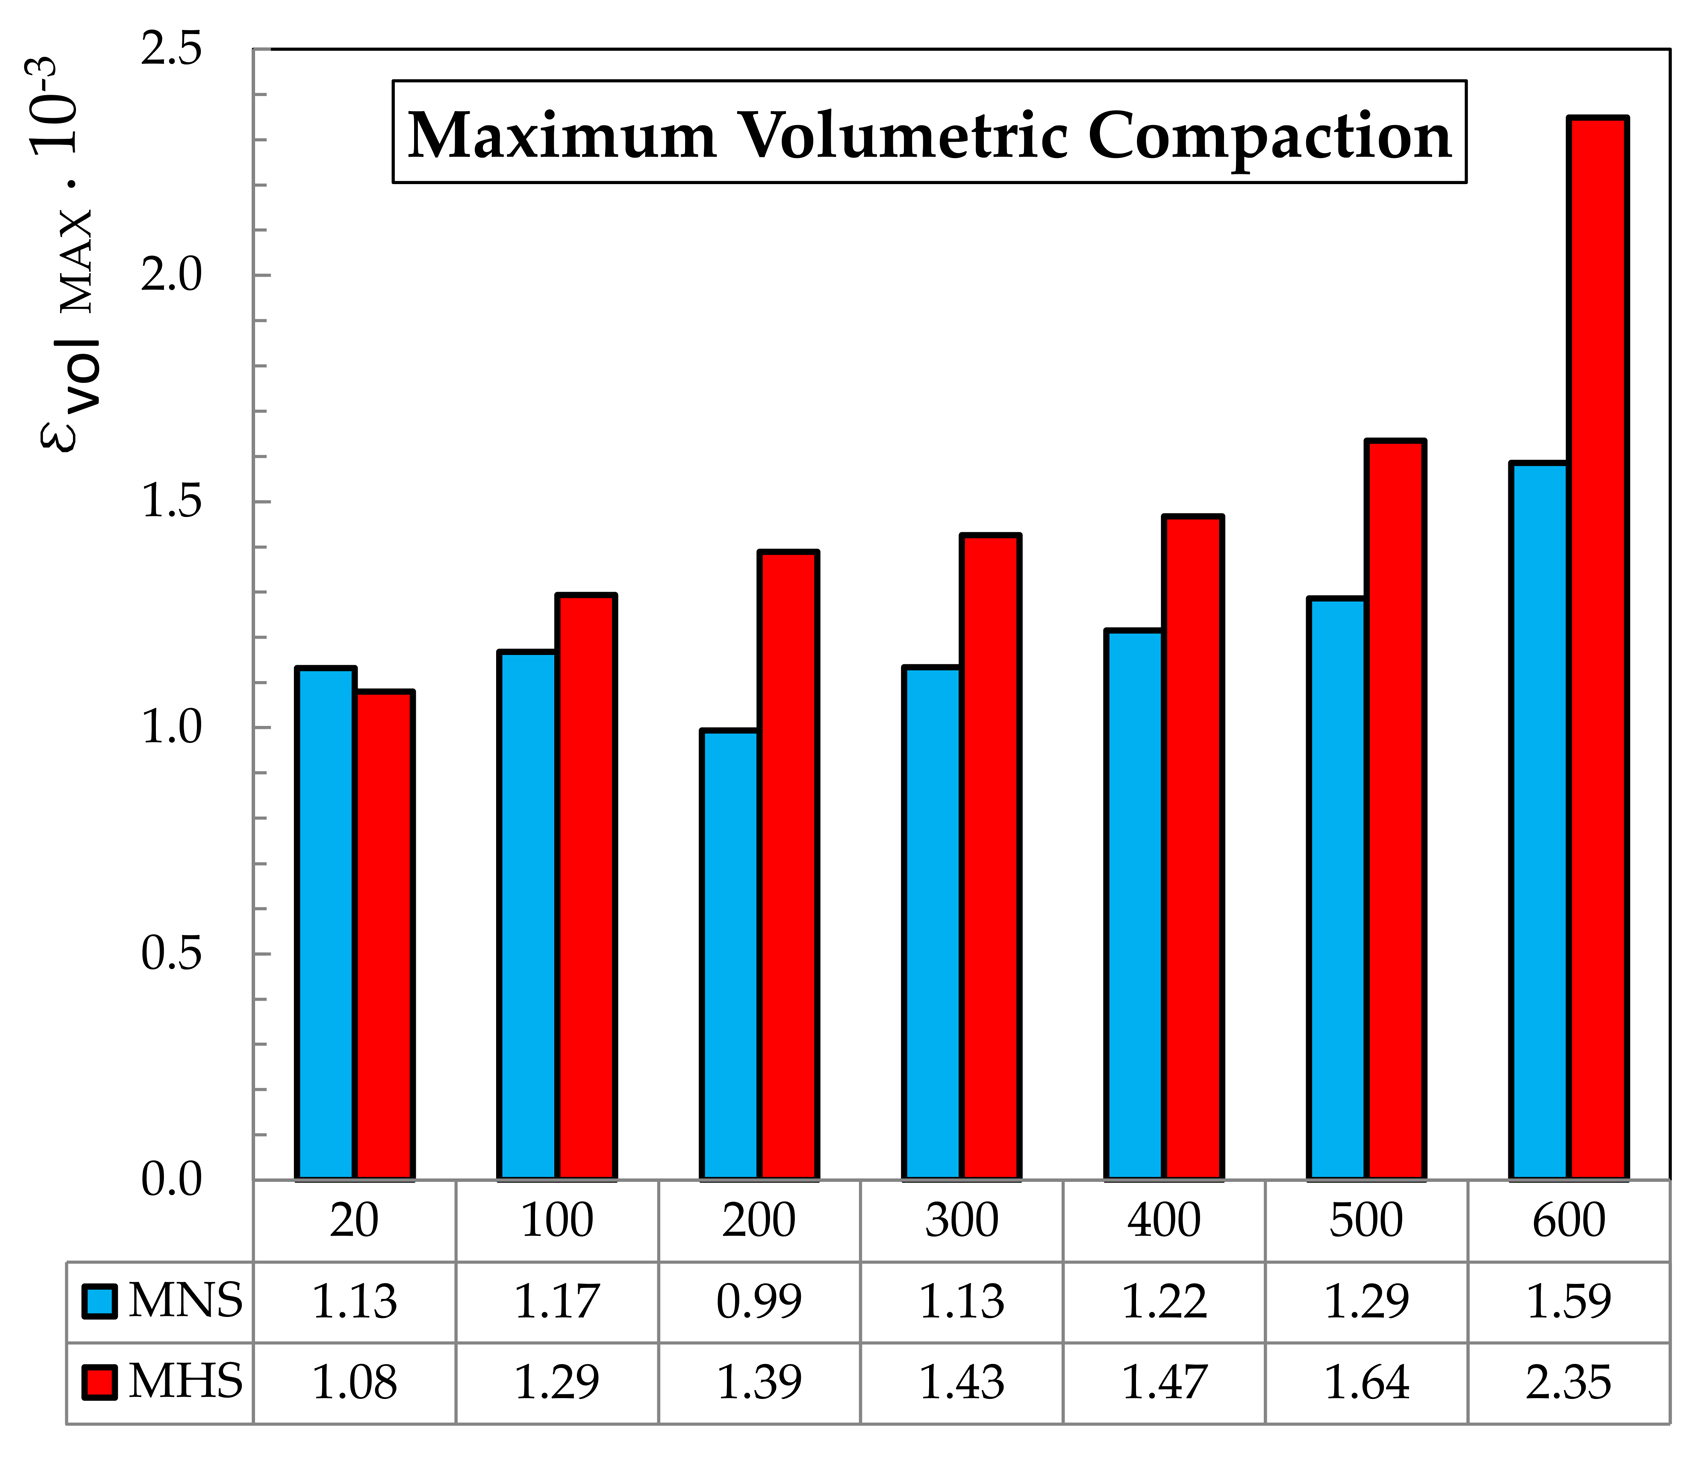
5.2.3. UC—Volumetric Strains

In this Section, volumetric strains defined as ϵ v o l = ϵ 1 + ϵ 2 + ϵ 3 where ϵ 1 and ϵ 2 are the lateral strains and ϵ 3 the axial one, are analyzed.
In Figure 14 the mean axial stress vs. volumetric strains curves, with normalized stresses in terms of the peak stress at 20 ° C for the two mortars and for all the considered temperatures are shown. The figure on the left, presents the MNS results, while the one on the right, the MHS ones.
It can be observed that the initial tangent to the curves, namely the bulk modulus, tends to decrease with increasing temperatures. In what respect to the tendency followed by the maximum compaction with temperature, results are not conclusive. Obtained results of the maximum compaction are summarized in Figure 15.
Coinciding with the conclusions obtained by Shah and Chandra [46], at ambient temperature, both mortars almost do not show a critical stress where volume begins to increase instead of decrease. However, under the action of temperature, it can be observed that this behavior progressively changes and the corresponding curves do present a turning point.

5.2.4. UC—Failure Behavior

Finally, in Figure 16, illustrative images of the samples are shown. The two pictures on the left side of the figure show cylindrical samples of MNS and MHS, respectively, after the thermal treatment at 300 ° C. No damage can be observed on the MNS sample. On the contrary, MHS specimen already presented superficial cracks at that temperature. In the figure, cracks were highlighted on the respective photograph with the purpose of making them visible without zooming.
In turn, the three pictures on the right side of Figure 16 show sample images after the UC test of specimens thermally treated at 300 ° C. The first image corresponds to MNS, the second one to MHS, and the last one to a self-compacting concrete (SCC) analyzed in the frame of a previous experimental campaign (see [14]), having the same w / b ratio of that of the MHS and with almost the same mixture, besides the coarse aggregates content.
It can be observed that cracks on the MNS specimens are inclined and distributed on the whole surface, while on the MHS sample, thin and almost vertical cracks can be seen. By comparing the MHS image with the SCC one, no sustancial difference can be appreciated. However, the maximum volumetric compaction achieved for the MHS, as depicted in Figure 15, was 1.43 × 10 3 , while the corresponding to the SCC was 1.20 × 10 3 [14], a fact that cannot be appreciated in the pictures.

6. Conclusions

In this work, the results of an extensive experimental campaign aimed at evaluating some relevant physical and mechanical properties of normal (MNS) and high strength (MHS) cement mortars after the exposure to high temperatures were presented. The considered mortar types are related with normal and high strength concretes with compressive strengths of 30 and 80 MPa, respectively. Prior to the physical and mechanical tests, mortar samples were thermally treated considering seven levels of temperature, ranging from 20 to 600 ° C. Then, weight loss and capillary water absorption were measured. Finally, uniaxial compression, splitting tensile and flexural tests were performed in residual state. In the following, the main obtained conclusions are pointed out, which are certainly limited to the considered materials and conditions.
-
Physical properties: Specific weight loss was similar for both mortar types at low temperatures (100 ° C and 200 ° C). However, for mid-to-high ranges of temperature exposures, MHS achieved higher relative weight losses than MNS. In turn, MNS showed a much higher capillarity water absorption than MHS samples. Increasing temperatures produced increasing water absorption coefficients, evidencing the thermal damage causing an increase in the accessible porosity. However, that increase was almost linear for MNS, while for MHS it was substantially more evident from low-to-medium temperatures (up to 300 ° ).
-
General conclusions regarding physical tests: The results demonstrated the fundamental role of the w / b ratio in the absorption response of cement composites and consequently, in durability. At ambient temperature, the smaller accessible porosity of high strength mortars indicates a higher performance in comparison to normal strength mortar. However, under the action of increasing temperatures, the thermal damage causes the formation of micro cracks, generating further connection of the closed porosity and consequently, allowing the water, initially trapped in closed porosity, to emigrate and evaporate. As result, the internal porosity structure of lower w / b ratio mixtures are more affected by the action of temperature.
-
Compressive and tensile strengths: In all cases, strengths suffered a progressive degradation due to temperature. While at low to medium temperatures, strength loss resulted similar for both mortar types, at the highest temperature, MNS presented a higher relative loss of strength than that of MHS. It was also observed that the loss of tensile strength after the exposure to the highest temperatures was higher in comparison to the loss of compressive strength.
-
Uniaxial compression: The action of temperature caused in all cases a decrease of Young’s Modulus and an increase in the strain corresponding to peak load. The MHS showed a much more brittle behavior in comparison with that of the MNS, for all the considered temperatures. Samples of both mortar types that were not exposed to temperature, almost did not show a critical stress where volume begins to increase instead of decrease. On the contrary, after the action of temperature, the corresponding stress-volumetric strains curves did present a turning point, showing a behavior similar to that of concrete.
Future works related with the experimental results presented in this paper include the numerical analysis of the mesoscopical behavior of concrete considering the mortar relevant properties and taking into account the mortar quality.

Author Contributions

Conceptualization, A.C., M.R., H.X. and P.F.; experimental tests: H.X. and M.R.; data processing: M.R., I.I., K.B. and P.F.; writing—original draft preparation, A.C. and P.F.; project administration, P.F. All authors have read and agreed to the published version of the manuscript.

Funding

This research was funded by the Universidad de Buenos Aires, UBA, grant number UBACyT 2018 20020170200382BA.

Acknowledgments

The authors gratefully acknowledge the financial support of this work by the Universidad de Buenos Aires. They also acknowledge the valuable contributions of Luis Fernández Luco, Gregorio Pytlowany and Franco Dios in the development of the experimental program.

Conflicts of Interest

The authors declare no conflict of interest.

References

  1. Le, D.; Tran, S.; Torero, J.; Dao, V. Application of digital image correlation system for reliable deformation measurement of concrete structures at high temperatures. Eng. Struct. 2019, 192, 181–189. [Google Scholar]
  2. Zhai, Y.; Deng, Z.; Li, N.; Xu, R. Study on compressive mechanical capabilities of concrete after high temperature exposure and thermo-damage constitutive model. Constr. Build. Mater. 2014, 68, 777–782. [Google Scholar]
  3. Khaliq, W. Mechanical and physical response of recycled aggregates high-strength concrete at elevated temperatures. Fire Saf. J. 2018, 96, 203–214. [Google Scholar]
  4. Culfik, M.S.; Ozturan, T. Effect of elevated temperatures on the residual mechanical properties of high-performance mortar. Cem. Concr. Res. 2002, 32, 809–816. [Google Scholar]
  5. Zhang, Q.; Ye, G. Dehydration kinetics of Portland cement paste at high temperature. J. Therm. Anal. Calorim. 2012, 110, 153–158. [Google Scholar]
  6. Ma, Q.; Guo, R.; Zhao, Z.; Lin, Z.; He, K. Mechanical properties of concrete at high temperature—A review. Constr. Build. Mater. 2015, 93, 371–383. [Google Scholar]
  7. Fu, Y.F.; Wong, Y.L.; Poon, C.S.; Tang, C.A. Numerical tests of thermal cracking induced by temperature gradient in cement-based composites under thermal loads. Cem. Concr. Compos. 2007, 29, 103–116. [Google Scholar]
  8. Sahani, A.K.; Samanta, A.K.; Roy, D.K.S. Influence of mineral by-products on compressive strength and microstructure of concrete at high temperature. Adv. Concr. Constr. 2019, 7, 263–275. [Google Scholar]
  9. Saha, A.K.; Sarker, P.K.; Golovanevskiy, V. Thermal properties and residual strength after high temperature exposure of cement mortar using ferronickel slag aggregate. Constr. Build. Mater. 2019, 199, 601–612. [Google Scholar]
  10. Sonal, T.; Urmil, D.; Jay, P. Effect of high temperature on fly ash-based alkali activated concrete compared to Portland cement concrete. Int. J. Mater. Struct. Integr. 2019, 13, 257–273. [Google Scholar]
  11. Ahmed, W.; Baloch, W.L.; Khushnood, R.A. Fire performance of concrete containing nano-fibers and graphite nano-particles. In Smart Nanoconcretes and Cement-Based Materials; Elsevier: Amsterdam, The Netherlands, 2020; pp. 297–311. [Google Scholar]
  12. Cao, M.; Ming, X.; Yin, H.; Li, L. Influence of high temperature on strength, ultrasonic velocity and mass loss of calcium carbonate whisker reinforced cement paste. Compos. Part B Eng. 2019, 163, 438–446. [Google Scholar] [CrossRef]
  13. Akca, A.H.; Ozyurt, N. Deterioration and recovery of FRC after high temperature exposure. Cem. Concr. Compos. 2018, 93, 260–273. [Google Scholar]
  14. Xargay, H.; Folino, P.; Sambataro, L.; Etse, G. Temperature effects on failure behavior of self-compacting high strength plain and fiber reinforced concrete. Constr. Build. Mater. 2018, 165, 723–734. [Google Scholar]
  15. Wahid, N.; Stratford, T.; Bisby, L. Calibration of concrete damage plasticity model parameters for high temperature modelling of reinforced concrete flat slabs in fire. In Proceedings of the Applications of Structural Fire Engineering, Singapore, 13–14 June 2019; p. 6. [Google Scholar]
  16. Liu, K.; Xie, H.; Jin, C.; Huang, S.; Wang, F. The equivalent plasticity strain analysis of snow-melting heated pavement concrete exposed to inner elevated temperatures. Constr. Build. Mater. 2017, 137, 66–75. [Google Scholar]
  17. Neuenschwander, M.; Knobloch, M.; Fontana, M. Suitability of the damage-plasticity modelling concept for concrete at elevated temperatures: Experimental validation with uniaxial cyclic compression tests. Cem. Concr. Res. 2016, 79, 57–75. [Google Scholar]
  18. Grassl, P.; Pearce, C. Mesoscale approach to modeling concrete subjected to thermomechanical loading. J. Eng. Mech. 2010, 136, 322–328. [Google Scholar]
  19. Caggiano, A.; Etse, G. Coupled thermo-mechanical interface model for concrete failure analysis under high temperature. Comput. Methods Appl. Mech. Eng. 2015, 289, 498–516. [Google Scholar]
  20. Caggiano, A.; Schicchi, D.S.; Etse, G.; Ripani, M. Meso-scale response of concrete under high temperature based on coupled thermo-mechanical and pore-pressure interface modeling. Eng. Fail. Anal. 2018, 85, 167–188. [Google Scholar]
  21. Lammi, C.; Zhou, M. Multi-Physics Modeling of Fire-Induced Damage in High-Performance Concrete. Int. J. Multiphys. 2016, 8, 101–122. [Google Scholar]
  22. Lee, J.; Xi, Y.; Willam, K.; Jung, Y. A multiscale model for modulus of elasticity of concrete at high temperatures. Cem. Concr. Res. 2009, 39, 754–762. [Google Scholar]
  23. Burlion, N.; Pijaudier-Cabot, G.; Dahan, N. Experimental analysis of compaction of concrete and mortar. Int. J. Numer. Anal. Meth. Geomech. 2001, 25, 1467–1486. [Google Scholar] [CrossRef] [Green Version]
  24. Yurtdas, I.; Chen, D.; Huc, D.W.; Shao, J.F. Influence of alkali silica reaction (ASR) on mechanical properties of mortar. Constr. Build. Mater. 2013, 47, 165–174. [Google Scholar] [CrossRef]
  25. Kohees, M.; Sanjayan, J.; Rajeev, P. Stress-strain relationship of cement mortar under triaxial compression. Constr. Build. Mater. 2019, 220, 456–463. [Google Scholar] [CrossRef]
  26. Zemri, C.; Bouiadjra, M.B. Comparison between physical-mechanical properties of mortar made with Portland cement (CEMI) and slag cement (CEMIII) subjected to elevated temperature. Case Stud. Constr. Mater. 2020, 12, e00339. [Google Scholar] [CrossRef]
  27. Algourdin, N.; Hung, B.S.; Mesticou, Z.; Larbi, A.S. Effects of high temperature on mechanical behaviour and physicochemical properties of recycled mortars and its components. Constr. Build. Mater. 2020, 248, 118554. [Google Scholar] [CrossRef]
  28. Saridemir, M.; Çelikten, S.; Yildirim, A. Mechanical and microstructural properties of calcined diatomite powder modified high strength mortars at ambient and high temperatures. Adv. Powder Technol. 2020, 31, 3004–3017. [Google Scholar] [CrossRef]
  29. Benli, A.; Karatas, M.; Toprak, H.A. Mechanical characteristics of self-compacting mortars with raw and expanded vermiculite as partial cement replacement at elevated temperatures. Constr. Build. Mater. 2020, 239, 117895. [Google Scholar] [CrossRef]
  30. Fares, H.; Noumowe, A.; Remond, S. Self-consolidating concrete subjected to high temperature Mechanical and physicochemical properties. Cem. Concr. Res. 2009, 39, 1230–1238. [Google Scholar] [CrossRef]
  31. Karatas, M.; Benli, A.; Arslan, F. The effects of kaolin and calcined kaolin on the durability and mechanical properties of self-compacting mortars subjected to high temperatures. Constr. Build. Mater. 2020, 265, 120300. [Google Scholar] [CrossRef]
  32. Folino, P.; Ripani, M.; Xargay, H.; Rocca, N. Comprehensive analysis of Fiber Reinforced Concrete beams with conventional reinforcement. Eng. Struct. 2020, 202, 109862. [Google Scholar] [CrossRef]
  33. Norma IRAM 50000. Cementos para Uso General. Composición y Requisitos, 4th ed.; Instituto Argentino de Normalización y Certificación: Buenos Aires, Argentina, 2019. [Google Scholar]
  34. Norma IRAM 50001. Cementos con Propiedades Especiales. Requisitos, 4th ed.; Instituto Argentino de Normalización y Certificación: Buenos Aires, Argentina, 2019. [Google Scholar]
  35. UNE-EN (2007b); UNE-EN 1015-10:2000/A1. Methods of Test for Mortar for Masonry—Part 10: Determination of Dry Bulk Density of Hardened Mortar; AENOR: Madrid, Spain, 2007. [Google Scholar]
  36. UNE-EN 1015-18. Methods of Test for Mortar for Masonry—Part 18: Determination of Water Absorption Coefficient Due to Capillary Action of Hardened Mortar; AENOR: Madrid, Spain, 2003. [Google Scholar]
  37. Palomar, I.; Barluenga, G.; Puentes, J. Lime-cement mortars for coating with improved thermal and acoustic performance. Constr. Build. Mater. 2015, 75, 306–314. [Google Scholar] [CrossRef]
  38. Guardia, C.; Schicchi, D.S.; Caggiano, A.; Barluenga, G.; Koenders, E. On the capillary water absorption of cement-lime mortars containing phase change materials: Experiments and simulations. Build. Simulation. Tsinghua Univ. Press 2020, 13, 19–31. [Google Scholar] [CrossRef]
  39. Gonen, T.; Yazicioglu, S. The influence of compaction pores on sorptivity and carbonation of concrete. Constr. Build. Mater. 2007, 21, 1040–1045. [Google Scholar] [CrossRef]
  40. Chindaprasirt, P.; Rukzon, S. Strength, porosity and corrosion resistance of ternary blend Portland cement, rice husk ash and fly ash mortar. Constr. Build. Mater. 2008, 22, 1601–1606. [Google Scholar] [CrossRef]
  41. ASTM-C39-05. Standard Test Method for Compressive Strength of Cylindrical Concrete Specimens; Annual Book of ASTM Standards; American Society for Testing and Materials: West Conshohocken, PA, USA, 2006. [Google Scholar]
  42. ASTM-C496-05. Standard Test Method for Splitting Tensile Strength of Cylindrical Concrete Specimens; Annual Book of ASTM Standards; American Society for Testing and Materials: West Conshohocken, PA, USA, 2006. [Google Scholar]
  43. Norma IRAM 1622. Cemento Portland. Determinación de Resistencias Mecánicas; Instituto Argentino de Normalización y Certificación: Buenos Aires, Argentina, 2006. [Google Scholar]
  44. EN 196-1. Methods of Testing Cement—Part 1: Determination of Strength; European Committee for Standardisation (CEN): Brussels, Belgium, 2005. [Google Scholar]
  45. ASTM-C469-02. Standard Test Method for Static Modulus of Elasticity and Poisson’s Ratio of Concrete in Compression; Annual Book of ASTM Standards; American Society for Testing and Materials: West Conshohocken, PA, USA, 2002. [Google Scholar]
  46. Shah, S.P.; Chandra, S. Critical stress, volume change, and microcracking of concrete. ACI J. Proc. 1968, 65, 770–780. [Google Scholar]
Figure 1. Internal view of the electric furnace.
Applsci 10 06455 g001
Figure 2. Immersion in water of the specimens for measuring capillary water absorption coefficients of mortars MNS and MHS.
Applsci 10 06455 g002
Figure 3. Experimental setups in (a) UC, (b) ST test and (c) F tests.
Applsci 10 06455 g003
Figure 4. Weight loss due to thermal treatments for the normal strength mortar MNS.
Applsci 10 06455 g004
Figure 5. Weight loss due to thermal treatments for the high strength mortar MHS.
Applsci 10 06455 g005
Figure 6. Relative weight loss (Diff.%) for MNS and MHS.
Applsci 10 06455 g006
Figure 7. Capillarity water absorption coefficient of (a) MNS and (b) MHS, at several times of immersion (0 h, 0.5 h, 1 h, 3 h, 7 h and 24 h).
Applsci 10 06455 g007
Figure 8. Open (and apparent) porosity (a) p(%) and (b) p * for MNS and MHS at different temperature levels.
Applsci 10 06455 g008
Figure 9. Evolution of compressive strength with temperature. Relative values to the reference compressive strength at 20 ° C.
Applsci 10 06455 g009
Figure 10. Evolution of indirect tensile strength with temperature corresponding to: (a) ST (Splitting Tensile tests) and (b) TPB (Three-Points Bending tests). Relative values with respect to the reference tensile strength at 20 ° C.
Applsci 10 06455 g010
Figure 11. Uniaxial Compression—Axial stress vs. axial and lateral strains curves for Mortar MNS corresponding to a temperature of 400 ° C.
Applsci 10 06455 g011
Figure 12. Uniaxial Compression—Mean axial stress vs. axial and lateral strains curves, normalized in terms of the peak stress at 20 ° C for all the considered temperatures and for: (a) MNS and (b) MHS.
Applsci 10 06455 g012
Figure 13. Uniaxial Compression: Evolution with temperature of (a) Young’s Modulus and (b) Peak strain.
Applsci 10 06455 g013
Figure 14. Uniaxial Compression—Mean axial stress vs. volumetric strains curves, normalized in terms of the peak stress at 20 ° C for all the considered temperatures for (a) MNS and (b) MHS.
Applsci 10 06455 g014
Figure 15. Uniaxial compression: Evolution with temperature of maximum volumetric compaction.
Applsci 10 06455 g015
Figure 16. Images of specimens after exposure to 300 ° C—(a) On the left side: MNS and MHS after thermal treatment, and (b) On the right side: after UC tests on MNS, MHS and SCC samples.
Applsci 10 06455 g016
Table 1. Mix proportioning of the two mortar systems.
MNSMHS
[kg/m 3 ][kg/m 3 ]
Water287.8301.0
Cement589.5 (CPN40)602.0 (CPN50)
Blast furnace slag-258.0
River sand971.0393.1
Crushed sand416.1709.8
Super-plasticizer-4.3
w / b 0.490.35
Table 2. Properties of CPN40 and CPN50 cements employed in the experimental activities.
CementTypeStrength after 2 dStrength after 28 dDensity
[MPa][MPa][kg/m 3 ]
PortlandCPN40>10≥10≤603150
PortlandCPN50>20≥20-3150
Table 3. Water absorption and density of sands.
Sand TypeAbsorptionDensity
[%][kg/m 3 ]
River sand0.502630
Crushed sand0.802670
Table 4. Overview of the experimental program. The number in the table indicates the number of repetitions per test-type (for either MNS or MHS, except in the case of CA).
WCAUCSTTPB
Temperature50 × 100 [mm]50 × 100 [mm]50 × 100 [mm]50 × 100 [mm]40 × 40 × 160 [mm]
[ ° C](cyl)(cyl)(cyl)(cyl)(beam)
2041(MNS)3(MHS)434
10041(MNS)2(MHS)434
20041(MNS)1(MHS)434
30042(MNS)1(MHS)434
40041(MNS)1(MHS)434
50041(MNS)2(MHS)434
60041(MNS)1(MHS)434
Table 5. Mean peak stresses in UC, ST and TPB tests.
TemperatureUCSTTPB
[ ° C] f c [MPa] f t S T [MPa] f t T P B [MPa]
MNSMHSMNSMHSMNSMHS
2046.5577.125.136.998.359.42
10046.6562.324.776.907.998.88
20038.4267.364.636.607.139.56
30037.5862.583.345.454.998.08
40030.0944.282.993.594.865.02
50021.6640.681.993.003.084.57
60012.7734.001.091.761.142.78

