1. Introduction
Total hip arthroplasty (THA) is one of the most successful orthopedic procedures with effective results in terms of durability and improvement in the quality of life [
1]. However, perioperative periprosthetic femur fracture (PPF) after THA is a rare but devastating complication, with higher rates of morbidity and mortality.
Generally, PPFs occur during the surgical implantation of the prosthesis as a consequence of the induced mechanical stress by the stem insertion [
2]; moreover, in the majority of the cases, the fracture discovered after some time post-operatively. In [
3], it is reported from experimental evidence that the incidence of perioperative prosthetic femur fractures ranges from 0.3 to 27.8% in patients with cemented femoral components, and 2.95% to 27.8% in patients with cementless femoral components, such an incidence being independent on the age or sex of the patients as reported by Adel et al. [
4].
Typically, when a cementless stem is implanted, the fracture events occur during femoral canal broaching or implant insertion while trying to obtain a tight press-fit [
5]. Cracks in the proximal femur due to press-fit stem implantation are often recognized only after surgery when patients already started to mechanically load their prosthesis [
6]. It remains unclear which patient-dependent and/or hospital-dependent factors predispose to PPF after primary THA [
7].
Due to the reflections above, and considering the evidence, surgeons usually rely on their experience since they do not have the support of quantitative mechanical measures for their decision-making process [
8,
9,
10]. Generally, it reduces to a conservative choosing option: “older and less-healthy” patients receive cemented implants while for “younger and healthier” are preferred un-cemented prostheses [
11].
Although the fracture is a mechanical problem, while the literature is rich of works oriented to reduce the stress levels within the bone during the post-operative life of the implant through different optimization strategies [
12,
13,
14,
15,
16], the intra-operative risk of PPF is poorly studied, at least in terms of outcomes to be directly adopted by surgeons. Malekmotiei et al. [
17] proposed an analytical approach to study the interference fit problem of the femoral stem in cementless THA. Esposito et al. [
18] proposed a numerical-based patient-specific strategy to estimate the risk of intra-operative PPF. To simulate the actual press-fitting phenomenon (i.e., the interaction between prosthesis and femur), a volumetric expansion of the broach volume was considered, since the female volume inside the femur is smaller than the male volume of the stem. This expansion was obtained by applying a fictitious uniform variation of temperature to the broach nodes. The presented Finite Element (FE) model refers to a patient-specific Computed Tomography (CT) that is labor intensive to create, characterizes the mechanical properties of the femur and evaluates a priori ratios between geometrical and thermo-mechanical parameters [
19]. Computational time for meshing, preventing singularities due to the automatic model reconstruction [
20] and solving the structural problem can also be extensive. The solutions obtained by computational mechanics are very useful to get scientific insight on the behavior of the implants and to interpret the experimental evidence, but it is rather cumbersome to be used as a light and quick tool for intraoperative assistance to the surgeon’s decision. With the aim scope of obtaining a patient-specific evaluation, it is mandatory that the mechanical data, concerning bone density and shape could be inputted in a straightforward way. Moreover, it is desirable that the analysis is completed in a few minutes.
In the present work, a simplified model is solved for evaluating the mechanical stress the bone tissue suffers during hip prosthesis implant. The results were compared to those obtained from Finite Element Method (FEM) analysis by Esposito et al. [
18]. The procedure is based on an approximate model that consists of a plane representation of the femur cross-section, used to calculate the analytical solution of the implant of a prosthesis stem modeled as applied radial displacement constraints. To achieve this aim, the approach used is based on the limit analysis methodology that ascribes the structural collapse to the fulfillment of limit condition for the material in conjunction with the suitable distribution of limit zones within the structure [
21,
22]. The mechanical compatibility is defined through the von Mises measure of strain. However, the use of different strain measures as limit parameter can be introduced without significant modification of the application. Literature data concerning bone resistance are mainly proposed in terms of limit strain that results from experimental analysis [
23,
24]. The closed-form solution of the simplified model is obtained starting from the data constituted by the bone section characterization deriving from CT from the patient that furnishes the tissue density and the characteristic radius of the bone sections. Finally, the radius of the inner hollow and of the stem suggest the displacement constraints be applied as loading. The stress and the strain distribution are calculated and expressed in the form of a traffic color lights code in order to furnish direct and concise information to the medical operators. The assumed criterium was that starting from the fact that in the neighborhood of the implant the strain will always reach the limit but this is not a condition of collapse, the fracture risk increase if the overstrained zone approaches the cortical zone that has to be preserved in order to prevent bone failure. Hence, in the simplified criterion we have three possibilities: when the cortical zone appeared to have the strain level under the elastic limit, i.e., yield strain, the fracture risk is assumed to be null, when it presented the strain measure laying between the yield and the ultimate limit the fracture risk factor is considered low, finally, when the cortical zone strain measure is completely over limit, the fracture risk is high.
The aim of the study is to propose a methodology towards an app to estimate in a reliable and feasible way, patient-specific perioperative femur fracture risk and thereby make it both easier for the surgeon and safer for the patient to select more accurately between cemented or non-cemented implant in THA.
In the following section, the procedure is described starting from the formulation of the mechanical problem of a two-phase hollow cylinder loaded by applied prescribed displacement on the inner boundary. The constraint simulated the action produced by the insertion of the stem of the prosthesis into the femur. The material phases were constituted by cancellous and cortical materials whose mechanical parameters depended on CT numbers. The structure was analytically calculated, the von Mises strain was evaluated and compared with the yield and ultimate limit of the material. The results were compared with some actual patients’ case studies confirming the proposed prediction of the Fracture Risk. In conclusion, the methodology provided direct and easy to interpret results that could be the basis on which founding the decision-making process on the typology of the prosthesis to implant. The measures, deriving from actual patient CT, allowed considering the methodology as a patient-specific method for the prediction of the intra-operative femur fracture risk.
2. Materials and Methods
In this section, the novel analytical solution of a piecewise homogeneous annulus subjected to applied displacement constraints is presented. The analytical solution was used as a simplified model of the behavior of a femur section during the hip prosthesis implant. The hypotheses of the model are plane strain and piecewise constant homogeneous elastic material that simulate heterogeneity of bone tissue. More accurate description is possible using Functional Graded Materials where graded transition can be obtained [
25].
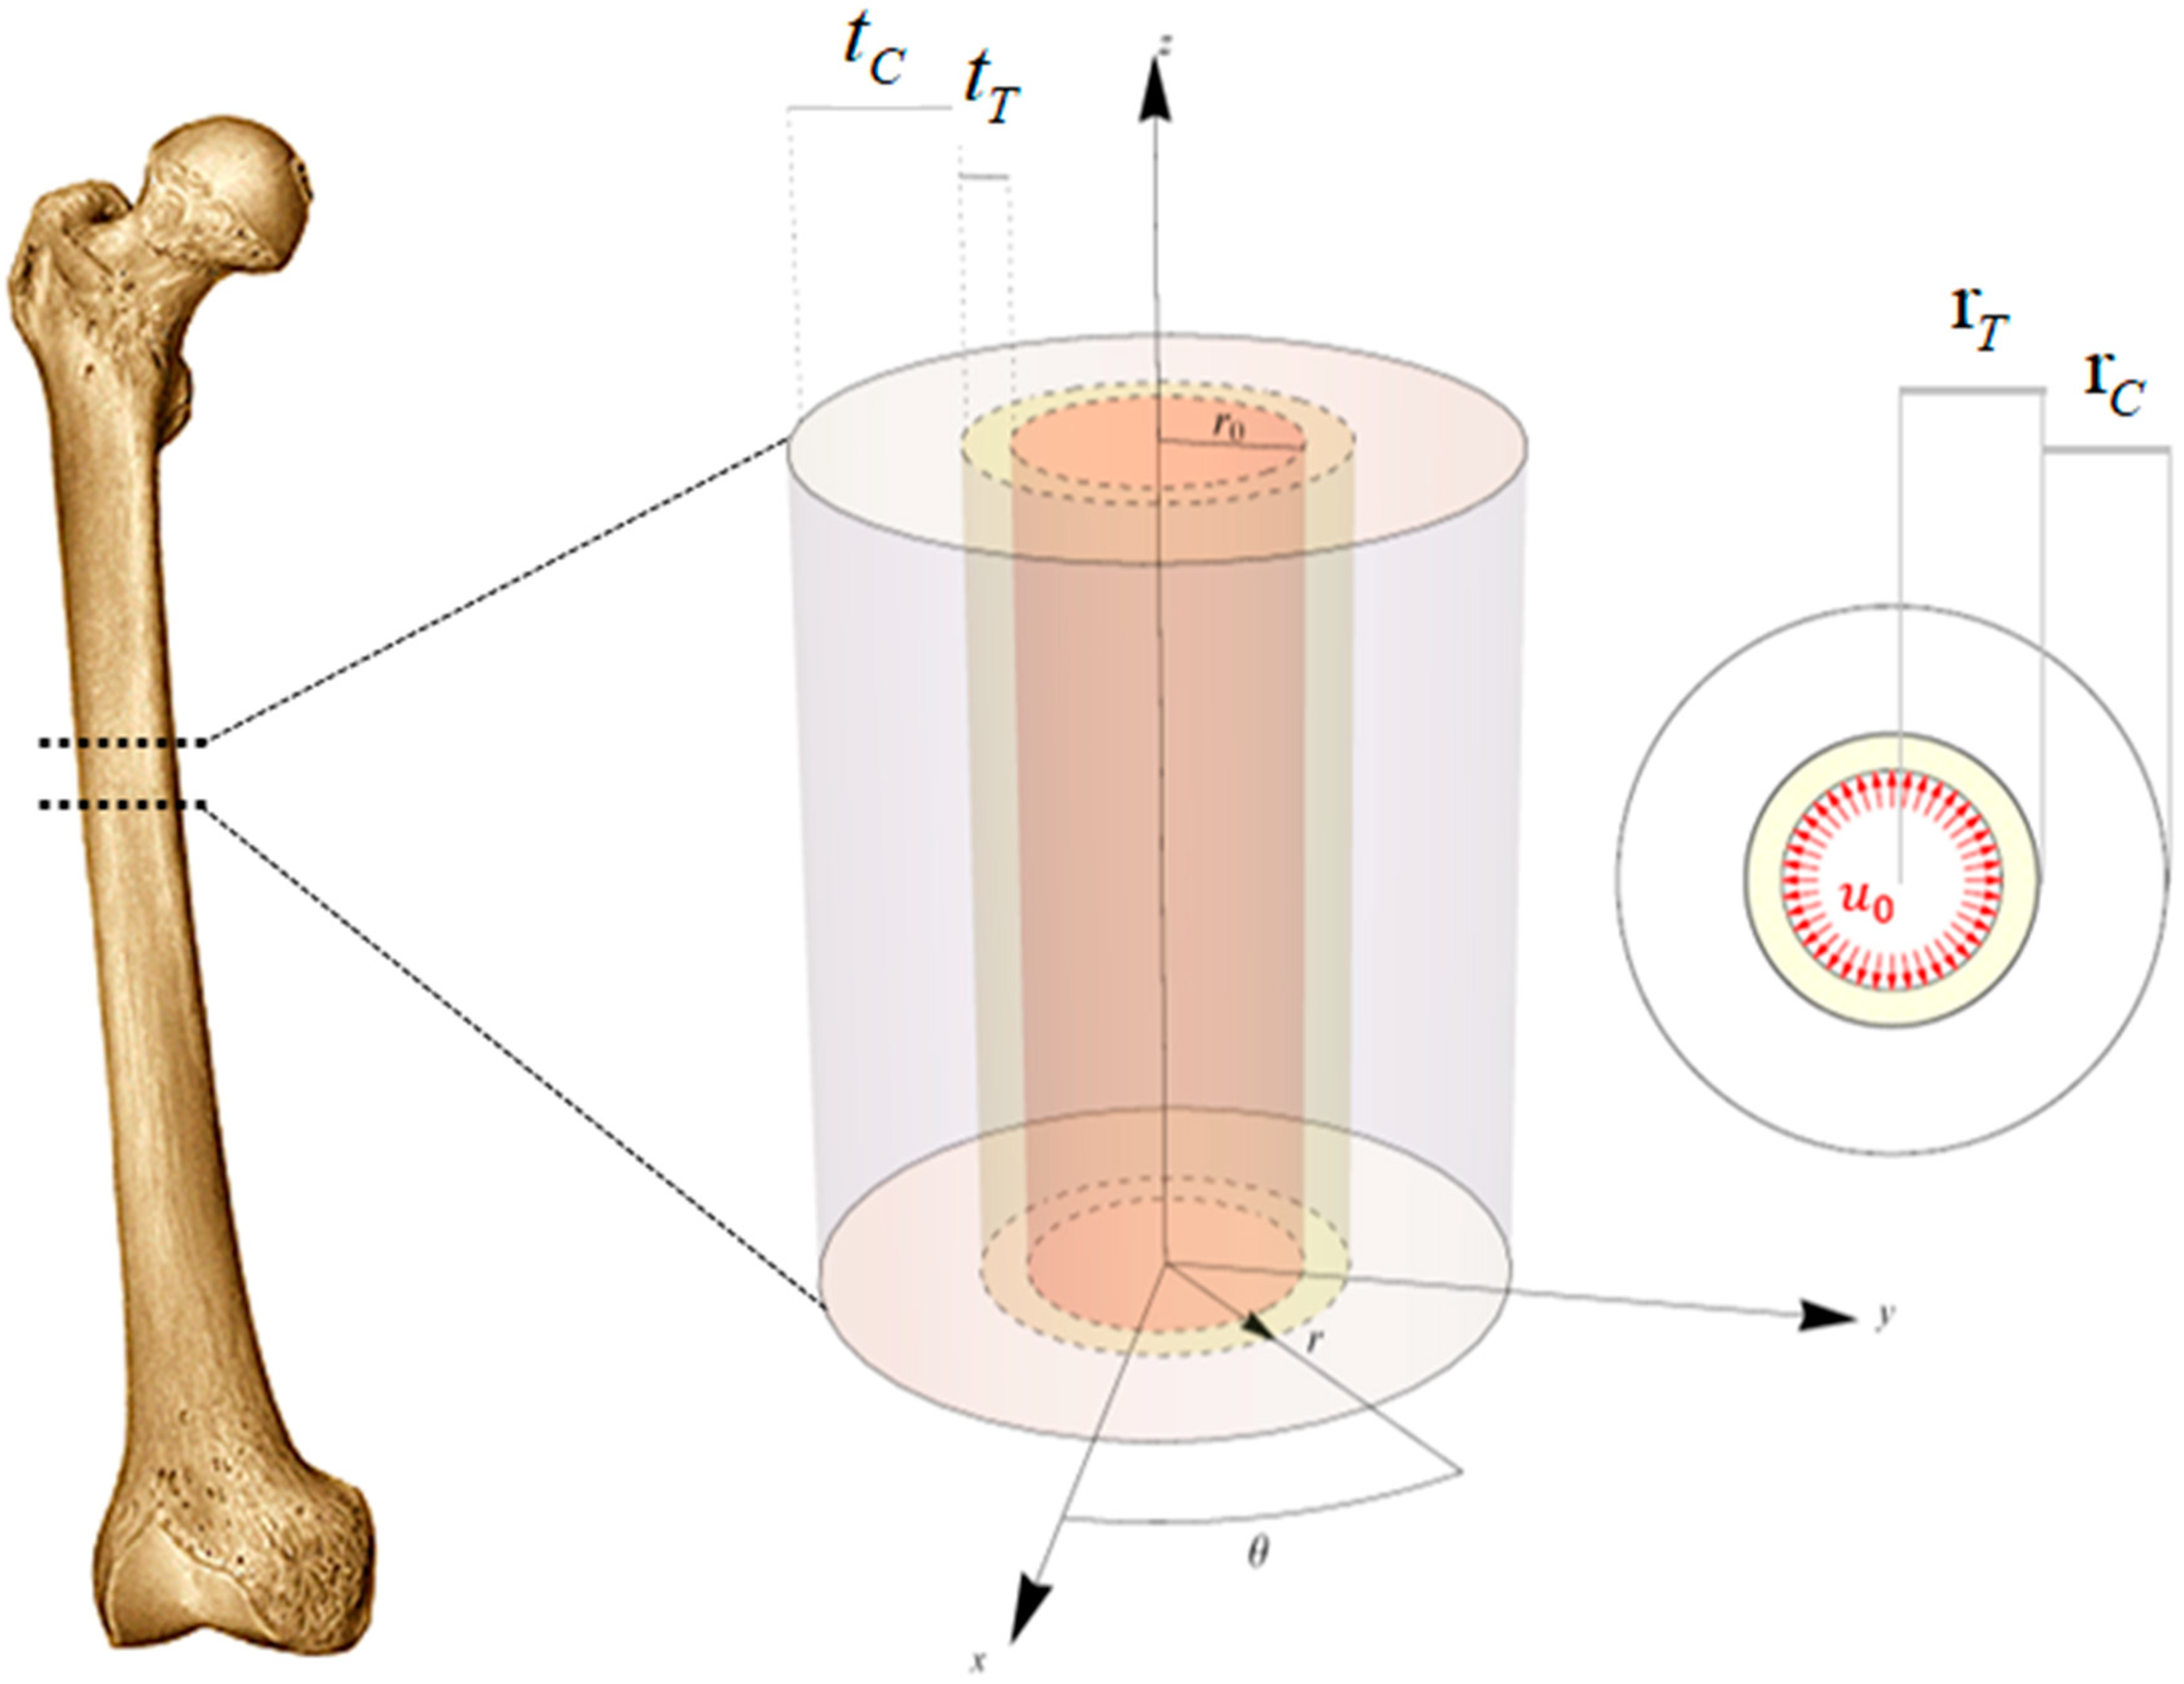
To study the interaction between the prosthesis and the bone tissue by means of an analytical approach that overcome the difficulties and the computational effort due to large computational approaches, the femoral diaphysis was modeled as a biphasic hollow cylinder (
Figure 1 left).
The internal cavity represented the diaphyseal canal, while the central and the external phases the trabecular and cortical bone, respectively. The only geometrical parameter of the model is the radius of the generic annulus, the bone regions were described by the geometric loci whose definition inequalities are:
where
is the internal radius,
and
are respectively the trabecular radius and the trabecular thickness and
and
denote the radius and the thickness of the cortical region.
The cancellous and the cortical bone tissues were supposed—at the macroscopic scale of interest—as overall isotropic and linear elastic materials [
26]. However, the spatially inhomogeneous mechanical properties due to the different levels of bone mineral density were taken into account, averaging the actual stiffness and strength values over proper domains of the idealized hollow bi-phase cylinder, denoting trabecular and cortical bone tissue elastic moduli, densities, yield and ultimate strains, respectively as
,
,
,
and
,
,
,
. Poisson coefficients were indicated as
and
, assuming
due to the small influence of the Poisson coefficient variability to the mechanical response. In the literature one can find values varying at most in the interval [0.3–0.1], but this is often a result of the characteristic size of the specimen used for experimental tests and of the introduction of anisotropic elasticity. In the case in which the isotropy is instead assumed as a result of the small size of the ideal specimen (e.g., the voxel on which the average mineral content measured via Quantitative Computed Tomography (QCT) and the elastic coefficients are so evaluated), the porosity of the trabecular tissue can be considered to be stereological and the eventual inhomogeneity becomes responsible for the spatial variation of the elastic moduli. Under this assumption (isotropy at the scale of the voxel), in the transition from dense (cortical) to porous (trabecular/spongy) bone, the Poisson ratio can be considered to be constant, as the theory of homogenization and standard solutions in micromechanics ensure [
27,
28,
29]. However, we performed some sensitivity analyses and verified that variabilities of the Poisson coefficient in the above-mentioned range does not affect the results significantly, as it is easy to verify.
In the case of THA without the use of the cement, in order to reach the press-fit of the prosthesis into the femur, the stem component volume results generally 10% greater than the volume prepared by the surgeon in the diaphysis canal. For this reason, due to the insertion of the prosthesis, the stem component is forced to occupy the undersized surgically prepared volume into the femoral diaphysis, by pressing on the surrounding bone tissue by a prescribed radial displacement, namely
(
Figure 1 right). The value of prescribed displacement is derived by starting from the slight volume discrepancy due to the fact the surgical procedure suggest inserting a prosthesis whose volume is slightly greater than the volume of the diaphyseal canal to so guarantee the best fit and at early stage stability of the implant. Under the hypotheses of axial symmetry as well as in real geometry of the problem this volume difference is then reflected in a prescribed displacement, due to the pushing of the prosthesis toward the innermost walls of the diaphyseal canal [
18].
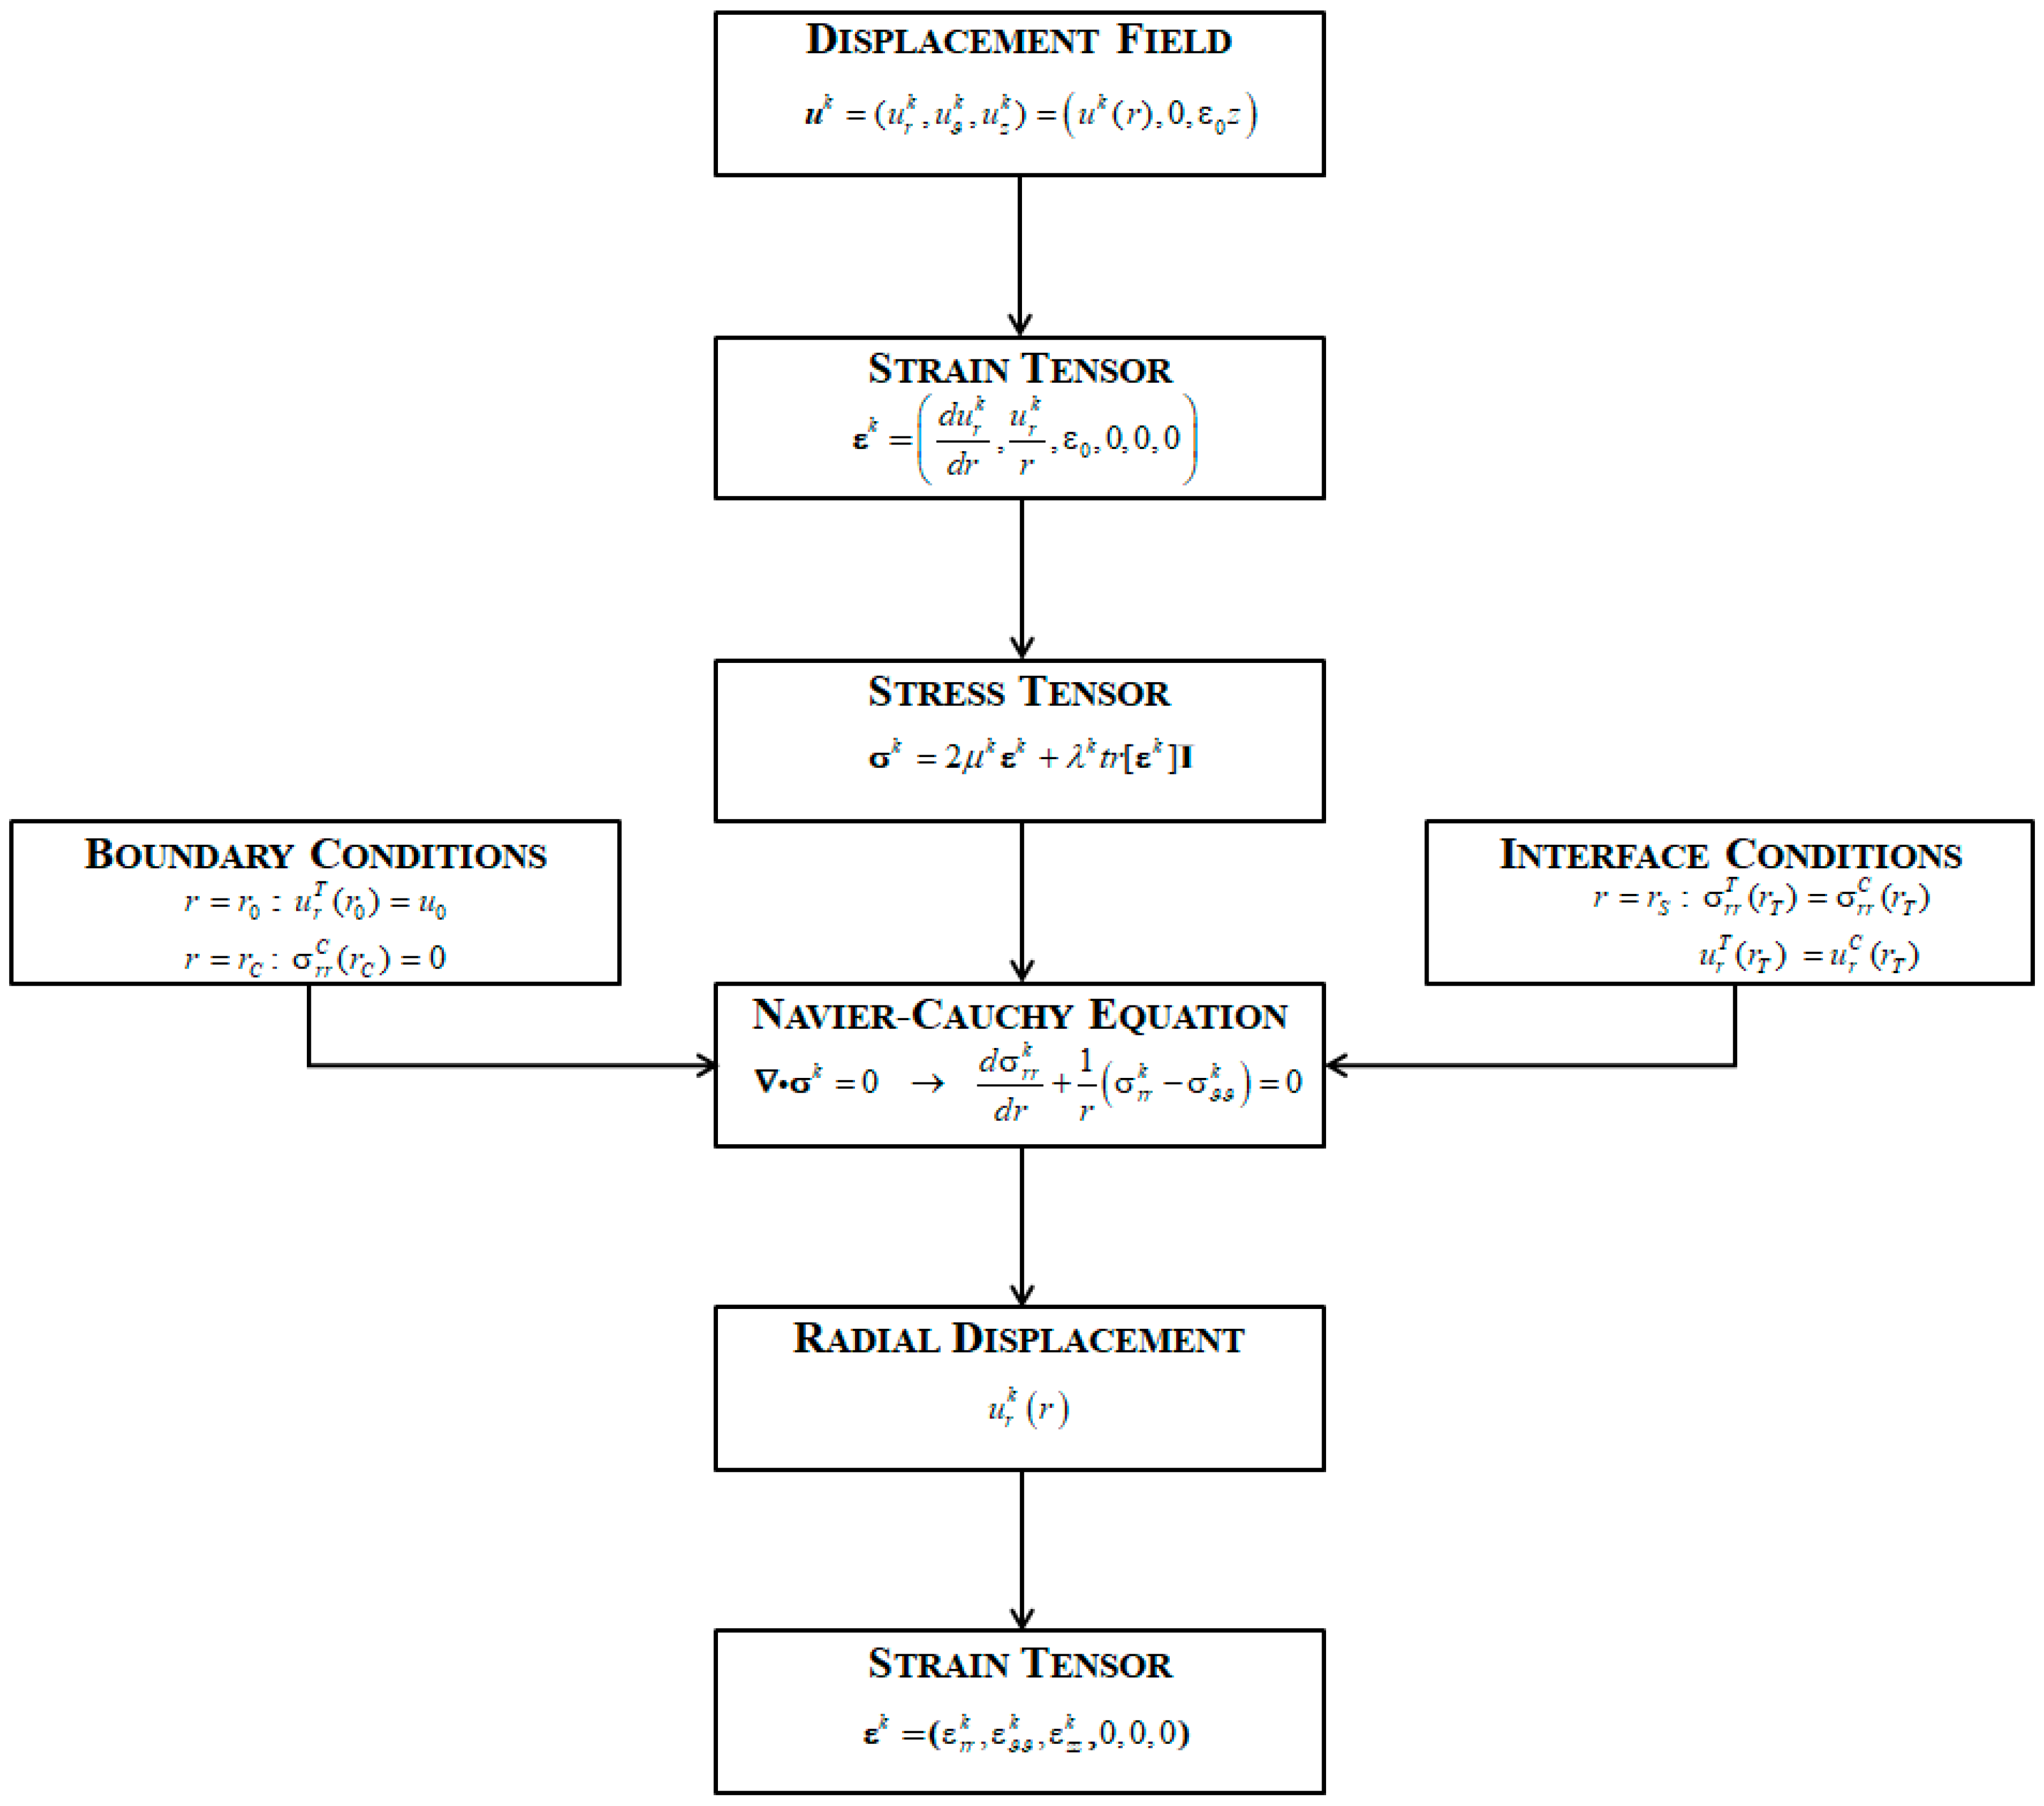
With the aim of simulating this scenario, a linear elastic analysis was carried out in the hypothesis of small displacements through an analytical procedure implemented in the software Mathematica
® (Wolfram Research, Champaign, IL, USA, 2019). By using a cylindrical reference system
, the kinematics of the problem was described by means of the following displacement field
with
denoting respectively the radial, circumferential and longitudinal components of the displacement, and the apex
referring to the bone tissue phase type (
: trabecular,
: cortical).
The strain tensor was expressed in the Voigt’s notation
being
the radial strain,
the circumferential strain and
the longitudinal strain. In particular, the axial strain,
, is considered constant and is calculated by means of equilibrium along the axis of the bone.
At any point of the bone, it was assumed the linear elastic constitutive equation was valid and the cylindrical symmetry of the structure allows reducing the equilibrium equations to the sole one in the radial direction involving the radial and the circumferential stresses
and
in each material phases
By considering the stress-strain constitutive equation and the kinematical relationships recalled above, the well-known equilibrium equation in term of displacements can be written down,
whose solution has the form
The integration constants and were determined by imposing the boundary and interface conditions, namely
For both the phases, the radial displacements
were obtained, their expressions being explicitly reported below (
)
Once the radial displacements were known, strain and stress components for each phase were derived. The flow-chart of the whole procedure is shown in
Figure 2.
The stress and strain components result only functions of , the solution thus finally depending upon geometrical and constitutive properties of the two phases, as well as, on the prescribed radial displacement , here representing the effect of the insertion of the prosthesis.
2.1. Evaluation of the Patient-Oriented Material Properties
To derive the mechanical properties of the bone from patient data records, the same scheme proposed by Esposito et al. [
18] was used. “All subjects gave their informed consent for inclusion before they participated in the study. The study was conducted in accordance with the Declaration of Helsinki, and the protocol was approved by the Ethics Committee of Iceland, “VISINDASIÐANEFND “(VSN13-127-s1).”
The method consisted of the following steps: the bone material properties were estimated from the CT scan data before surgery. The data are firstly converted into apparent bone densities,
, by using a phantom calibration; then, the value of ash density,
, was obtained from the apparent density. Finally, in order to get the actual material properties, the Young’s Modulus,
E, of the bone tissue was related to the ash density [
30].
2.2. A Straight Definition of Fracture Risk Factor
A simple and direct estimation of the parameter that defines the fracture risk during the implant is described hereafter. As a measure of the material behavior, in the literature both stress and strain levels within the bone were considered [
31,
32,
33,
34]. In this work, as a measure of Fracture Risk Factor (FRF), the von Mises equivalent strain,
, was calculated as a function of the radius, r, and compared with the admissible values from the literature.
In particular, the equivalent strain was compared to the yield strain,
, and the ultimate strain
whose values are deduced from literature. In detail, it was assumed that the yield strain was 0.0069 [
23] and the ultimate strain 0.0145 [
24] for both tissue. The assumed criterion for evaluating the risk factor is therefore set as follows:
Preliminary classification of the strain level used for defining the admissibility strain domain:
- Level 1.
, the bone tissue is safe;
- Level 2.
the bone tissue has to be considered yielded but not crashed;
- Level 3.
the bone tissue is crashed.
The admissibility domain constitutes the set of admissible solutions for local strain and should be integrated into global structural behavior considering the collapse mechanism corresponding to the typical PPFs [
35]. In the actual proposed procedure, the PPF is considered to occur when the over yield strain extends from the inner constrained boundary through the tissue and reaches the cortical bone. Finally, as the Fracture Risk, (FR) factor, the level of the cortical bone strain was considered, namely: when the Level 3 of the strain involves completely the tissue up to the cortical zone the Fracture Risk is considered at a high level, when the cortical bone strain belongs to Level 2 the Fracture Risk has to be considered moderate, when the cortical tissue strain belongs to Level 1 the bone can be assumed with a low fracture risk.
The above-mentioned procedure was applied to the slices located at the middle of each Gruen Zones [
36], and the obtained FR classification was expressed through a simple and intelligible “traffic lights” color code in order to provide immediate and concise information to surgeons. In other words, the obtained results were plotted along the radius, and colored in green indicating the strain belonged to Level 1, in orange Level 2 and in red Level 3. Moreover, colored plots of the sections were shown in order to provide direct and concise information to the medical operators. We refer to this depiction scheme as “Fracture Risk Factors” (
Table 1).
2.3. Sensitivity Analysis
As a first application, a sensitivity analysis was performed by applying increasing constraints on the inner boundary of the structural section and evaluating the strain and its spreading within the tissue. The reference section was the central section of the Gruen Zone 1. The Zone is situated in the proximal region of the femur where the fractures’ phenomena are typically located. The material properties and the geometry of the sample specimen were obtained from a young patient [
37]; the case studied represents a typical reference in terms of material densities and constitutive properties for a successful surgical scenario. The cortical and the trabecular radii were
mm and
mm, moreover the Young moduli were set equal to
MPa and
MPa for the cortical and trabecular tissue. The moduli correspond to apparent densities of
and
, respectively. The yield strain was
[
37] and the ultimate strain
[
24] for both tissue. The radius of the prosthesis was
mm, and the prescribed displacement,
, producing a volumetric increment equal to
, was
mm. The data of the analysis were collected in
Table 2.
For the analysis of the sensitivity of the formulation, the components of the stress and strain (radial, circumferential, longitudinal and von Mises’s) were calculated for trabecular and cortical phases. The analytical approach allows computing what assigned constraint, in terms of prescribed boundary displacement, one should apply for obtaining significant von Mises strain distribution. In particular, it was possible to define two different displacement constraints for each bone tissue zones, i.e.,
That was the constraint values producing, at the very first single point of the slice, the yield or the ultimate von Mises strain in the cortical, superscript C, or the trabecular, superscript T, zone.
In the analyzed case the results were:
The sensitivity analysis consisted of applying constraint displacements varying from to . The resulting strain within the slice varies with the radius decreasing when one moves from the center to the external cortex.
3. Results
To evaluate the strain components trends within the bone tissue, preliminary sensitivity analyses were performed by varying the magnitude of the prescribed radial displacements. The sensitivity analysis showed that the strain depends on the distance from the inner hole, where the implant was inserted. Moreover, the strain decreases rapidly from the inner stem surface toward the bone cortex. The behavior of the strain allows us to consider that the inmost tissue, subjected to the effect of stem implant will undergo severe values of strain that decreases with an almost exponential way. The high strain level does not represent the indicator of collapse, i.e., a fracture, but a local crisis that is almost inevitable. It has to be stressed that the collapse occurs when the strain overcame the yield limit in an entire portion of the structure till cortex. It is thus important to consider that it is impossible that the strain in the neighborhood of the stem is under the yield value, but this will not affect the prosthesis safety during daily activities.
It is worth highlighting that the displacement producing the limit value in the cortical phase, , was more than two times greater than the prescribed displacement producing the ultimate strain in the trabecular tissue, , as well as we found that . In other words, the prescribed displacement due to the insertion of the stem component-assumed to be mm-produces strains which overcome the elastic limits of both cortical and spongy bone, while the ultimate strain is attained and overcame only in the trabecular region. This means that the cortical tissue did not undergo permanent strain and, even if high stress levels tend to approach the material threshold, no failure is therein expected, while trabecular tissue appears as at high fracture risk level.
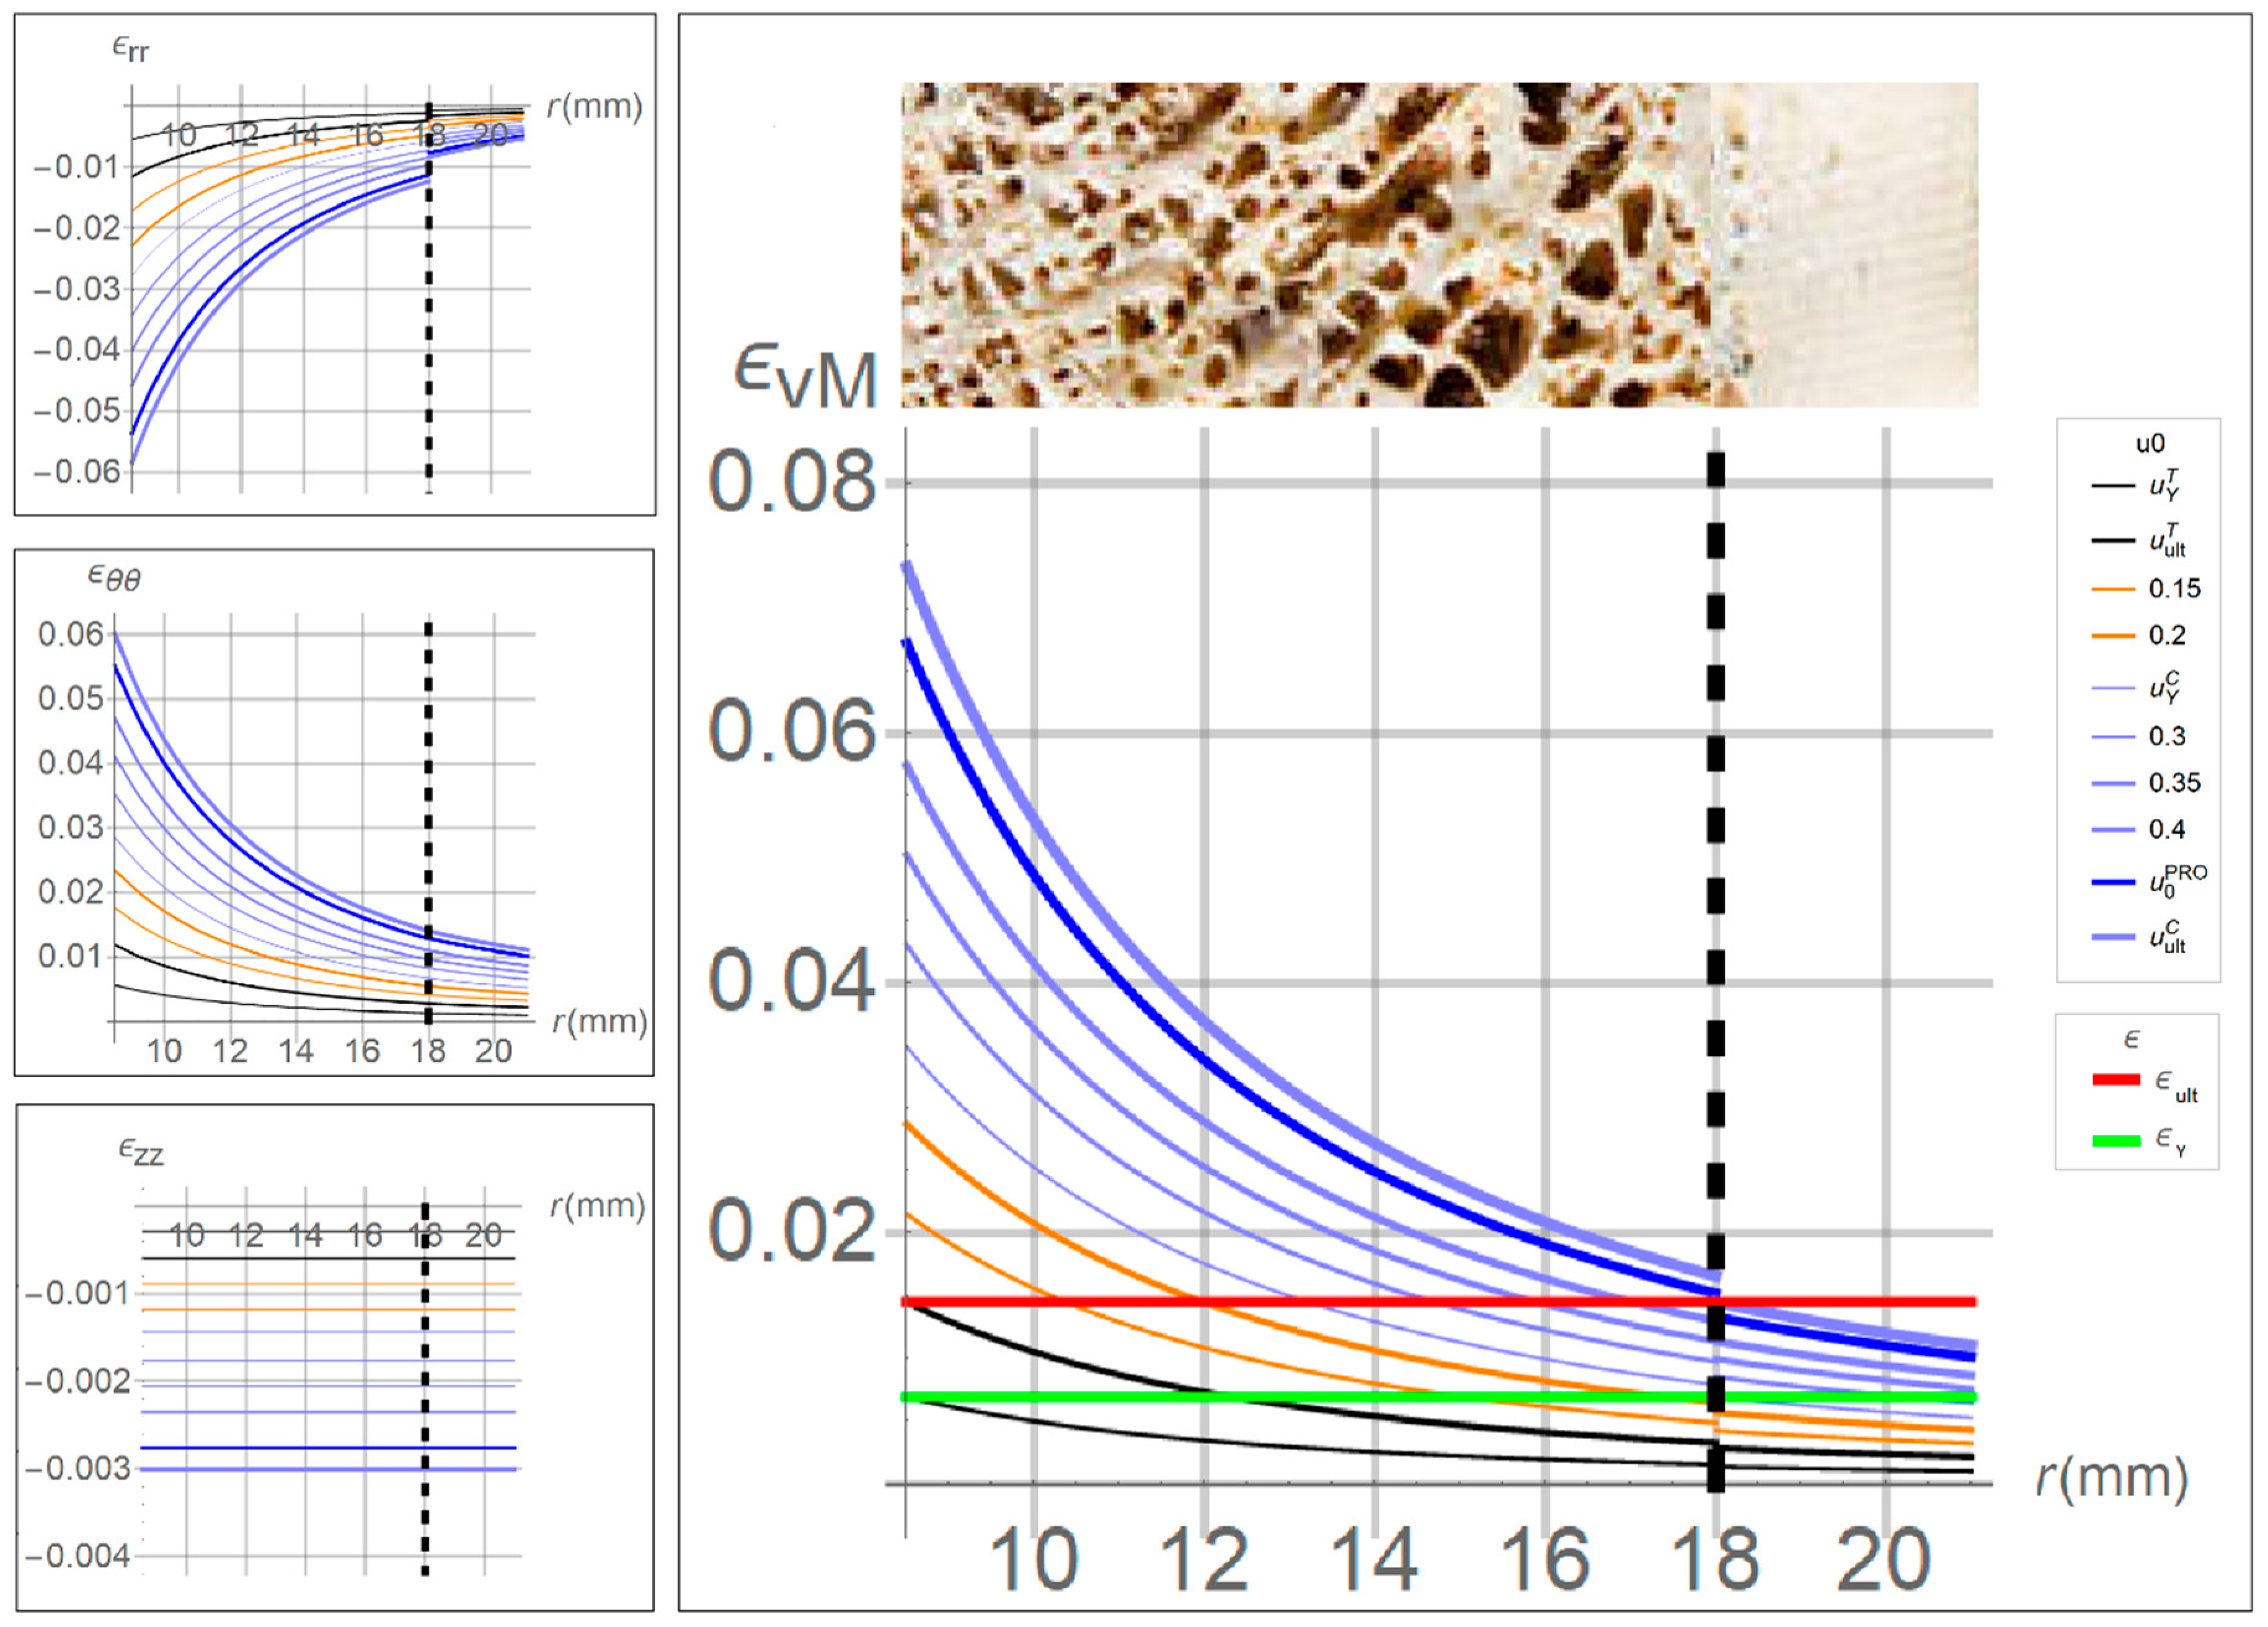
As mentioned above, in the sensitivity analysis, several values of displacements at the innermost surface,
, were prescribed, running from
to
. The obtained results, in terms of strains versus bone radius, are shown in
Figure 3, where the red and green horizontal lines are drawn at the yield and ultimate level, allowing evaluating the position along the radius where the strain overcomes the thresholds.
In particular, when the prescribed displacements was less than , the whole bone strain was contained below the elastic limit and hence the tissue can be assumed to be safe. When was between and , the von Mises strain in the trabecular tissue exceeded the ultimate value indicating the tissue is overstressed at the same time, the cortical tissue was completely preserved.
The strain components in the cylindrical reference are depicted on the left of
Figure 3. It can be noted that the main contribution to von Mises strain,
, was given by the in-plane strains,
and
. Moreover, the axial strain,
, was one order smaller than the other components, and the radial strain,
, result negative since the compression due to the insertion of the prosthesis.
Comparison of the Fracture Risk Factor Results Obtained by Means of the Analytical and FEM Approaches
As a first evaluation of the feasibility of the proposed procedure, the data obtained from the CT scan of two patients before the surgery were used [
18]. The two case studies refer to patients with different post-surgical outcomes. The first suffered a fracture event during the implant and the second presented successful result. The CT data were used to obtain the mean value of the constitutive properties related to bone density. The shape of the bone was approximated to a hollow cylinder where the cross-section was assumed to have the same area of the actual one. The proposed analytical procedure was then applied to the two case studies and the FRF values were calculated. The results were compared to those obtained by means of FEM approaches from Esposito et al. [
18].
For both patients, three femoral sections, proximal, medial, and distal, were selected in the middle of each Gruen zone, and the analytical analyses were performed by setting the average geometrical and constitutive properties calculated from CT data for each section, listed in
Table 3.
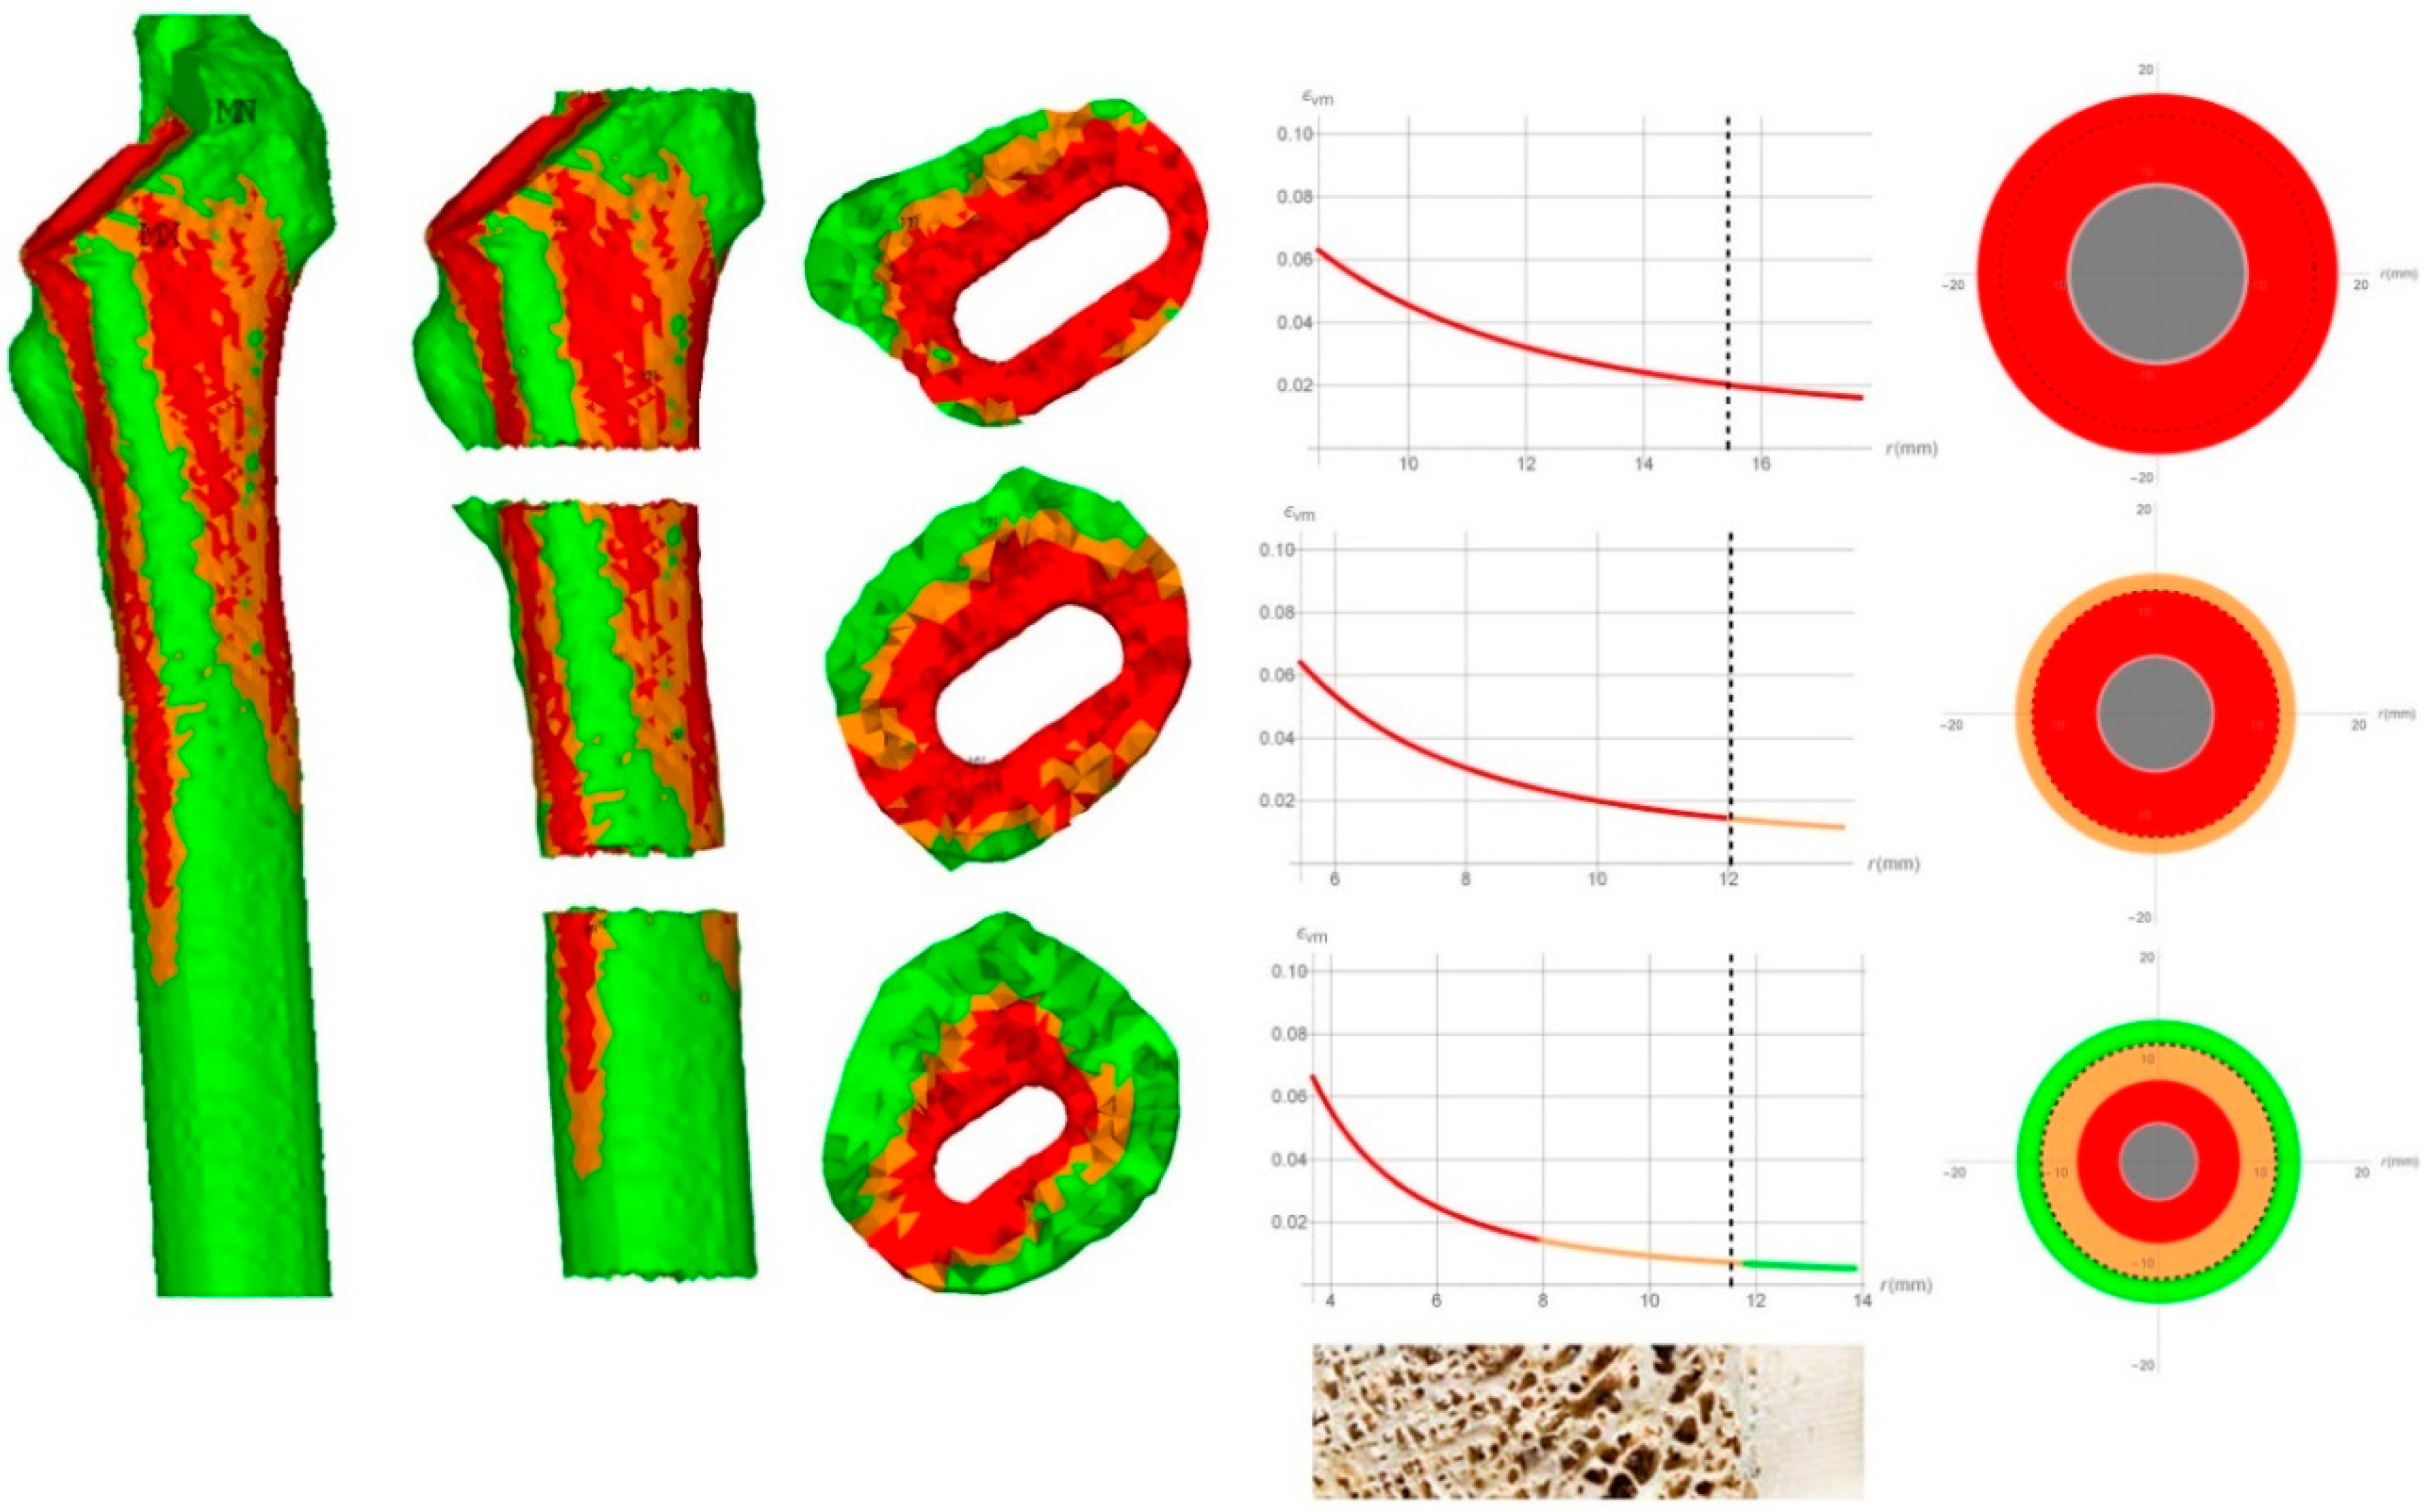
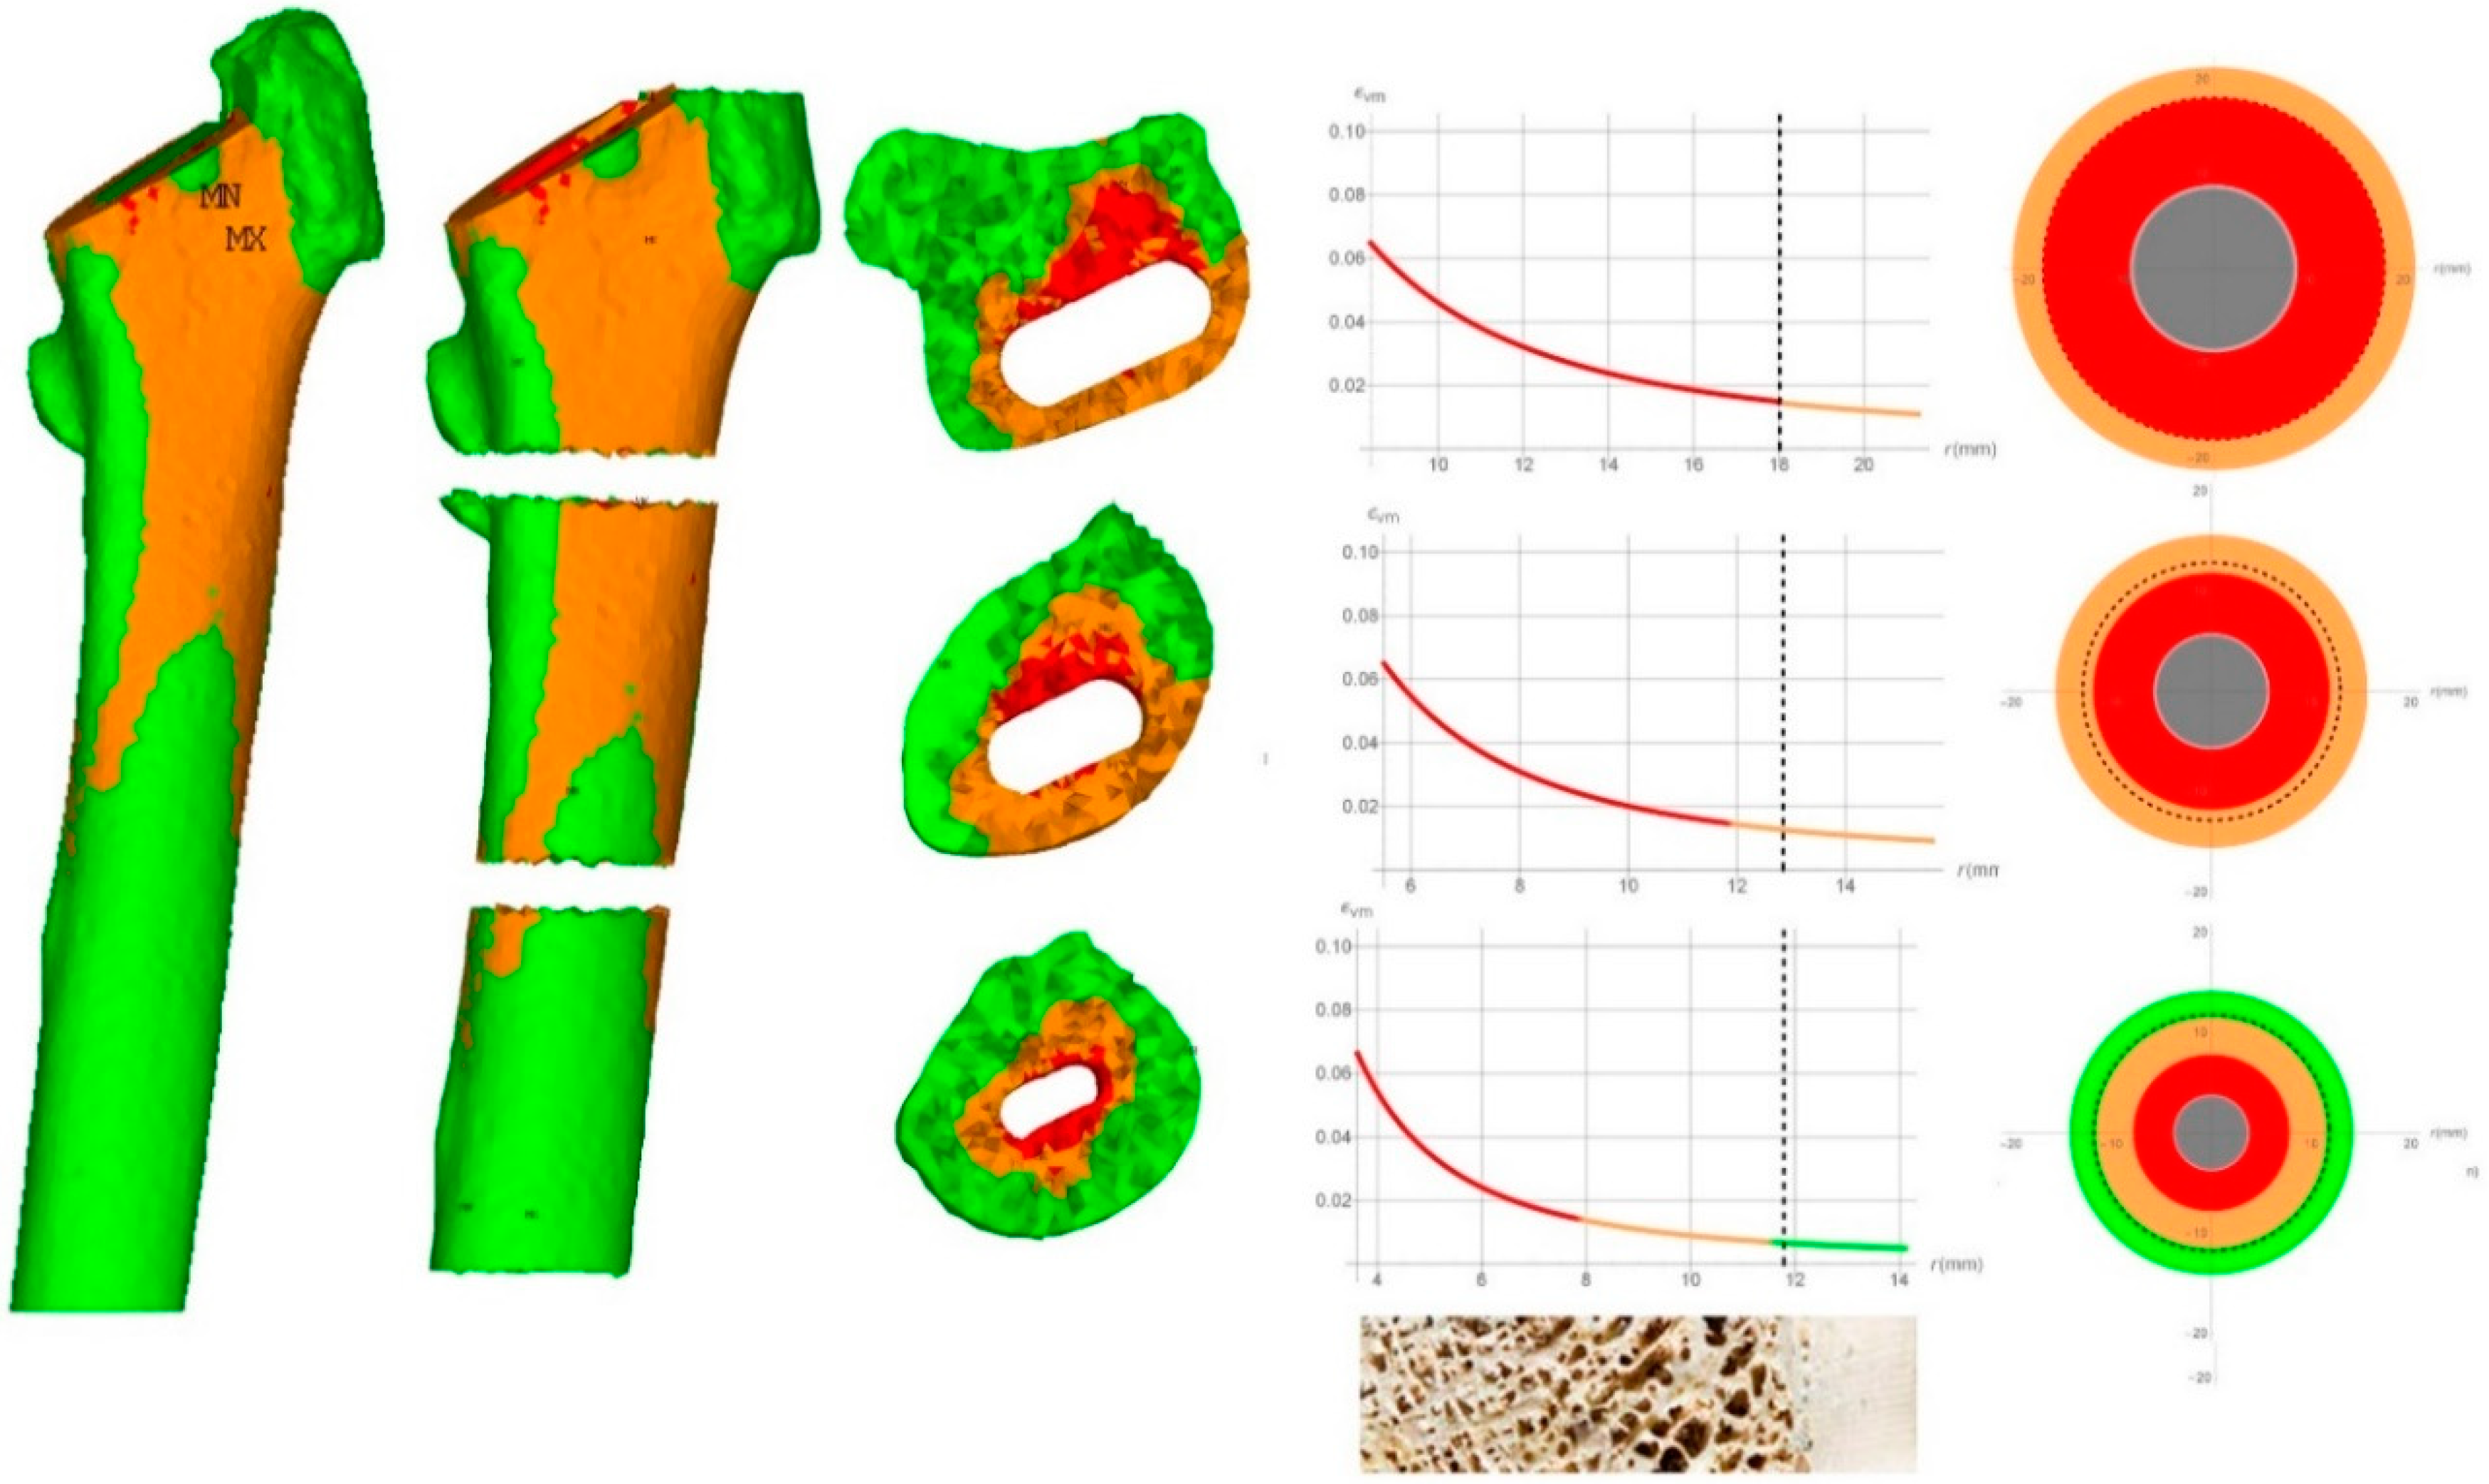
The results for each Gruen Zone, related to the fractured patient, are illustrated in
Figure 4.
On the left, the FEM results were shown as reported by Esposito et al. [
18]. In the Figure middle, the von Mises strain was plotted along the radius and, on the right, the FRF was expressed in terms of traffic lights code, calculated by means of the analytical approach.
Subsequently, the results were compared to those from the literature [
18]. In fact, in this cited study, a patient that underwent an intra-operative periprosthetic fracture and another with a successful outcome were recruited from a cohort of 36 patients undergoing primary THA. In the cited paper, the finite element analyses are performed in order to investigate the distributions of stress and strain inside the femur and to calculate the FRF. The results reported in Esposito et al. [
18] were obtained by detailed geometric reconstruction of the femurs and the prosthesis. Moreover, the material properties were described using non-linear behavior considering elastic-plastic constitutive properties of the bone as a function of the local density. The results from the FEM analysis performed by Esposito et al. [
18] were used as a benchmark of the present analytical simplified calculations. The results related to the fractured patient are shown in
Figure 4. The FEM output from Esposito et al. [
18] is reported on the left. The strain maps are reported on the 3D model of the femur and showed that the proximal Gruen Zone 1–7 was interested by strain that reaches the ultimate limit as it was highlighted by the wide red zone. It has to be highlighted that the presence of the red zone within the great part of the cross-section especially with the high strained part of the bone that has reached the external geometrical boundary, can be assumed as an index of a high risk of fracture, a fact confirmed by the observation that the patient actually presented intraoperative fracture. Besides the FEM results, the actual calculation results are represented as a strain diagram versus the radius of the section of the bone. It can be seen that even with the simplified approach, a high risk of fracture was evaluated for the proximal section of the femur. In fact, the von Mises strain resulted greater than the ultimate strain value for the whole bone tissue. On the right, a schematic image of the cross-section was shown where a color code highlighted the FRF: therein, red saturated the section, this meaning that the bone district was subjected to high risk of fracture. In addition, it can be seen that in the Gruen zone 2–6, while the trabecular bone resulted at a high level of strain, in the cortical bone it was low hence it can be assumed that the risk of fracture in the zones is low as well. In the Gruen zone 3–5, the cortical bone resulted safe, while the trabecular bone presented a high risk of fracture around the prosthesis and a low risk of fracture extending from the half part of the trabecular bone until the interface between trabecular and cortical bone.
The results related to the un-fractured patient are shown in
Figure 5.
Also in this case, all the bone in contact with the prosthesis appeared to be red because the values of the von Mises strain were always greater than the ultimate one. The cortical bone resulted at a high strain level in the Gruen zone 1–7 and 2–6, while it results at a low strain level in Gruen zone 3–5. It is worth noting that in Gruen zone 2–6, the orange zone extended to part of the trabecular tissue, as confirmed by the FEM results. In this case, because the red zone did not reach the cortical bone, the patient can be considered to have further load-bearing capacity and therefore it can be supposed to host the implant without fractures.
Summing up, in both cases, the results obtained by the analytical procedure were similar to those achieved by the FEM analyses. In the case of the fractured patient, the results of the analytical procedure showed a red region with high fracture risk in both the trabecular and cortical tissue confined in the proximal section. In the case of an un-fractured patient, there was an orange area related to high strain although under the ultimate limit, in the proximal zone of the femur, located in the cortical tissue, all these outcomes being consistent with numerical simulations and clinical evidence.
4. Conclusions
In this work, an analytical-based procedure is presented with the aim of predicting the intra-operative fracture risk in the case of THA in a direct, straightforward way. The methodology makes use of a simplified model to predict the mechanical interaction between the prosthesis and the femur bone, with the advantage of resulting in immediate, concise and intelligible maps of fracture risk which we felt, if implemented in a friendly code or as an app, could constitute a practical tool to help the medical decision-making process, in particular with respect to the choice of adopting cemented or cementless implant. The maps were expressed in term of traffic lights color code, obtained by transferring into a direct measure of fracture risk, based on the comparison between in situ von Mises strain and corresponding bone-dependent strain thresholds. The effectiveness of the proposed procedure was confirmed by comparing the obtained results in terms of strain with those from more precise FE models that consider elasto-plastic material model and large displacements. The strain calculation was done with reference to two actual patient cases whose CT data were used to define geometrical and constitutive parameters. The obtained strain maps through the analytical formulation were interpreted following the proposed criteria where red, yellow, and green zones were used as a flag for fracture risk evaluation. In particular, the eventuality the red zone reached the cortical bone is assumed as a high fracture risk index. The strain level distribution was checked by comparison with numerical calculation on a very accurate geometrical finite element model in the literature (Esposito et al.2018) that assumes a non-linear constitutive model of the bone tissue whose data are obtained by CT tests. It has to be stressed that the possibility of building up an accurate FE model and performing non-linear calculations has a very high cost in terms of computing time. To build up a 3D model of a femur with a usual PC from CT images and to perform calculation of non-linear model costs an order of magnitude time of days. The analytical approximate solution takes a few seconds.
The proposed methodology is able to provide direct information with a limited cost in terms of computational time and interpretation of the results. Due to the simplicity of the implementation, the methodology could be applied to different sections of the femur and extended to a multi-phase model—by dividing the section into more than two annuli—with no significant effort.
It has to be noted that both gender and age differences were taken into account in their analyses and in the approach, since the mechanical quality id directly derived from patient-specific CT data: this implies that at least from the mechanical point of view, any mechanically relevant difference in the bone stiffness and strength due to gender or age is automatically considered because determined on the basis of the peculiar bone mineral properties of the selected patient. This is de facto the force of the proposed method. Nevertheless, the initially bone mineral density information and the associated mechanical properties could vary differently in time and with age in male and female: this “evolutive” aspect, which would imply to introduce growth and remodeling in the proposed modeling strategy, is obviously beyond the scope of the present paper. Moreover, even if the statistical relevance of the data at this time available is not yet established, the authors focused on the mechanical consistency of the procedure and on its potential as a friendly as well as accurate complementary tool for helping the surgeon in his/her medical choices, postponing the validation of the method to a subsequent study. In conclusion, the proposed analytical procedure gives confident strain maps of the femur sections and are quite comparable to more sophisticated numerical results in the sense to give global information on the possibility of perioperative femur fracture risk. By continuing to add information into the database, an app methodology in choosing safer prosthetic type in THA is inevitable in the future to better secure the patients long standing wellbeing.


 ,
, 


