Article

Process Parameter Optimization When Preparing Ti(C, N) Ceramic Coatings Using Laser Cladding Based on a Neural Network and Quantum-Behaved Particle Swarm Optimization Algorithm

1
College of Mechanical and Electrical Engineering, Central South University, Changsha 410083, China
2
State Key Laboratory of High-Performance Complex Manufacturing, Changsha 410083, China
*
Author to whom correspondence should be addressed.
Appl. Sci. 2020, 10(18), 6331; https://doi.org/10.3390/app10186331
Submission received: 7 August 2020 / Revised: 4 September 2020 / Accepted: 7 September 2020 / Published: 11 September 2020

Abstract

:
The formation process of surface coatings fabricated with laser cladding is very complicated and coating quality is closely related to laser cladding process parameters. Generally, the optimization and control of process parameters play key roles when preparing high-quality ceramic coating. In this paper, three reasonable parameters were selected for each process parameter based on the preliminary experiment. The experiment of Ti(C, N) ceramic coating prepared with laser cladding was designed via the Taguchi method. The laser power, spot diameter, overlapping ratio, and scanning velocity were selected as the main process parameters, and their effects on coating micro-hardness were analyzed using the signal-to-noise (S/N) ratio and analysis of variance (ANOVA). Then, based on the back-propagation neural network (BPNN) and quantum-behaved particle swarm optimization (QPSO) algorithm, we created the prediction model of BPNN-QPSO neural network for laser cladding Ti(C, N) ceramic coating. The mapping of process parameters to the micro-hardness of the coating was obtained according to the model and we analyzed the influence of process parameters that interacted with the coating’s micro-hardness. The results showed that the interaction of laser cladding process parameters had a significant effect on the micro-hardness of the coating. The established BPNN-QPSO neural network model was able to map the relationship between laser cladding process parameters and coating micro-hardness. The process parameters optimized by this model had similar results with ANOVA. This research provides guidance for the selection and control of ceramic coating process parameters Ti(C, N) prepared via laser cladding.

1. Introduction

Laser cladding is an important surface modification technique that uses a high power density laser beam to melt powder material and form a coating bonded metallurgically to the substrate surface. It can significantly improve the wear-resistance [1,2], corrosion resistance [3,4], and oxidation resistance [5,6] of a material surface. In our previous research [7], Ti(C, N) ceramic coating was prepared on a Ti6Al4V titanium alloy surface using a laser cladding process, which significantly improved the hardness and wear resistance of the titanium alloy surface. However, the formation process of surface coatings fabricated with laser cladding is very complicated and there are many process parameters that affect coating quality, such as laser power, spot diameter, scanning velocity, preplaced powder thickness, and overlapping ratio [8,9,10]. At the same time, the interactions of process parameters also have a great impact on coating quality [11]. Therefore, it is necessary to establish a mapping relationship between process parameters and coating quality to analyze the mapping rule for laser cladding process parameters to coating quality.
As a computational intelligence technology, a neural network provides a simple and effective tool for mapping the relationship between process parameters and quality characteristics [12]. At present, some researchers have applied a back-propagation neural network (BPNN) to the parameter prediction of laser cutting [13,14], laser welding [15,16], and other laser processing fields, and have achieved abundant research results. For example, Ciurana et al. [17] combined the BPNN and particle swarm optimization (PSO) algorithm to predict the quality of laser micromachining. Guo et al. [18] applied BPNN to optimize the process parameters of laser cladding cobalt-base alloy. Liu et al. [19] combined BPNN and genetic algorithm (GA) to predict the quality of laser welding. The results showed that BPNN could predict processing quality according to laser processing parameters. However, the initial weights and thresholds of BPNN were randomly selected, which was easy to fall into the local optimal solution, resulting in poor prediction performance of BPNN [20]. Therefore, it is necessary to optimize the initial weights and thresholds of BPNN.
In recent years, researchers have studied the effects of laser cladding process parameters on coating quality and found that the optimization of process parameters was also a difficult problem [21,22]. The optimization of process parameters was usually based on a large number of process experiments that gradually accumulated processing experience, which had a heavy workload and high cost. Sun et al. [23], Marzban et al. [24], and Chen et al. [25] designed orthogonal experiments using the Taguchi method, and optimized laser cladding process parameters using response surface nethodology (RSM), the technique for order preference by similarity to an ideal solution (TOPSIS), and analysis of variance (ANOVA), respectively, to improve cladding coating quality. However, when there are many factors involved in orthogonal experiments, it is difficult to determine the change rule of experimental data and the optimal result is usually a combination of experimental parameters that can neither predict the coating quality nor obtain the best process parameters. In order to solve these problems, some researchers used optimization algorithms to optimize process parameters on the basis of design of the orthogonal experiment using the Taguchi method. Mozaffari et al. [26] used the PSO algorithm to predict the geometry of the molten pool and optimize the process parameters. Sun [27,28] improved PSO algorithm and proposed the quantum-behaved particle swarm optimization (QPSO) algorithm, which quickly replaced the PSO algorithm for single-objective optimization problems due to its strong global search capability, easy implementation, and fewer parameters [29,30]. The above results show that the optimization algorithm is a powerful tool to solve the optimization problem of laser cladding process parameters.
Based on the above analysis, this paper mainly created an analysis model (i.e., BPNN-QPSO model) that combined the BP neural and quantum-behaved particle swarm optimization algorithm to study the effects of laser cladding process parameters on the micro-hardness of ceramic coating. Firstly, the orthogonal experiment was designed using the Taguchi method to prepare the coating under different laser cladding process parameters and its micro-hardness was tested. The effects of process parameters on coating micro-hardness were analyzed by using signal-to-noise (S/N) ratio and analysis of variance (ANOVA) and the optimal combination of process parameters were determined according to the analysis results. Then, a BPNN-QPSO neural network prediction model between the micro-hardness of the coating and process parameters such as laser power, spot diameter, overlapping ratio, and scanning velocity were established by combining the BPNN and QPSO algorithms, which was applied to the fabrication process of Ti(C, N) ceramic coating via laser cladding to realize the mapping of laser cladding process parameters to the micro-hardness of the coating, as well as to analyze the influence of process parameters interacting with the coating’s micro-hardness. Finally, the micro-hardness of the coating predicted using the BPNN-QPSO model was taken as the fitness value and the laser cladding process parameters were optimized using the QPSO algorithm.

2. Experimental Procedures and Research Methods

2.1. Materials Used

Ti6Al4V titanium alloy plates (Baoji INT Titanium Medical Co., Ltd. Baoji, China) were used as the substrate for laser cladding experiments. It was cut into specimens with dimensions of 30 × 30 × 6 mm3 using a wire electrical discharge machine tool. The oxide layer on the substrate surface was polished with SiC sandpaper (120#) and then placed into ethanol solution and deionized water for ultrasonic cleaning. The cladding powder material was a mixture of 80 wt.% TiCN powder (≥99.5% purity, particle size 1–10 μm, Shanghai Naiou Nano technology Co., Ltd. Shanghai, China) and 20 wt.% SiO2 powder (≥99.5% purity, particle size 30 ± 5 nm, Shanghai Keyan Industrial Co., Ltd. Shanghai, China), and their micro morphology images are shown in Figure 1. Studies [31,32] have shown that SiO2, as a sintering additive, appeared in a liquid phase at about 1378 °C, which improved particle rearrangement and promoted ceramic densification. Therefore, SiO2 was added into the cladding material system as a liquid phase to improve the fluidity of TiCN ceramic powder in the laser cladding process. Each sample was pre-placed 0.45 g of mixed powder (TiCN: 80 wt.%, SiO2: 20 wt.%) on the surfaces of the substrate, with a thickness of 0.4 mm.

2.2. Design of Experiments

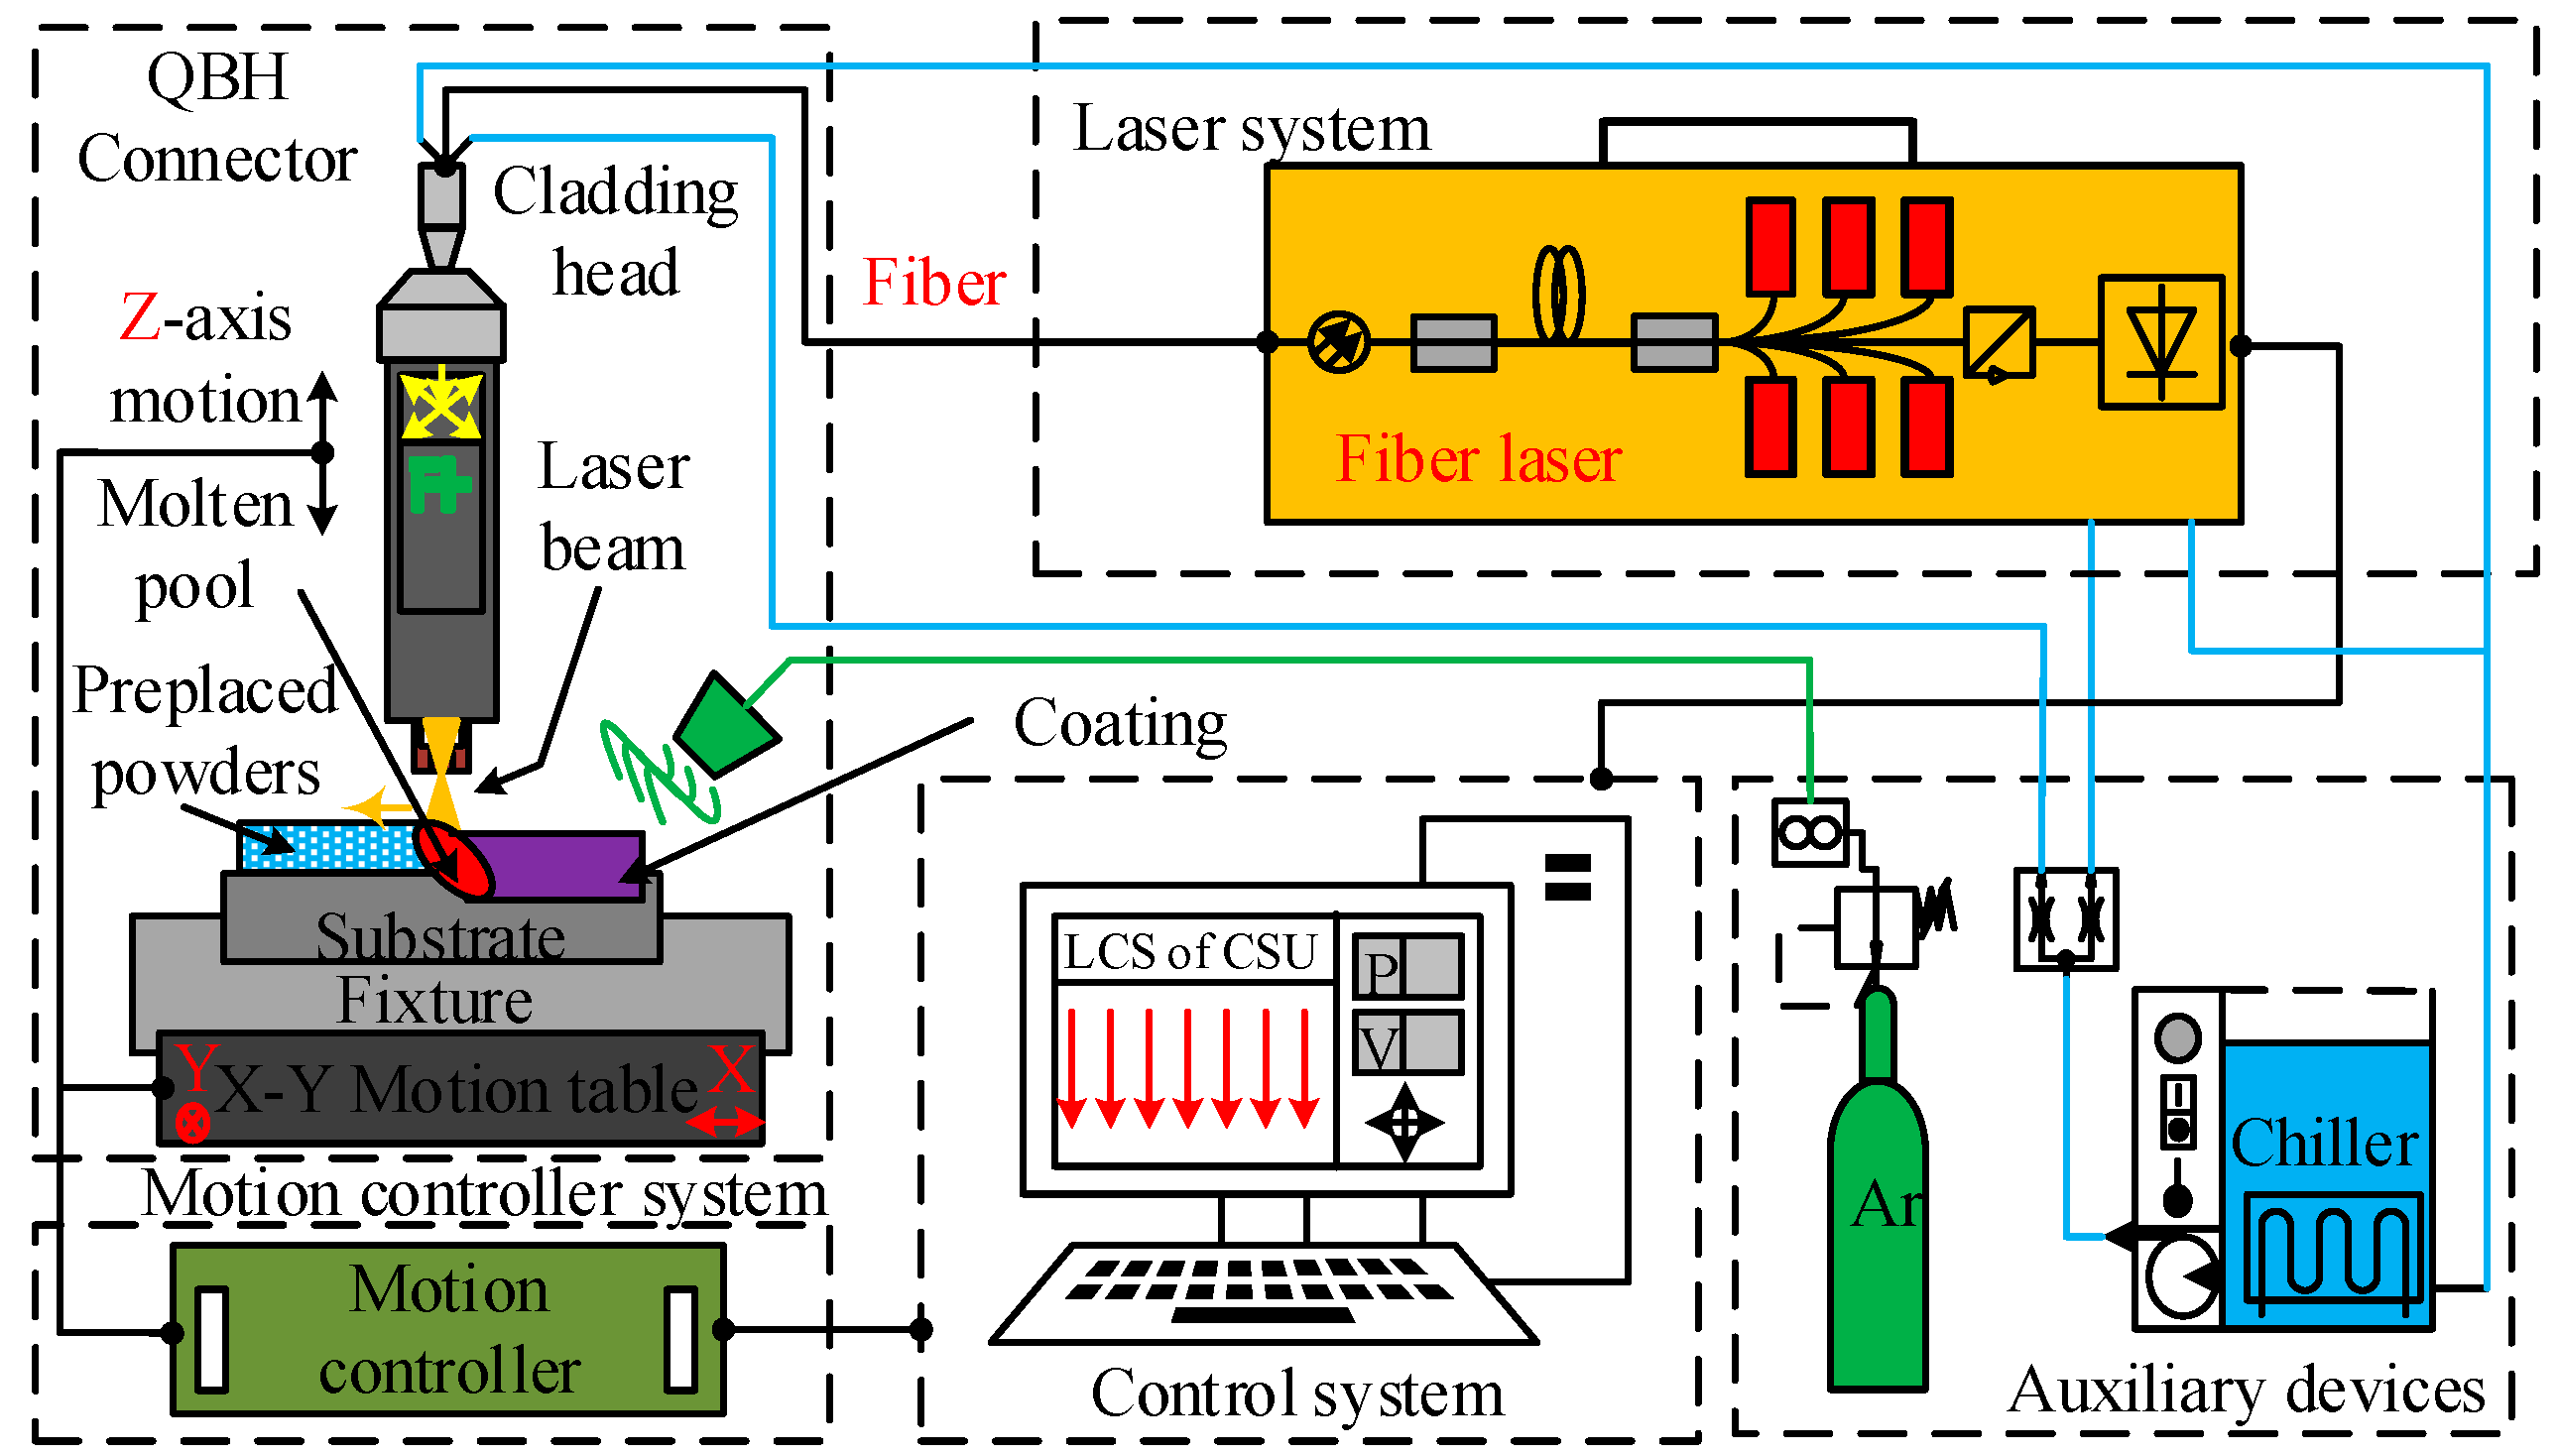
It is well known that the selection of laser cladding process parameters has a direct impact on the forming quality and performance of the ceramic coating [33,34,35], among which laser power, spot diameter, overlapping ratio, and scanning velocity have a significant impact. Therefore, laser power (L), laser spot diameter (D), overlapping ratio (S), and scanning velocity (V) were selected as experimental factors, and each experimental factor was set at 3 levels. According to the mainly process characteristics of laser cladding, some preliminary experiments of coating preparation using laser cladding were conducted. Based on the preliminary experimental results, three reasonable experimental parameters were selected for each process factor, as shown in Table 1. Table 2 is the L27-(313) orthogonal table designed using the Taguchi method, for the experiments of Ti(C, N) ceramic coating prepared via laser cladding. The laser cladding system used in the experiments is shown in Figure 2, which was described in detail in our previous paper [7].
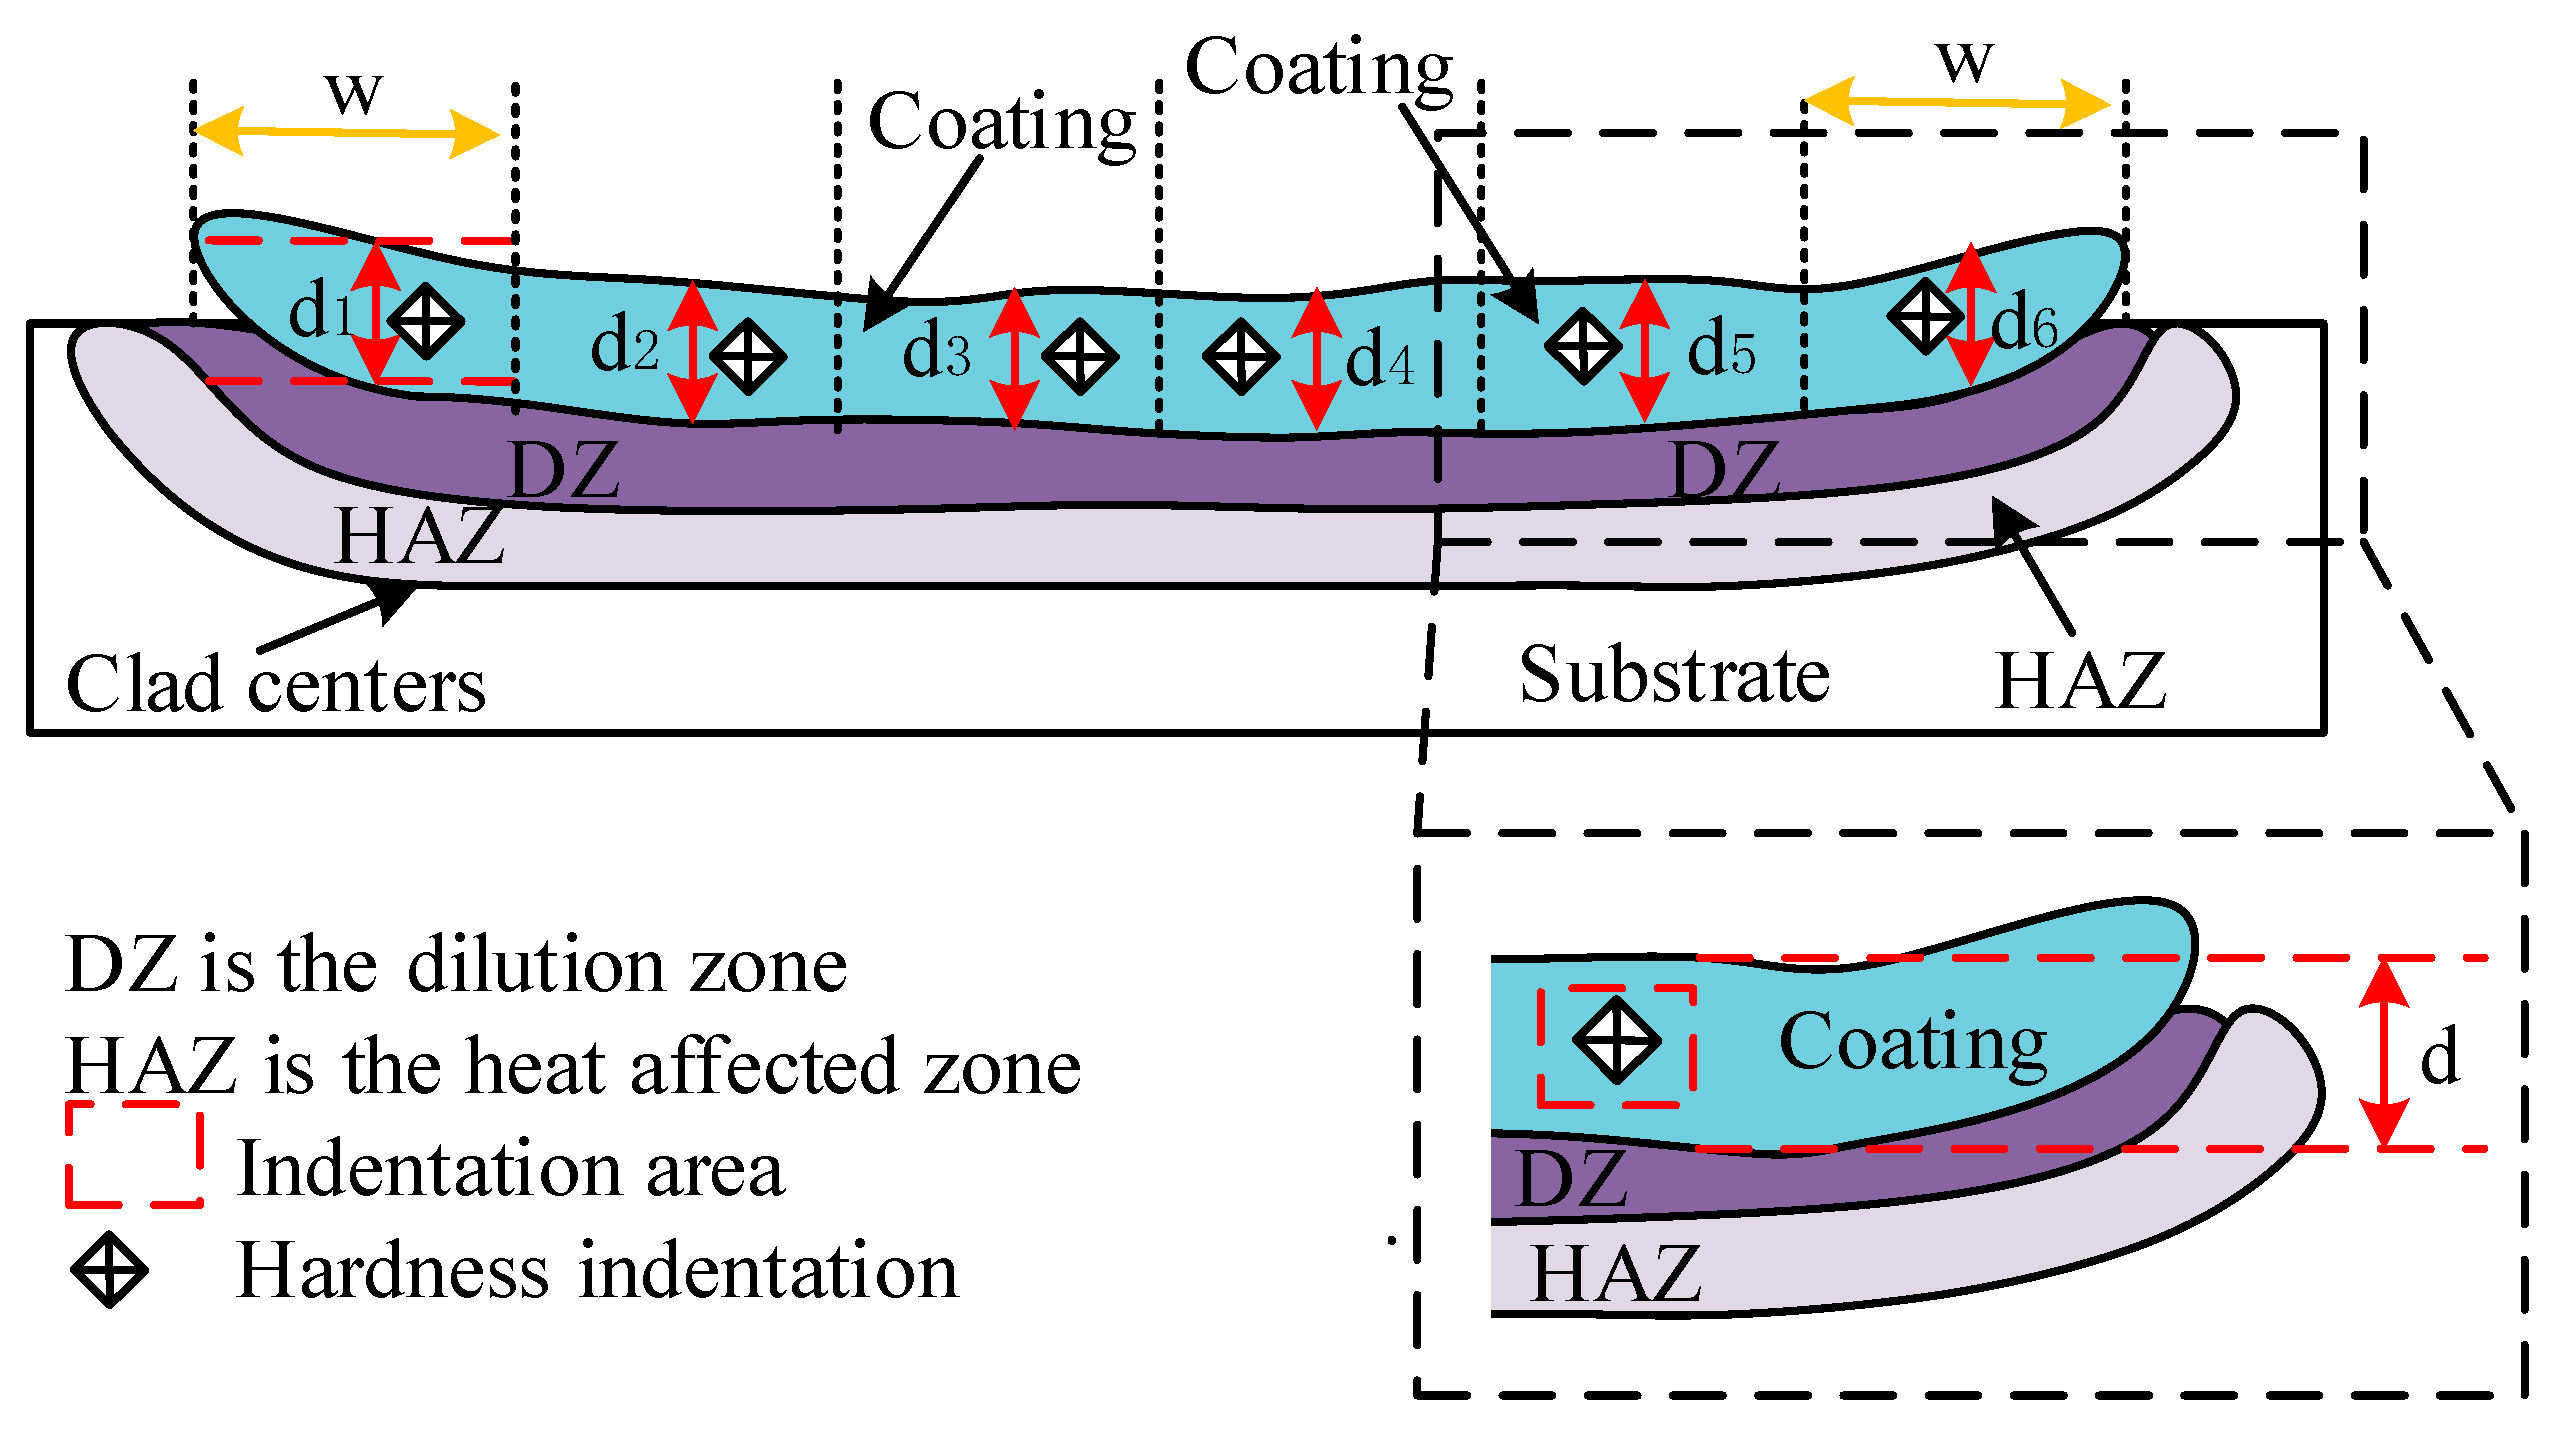
The micro-hardness of the coating is an important index to evaluate the wear resistance of the material. Therefore, the micro-hardness of the coating is taken as the response of the experiment. The micro-hardness measurement of the coating is shown in Figure 3. The micro-hardness value (HV0.2) of the cross-section of the coating was measured using an automatic Vickers micro-hardness tester (HVS-1000Z, Vegour, Shanghai, China). In the transverse direction of the cross-section, the coating was divided into 6 sections on average, and the micro-hardness value was measured once on each section of the coating, a total of 6 times, and the arithmetic mean value was taken as the micro-hardness value of the coating.

2.3. Analytical Methods

The signal-to-noise (S/N) ratio was used to evaluate the effects of each selected laser cladding process parameter on the micro-hardness of the coating. The experimental response can be converted into 3 types of S/N ratios, i.e., the higher-the-better (HB), the lower-the-better (LB), and the nominal-the-better (NB) [36]. In this paper, the aim was to improve the wear resistance of Ti(C, N) ceramic coatings and obtain optimal process parameters. Therefore, the micro-hardness of the coating was evaluated using the higher-the-better (HB) criterion of the S/N ratio, as shown in Equation (1):
η HB = 10 lg [ 1 N i = 1 N ( 1 y i 2 ) ]
where ηHB is the HB S/N ratio value, N is the number of repetitions for experimental combinations; yi is the experimental response, which is the micro-hardness of the coating from the experimental measurements.
The analysis of variance (ANOVA) was used to evaluate the significance of each experimental factor. The probability value (p-value) in ANOVA analysis was calculated using Minitab software, which is an important index to evaluate the significance of factors. When the p-value of a factor is less than 0.05, the factor is highly significant (HS), and when the p-value of a factor is greater than 0.05 and less than 0.1, the factor is significant (S). According to ANOVA analysis, the optimal process parameters for the experimental response were determined.

2.4. Design of the BPNN

Back-propagation neural network (BPNN) is a supervised learning algorithm. Its structure includes one input layer, p hidden layers, and one output layer. BPNN can be used to establish the mapping relationship between process parameters and coating micro-hardness. In order to describe the structure of BPNN, the following definitions are given: the input layer is layer 0, the hidden layers are from layer 1 to layer p, and the output layer is layer p + 1 after the last hidden layer. The number of BPNN neurons in the hidden layer is determined by the empirical Equation (2) [37]:
h = n i + n o + c
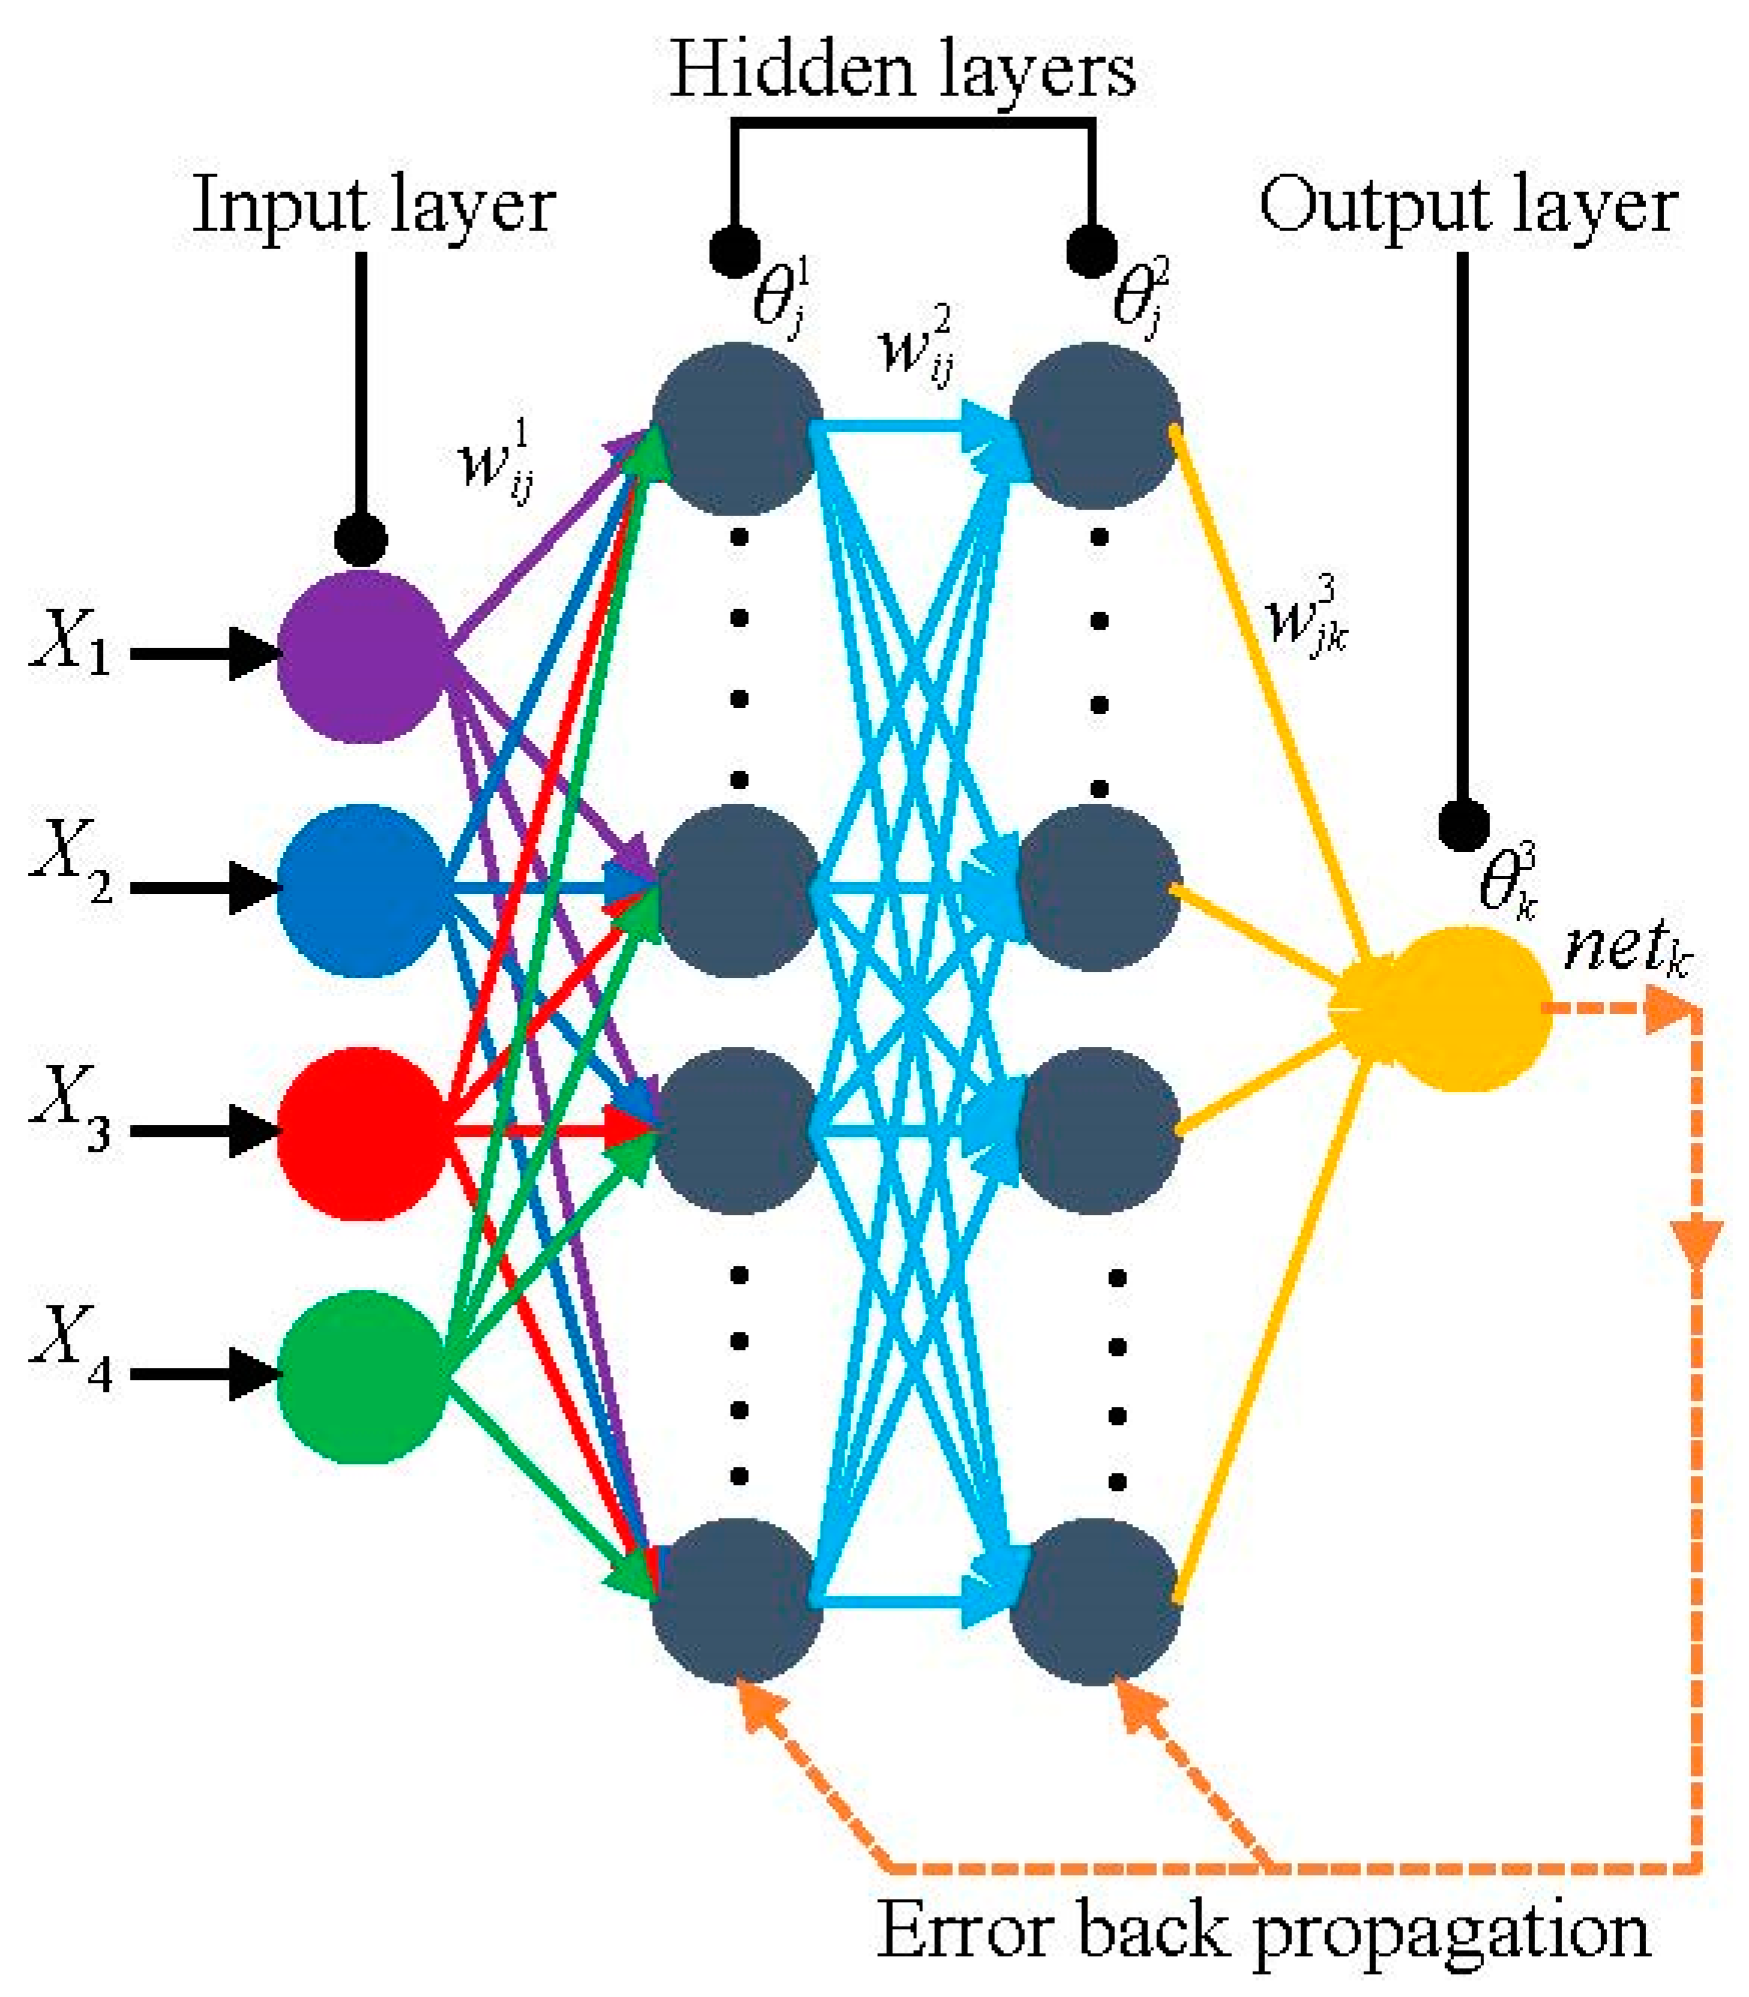
where h, ni, and no are the number of neurons in the hidden layer, input layer, and output layer, respectively, and c is a constant between 1 and 10. The optimal number of BPNN neurons and network structures are determined to be 4-6-6-1 by the trial-and-error method, so the number of hidden layers in this paper is p = 2, and the structure of BPNN is shown in Figure 4. The training process of BPNN is as follows:
  • Step 1: The input and output training data is an m × n two-dimensional array, denoted as (xij)m×n, which is normalized to between 0.1 and 0.9 by Equation (3):
    X i j = x i j x j min x j max x j min × 0.8 + 0.1
    where (Xij)m×n is a normalized m × n two-dimensional array, and xjmax and xjmin are the maximum and minimum values of the jth column of the two-dimensional array (xij)m×n, respectively.
  • Step 2: The input layer neurons transfer the normalized data to the hidden layer neurons or the value calculated by the neurons of the upper hidden layer is transferred to the neurons of the next hidden layer. The input of the neurons in lth layer ( n e t j l ) is calculated by Equation (4):
    n e t j l = { X j = ( X 1 j , X 2 j , X 3 j ) T , l = 0 f ( i = 1 h w i j l n e t i l 1 + θ j l ) , l = 1 , 2 , 3 P
    where Xj is the jth column vector of the above two-dimensional array (Xij)m×n, w i j l is the connection weight of the neuron (i) of the (l−1) layer to the neuron (j) of the l layer, n e t 1 i l 1 is the input of the neuron (i) of the (l−1) layer, θ j l is the threshold of the neuron (j) in the l layer, and the transfer function f is tansig function.
  • Step 3: The output of neurons in the output layer (netk) can be calculated by Equation (5) below:
    n e t k = j = 1 h n e t j P w j k P + 1 + θ k P + 1 , k = 1 , 2 , 3 n o
    where w j k P is the connection weight of the neuron (j) in p layer to the neuron (k) of the (p + 1) layer and θ k P + 1 is the threshold of the neuron (k) of the (p + 1) layer.
  • Step 4: The error of network training is the mean square error (MSE), which is calculated by Equation (6). The weight correction amount of each layer is calculated according to the derivation rule of the differential chain, as shown in Equation (7):
    MSE = 1 N s k = 1 N s [ 1 2 k { C } ( d k n e t k ) 2 ]
    Δ w i j l = λ MSE y k y k n e t j l n e t j l w i j l
    where dk is the experimental response, Ns is the total number of samples, {C} is the set of output data, and λ is the learning rate usually within the range [0, 1]. By repeating the parameter adjustment, the optimal value of λ is taken as 0.001.

2.5. Design of BPNN Optimized by QPSO

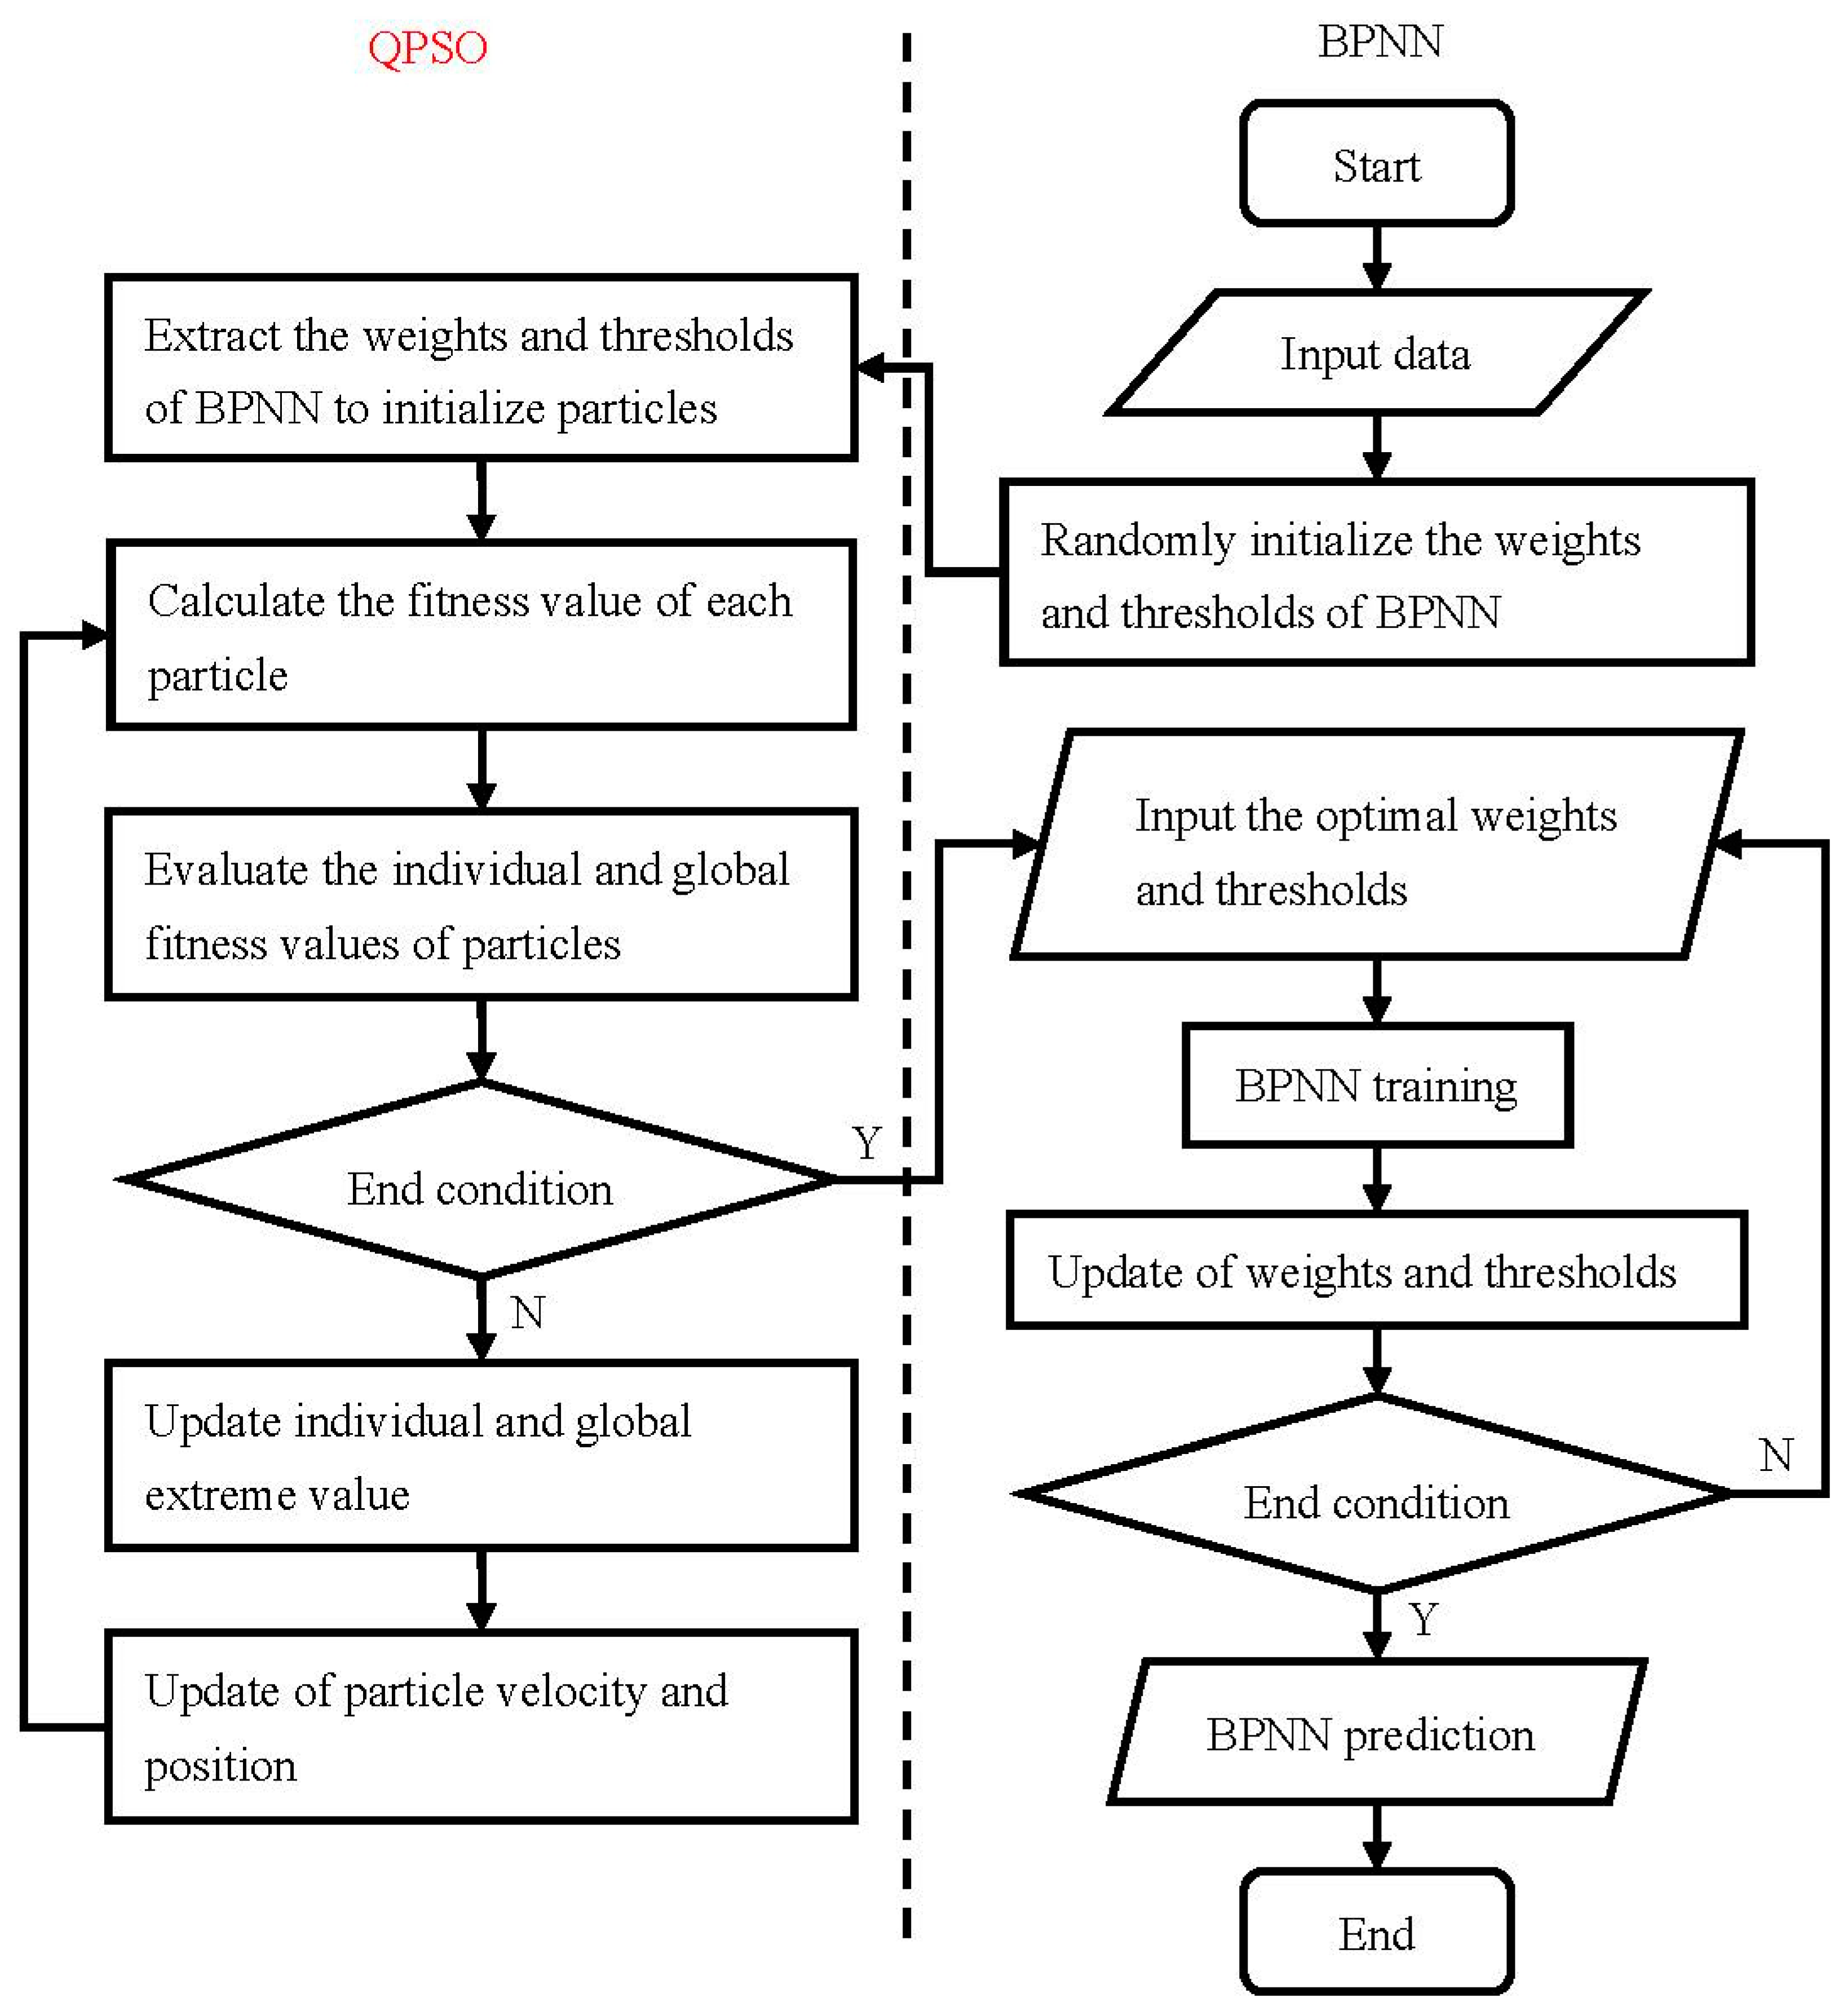
The initial weights and thresholds of BPNN training were randomly selected and easily fell into the local optimal solution, resulting in poor prediction performance of BPNN. Therefore, the QPSO algorithm was used to optimize the weights and thresholds of BPNN, which is called the BPNN-QPSO neural network model. In the QPSO algorithm, the particle swarm is an ND × NP two-dimensional array, denoted as (Oid,jp)ND×NP. The position vector and velocity vector of the id-dimensional particle in the zth update are x i d z = ( x i d , 1 z , x i d , 2 z , ⋯ x i d , N P z and v i d z = ( v i d , 1 z , v i d , 2 z , ⋯ v i d , N P z ), respectively. The optimal value of the particle after the zth update is called the best personal position ( P b e s t i d , j p z ). If the best personal position is also the optimal value in the particle swarm, it is also called the best global position ( G b e s t i d , j p z ). The flow chart of the optimization algorithm is shown in Figure 5.
  • Step 1: Extract the weight and threshold of BPNN, initialize the particle swarm, position vector (xid), and velocity vector (vid).
  • Step 2: Calculate the fitness of the initial particles (fitness)
    The standard error (σ) is selected as fitness value (fitness), as shown in Equation (8), to evaluate the performance of BPNN with different weights and thresholds, i.e., to evaluate the best personal position and the global position of particles [37]. Where εk is the relative error.
    σ = ε 1 2 + ε 2 2 + ε 3 2 + ε k 2 N ,   ε k = | d k n e t k n e t k | × 100 ( % )
  • Step 3: Compare the best personal position ( P b e s t i d , j p z + 1 ) of the particle in the (z + 1)th update with the best personal position ( P b e s t i d , j p z ) of the zth update. If (z + 1)th fitness is better than zth fitness, then ( P b e s t i d , j p z ) is replaced by ( P b e s t i d , j p z + 1 ).
  • Step 4: Compare the best global position ( G b e s t i d , j p z + 1 ) of the particle in the (z + 1)th update with the best global position ( G b e s t i d , j p z ) of the zth update. If (z + 1)th fitness is better than zth fitness, then ( G b e s t i d , j p z ) is replaced by ( G b e s t i d , j p z + 1 ).
  • Step 5: Update M b e s t j p z , v i d z and x i d z of particles.
    M b e s t j p z is the average value of P b e s t i d , j p z of all particles, which is the center of the best personal position of all particles, called the mean best position, as shown in Equation (9). The particles update their velocity vector and position vector according to Equations (10)–(12) in the QPSO algorithm:
    M b e s t j p z = ( 1 N D i d = 1 N D P b e s t i d , 1 z , 1 N D i d = 1 N D P b e s t i d , 2 z , 1 N D i d = 1 N D P b e s t i d , N p z )
    { v i d z + 1 = φ P b e s t i d z + ( 1 φ ) G b e s t i d z P b e s t i d z = ( P b e s t i d , 1 z , P b e s t i d , 2 z , P b e s t i d , N P z ) G b e s t i d z = ( G b e s t i d , 1 z , G b e s t i d , 2 z , G b e s t i d , N P z )
    x i d z + 1 = v i d z + 1 + r a n d ( u ) × α | M b e s t j p z x i d z | ln ( 1 u )
    r a n d ( u ) = { + 1 , u 0.5 1 , u < 0.5
    where φ and u are a sequence of random numbers on the uniform distribution within (0,1), and α is a contraction factor.
PSO algorithm updates the velocity vector and position of particles according to the following Equations (13) and (14):
v i d z + 1 = w v i d z + c 1 r a n g ( u ) ( P b e s t i d z x i d z ) + c 2 r a n g ( u ) ( G b e s t i d z x i d z )
x i d z + 1 = x i d z + v i d z + 1
where w is the weight and c1 and c2 are constants. By repeating the parameter adjustment, α is taken as 1, w as 1.4, and c1 and c2 as 1.49445.
  • Step 6: If the set training goal is reached or the maximum number of cycles is reached, exit the loop, and correlation coefficient (R2) expressed by Equation (15) is used to evaluate the performance of the model; otherwise, return to Step 2.
    R 2 = k { C } ( d k d k ¯ ) ( n e t k n e t k ¯ ) k { C } ( d k d k ¯ ) 2 ( n e t k n e t k ¯ ) 2
    where d ¯ k is the average value of the experimental response and n e t ¯ k is the average value of the output of the neural network.

2.6. Process Optimization Design of Higher-the-Better Micro-Hardness of the Coating

Based on the established BPNN-QPSO prediction model, the input process parameters were taken as particles in the QPSO algorithm and the predicted micro-hardness was taken as the fitness value. Then, the QPSO algorithm was used to find the process parameters when the micro-hardness of the coating reached the maximum. According to a previous report [38,39], it is known that the particle’s flight velocity boundary ([vmin, vmax]) is usually equal to the position boundary ([xmin, xmax]) multiplied by a coefficient (β). The value of β with the best convergence performance is taken as 1 when the value of β is within the range [0, 2]. It should be noted that the flight space of the particle should contain the experimental sample space during optimizing the design. Based on the above analysis, β is taken as 1. Therefore, the optimization of the process parameters of laser cladding Ti(C, N) ceramic coating can be transformed into a constrained optimization problem aiming at the maximum micro-hardness of the coating, as described in Equation (16).
{ m a x [ M i c r o h a r d n e s s = f i t n e s s ( X i ) ] X i = ( X i , 1 , X i , 2 , X i , 3 , X i , 4 ) = ( L , D , S , V ) s . t .           500 L 500                             2 D 2                           40 S 40                             9 V 9

3. Results and Discussion

Figure 6 shows a typical cross-section image of a multi-track laser cladding coating observed by an ultra-depth-of-field 3D microscope and the thickness of the coating was about 0.4 mm. The micro-hardness values of the coatings are listed in Table 3. The micro-hardness values of the Ti(C, N) ceramic coatings were analyzed using the S/N ratio and ANOVA.

3.1. The Effect of Process Parameters on the Micro-Hardness of the Coating

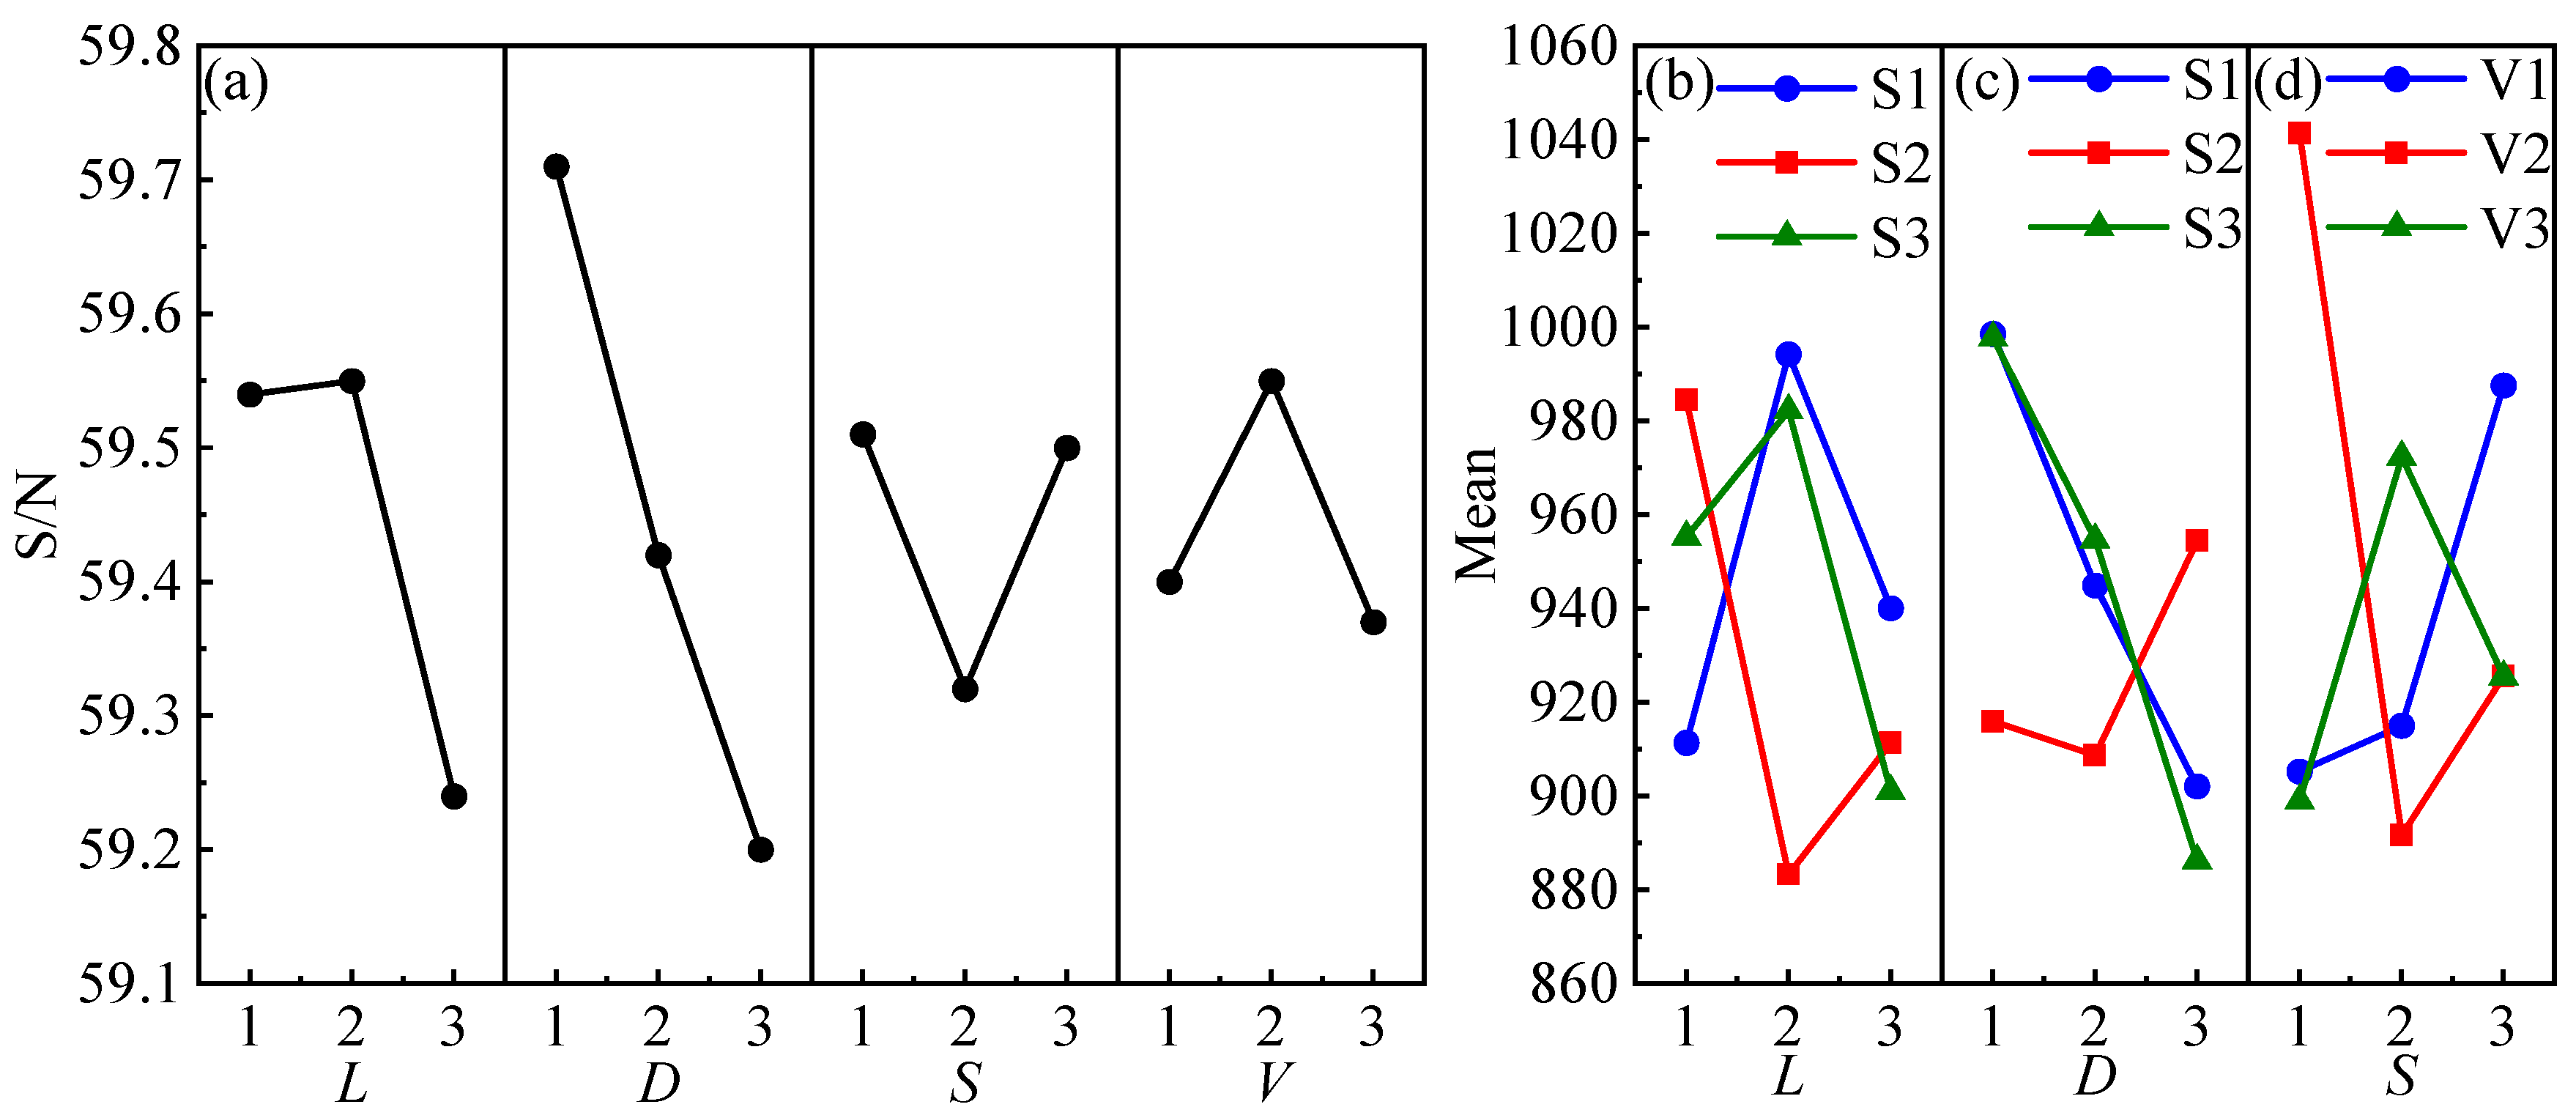
The effect of the process parameters on the coating’s micro-hardness was evaluated with the S/N ratio and the results are shown in Table 4. The rank of the influence of each factor on the micro-hardness is (S × V) > D > (L × S) > (D × S) > L > S > V. The analysis results of ANOVA are shown in Table 5. (L × S) and (S × V) were highly significant factors, while D and (D × S) were significant factors. Figure 7 shows the main effect diagram that analyzed the influence of factors on micro-hardness. According to Figure 7a, the process parameters that are beneficial to improve the micro-hardness of the coating are selected. L1 and L2 were selected for laser power, D1 for the spot diameter, S1 and S3 for the overlapping ratio, and V2 for the scanning velocity. When there was a significant interaction between the two factors, the optimal level of the factor was selected from the interaction of the factors, regardless of whether the effect of the factor itself was significant [25]. Because (L × S), (S × V), and (D × S) were significant factors, the optimal process parameter combination was confirmed from the interaction of factors. According to Figure 7b–d, the combinations of factors were confirmed successively are L2S1, D1S1, and S1V2. Therefore, the optimal combination of process parameters was L2D1S1V2, i.e., laser power L2 = 450 W, spot diameter D1 = 1 mm, overlapping ratio S1 = 20%, and scanning velocity V2 = 7 mm/s.

3.2. BPNN-QPSO Network Model for Optimizing Laser Cladding Process Parameters

The BPNN-QPSO network model was created based on MatLab to optimize process parameters of Ti(C, N) ceramic coating prepared via laser cladding. In total, 22 groups of data from the experimental samples were randomly selected for training and the other 5 groups of data were used to verify the predictive ability of the model, as shown in Table 3. BPNN-QPSO network model parameter settings are shown in Table 6.

3.2.1. Analysis of Training Performance of BPNN-QPSO Model

According to the data from the 22 training groups listed in Table 3, the iteration of the fitness value (σ) calculated by Equation (8) is shown in Figure 8a. It can be seen that the weights and thresholds of BPNN optimized by PSO algorithm and QPSO algorithm reached the optimal solution after 15 iterations and 22 iterations, respectively. The obtained optimal weights and thresholds were used to optimize the weights and thresholds of BPNN. The mean square error (MSE) calculated by Equation (6) is shown in Figure 8b–d. It can be seen that the un-optimized BPNN training underwent 19 epochs, the BPNN optimized by PSO training underwent 69 epochs, and the BPNN optimized by QPSO training underwent 93 epochs, all of which converged to the set training goal of 0.0005. The experimental results and training results of coating micro-hardness are listed in Table 3. As shown in Figure 9, it can be seen that the maximum errors of BPNN, BPNN-PSO, and BPNN-QPSO training are 1.7%, 2.49%, and 1.86%, respectively. The correlation coefficient calculated by Equation (13) is shown in Figure 10, indicating that the training effects are highly correlated. The results show that the established BPNN-QPSO network model had a strong training ability, the maximum error of training was small, and the number of training epochs increased.

3.2.2. Analysis of the Predictive Performance of BPNN-QPSO Model

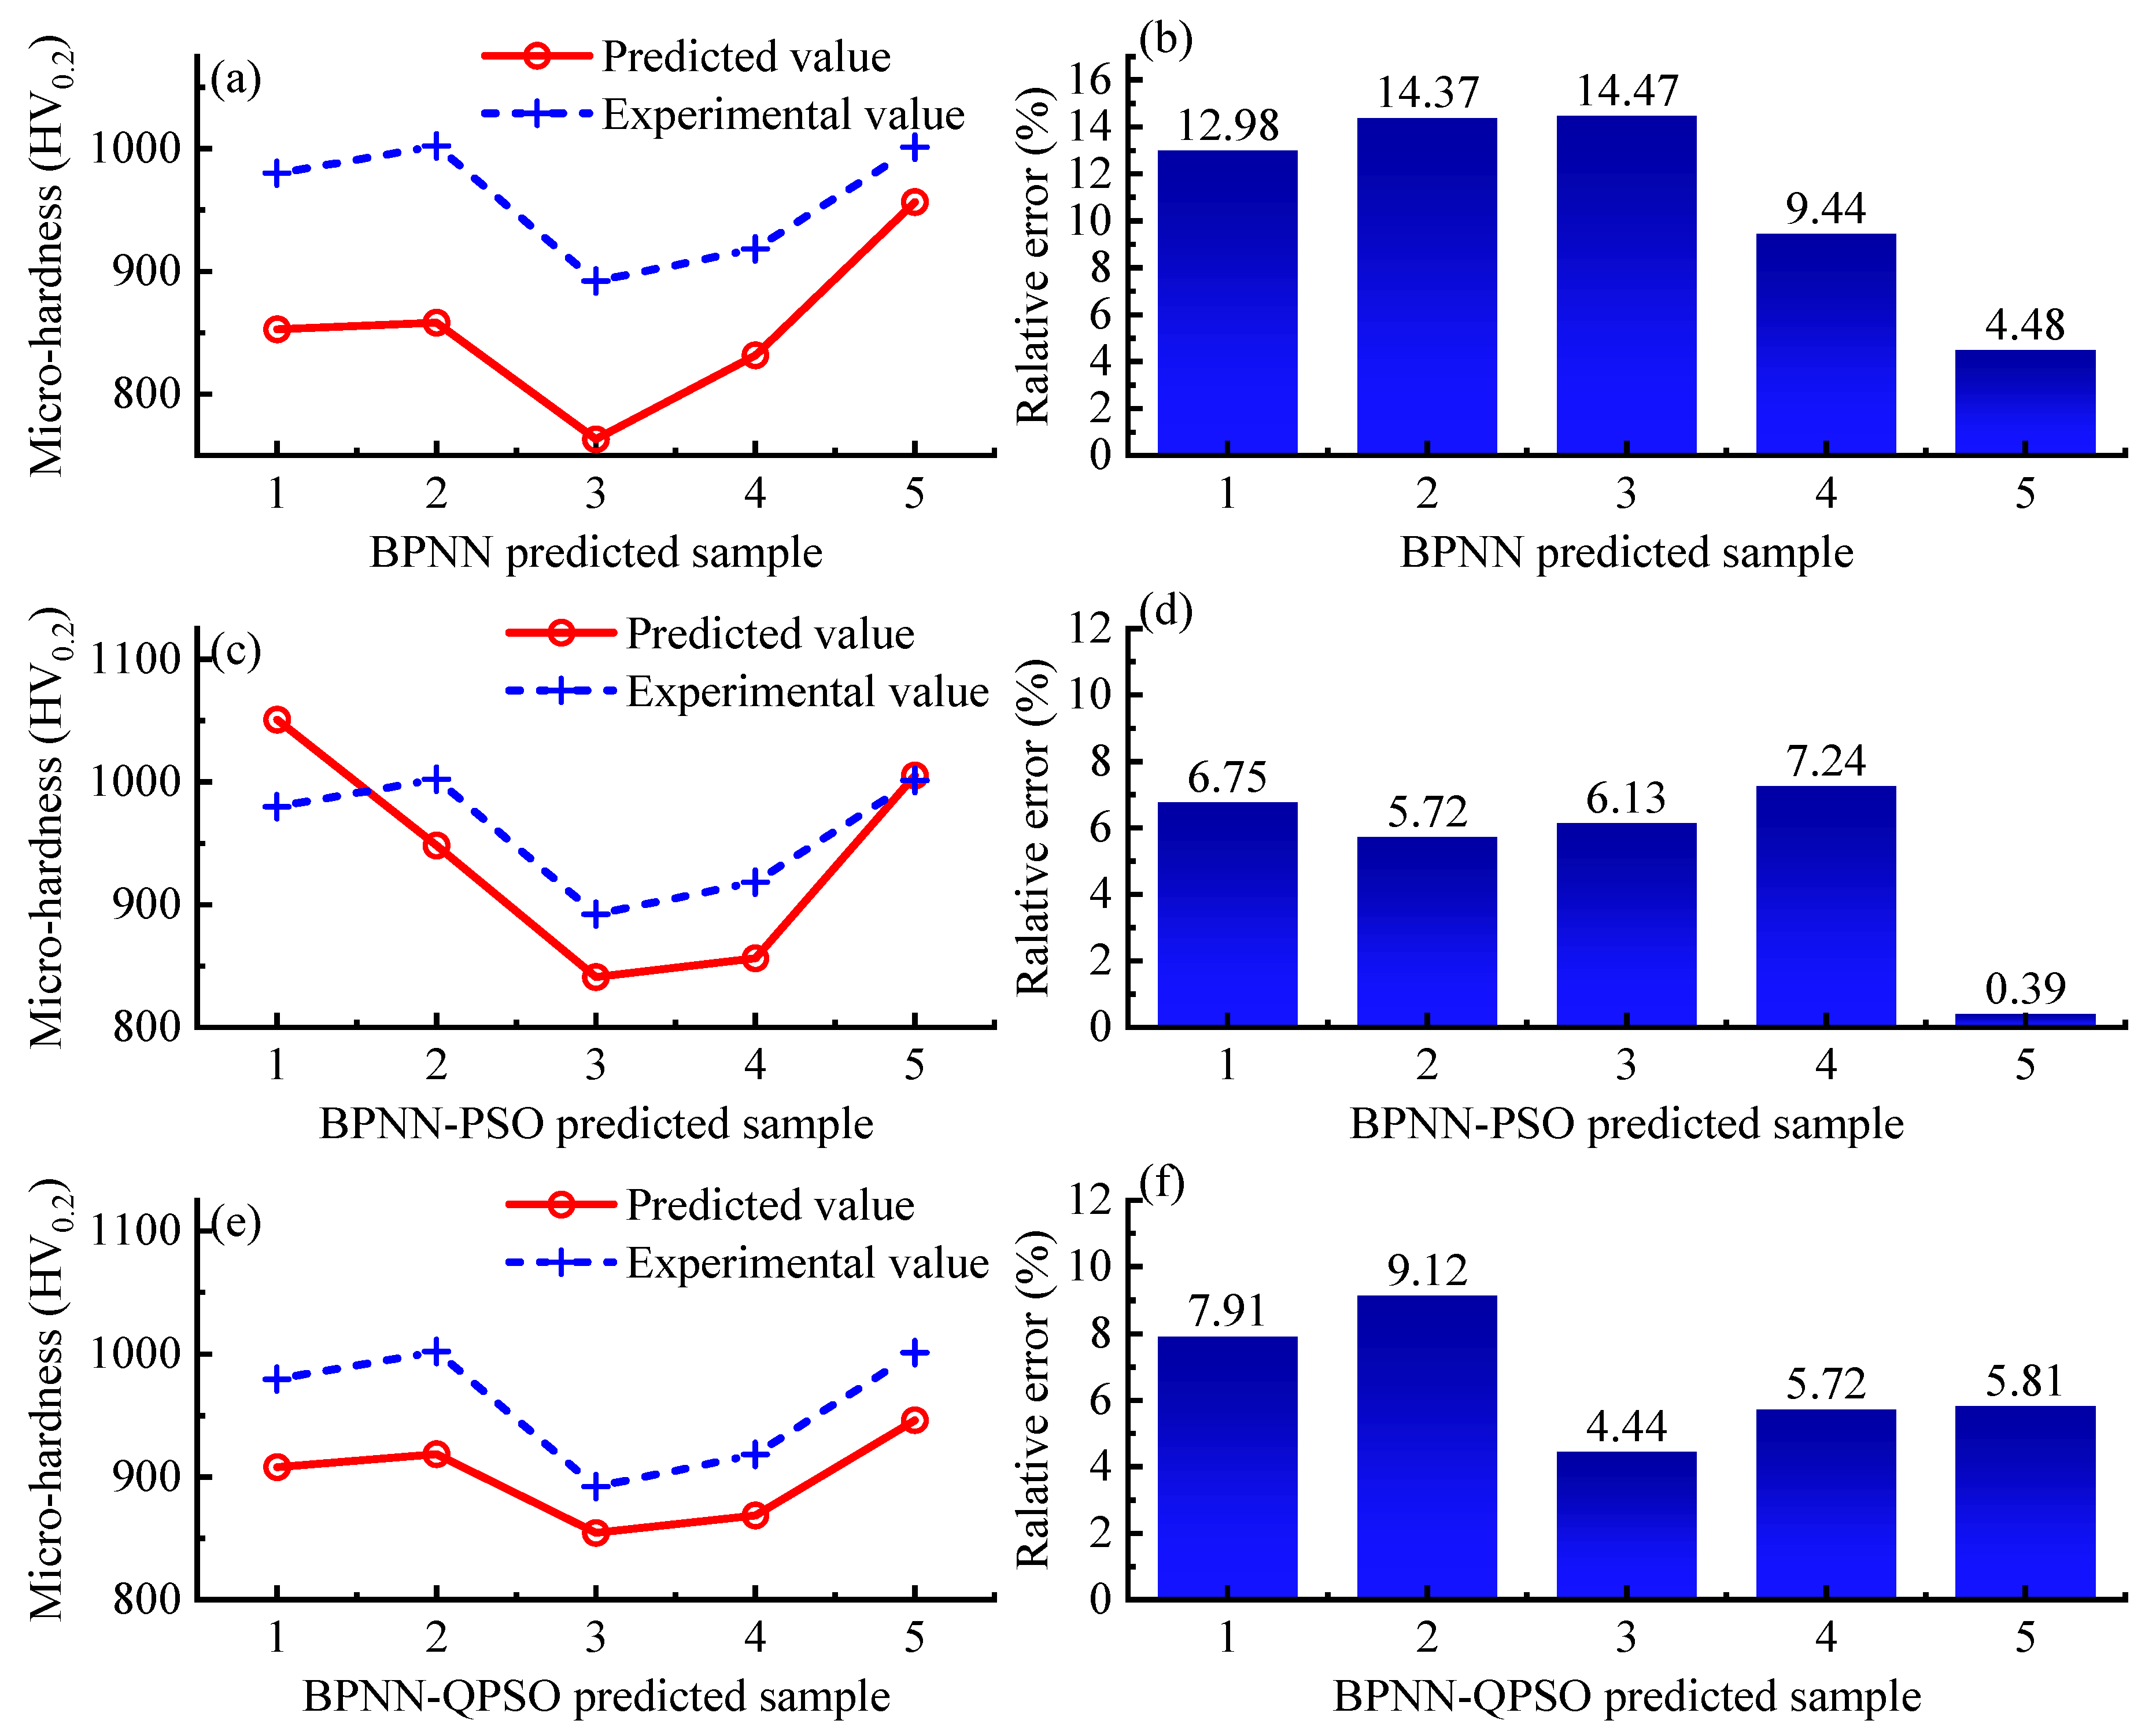
BPNN, BPNN-PSO, and BPNN-QPSO models predicted micro-hardness for the 5 coating groups, as listed in Table 3. As shown in Figure 11, it can be seen that the maximum errors of BPNN, BPNN-PSO, and BPNN-QPSO predictions were 14.47%, 7.24%, and 9.12%, respectively. The correlation coefficients calculated by Equation (13) are shown in Figure 12. The correlation coefficients of BPNN, BPNN-PSO, and BPNN-QPSO were 0.8179, 0.8363, and 0.9575, respectively. The results showed that the established BPNN-QPSO network model had better prediction results and the prediction results had a better correlation, which could be used to predict the micro-hardness of laser cladding Ti(C, N) ceramic coatings.

3.3. Optimization Results of Laser Cladding Process Parameters

The optimization results of the process parameters aiming at the maximum micro-hardness of coating are shown in Table 7. The optimal process parameter combination obtained using the Taguchi method was L2D1S1V2, i.e., laser power 450 W, spot diameter 1 mm, overlapping ratio 20%, scanning velocity 7 mm/s, and the micro-hardness of the coating tested by the hardmeter was 1134.6 HV0.2. The process parameters optimized via the BPNN model were 457.69 W, 1 mm, 21%, 7 mm/s, and the predicted micro-hardness was 1154.1 HV0.2. The process parameters optimized using the BPNN-PSO model were 449.85 W, 1 mm, 20%, 6.3 mm/s, and the predicted micro-hardness was 1108.8 HV0.2. The parameters optimized using the BPNN-QPSO model were 445.65 W, 1 mm, 20%, 6.33 mm/s, and the predicted micro-hardness was 1118.2 HV0.2. The fitness value calculated by aiming at the maximum micro-hardness value of coating is shown in Figure 13. It can be seen that BPNN-QPSO had a larger optimization range than BPNN-PSO and less iteration times were required for convergence to obtain the optimal solution than BPNN. The results showed that the probability of the BPNN-QPSO network model falling into the local optimal solution was lower than that of the BPNN-PSO network model, the convergence rate of the optimal solution was faster than that of BPNN, and the optimization result was similar to that of the Taguchi method.

3.4. Effect of Interaction of Process Parameters on the Micro-Hardness of the Coating

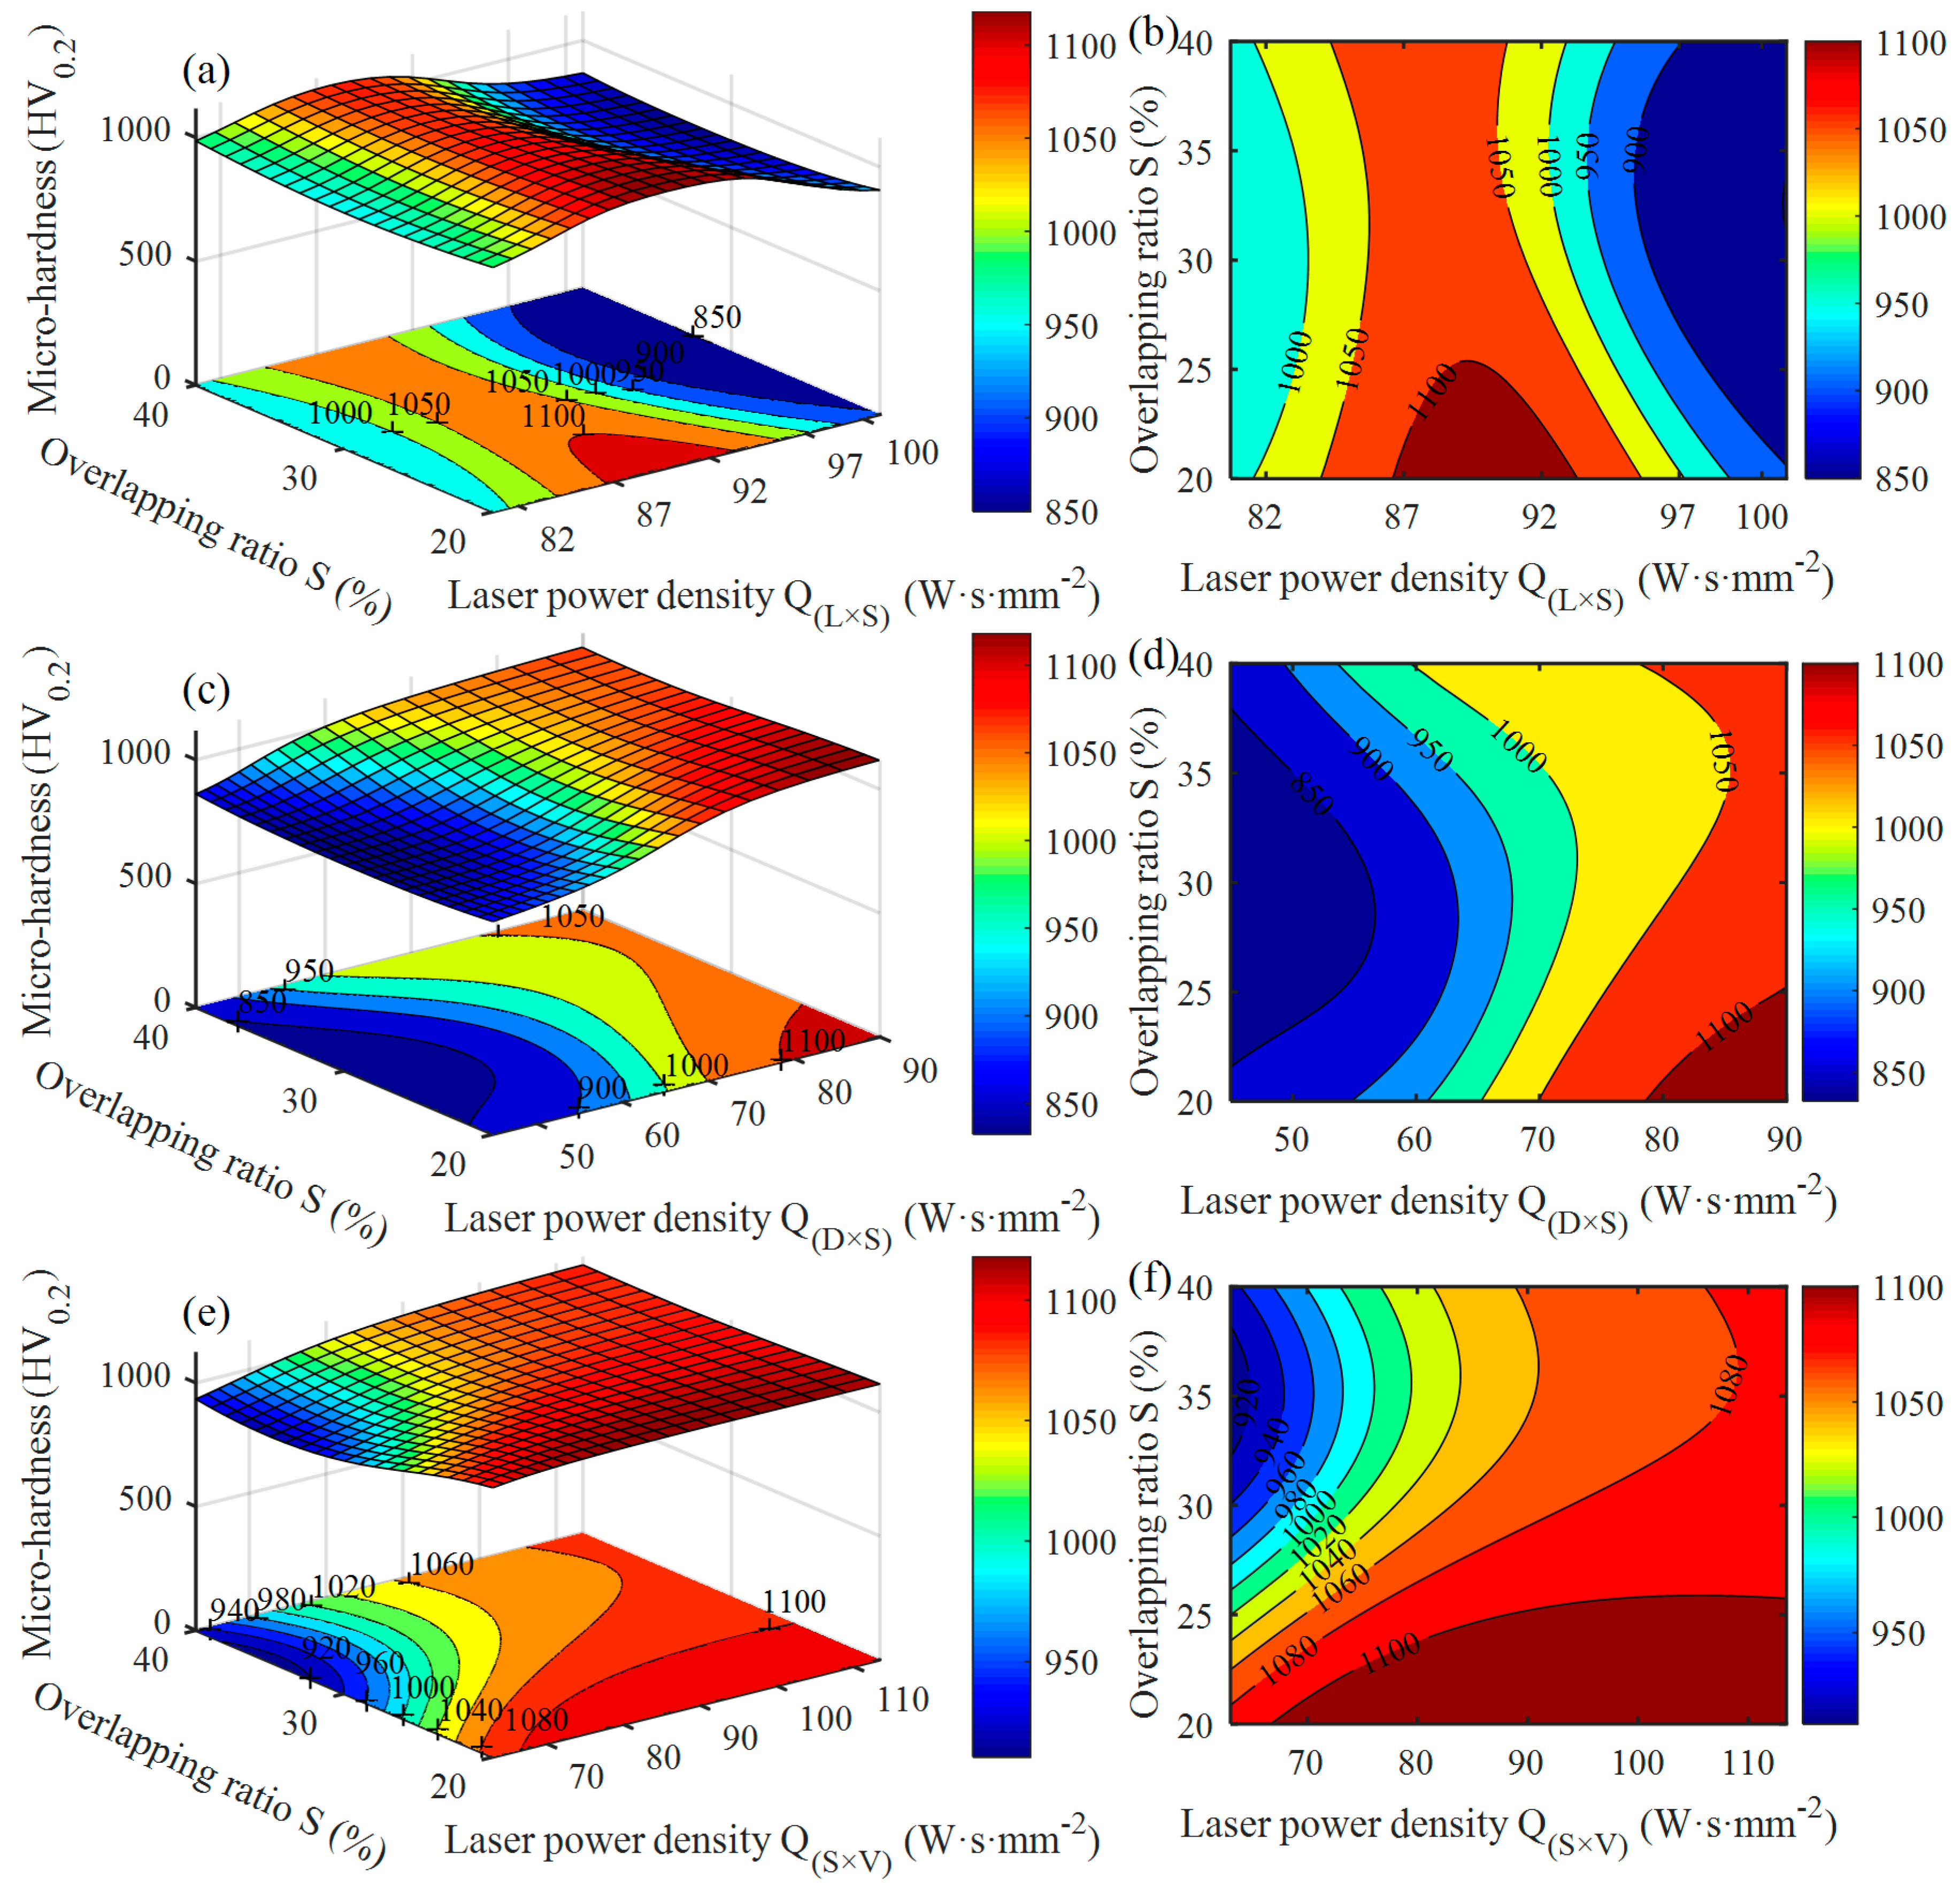
In order to visually observe the effect of the interaction of laser cladding process parameters on the micro-hardness of the coating in the orthogonal experiment, based on the established BPNN-QPSO model, the laser power density is calculated by Equation (17) [40]. By using the controlled variable method, the variation trend and the interaction of micro-hardness with process parameters are plotted in Figure 14 and Figure 15, respectively. It should be noted that the curvature of each contour map in Figure 15 indicates whether the interaction between two independent process parameters is significant. When the contour line tends to be an ellipse, it means that the two process parameters have a strong interaction. When they tend to be circle, the interaction between these two process parameters is small [41].
Q = 4 L π D V
By controlling the process parameters (D = 1 mm, S = (22%, 27%, 35%), V = 6.33 mm/s), the variation trend of micro-hardness with laser power L is plotted in Figure 14a. It can be seen that the coating’s micro-hardness increased first and then decreased with laser power L. By controlling the process parameters (D = 1 mm, V = 6.33 mm/s), the interaction between laser power L and the overlapping ratio S was plotted, as shown in Figure 15a. It can be directly seen that it was beneficial to obtain the maximum micro-hardness of coating if the laser power density Q(L×S) ranged from 87 W·s·mm−2 to 92 W·s·mm−2 and the overlapping ratio S ranges from 20% to 25% in the interaction between L and S. In addition, the contour lines of Figure 15a tend to be elliptic, indicating that the interaction between L and S was highly significant (p-value = 0.031).
By controlling the process parameters (L = 445.65 W, S = (22%, 27%, 35%), V = 6.33 mm/s), the variation trend of micro-hardness with spot diameter D was plotted in Figure 14b. It can be seen that the micro-hardness of the coating decreased with the increase of spot diameter D. By controlling the process parameters (L = 445.65 W, D = 1 mm), the interaction between spot diameter D and the overlapping ratio S was plotted, as shown in Figure 15b. It can be observed that it was beneficial to obtain the maximum micro-hardness of the coating when the laser power density Q(D×S) ranged from 80 W·s·mm−2 to 90 W·s·mm−2 and the overlapping ratio S ranged from 20% to 25% in the interaction between D and S. In addition, the contour lines in Figure 15b are approximately elliptic, indicating that the interaction between D and S was significant (p-value = 0.071).
By controlling the process parameters (L = 445.65 W, D = 1 mm, V = (6 mm/s, 7 mm/s, 8 mm/s)), the variation trend of micro-hardness with overlapping ratio S is plotted in Figure 14c. It can be known that the micro-hardness decreased with the increase of overlapping ratio S from 20% to 35%, while micro-hardness of coating increased when overlapping ratio S increased from 35% to 40%. By controlling the process parameters (L = 445.65 W, D = 1 mm), the interaction between the overlapping ratio S and the scanning velocity V is plotted as shown in Figure 15c. It can be observed that it was beneficial to obtain the maximum micro-hardness of coating when the laser power density Q(S×V) ranged from 70 W·s·mm−2 to 110 W·s·mm−2 and the overlapping ratio S ranged from 20% to 25% in the interaction between S and V. In addition, the contour lines of Figure 15c tend to be an elliptic, indicating that the interaction between S and V was highly significant. (p-value = 0.009).

4. Conclusions

This orthogonal experiment was designed using the Taguchi method and the effect of process parameters on the micro-hardness of the coating was analyzed via the S/N ratio and ANOVA. Moreover, the optimal combination of process parameters was obtained. Based on the back-propagation neural network (BPNN) and quantum-behaved particle swarm optimization (QPSO) algorithm, a BPNN-QPSO neural network prediction model for laser cladding Ti(C, N) ceramic coating was established, and the effects of the process parameters and their interactions on the micro-hardness of the coating were analyzed. Then, the process parameters were optimized aiming to the maximum micro-hardness of Ti(C, N) the ceramic coating. The main conclusions are summarized as follows:
(1).
Through S/N ratio, ANOVA analysis and main effect plot, the combination of the optimal process parameters were determined as L2D1S1V2, namely laser power 450 W, spot diameter 1 mm, overlapping ratio 20%, and scanning velocity 7 mm/s. The micro-hardness of the coating was 1134.6 HV0.2.
(2).
The BPNN-QPSO neural network model had strong training and prediction ability. The models of BPNN and BPNN-QPSO were trained for 19 epochs and 93 epochs, respectively, to reach the training goal. The maximum relative errors of BPNN and BPNN-QPSO prediction were 14.47% and 9.12%, respectively, and the correlation coefficients of the prediction results were 0.8179 and 0.9575, respectively.
(3).
The BPNN-QPSO neural network model optimized the process parameters of Ti(C, N) ceramic coating prepared by laser cladding and the optimized process parameters were laser power 445.65 W, spot diameter 1 mm, overlapping ratio 20%, and scanning velocity 6.33 mm/s. The optimization results were similar to those obtained by ANOVA.
(4).
The BPNN-QPSO neural network model predicted the optimal micro-hardness of Ti(C, N) ceramic coating prepared by laser cladding and the optimal micro-hardness was 1118.2 HV0.2. The interaction between laser power and overlapping ratio, the interaction between the spot diameter, and the overlapping ratio, as well as the interaction between overlapping ratio and scanning velocity had significant effect on the micro-hardness of Ti(C, N) the ceramic coatings.

Author Contributions

Z.D. and D.L. conceived and designed the experiments; Z.D. and S.L. performed the experiments; Z.D., T.C. and H.W. analyzed the data and discussed the experiment; Z.D. and D.L. wrote the paper. The manuscript was reviewed by all authors. All authors have read and agreed to the published version of the manuscript.

Funding

This research was funded by the National Natural Science Foundation of China grant number 51775559, the Fund of the State Key Laboratory of High-Performance Complex Manufacturing grant number ZZYJKT2019-06, and the Natural Science Foundation of Hunan province of China grant number 2020JJ4716.

Conflicts of Interest

The authors declared that they have no conflict of interest in this work. We declare that we do not have any commercial or associative interest that represents a conflict of interest in connection with the work submitted.

References

  1. Wang, Y.; Wang, H.M. Wear resistance of laser clad Ti2Ni3Si reinforced intermetallic composite coatings on titanium alloy. Appl. Surf. Sci. 2004, 229, 81–86. [Google Scholar] [CrossRef]
  2. Roy, T.; Lai, Q.; Abrahams, R.; Mutton, P.; Paradowska, A.; Soodi, M.; Yan, W. Effect of deposition material and heat treatment on wear and rolling contact fatigue of laser cladded rails. Wear 2018, 412–413, 69–81. [Google Scholar] [CrossRef]
  3. Zhang, H.; Zou, Y.; Zou, Z.; Wu, D. Microstructures and properties of low-chromium high corrosion-resistant TiC–VC reinforced Fe-based laser cladding layer. J. Alloys Compd. 2015, 622, 62–68. [Google Scholar] [CrossRef]
  4. Hulka, I.; Utu, D.; Serban, V.A.; Negrea, P.; Lukáč, F.; Chráska, T. Effect of Ti addition on microstructure and corrosion properties of laser cladded WC-Co/NiCrBSi(Ti) coatings. Appl. Surf. Sci. 2020, 504, 144349. [Google Scholar] [CrossRef]
  5. Zhang, M.; Wang, X.H.; Qu, K.L.; Liu, S.S. Effect of rare earth oxide on microstructure and high temperature oxidation properties of laser cladding coatings on 5CrNiMo die steel substrate. Opt. Laser Technol. 2019, 119, 105597. [Google Scholar] [CrossRef]
  6. Zou, Y.; Ma, B.; Cui, H.; Lu, F.; Xu, P. Microstructure, wear, and oxidation resistance of nanostructured carbide-strengthened cobalt-based composite coatings on Invar alloys by laser cladding. Surf. Coat. Technol. 2020, 381, 125188. [Google Scholar] [CrossRef]
  7. Wang, H.; Chen, T.; Cong, W.; Liu, D. Laser cladding of ti-based ceramic coatings on Ti6Al4V alloy: Effects of CeO2 nanoparticles additive on wear performance. Coatings 2019, 9, 109. [Google Scholar] [CrossRef] [Green Version]
  8. Adebiyi, D.I.; Popoola, A.P.I.; Pityana, S.L. Microstructural evolution at the overlap zones of 12Cr martensitic stainless steel laser alloyed with TiC. Opt. Laser Technol. 2014, 61, 15–23. [Google Scholar] [CrossRef]
  9. Zhou, C.; Zhao, S.; Wang, Y.; Liu, F.; Gao, W.; Lin, X. Mitigation of pores generation at overlapping zone during laser cladding. J. Mater. Process. Technol. 2015, 216, 369–374. [Google Scholar] [CrossRef]
  10. Lian, G.; Yao, M.; Zhang, Y.; Chen, C. Analysis and prediction on geometric characteristics of multi-track overlapping laser cladding. Int. J. Adv. Manuf. Technol. 2018, 97, 2397–2407. [Google Scholar] [CrossRef]
  11. Shamsaei, N.; Yadollahi, A.; Bian, L.; Thompson, S.M. An overview of Direct Laser Deposition for additive manufacturing; Part II: Mechanical behavior, process parameter optimization and control. Addit. Manuf. 2015, 8, 12–35. [Google Scholar] [CrossRef]
  12. Casalino, G. [INVITED] Computational intelligence for smart laser materials processing. Opt. Laser Technol. 2018, 100, 165–175. [Google Scholar] [CrossRef]
  13. Mishra, S.; Yadava, V. Modeling and optimization of laser beam percussion drilling of nickel-based superalloy sheet using Nd: YAG laser. Opt. Laser Eng. 2013, 51, 681–695. [Google Scholar] [CrossRef]
  14. Alizadeh, A.; Omrani, H. An integrated multi response Taguchi- neural network- robust data envelopment analysis model for CO2 laser cutting. Measurement 2019, 131, 69–78. [Google Scholar] [CrossRef]
  15. Rong, Y.; Zhang, Z.; Zhang, G.; Yue, C.; Gu, Y.; Huang, Y.; Wang, C.; Shao, X. Parameters optimization of laser brazing in crimping butt using Taguchi and BPNN-GA. Opt. Laser Eng. 2015, 67, 94–104. [Google Scholar] [CrossRef]
  16. Akbari, M.; Saedodin, S.; Panjehpour, A.; Hassani, M.; Afrand, M.; Torkamany, M.J. Numerical simulation and designing artificial neural network for estimating melt pool geometry and temperature distribution in laser welding of Ti6Al4V alloy. Optik 2016, 127, 11161–11172. [Google Scholar] [CrossRef]
  17. Ciurana, J.; Arias, G.; Ozel, T. Neural network modeling and Particle Swarm Optimization (PSO) of process parameters in pulsed laser micromachining of hardened AISI H13 steel. Mater. Manuf. Process. 2009, 24, 358–368. [Google Scholar] [CrossRef]
  18. Guo, S.; Chen, Z.; Cai, D.; Zhang, Q.; Kovalenko, V.; Yao, J. Prediction of Simulating and Experiments for Co-based Alloy Laser Cladding by HPDL. Phys. Procedia 2013, 50, 375–382. [Google Scholar] [CrossRef] [Green Version]
  19. Liu, B.; Jin, W.; Lu, A.; Liu, K.; Wang, C.; Mi, G. Optimal design for dual laser beam butt welding process parameter using artificial neural networks and genetic algorithm for SUS316L austenitic stainless steel. Opt. Laser Technol. 2020, 125, 106027. [Google Scholar] [CrossRef]
  20. Jin, C.; Jin, S.-W.; Qin, L.-N. Attribute selection method based on a hybrid BPNN and PSO algorithms. Appl. Soft Comput. 2012, 12, 2147–2155. [Google Scholar] [CrossRef]
  21. Weng, F.; Chen, C.; Yu, H. Research status of laser cladding on titanium and its alloys: A review. Mater. Des. 2014, 58, 412–425. [Google Scholar] [CrossRef]
  22. Tamanna, N.; Crouch, R.; Naher, S. Progress in numerical simulation of the laser cladding process. Opt. Laser Eng. 2019, 122, 151–163. [Google Scholar] [CrossRef]
  23. Sun, Y.; Hao, M. Statistical analysis and optimization of process parameters in Ti6Al4V laser cladding using Nd:YAG laser. Opt. Laser Eng. 2012, 50, 985–995. [Google Scholar] [CrossRef]
  24. Marzban, J.; Ghaseminejad, P.; Ahmadzadeh, M.H.; Teimouri, R. Experimental investigation and statistical optimization of laser surface cladding parameters. Int. J. Adv. Manuf. Technol. 2014, 76, 1163–1172. [Google Scholar] [CrossRef]
  25. Chen, T.; Wu, W.; Li, W.; Liu, D. Laser cladding of nanoparticle TiC ceramic powder: Effects of process parameters on the quality characteristics of the coatings and its prediction model. Opt. Laser Technol. 2019, 116, 345–355. [Google Scholar] [CrossRef]
  26. Mozaffari, A.; Fathi, A.; Khajepour, A.; Toyserkani, E. Optimal design of laser solid freeform fabrication system and real-time prediction of melt pool geometry using intelligent evolutionary algorithms. Appl. Soft Comput. 2013, 13, 1505–1519. [Google Scholar] [CrossRef]
  27. Sun, J.; Fang, W.; Wu, X.; Xie, Z.; Xu, W. QoS multicast routing using a quantum-behaved particle swarm optimization algorithm. Eng. Appl. Artif. Intell. 2011, 24, 123–131. [Google Scholar] [CrossRef]
  28. Sun, J.; Wu, X.; Palade, V.; Fang, W.; Lai, C.-H.; Xu, W. Convergence analysis and improvements of quantum-behaved particle swarm optimization. Inf. Sci. 2012, 193, 81–103. [Google Scholar] [CrossRef]
  29. Gan, W.; Zhu, D.; Ji, D. QPSO-model predictive control-based approach to dynamic trajectory tracking control for unmanned underwater vehicles. Ocean Eng. 2018, 158, 208–220. [Google Scholar] [CrossRef]
  30. Ma, M.; Xiong, W.; Lian, Y.; Han, D.; Zhao, C.; Zhang, J. Modeling and optimization for laser cladding via multi-objective quantum-behaved particle swarm optimization algorithm. Surf. Coat. Technol. 2020, 381, 125129. [Google Scholar] [CrossRef]
  31. Stevenson, A.J.; Kupp, E.R.; Messing, G.L. Low temperature, transient liquid phase sintering of B2O3-SiO2-doped Nd:YAG transparent ceramics. J. Mater. Res. 2011, 26, 1151–1158. [Google Scholar] [CrossRef]
  32. Feng, Z.; Qi, J.; Guo, X.; Wang, Y.; Cao, X.; Yu, Y.; Meng, C.; Lu, T. A new and highly active sintering additive: SiO2 for highly-transparent AlON ceramic. J. Alloys Compd. 2019, 787, 254–259. [Google Scholar] [CrossRef]
  33. Farnia, A.; Malek Ghaini, F.; Sabbaghzadeh, J. Effects of pulse duration and overlapping factor on melting ratio in preplaced pulsed Nd:YAG laser cladding. Opt. Laser Eng. 2013, 51, 69–76. [Google Scholar] [CrossRef]
  34. Liu, K.; Li, Y.; Wang, J.; Ma, Q. In-situ synthesized Ni–Zr intermetallic/ceramic reinforced composite coatings on zirconium substrate by high power diode laser. J. Alloys Compd. 2015, 624, 234–240. [Google Scholar] [CrossRef]
  35. Li, Z.; Wei, M.; Xiao, K.; Bai, Z.; Xue, W.; Dong, C.; Wei, D.; Li, X. Microhardness and wear resistance of Al2O3-TiB2-TiC ceramic coatings on carbon steel fabricated by laser cladding. Ceram. Int. 2019, 45, 115–121. [Google Scholar] [CrossRef]
  36. Zhang, Z.; Kovacevic, R. Multiresponse optimization of laser cladding steel + VC using grey relational analysis in the Taguchi method. Jom 2016, 68, 1762–1773. [Google Scholar] [CrossRef]
  37. Liu, H.; Qin, X.; Huang, S.; Jin, L.; Wang, Y.; Lei, K. Geometry characteristics prediction of single track cladding deposited by high power diode laser based on genetic algorithm and neural network. Int. J. Precis. Eng. Manuf. 2018, 19, 1061–1070. [Google Scholar] [CrossRef]
  38. Ceylan, R.; Koyuncu, H. A PSO based approach: Scout particle swarm algorithm for continuous global optimization problems. J. Comput. Des. Eng. 2019, 6, 129–142. [Google Scholar] [CrossRef]
  39. Shin, Y.-B.; Kita, E. Search performance improvement of Particle Swarm Optimization by second best particle information. Appl. Math. Comput. 2014, 246, 346–354. [Google Scholar] [CrossRef]
  40. Wang, Y.; Lu, D.; Wu, G.; Chen, K.; Wu, H.; Zhang, Q.; Yao, J. Effect of laser surface remelting pretreatment with different energy density on MAO bioceramic coating. Surf. Coat. Technol. 2020, 393, 125815. [Google Scholar] [CrossRef]
  41. Song, H.; Dan, J.; Li, J.; Du, J.; Xiao, J.; Xu, J. Experimental study on the cutting force during laser-assisted machining of fused silica based on the Taguchi method and response surface methodology. J. Manuf. Process. 2019, 38, 9–20. [Google Scholar] [CrossRef]
Figure 1. The micro morphology image of pre-placed cladding powder: (a) TiCN; (b) SiO2.
Applsci 10 06331 g001
Figure 2. Schematic diagram of the laser cladding system.
Applsci 10 06331 g002
Figure 3. Schematic diagram of the measurement of coating micro-hardness.
Applsci 10 06331 g003
Figure 4. The structure of BPNN.
Applsci 10 06331 g004
Figure 5. The flow chart of the back-propagation neural network and quantum-behaved particle swarm optimization algorithm (BPNN-QPSO).
Applsci 10 06331 g005
Figure 6. Cross-section of Ti(C, N) ceramic coating.
Applsci 10 06331 g006
Figure 7. Effect of laser cladding parameters on micro-hardness of coatings: (a) the influence of single factors; (b) the interaction of S and L; (c) the interaction of S and D; (d) the interaction of V and S.
Applsci 10 06331 g007
Figure 8. Training performance of the network model: (a) fitness iteration of standard error; (b) BPNN training process; (c) BPNN-PSO training process; (d) BPNN-QPSO training process.
Applsci 10 06331 g008
Figure 9. Comparison diagram of training values and experimental values of micro-hardness: (a,b) BPNN;(c,d) BPNN-PSO; (e,f) BPNN-QPSO.
Applsci 10 06331 g009
Figure 10. Scatter plot of training values and experimental values of micro-hardness: (a) BPNN; (b) BPNN-PSO; (c) BPNN-QPSO.
Applsci 10 06331 g010
Figure 11. Comparison diagram predicted and experimental micro-hardness of coatings: (a,b) BPNN; (c,d) BPNN-PSO; (e,f) BPNN-QPSO.
Applsci 10 06331 g011
Figure 12. Scatter plot of predicted and experimental micro-hardness of coating: (a) BPNN; (b) BPNN-PSO; (c) BPNN-QPSO.
Applsci 10 06331 g012
Figure 13. Fitness value iteration of coating micro-hardness.
Applsci 10 06331 g013
Figure 14. Trend plot of coating micro-hardness: (a) laser power; (b) spot diameter; (c) overlapping ratio.
Applsci 10 06331 g014
Figure 15. Interaction between process parameters: (a,b) L × S; (c,b) D × S; (e,f) S × V.
Applsci 10 06331 g015
Table 1. Experimental factors and levels.
Process ParametersNotationsUnitLevel
123
Laser powerLW400450500
Spot diameterDmm11.52
Overlapping ratioS%203040
Scanning velocityVmm/s579
Table 2. L27-(313) orthogonal table for preparation of Ti(C, N) ceramic coating by laser cladding.
Sample No.LD(S × V)1 S(L × S)1(L × S)2(D × S)1V (D × S)2 (S × V)2
#11111111111111
#21111222222222
#31111333333333
#41222111222333
#51222222333111
#61222333111222
#71333111333222
#81333222111333
#91333333222111
#102123123123123
#112123231231231
#122123312312312
#132231123231312
#142231231312123
#152231312123231
#162312123312231
#172312231123312
#182312312231123
#193132132132132
#203132213213213
#213132321321321
#223213132213321
#233213213321132
#243213321132213
#253321132321213
#263321213132321
#273321321213132
Table 3. The micro-hardness of the coatings from experiments and models.
No.Sample No.LDSVMicro-Hardness (HV0.2)
ExperimentBPNNBPNN-PSOBPNN-QPSO
Training group
11#1111932.9932.1947.4942.9
22#1122971.4970.3960.3965.2
33#1133985.5985.81001.1987.2
44#1212988.3989.9989.1988.0
56#1231991.5992.6988.9990.0
67#1313812.8812.0828.0827.5
79#1332889.0887.6889.7886.8
810#21121134.61132.51107.01113.9
911#2123919.9919.5920.3923.8
1012#21311089.51086.71086.61080.1
1113#2213955.9956.3952.0950.1
1214#2221886.3890.7883.0892.1
1315#2232969.6953.1971.9968.5
1417#2322843.6843.9853.7841.2
1518#2333887.8887.1878.3890.7
1619#3113928.3936.4924.5932.4
1720#3121856.6858.3855.4860.5
1822#3211890.7891.4882.7890.3
1923#3222860.0856.0871.6862.8
2024#3233903.1906.2899.4903.6
2126#33231017.61014.61015.01012.6
2227#3331882.0890.1877.0882.1
Prediction group
1#51223979.8852.21050.7908.0
2#813211002.2858.2948.0918.4
3#162311892.2763.1840.7854.3
4#213132918.2831.5856.2868.5
5#2533121001.3956.41005.2946.3
Table 4. Effect of laser cladding process parameters on the micro-hardness of the coatings (S/N ratio).
LevelLD(S × V)S(L × S)V(D × S)
159.5459.7159.2859.5159.2259.459.53
259.5559.4259.6459.3259.6759.5559.27
359.2459.259.4159.559.4459.3759.54
Delta0.310.510.580.190.480.170.43
Rank5216374
Table 5. ANOVA of the micro-hardness of the coatings.
SourceDoFAdj SSAdj MSF-Valuep-ValueSignificance
L2709235462.450.166
D21460473025.050.052S
S2267613380.930.446
V2216910850.750.512
L × S43017275435.220.037HS
D × S42201355033.810.071S
S × V454765136919.470.009HS
Error686721445
Total26142163
Table 6. Parameters setup for BPNN-QPSO.
Parameter NameValue
Dimensions of Particle Swarms (ND)20
Number of iterations (QPSO)30
Noise0.01
contraction coefficient1
Number of epochs (BPNN)5000
Training goal0.0005
Learning rate0.001
Transfer functiontansig
Training functiontrainbr
Table 7. Optimization results of process parameters.
MethodL (W)D (mm)S (%)V (mm/s)Micro-Hardness (HV0.2)
Taguchi45012071134.6
BPNN457.6912171154.1
BPNN-PSO449.851206.31108.8
BPNN-QPSO445.651206.331118.2