Article

Effects of Wall Properties on Temperature-Control Effectiveness of Heating Section in a Thermosiphon Containing PCM Suspensions

1
Department of Mechanical Engineering, National Cheng-Kung University, Taiwan, 1, University Road, Tainan City 701, Taiwan
2
Department of Mechanical and Energy Engineering, National Chiayi University, Taiwan, 300 Syuefu Rd., Chiayi City 600, Taiwan
3
Department of Civil Engineering, National Cheng-Kung University, Taiwan, 1, University Road, Tainan City 701, Taiwan
*
Authors to whom correspondence should be addressed.
Appl. Sci. 2020, 10(18), 6211; https://doi.org/10.3390/app10186211
Submission received: 2 July 2020 / Revised: 28 August 2020 / Accepted: 2 September 2020 / Published: 7 September 2020
(This article belongs to the Special Issue Nanofluids Application in Heat Transfer)

Abstract

:
This article considers the problem of natural heat transfer in a rectangular thermosiphon to investigate the effects of wall properties (thickness and thermal conductivity) on the heat-transfer characteristics of phase-change-material (PCM) suspension flow. The following parameter ranges were investigated: dimensionless loop-wall thickness, 0–0.5; wall-to-fluid thermal-conductivity ratio, 0.1–100; modified Rayleigh number, 1010–1011; and volumetric fraction of PCM particles, 0–10%. From numerical simulations via the finite-volume approach, it was found that using a pipe with appropriate wall thickness and thermal conductivity containing PCM suspensions for the heating section of a rectangular thermosiphon can effectively control the maximal temperature.

1. Introduction

The thermosiphon is a natural circulation loop. With proper arrangement of the heating and cooling sections, the resulting thermal buoyancy can drive the working fluid in the loop to achieve thermal-energy transportation. The cooling and heating sections are usually positioned at the left and right or upper and lower sides of the loop, respectively. The increase in working-fluid temperature in the heating section decreases fluid density. The working fluid flows upwards by thermal buoyancy, which dissipates heat in the cooling section. Gravity opposes the upward flow of working-fluid flows, and promotes the downward flow of the working fluid. The absence of external driving forces results in considerable operational reliability for the thermosiphon. The self-adjusting mechanism and stability of the thermosiphon have resulted in wide application, such as in solar heating or cooling [1,2], nuclear thermal coolers [3,4], geothermal systems [5], waste-heat recovery [6], and electronic cooling devices [7]. There are many considerations in the design of thermally efficient thermosiphons, such as the selection of the working fluid, pipe-wall material, the locations of the heating and cooling sections, and geometric loop parameters [1,8,9,10].
Phase-change material (PCM) can effectively store and release a large amount of latent heat during phase transition; therefore, is a promising material choice for applications of energy storage, heat-transfer enhancement [11,12], thermal-environment control [13], boiling-heat-transfer enhancement with nanofluids [14], etc. Comprehensive literature studies on thermophysical properties, impregnation methods, thermal-performance analyses, numerical simulations, and other applications can be found in the review articles [15,16]. Attinger et al. [17] reviewed the techniques and challenges of engineering surfaces for phase-change heat transfer.
Fine solid–liquid PCM particles can be dispersed in a carrier or a suspending working fluid to form PCM slurries or suspensions. The absorption and release of latent heat of the PCM at designated locations of the loop decreases the maximal temperature and increases heat transfer. Methods for manufacturing PCM particles can be categorized into microencapsulation [18,19,20,21] and emulsification [22,23]. In microencapsulation, PCMs are encapsulated by polymer materials, separating the disperse phase (PCM) from the dispersion media (such as water and glycerol) and suspending in the dispersion media. The advantages of microencapsulation are that the size and shape of the particles are fixed, and the physical properties of the particles are stable. The disadvantages of this method are a complex manufacturing process, high cost, and that the polymer layer on the PCM particle surface can reduce the heat-transfer efficiency, and may expand and break after repeated heating–cooling. In emulsification, the surface tension between a dispersed phase and a dispersion medium is reduced via the addition of an appropriate emulsifier. PCM particles can be homogeneously suspended in a dispersion medium as a stable emulsion.
The heat-transfer enhancement obtained by using PCM suspensions as a working fluid was widely demonstrated for forced convection [24,25]. By contrast, limited studies have been carried out on the heat-transfer characteristics for PCM suspensions in a thermosiphon.
Ho et al. [26] numerically simulated the heat transfer of a rectangular thermosiphon containing PCM suspensions. A flow regime was identified where the latent heat absorption/release of the PCM suspension effectively enhanced heat transfer. Ho et al. [27] performed more extensive parametric simulations to investigate the effects of heating-section ratio, cooling-section height, and loop size on the heat-transfer characteristics of a rectangular thermosiphon containing PCM suspensions. The highest heating and the cooling efficiencies were obtained for a certain combination of the aspect ratio of the loop, the dimensionless length of the heating section, and the dimensionless elevation of the cooling section relative to the heating section. However, the wall properties of the thermosiphon were not considered.
As inspired from the literature on conjugate heat transfer in single-phase and phase-change [26,28] pipe flows, heat conduction in the duct wall of a certain thickness can significantly affect the forced and natural convection in a PCM suspension flow, respectively. The wall effects lead to technical gaps between predictions and experiment results for pipe-flow studies. Therefore, in this study, a rectangular thermosiphon containing PCM suspensions with an optimal loop configuration was used to investigate the effects of wall thickness and thermal conductivity on loop heat transfer, for which little information is available.

2. Material and Methods

In this study, the physical model (shown in Figure 1) was a rectangular natural circulation loop (aspect ratio A R = l H + / l V + ) containing the PCM suspension fluid. l H + and l V + were the horizontal length (width) and the vertical length (height) of the loop, respectively. The inner radius of the circular pipe in the loop was r i + . The loop consisted of a heating and a cooling section separated by adiabatic sections. The lower horizontal section had a heating section with a length of l h + that provided uniformly distributed heat flux q h . The upper portion of the vertical section (right) had a cooling section with length l c + that provided isothermal boundary T c . The height from the center of the cooling section to the lower horizontal section is l z + . The geometric configuration that maximized the heat-transfer efficiency of a heating section of a rectangular thermosiphon containing PCM suspensions, obtained in our previous study [27], was used: AR = 1l; the dimensionless length of the heating section ( l h * = l h + / l H + ) = 0.4, and the dimensionless elevation of the cooling section relative to the heating section ( l z = l z + / l c + ) = 0.75.
Consider a binary mixture system of continuous fluid (water) dispersed with small PCM particles, as shown in Figure 1 (upper-left A–A section). PCM particles can absorb/release thermal energy from/to fluid, undergoing solid–liquid phase change so that they can be solid, liquid, or both. Continuum formulation was applied to model the buoyancy-driven circulation flow of the PCM suspensions under the following assumptions.
(1)
PCM suspension was regarded as incompressible Newtonian fluid and in steady-state, two-dimensional, axisymmetric, and fully developed laminar flow.
(2)
Viscous dissipation in the loop flow was neglected.
(3)
All other physical properties did not vary with temperature, except that the Boussinesq approximation was used to describe working-fluid density.
(4)
PCM particles were evenly distributed in the loop.
(5)
Heat-conduction heat transfer inside the pipe wall was axisymmetric. The thermal conductivity of the pipe wall was constant.
(6)
There was negligible variation in the density of the PCM particles during the solid–liquid phase transition.
(7)
The relative velocity between PCM particles and base fluid was substantially smaller than the total velocity and could be neglected.
(8)
The supercooling effect of the PCMs was negligible, i.e., the melting and freezing points of the PCMs were the same.
The following dimensionless variables were defined:
r = r + r i +   ,   s = s + l c +   ,   θ = T T M ( q h   r i + / k b )   ,   u = u + ( R a * 1 / 4 α b / r i + )
The assumptions and dimensionless variables given above were used to obtain the dimensionless governing equations below.
Continuity equation:
u s = 0 .
Momentum equation integrated over the entire loop length ( l L ):
1 r r ( r u r ) + ( R a * 1 / 4 R L ) 3 γ L l L   0   l L θ ϕ d s = 0 ,
where ϕ = 1 for l H < s < ( l L / 2 ) ; ϕ = 1 for ( l L / 2 + l H ) < s < l L ; and ϕ = 0 for 0 s l H or ( l L / 2 ) < s < ( l L / 2 + l H ) . The correction factor for loop length γ L ( 1 ) is embodied in the buoyancy force term of Equation (2) to specify minor losses in the loop [29].
Energy equation:
2 θ s 2 + 1 ( R L l L ) 2 ( 2 θ r 2 + 1 r θ r ) = 0
u θ s = ( R L l L R a * 1 / 4 ) [ 2 θ s 2 + 1 ( R L l L ) 2 ( 2 θ r 2 + 1 r θ r ) ] ( ρ p f * ρ b f * ) c v S t e * u ξ s
The last term on the right-hand side of Equation (4) represents the transport of latent-heat absorption and the release of PCM particles, and requires closure in terms of liquid-phase volume fraction of particles ξ l . The approximate enthalpy model [26,30] was utilized to characterize the phase change of the PCM particles, as well as ξ l :
u ξ s = ( 3 B i p r p 2 ) ( k p f * k b f * ) ( ρ b f * ρ p f * ) ( S t e * R L l L R a * 1 / 4 ) θ
Particle Biot number B i p is obtained using the relationships given by Charunyakorn et al. [31]. During the phase-change process, particle temperature was assumed to be the same as the phase-change temperature. The time lag of the PCM particles, which was related to the diffusion time scale of the particles and the heat-capacity difference between particles and mixture, was assumed to be 0. The effect of PCM supercooling was not considered in this study. Incorporation of the time lag of PCM particles during the phase-change process and PCM supercooling is very important. This is not what we explore in this study, but worthy of further consideration. Readers can refer to [30] for details.
Dimensionless boundary conditions:
(1)
Outer wall boundary, r = 1 + t w
θ r = k b f * k w f *   ;   l a s < ( l H l a )
θ r = 0   ;   0 s < l a   ,   ( l H l a ) s < ( 2 l H + l v + l a )   ,   ( 2 l H + l v + l a + 1 ) s < l L
θ = S b *   ;   ( 2 l H + l v + l a ) s < ( 2 l H + l v + l a + 1 )
(2)
Inner wall boundary, r = 1
u = 0 ;   θ w , i = θ b ;   ( θ r ) w , i = k b f * k w f * ( θ r ) b
(3)
Center of pipe, r = 0
u r = 0   ,   θ r = 0   ,   ξ l r = 0
Dimensionless bulk temperature of the PCM suspension θ b and mean liquid-phase fraction of PCM suspension ξ b at a specified cross-section of the loop are determined as follows:
θ b ( s ) = 0 1   u ( r ) θ ( r , s )   r d r / 0 1   u ( r )   r d r
ξ b ( s ) = 0 1   u ( r ) ξ ( r , s )   r d r / 0 1   u ( r )   r d r .
The dimensionless local heat flux of the inner wall ( q i ) is
q i = q i q h = k b ( T r + ) r + = r i + q h = ( θ r ) r = 1 .
Neglecting axial fluid conduction, an integral energy balance was incorporated to derive the heat-transfer rate over the heating section between s = l a and s = l H l a :
q h * = 1 l h l a ( l H l a ) ( θ r ) r = 1   ds
u b 2 ( R a * 1 / 4 R L ) ( l L l h ) [ θ b ( s = ( l H l a ) ) θ b ( s = l a ) ]
+ u b 2 ( R a * 1 / 4 R L ) ( l L l h ) ( ρ p f * ρ b f * ) ( c v S t e * ) [ ( ξ b ( s = ( l H l a ) ) ξ b ( s = l a ) ] .
Equation (14) relates θ b to ξ b for convection heat-transfer rate q h * . That is, the convective heat transfer by the PCM suspension flow in the loop arose from the transport of sensible and latent heat, which are given as follows:
( q h * ) s e n = u b 2 ( R a * 1 / 4 R L ) ( l L l h ) [ ( θ b ( s = ( l H l a ) ) θ b ( s = l a ) ]
( q h * ) l a t = u b 2 ( R a * 1 / 4 R L ) ( l L l h ) ( ρ p f * ρ b f * ) ( c v S t e * ) [ ( ξ b ( s = ( l H l a ) ) ξ b ( s = l a ) ] .
Latent-heat contribution to the overall heat transfer of the heating section ( Φ h * ) l a t is
( Φ h * ) l a t = ( q h * ) l a t / q h * .
To estimate the efficacy of the PCM suspension for heat-transfer enhancement, the effectiveness of maximal temperature control ε T max for the heating section is defined as follows:
ε T max = ( θ w , h , max , f / θ w , h , max , b ) ( k b f * ) = ( T w , h , max , f T M ) / ( T w , h , max , b T M ) .

3. Numerical Method

The differential equations were spatially discretized on a uniform mesh. Second-order central-difference and QUICK [32] schemes were used for the diffusion terms and convective terms, respectively. In this paper, line-successive over-relaxation (SOR) was used to solve the unknown terms, and the tridiagonal-matrix algorithm (TDMA) to solve the problem, where the solution was initiated at s+ = 0 and iterated along main flow direction s+ (Figure 1). The ratios of the maximal variations to the maximal values of the temperature, the volumetric proportion of the liquid phase of the PCM suspension, and velocity were monitored to determine the convergence of these parameters, where the convergence condition for each parameter was 10−5.
To test grid independence, the mean Nusselt numbers of the inner pipe walls in both the heating and the cooling section were used to calculate the deviation percentages. Numerical errors were estimated using the grid-convergence-index (GCI) method for the local Nusselt numbers of the heating and cooling sections. Deviation percentages and numerical errors were used to determine suitable grid points for our calculations. In our previous study [27], a grid of 2001 × 201 points was sufficient for zero wall thickness ( t w = 0). Therefore, in this study, a grid of 2001 × 201 points was used as the baseline, and the number of grid points was increased along the radial direction. The following loop configuration was used to test grids with different numbers of points, and AR = 1; l H * = 0.8; l z = 2; S t e * = 0.1; S b * = 0.6; R a * = 10 11 ; c v = 10%; and t w = 0.5. A grid of 2001 × 701 resulted in less than 1% deviation in the mean Nusselt number, and less than 1% error in the energy-balance conditions (data not shown) of the walls in the heating and cooling sections. Therefore, a grid of 2001 × 701 was used in all simulations.
The developed formulation and the incorporated numerical method were verified by simulating selected cases of heat transfer in a single-phase toroidal loop [33] and forced convection of the PCM suspension fluid in a straight circular pipe [34], as shown in Figure 2 [27]. No significant difference was found among the results of the different studies, confirming the reliability of the simulation results in this study.

4. Results and Discussion

Figure 3 shows the axial distributions of the loop temperatures and ξ b versus t w , where θ w , o represents the temperature of the outer pipe wall, θ w , i represents the temperature of the inner pipe wall, and θ b represents the local mean temperature of the suspension fluid at a given cross section of the pipe, and s * is the modified dimensionless axial coordinate (= s + / l L + ). The dotted lines partition the figure into five blocks, and the point with dimensionless distance s * of 0 was set at the lower-right corner of the loop system (Figure 1). Except for the heating and cooling sections, all other parts in the figure are adiabatic sections. The s * range of 0–0.073 corresponds to the adiabatic section before the inlet of the heating section, the range of 0.073–0.174 corresponds to the heating section, the range of 0.174–0.748 corresponds to the adiabatic section between the outlet of the heating section and the inlet of the cooling section, the range of 0.748–0.948 corresponds to the cooling section, the range of 0.948–1 corresponds to the adiabatic section after the cooling section, and s * of 1 indicates the return to the starting point of the loop.
Results showed that, after the fluid entered the heating section, it was heated by a constant heat flux, and temperatures started to rise. When entering the adiabatic section, temperatures decreased. After that, it remained approximately isothermal until entering the cooling section. Then, the temperatures decreased due to the cooling effect. After leaving the cooling section, it entered the adiabatic section, and the temperatures rose because the wall of the adiabatic section receives axial heat transfer from the heating section. Figure 3a–c shows that, the thicker the pipe wall was, the higher the temperatures were because thermal resistance increased with pipe-wall thickness. The distribution of the liquid fraction of PCM suspension (Figure 3d) shows that, for t w = 0.5, the thicker pipe wall caused overall temperature to increase, which delayed the solidification of the PCM particles after complete cooling, as shown by the red arrow in the figure.
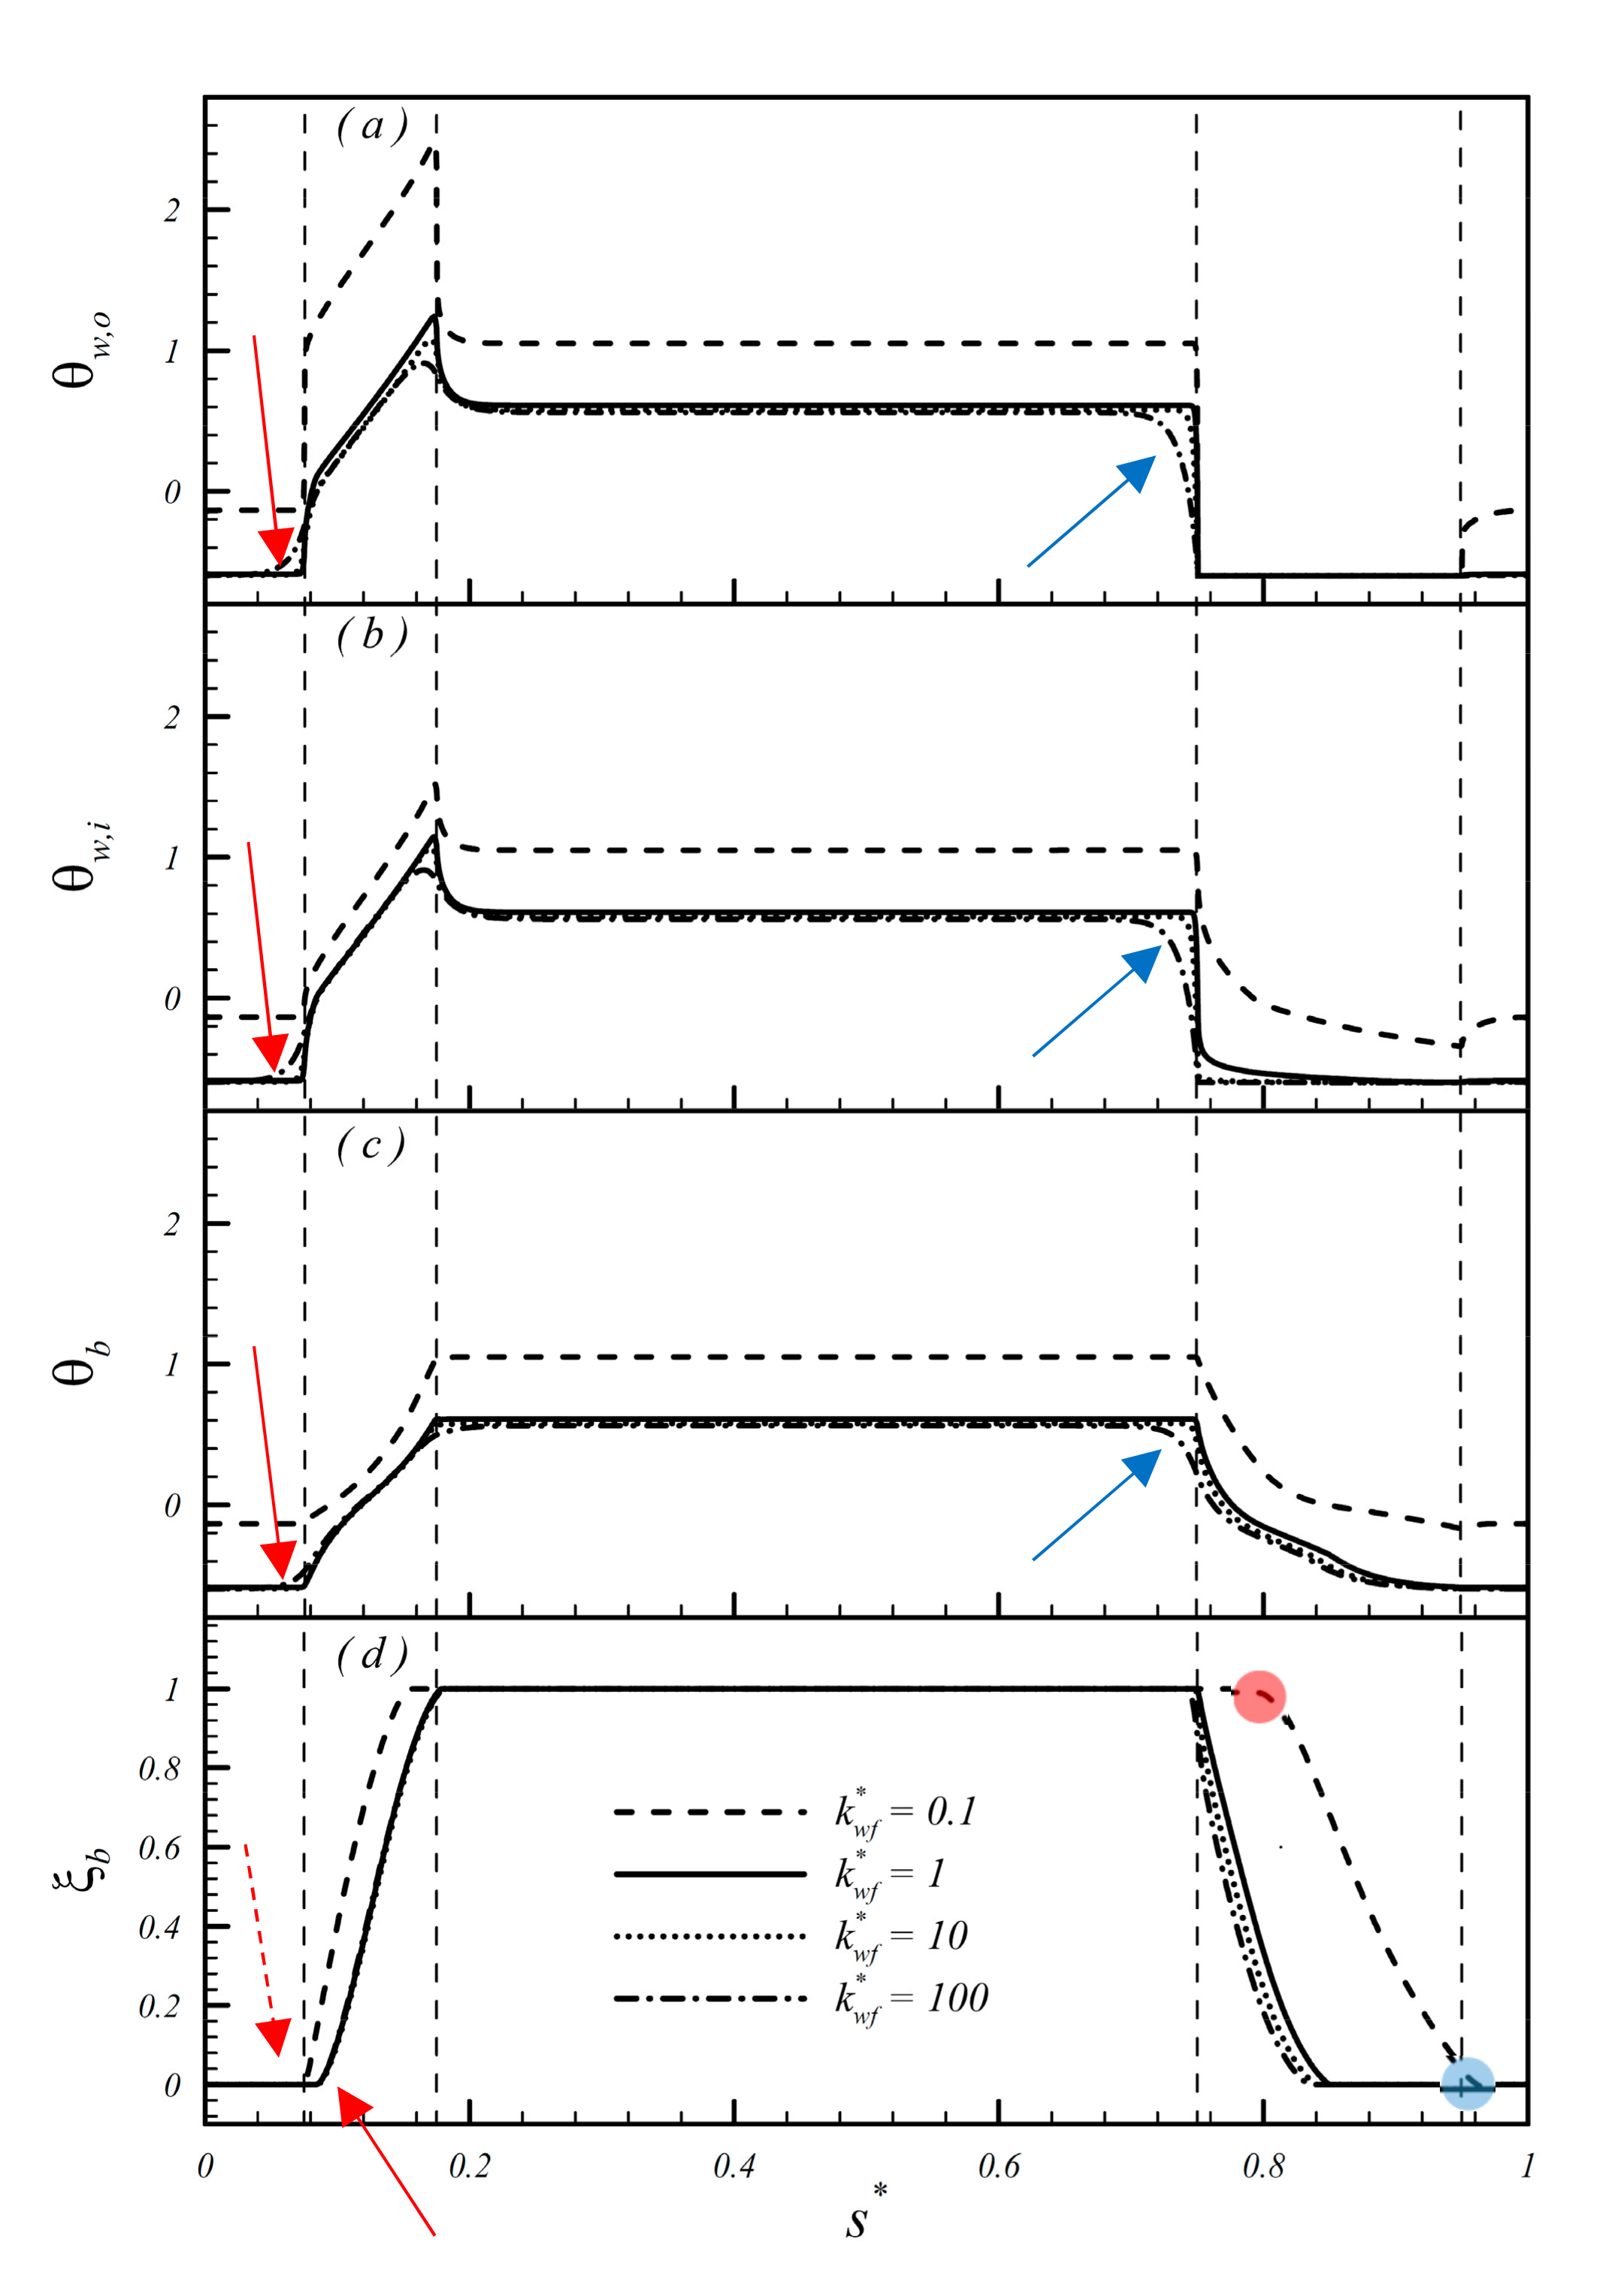
In this paper, the thermal-conductivity ratio of the pipe wall k w f * = k w / k f is defined as the ratio of the wall’s heat conductivity to that of the pure fluid (water), and reflects the heat-conduction capability of the wall. Figure 4 shows the effects of k w f * on the loop heat-transfer characteristics for fixed wall thickness ( t w = 0.1). The smaller that k w f * was, the higher the thermal resistance of the pipe wall was, and the higher the wall temperature was. However, a large k w f * increased the heat transfer of the pipe wall, which caused preheating or precooling of the walls of the adiabatic sections near the heating and cooling sections, respectively. For k w f * = 0.1–10, the temperature at each point near the heating section remained unchanged (starting from s * = 0). However, for k w f * = 100, the effect of the heating section caused axial heat transfer to increase the temperature at each point before the heating section, as shown by the red arrow. Similarly, the points after the adiabatic section before the cooling section were precooled, and the temperature of each point decreased, as shown by the blue arrow.
ξ b distribution shows that, for k w f * = 0.1 ,   t w = 0.1 , the fluid was overheated upon leaving the adiabatic section and entering the cooling section. The fluid could only be cooled to melting point for PCM solidification T M after passing approximately 1/3 of the cooling section (as shown by the red circle in Figure 4d), leading to ξ b < 1 (where fluid temperature = T M , θ b = 0 ). After the fluid left the cooling section and entered the adiabatic section, the PCM could completely solidify, leading to ξ b = 0 (as indicated by the blue circle). Compared with other cases (as shown by the solid red arrow), the lack of supercooling for k w f * = 0.1 ,     t w = 0.1 facilitated early PCM melting in the heating section (as indicated by the dotted red arrow). The rapid completion of the melting process resulted in ξ b = 1. For k w f * = 0.1 ,     t w = 0.2–0.5 (i.e., a slightly thicker pipe with poor thermal conductivity), ξ b = 1 in all the parts of the loop, showing the utilization of latent heat in the loop (Please also refer to Figure 5a, ( Φ h * ) l a t = 0: yellow area).
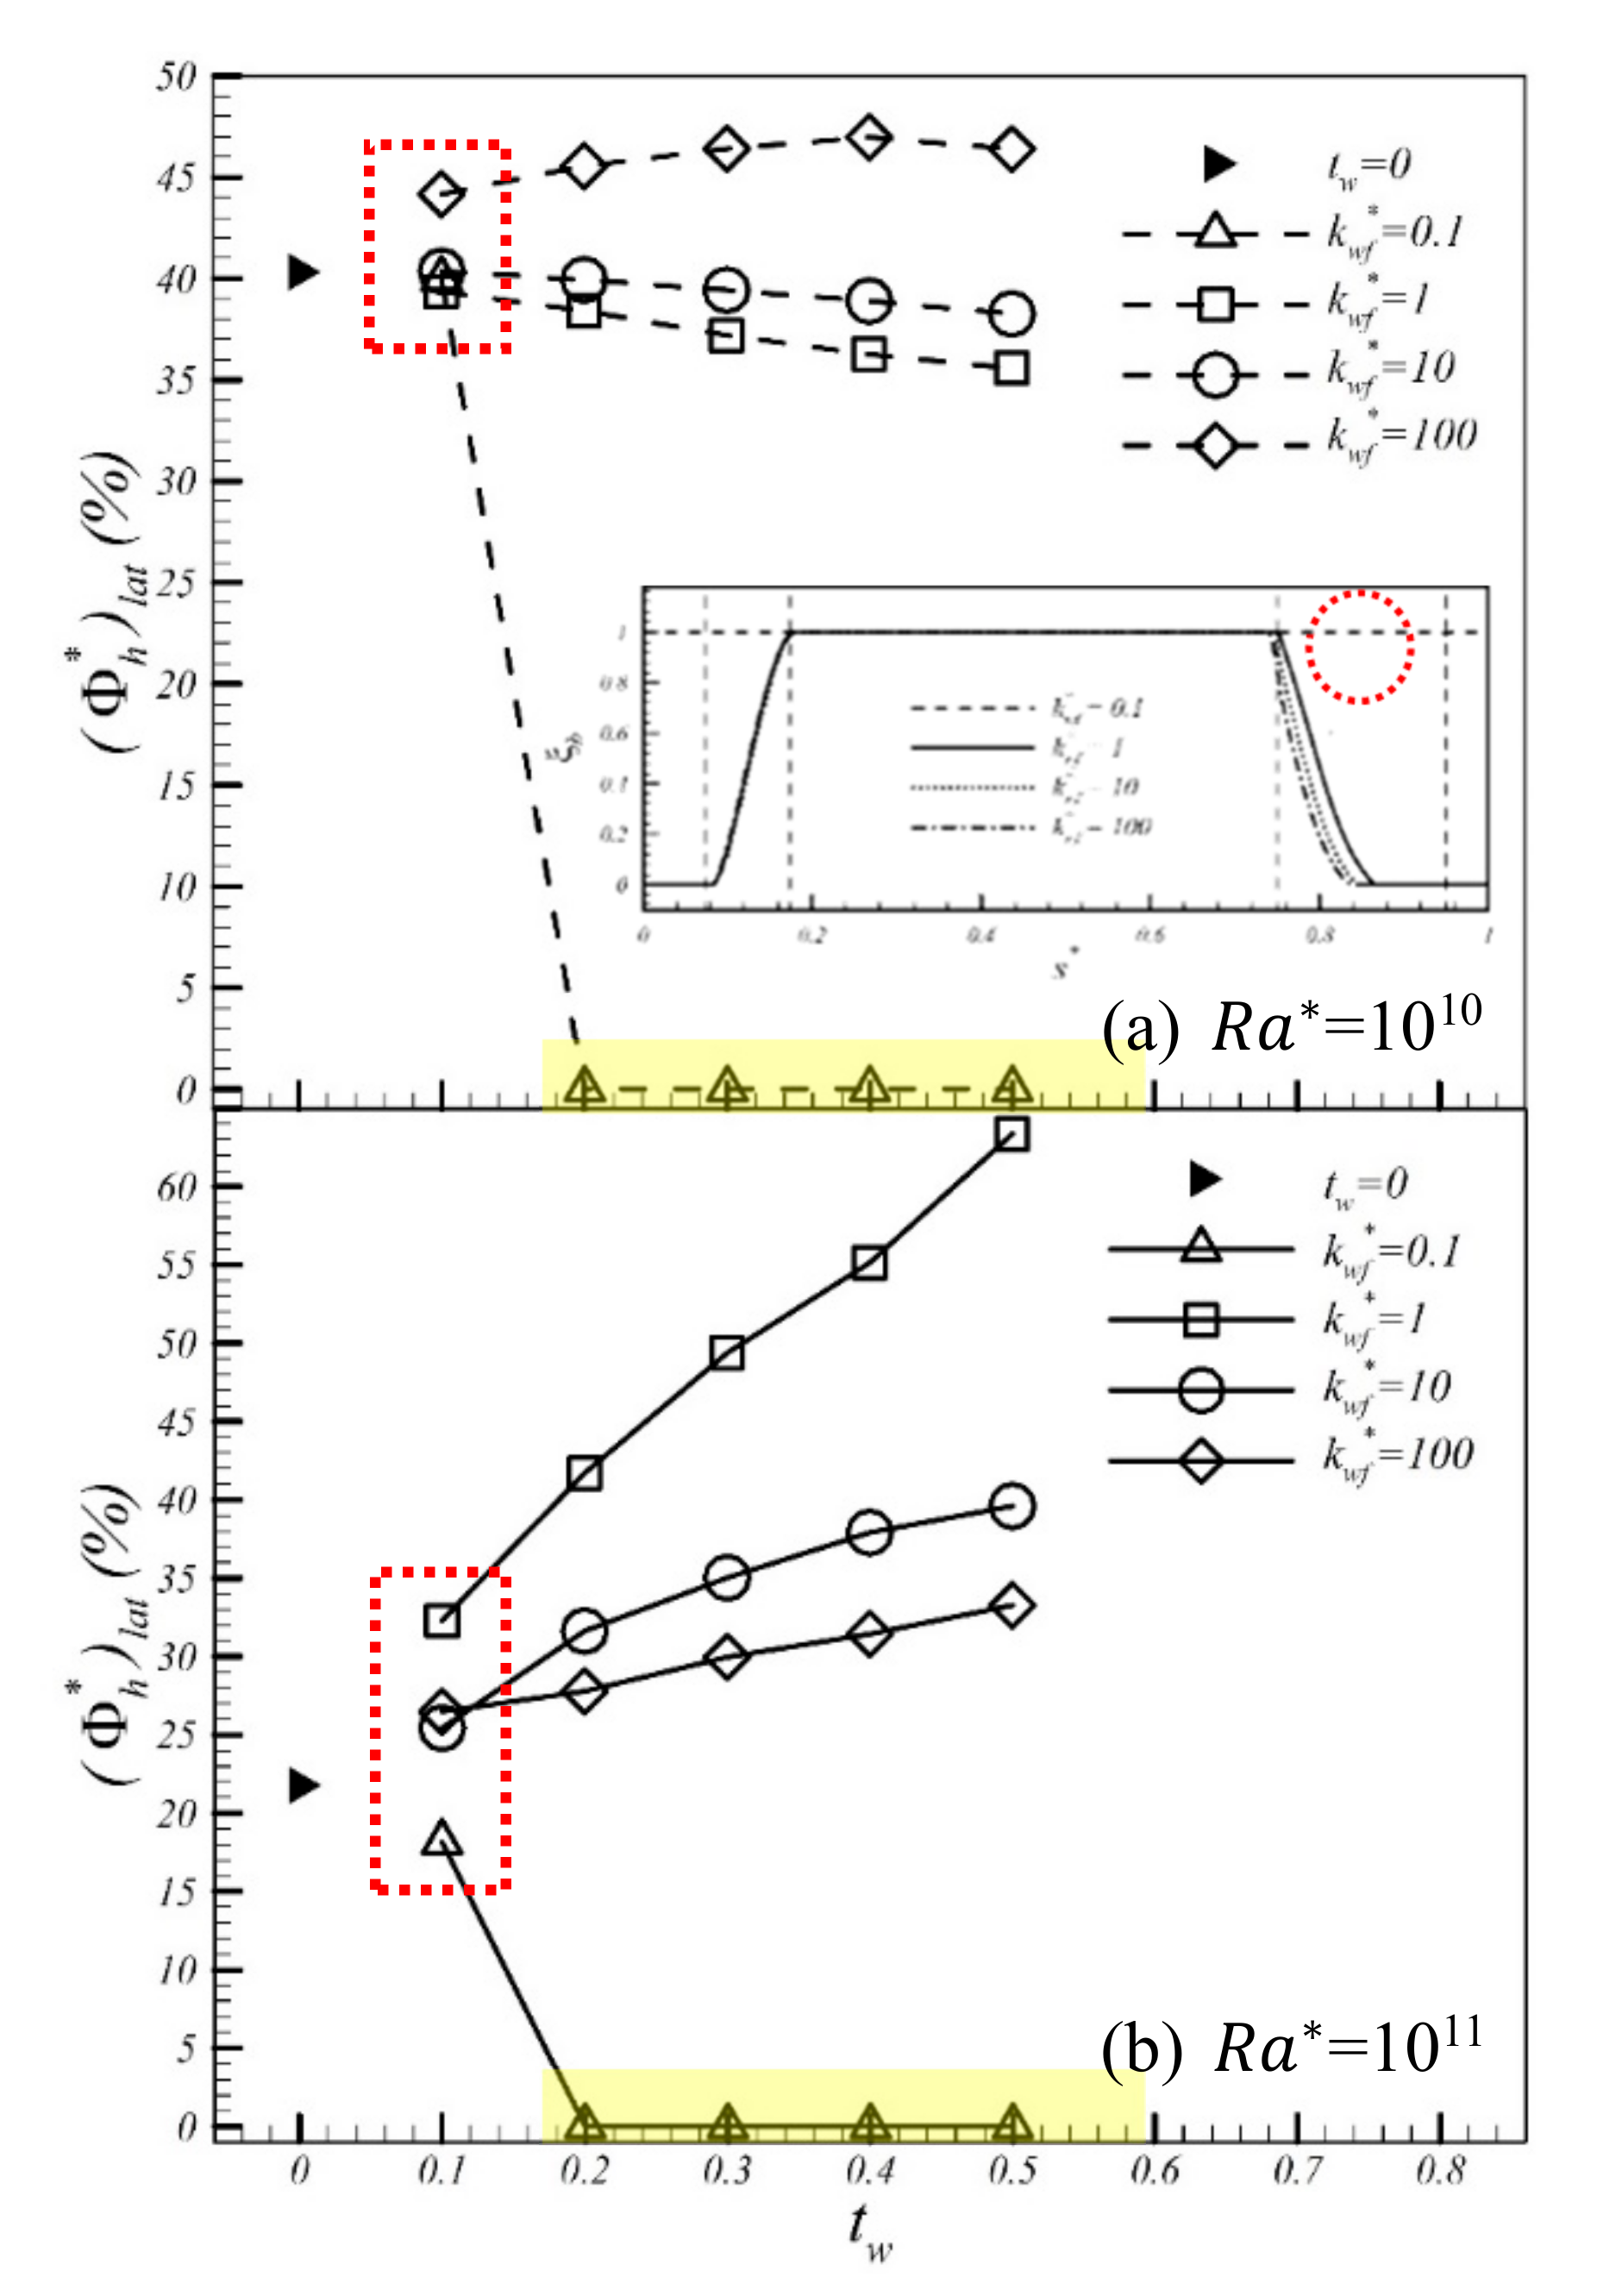
Figure 5 shows latent heat contribution versus wall thickness, where ( Φ h * ) l a t represents latent heat contribution to the overall heat transfer of the heating section ( = ( q h * ) l a t / q h * ). For R a * = 1010 (Figure 5a), increasing the wall thickness from theoretical condition t w = 0 (shown by ▶ in the figure) to t w = 0.1 did not result in significant change in ( Φ h * ) l a t (as indicated by the area enclosed by the dotted red line), because the final wall thickness was not large. However, increasing wall thickness affected ( Φ h * ) l a t differently for different pipe-wall materials (corresponding to different thermal-conductivity levels). For k w f * = 0.1, t w 0.2 , loop wall temperature was too high because the wall had low thermal conductivity and was relatively thick. Thus, the PCM particles did not solidify in the cooling section (as indicated by the dotted red circle in the insert of Figure 5a), and latent heat did not play a role in the heating section. For k w f * = 100 , increasing wall thickness (0.1–0.5) increased ( Φ h * ) l a t in the heating section, effectively using latent heat. Figure 5b shows that, for k w f * = 0.1, t w 0.2 , the R a * = 1011 and R a * = 10 10 cases were similar, and latent heat was not utilized. For k w f * 1 , increasing wall thickness (0.1–0.5) increased ( Φ h * ) l a t in the heating section, and latent PCM heat was effectively utilized.
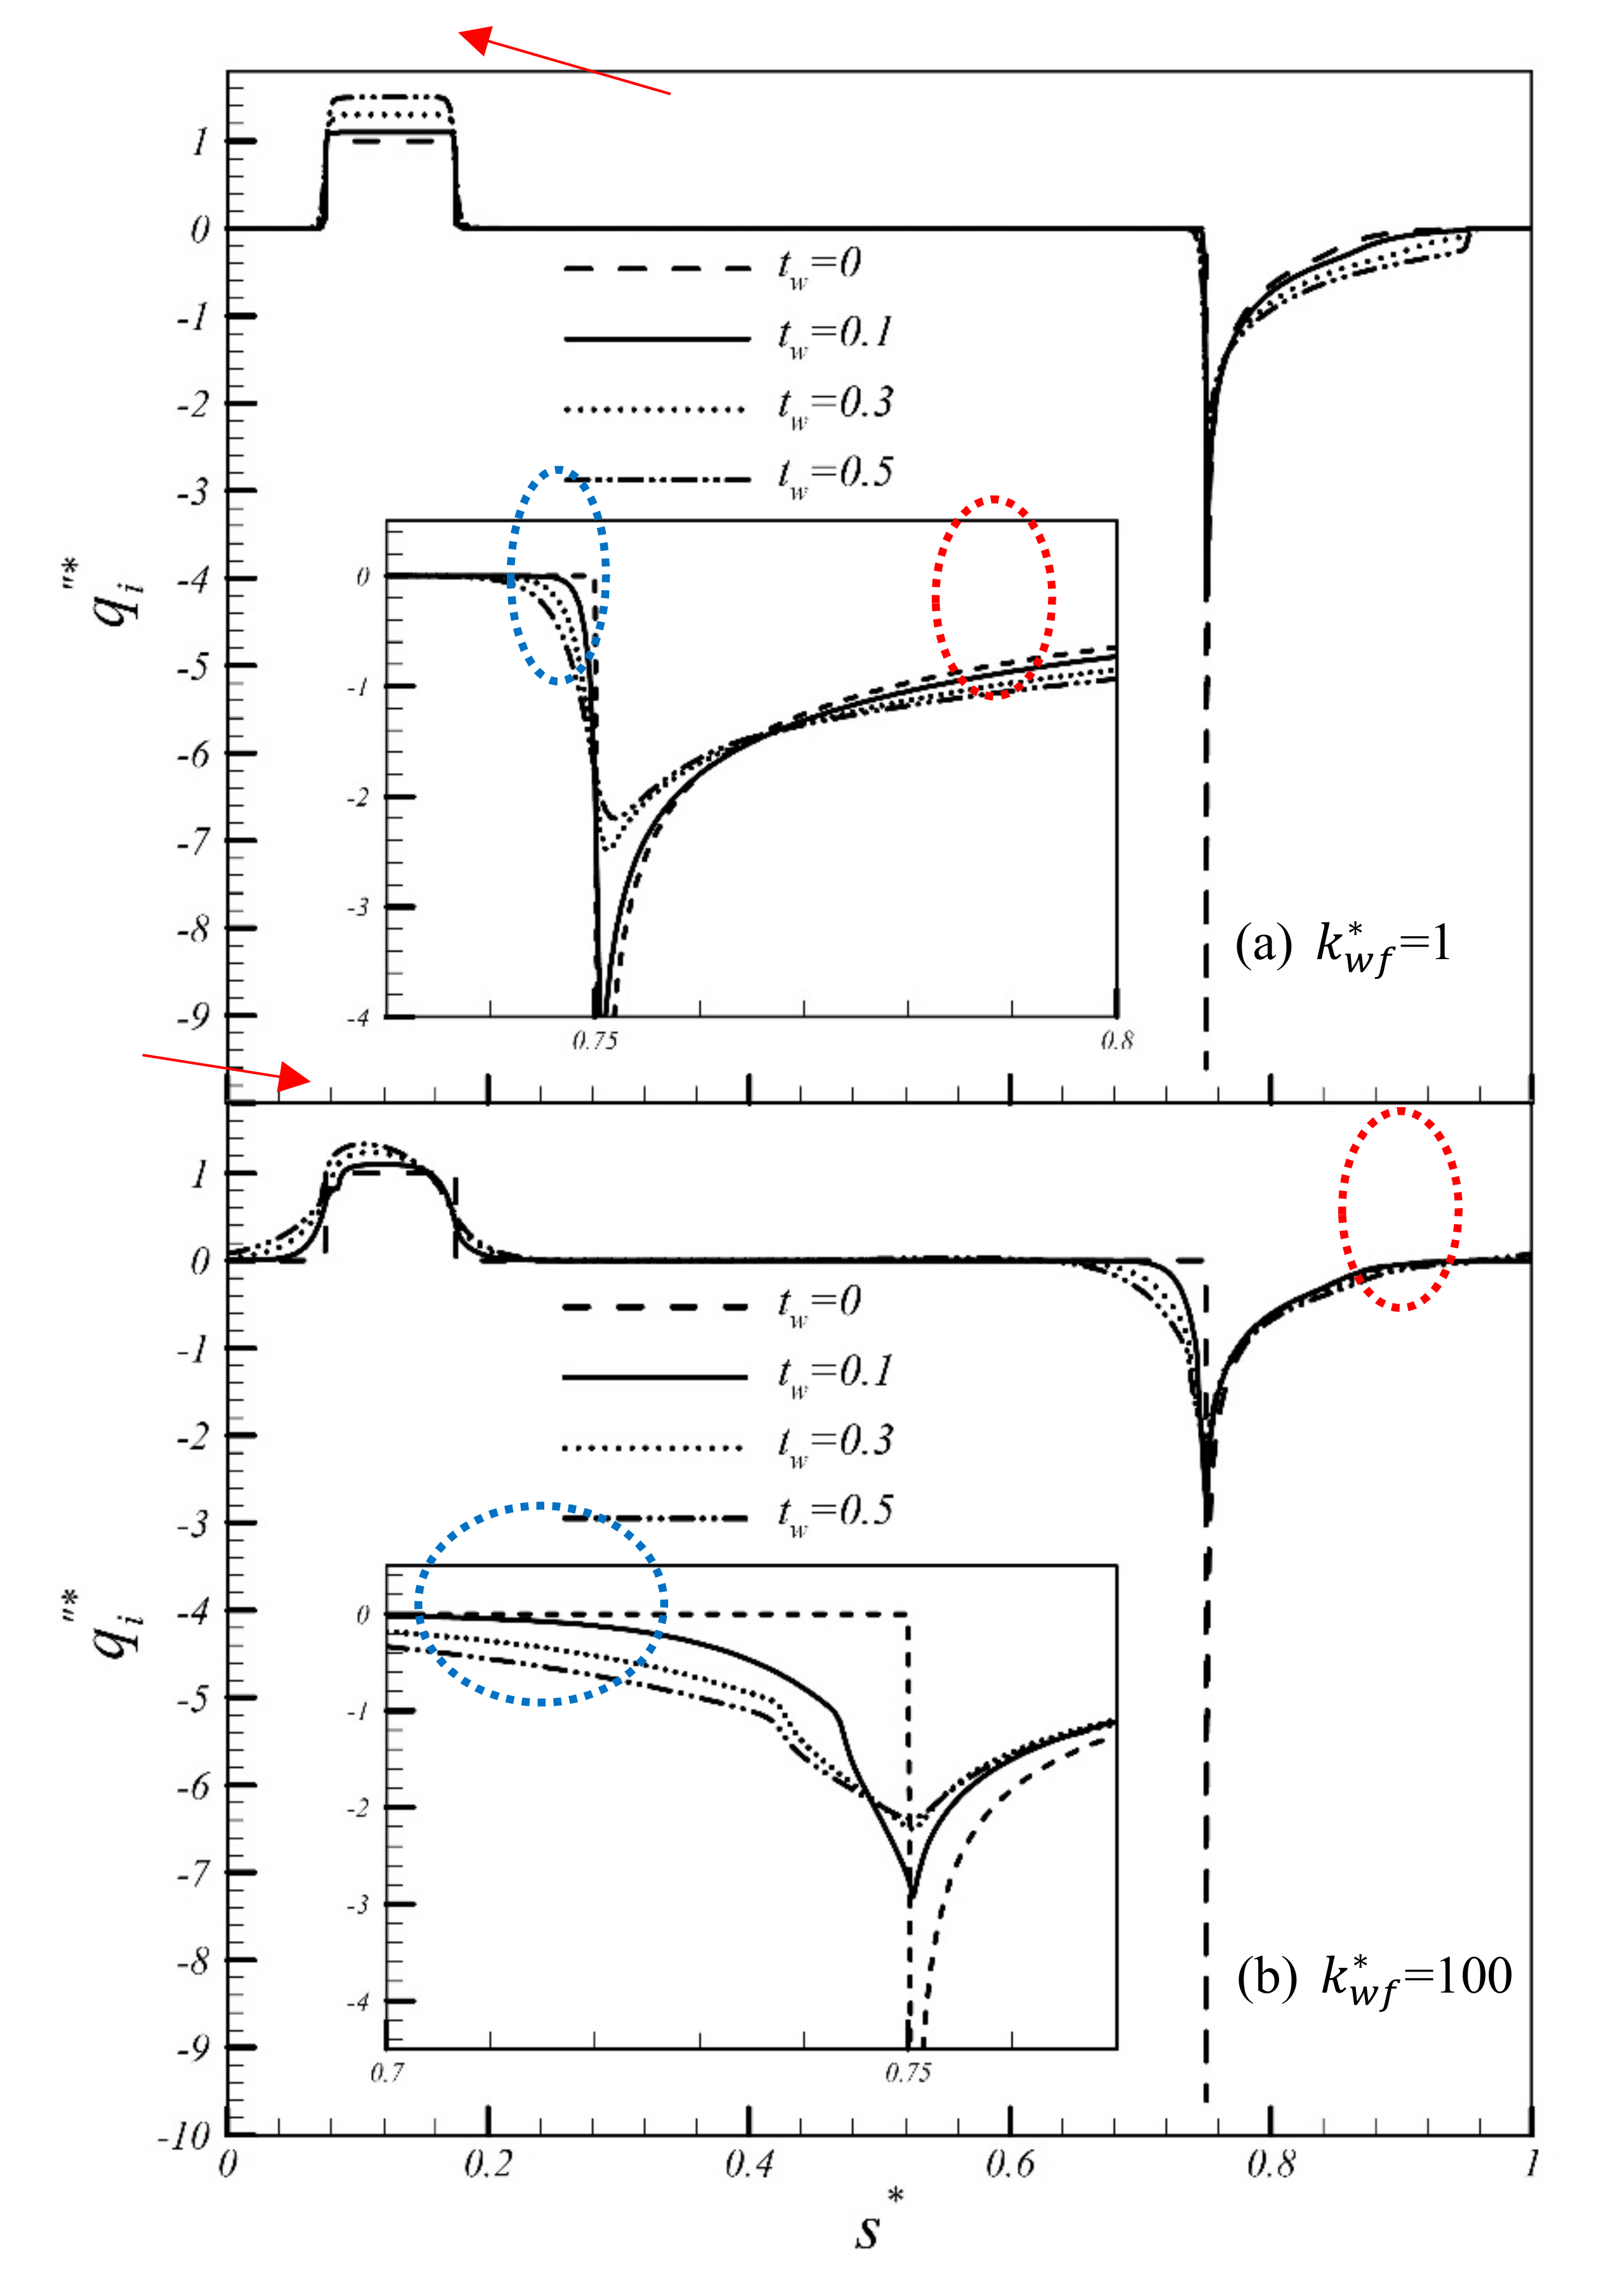
Figure 6 shows that, the thicker the pipe wall was, the higher the heat flux in the heating section was, as shown by the red arrow. At the entrance to the cooling section, the thicker the pipe wall was, the lower the maximal heat flux was, which reduced the peak heat flux (yellow area). However, the thicker wall also increased the heat flux in the cooling section outside the above-mentioned (dotted-red) area. For a relatively large k w f s, the heat-flux curve was modified earlier because of preheating the heating section and precooling the cooling section, as shown by the dotted blue area. This precooling phenomenon was more marked for k w f = 100 (Figure 6b).
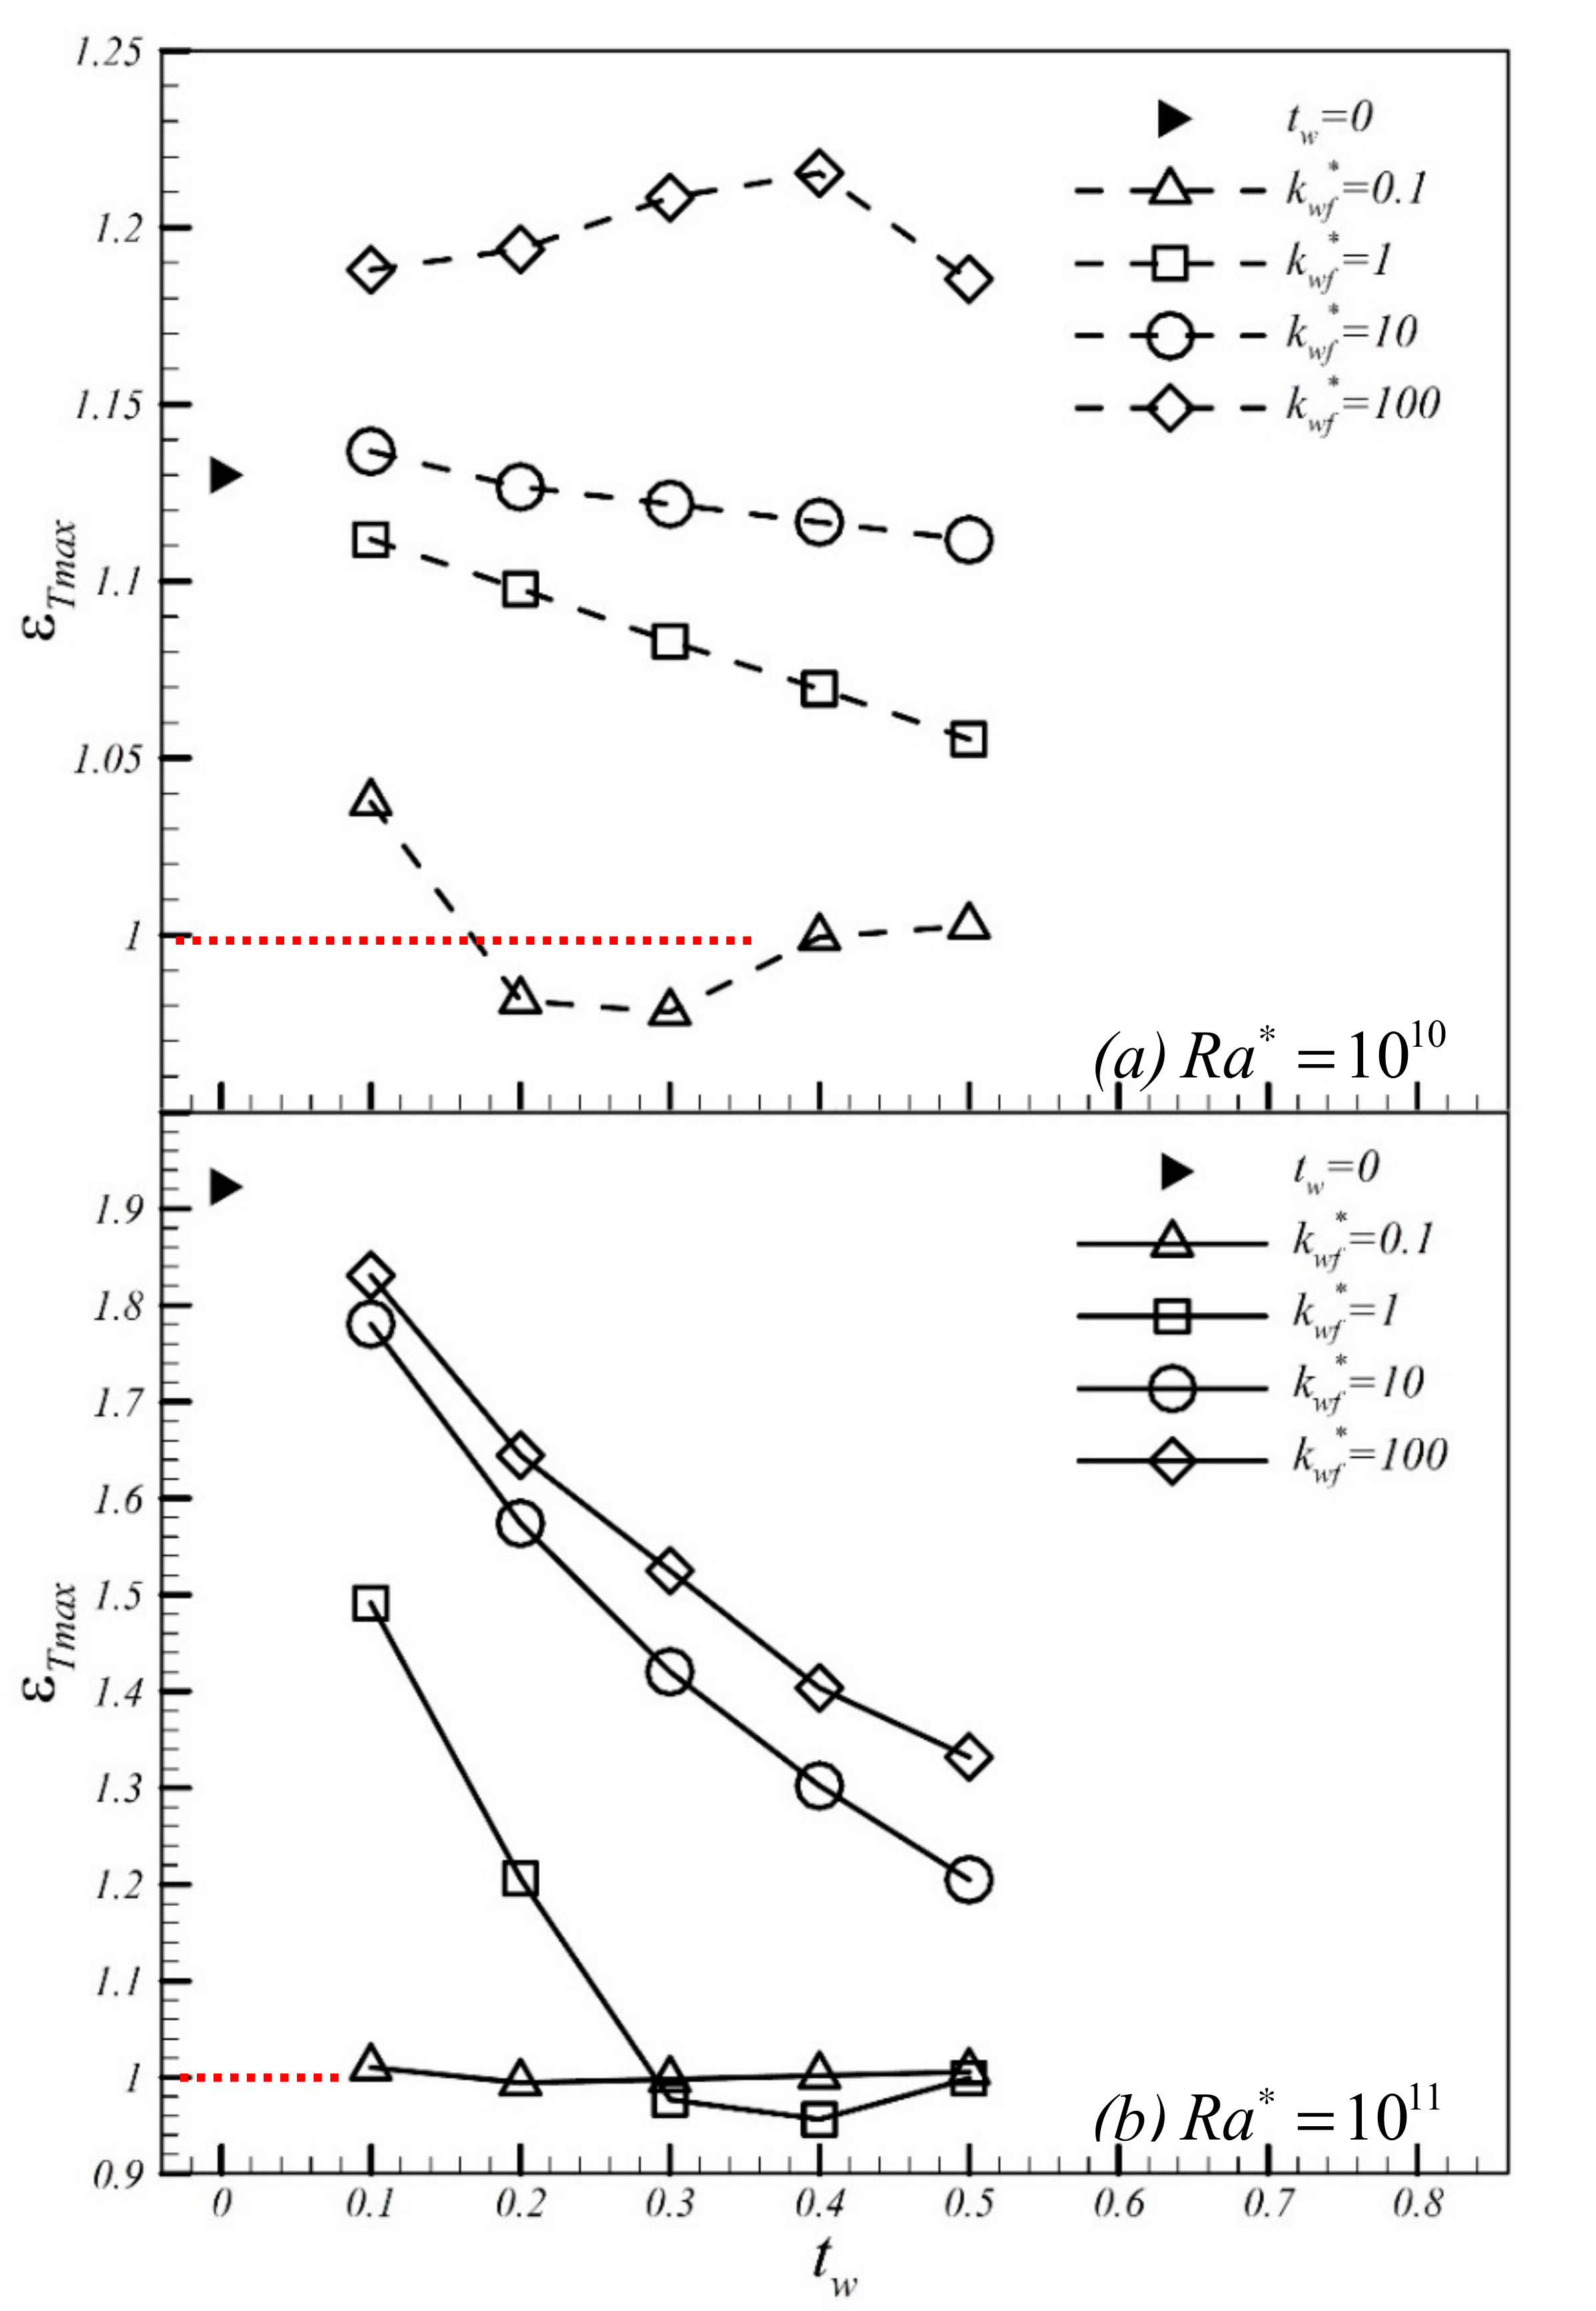
Figure 7 shows the ε T max of the heating section versus t w , where ε T max , defined in Equation (16), represents the effectiveness of the maximal temperature control for the heating section. A high ε T max shows low maximal wall temperature in the heating section. In Figure 7a, for R a = 10 10 , ε T max increased with k w f . ε T max was higher than the theoretical value ( t w = 0; shown by ▶) for the following cases: k w f = 10, t w = 0.1 and k w f = 100, t w = 0.1–0.5. The highest ε T max of 1.21 was obtained for k w f = 100, t w = 0.4. On the basis of the design parameters provided here ( k w f = 100, t w = 0.4), an optimized practical system could be designed and manufactured by readers. Figure 7b shows that, for R a = 10 11 , thinner walls and higher k w f s increased ε T max in the heating section, where the highest ε T max of 1.92 was obtained for t w = 0, a theoretical condition. In this case, the optimized design parameters ( k w f and t w ) are not possible; however, using a thicker pipe with a high thermal conductivity is recommended. For k w f = 100, t w = 0.1, ε T max = 1.83, which represented a reduction of only 4.8% with respect to the highest theoretical ε T max (1.92).
When water was used as the working fluid, ε T max = 1 in the loop (dotted red line in Figure 7). The working fluid was changed from pure water to a 10% PCM suspension (by volume fraction of PCM particles), and the simulations were again performed using the same parameter values. For R a = 10 10 , the pipe with k w f 1 enhanced temperature-control effectiveness (indicated by ε T max ) in the heating section: for k w f = 100, t w = 0.4, ε T max was enhanced by up to 21.5% over that of pure water. For R a = 10 11 and a thin pipe ( t w 0.2 ), k w f 1 enhanced temperature-control effectiveness in the heating section, whereas for a thick pipe ( t w > 0.2 ), k w f 10 , i.e., high thermal conductivity, is recommended.

5. Conclusions

In our previous study, the following geometric configuration was found to maximize the heat-transfer efficiency of a heating section: loop aspect ratio = 1, dimensionless heating-section length = 0.4, and dimensionless relative elevation between cooling and heating sections = 0.75. In this study, this configuration was used for a rectangular thermosiphon containing PCM suspensions to investigate the effects of the wall properties (thickness and thermal conductivity) on heat transfer.
Results showed that selecting a pipe with appropriate wall thickness and thermal conductivity improved temperature control in the heating section for rectangular thermosiphons containing PCM suspensions. For preselected parameters S b * = 0.6, S t e * = 0.1, c v =10%, and R a = 10 10 , temperature control in the heating section was improved using a pipe with a high thermal conductivity: the highest ε T max (effectiveness of maximal temperature control) of 1.21 was obtained for k w f = 100, t w = 0.4, which was 7.5% higher than that for the theoretical condition ( t w = 0). Using a 10% PCM suspension (by volume fraction) as the working fluid increased ε T max for the heating section by 21.5% over that of pure water.
For R a = 10 11 , using a thin pipe with a high thermal conductivity increased the ε T max of the heating section. For example, for k w f = 100, t w = 0.1, ε T max = 1.83, which represented a reduction of only 4.8% compared to the highest ε T max of 1.92 obtained for t w = 0. Using a 10% PCM suspension as the working fluid increased ε T max of the heating section by 83% compared with using pure water.

Author Contributions

C.-J.H. and C.-M.L. conceived and designed the model; C.-J.H. and S.-M.L. performed the simulation works; C.-J.H., S.-M.L. and R.-H.C. analyzed the data; and C.-J.H. and C.-M.L. wrote the paper. All authors have read and agreed to the published version of the manuscript.

Funding

This study is supported by the Ministry of Sciences and Technologies (MOST) of ROC in Taiwan through project no. NSC94-2212-E006-015.

Conflicts of Interest

The authors declare no conflict of interest.

Nomenclature

ARaspect ratio of rectangular loop, l H + / l V +
BipBiot number of a PCM particle, k f k p 2 ( 1 c v ) ( 2 3 c v 1 / 2 + c v )
c p specific heat
c v volumetric fraction of PCM particles
gacceleration due to gravity
h l s latent heat of fusion
kthermal conductivity
k b f * thermal-conductivity ratio, k b / k f
k p f * thermal-conductivity ratio, k p / k f
k w f * thermal-conductivity ratio, k w / k f
l a + length of left and right adiabatic sections of lower leg of loop
l a dimensionless length of left and right adiabatic sections of lower leg of loop, l a + / l c +
l c + cooling-section length
l h * dimensionless length of heating section, l h + / l H +
l h + heating-section length
l h dimensionless length of heating section, l h + / l c +
l H + rectangular-loop width
l H dimensionless rectangular-loop width, l H + / l c + or ( 1 + 2 l z ) A R / 2
l L + total length of rectangular loop, 2 ( l V + + l H + )
l L , e f f + correction factor for loop length [29]
l L dimensionless total length of rectangular loop, 2 ( l V + l H ) or ( 1 + 2 l z ) ( 1 + A R )
l V + rectangular-loop height
l V dimensionless height of rectangular loop, l V + / l c + or ( 1 + 2 l z ) / 2
l z + elevation of cooling section relative to heating section
l z dimensionless mean elevation of cooling section relative to heating section, l z + / l c +
q local heat flux
q i local dimensionless heat flux, q i = q i / q h
q h * total convection heat-transfer rate
R L dimensionless pipe radius, r i + / l L +
R a * modified Rayleigh number, ( g β q h " r i + l L + 3 ) / ( α b ν b k b )
r + radial coordinate
r i + inner radius of loop pipe
r 0 + outer radius of loop pipe
r p + PCM particle radius
rdimensionless radial coordinate, r + / r i +
r p dimensionless particle radius, r p + / r i +
s + axial coordinate
sdimensionless axial coordinate, s + / l c +
s modified dimensionless axial coordinate, s + / l L +
Sb*modified subcooling factor, ( T M T c ) / ( q h r i + / k b )
Ste*modified Stefan number, c p , b ( q h r i + / k b ) / h l s
t w + pipe-wall thickness ( r o + r i + )
t w dimensionless pipe-wall thickness (= t w + / r i + )
Ttemperature
u + axial velocity
udimensionless axial velocity, u + / ( R a * 1 / 4 α b / r i + )
Greek symbols
αthermal diffusivity
β thermal-expansion coefficient
ε T max effectiveness of maximal wall temperature control, ( T w , h , max , f T M ) / ( T w , h , max , b T M ) or ( θ w , h , max , f / θ w , h , max , b ) ( k b f * )
γ L correction factor for loop length, l L , e f f + / l L +
νkinematic viscosity
θdimensionless temperature, ( T T M ) / ( q h r i + / k b )
ρdensity
ρ b f * base fluid-density ratio, ρ b / ρ f
ρ p f * particle-density ratio, ρ p / ρ f
ξ b mean liquid fraction of PCM suspension
ξ liquid-phase volume fraction of PCM particles
Φ latent-heat contribution
Subscripts
bbulk fluid
bfbulk-to-base-fluid ratio
ccooling section
fbase fluid (water)
hheating section
iinner
PCM liquid phase
latlatent heat
Mmelting point
maxmaximum
pparticle
pfparticle-to-base-fluid ratio
sensensible heat
wpipe wall
wfpipe-wall-to-base-fluid ratio
Superscripts
*ratio of quantities
+dimensional quantity

References

  1. Basu, D.N.; Bhattacharyya, S.; Das, P.K. A review of modern advances in analyses and applications of single-phase natural circulation loop in nuclear thermal hydraulics. Nucl. Eng. Des. 2014, 280, 326–348. [Google Scholar] [CrossRef]
  2. Lokhmanets, I.; Baliga, B.R. Experimental investigation of steady and transient operations of a single-phase closed-loop vertical thermosyphon. Int. J. Therm. Sci. 2019, 145, 105988. [Google Scholar] [CrossRef]
  3. Tian, C.; Yan, M.; Wang, J.; Cao, X.; Yan, C.; Yu, S. Experimental investigation of flow and heat transfer for natural circulation flow in an inclined narrow rectangular channel. Prog. Nucl. Energy 2017, 98, 266–276. [Google Scholar] [CrossRef]
  4. Wang, S.; Yang, B.W.; Zhou, Z.; Long, J. Review on thermal-hydraulic characteristics of nuclear reactors under ocean conditions. Nucl. Sci. Eng. 2019, 193, 14–32. [Google Scholar] [CrossRef]
  5. Ebeling, J.C.; Luo, X.; Kabelac, S.; Luckmann, S.; Kruse, H. Dynamic simulation and experimental validation of a two-phase closed thermosyphon for geothermal application. Propuls. Power Res. 2017, 6, 107–116. [Google Scholar] [CrossRef] [Green Version]
  6. Celik, S.; Ekren, O. Two-phase refrigerant flow in the evaporator of a stirling cooling system with a thermosyphon loop. Exp. Heat Transf. 2019, 1–13. [Google Scholar] [CrossRef]
  7. Lamaison, N.; Ong, C.L.; Marcinichen, J.B.; Thome, J.R. Two-phase mini-thermosyphon electronics cooling: dynamic modeling, experimental validation and application to 2U servers. Appl. Therm. Eng. 2017, 110, 481–494. [Google Scholar] [CrossRef]
  8. Krishnan, V.; Sharma, M.; Pilkhwal, D.; Saha, D.; Sinha, R. A comparative study of single-phase, two-phase, and supercritical natural circulation in a rectangular loop. J. Eng. Gas Turbines Power 2010, 132, 102913. [Google Scholar] [CrossRef]
  9. Delgado, M.; Lázaro, A.; Mazo, J.; Zalba, B. Review on phase change material emulsions and microencapsulated phase change material slurries: materials, heat transfer studies and applications. Renew. Sustain. Energy Rev. 2012, 16, 253–273. [Google Scholar] [CrossRef]
  10. Buschmann, M.H. Nanofluids in thermosyphons and heat pipes: overview of recent experiments and modelling approaches. Int. J. Therm. Sci. 2013, 72, 1–17. [Google Scholar] [CrossRef]
  11. Cho, H.J.; Preston, D.J.; Zhu, Y.; Wang, E.N. Nanoengineered materials for liquid–vapour phase-change heat transfer. Nat. Rev. Mater. 2017, 2, 16092. [Google Scholar] [CrossRef]
  12. Liu, Z.; Preston, D.J. Enhanced Condensation for Improved Energy Efficiency. Joule 2019, 3, 1180–1189. [Google Scholar] [CrossRef]
  13. Srimuang, W.; Amatachaya, P. A review of the applications of heat pipe heat exchangers for heat recovery. Renew. Sust. Energ. Rev. 2012, 16, 4303–4315. [Google Scholar] [CrossRef]
  14. Barber, J.; Brutin, D.; Tadrist, L. A review on boiling heat transfer enhancement with nanofluids. Nanoscale Res. Lett. 2011, 6, 280. [Google Scholar] [CrossRef] [PubMed] [Green Version]
  15. Zalba, B.; Marin, J.; Cabeza, L.F.; Mehling, H. Review on thermal energy storage with phase change: materials, heat transfer analysis and applications. Appl. Therm. Eng. 2003, 23, 251–283. [Google Scholar] [CrossRef]
  16. Khan, Z.; Khan, Z.; Ghafoor, A. A review of performance enhancement of PCM based latent heat storage system within the context of materials, thermal stability and compatibility. Energy Convers. Manag. 2016, 115, 132–158. [Google Scholar] [CrossRef]
  17. Attinger, D.; Frankiewicz, C.; Betz, A.R.; Schutzius, T.M.; Ganguly, R.; Das, A.; Kim, C.J.; Megaridis, C.M. Surface engineering for phase change heat transfer: A review. MRS Energy Sustain. 2014, 1–40. [Google Scholar] [CrossRef] [Green Version]
  18. Giro-Paloma, J.; Alkan, C.; Chimenos, J.; Fernández, A. Comparison of microencapsulated phase change materials prepared at laboratory containing the same core and different shell material. Appl. Sci. 2017, 7, 723. [Google Scholar] [CrossRef] [Green Version]
  19. Yang, L.; Liu, S.; Zheng, H. A comprehensive review of hydrodynamic mechanisms and heat transfer characteristics for microencapsulated phase change slurry (MPCS) in circular tube. Renew. Sustain. Energy Rev. 2019, 114, 109312. [Google Scholar] [CrossRef]
  20. Peng, G.; Dou, G.; Hu, Y.; Sun, Y.; Chen, Z. Phase change material (PCM) microcapsules for thermal energy storage. Adv. Polym. Technol. 2020, 2020, 1–20. [Google Scholar] [CrossRef]
  21. Zhu, C.; Lin, Y.; Fang, G. Preparation and thermal properties of microencapsulated stearyl alcohol with silicon dioxide shell as thermal energy storage materials. Appl. Therm. Eng. 2020, 169, 114943. [Google Scholar] [CrossRef]
  22. Zhang, X.; Wu, J.Y.; Niu, J. PCM-in-water emulsion for solar thermal applications: the effects of emulsifiers and emulsification conditions on thermal performance, stability and rheology characteristics. Sol. Energy Mater. Sol. Cells 2016, 147, 211–224. [Google Scholar] [CrossRef]
  23. Cabaleiro, D.; Agresti, F.; Barison, S.; Marcos, M.A.; Prado, J.I.; Rossi, S.; Bobbo, S.; Fedele, L. Development of paraffinic phase change material nanoemulsions for thermal energy storage and transport in low-temperature applications. Appl. Therm. Eng. 2019, 159, 113868. [Google Scholar] [CrossRef]
  24. Dammel, F.; Stephan, P. Heat transfer to suspensions of microencapsulated phase change material flowing through minichannels. J. Heat Transf. 2012, 134, 020907. [Google Scholar] [CrossRef]
  25. Ho, C.J.; Lee, C.Y.; Yamada, M. Experiments on laminar cooling characteristics of a phase change nanofluid flow through an iso-flux heated circular tube. Int. J. Heat Mass Transf. 2018, 118, 1307–1315. [Google Scholar] [CrossRef]
  26. Ho, C.J.; Chiu, S.Y.; Lin, J.F. Heat transfer characteristics of a rectangular natural circulation loop containing solid-liquid phase-change material suspensions. Int. J. Numer. Methods Heat Fluid Flow 2005, 15, 441–461. [Google Scholar] [CrossRef]
  27. Ho, C.J.; Chen, C.; Lai, C.M. The effects of geometric parameters on the thermal performance of a rectangular natural circulation loop containing PCM suspensions. Numer. Heat Transf. A: Appl. 2016, 70, 1313–1329. [Google Scholar] [CrossRef]
  28. Ho, C.J.; Wang, Z.C.; Chen, R.H.; Lai, C.M. Conjugate Heat Transfer Analysis of PCM Suspensions in a Circular Tube Under External Cooling Convection: Wall Conduction Effects. Appl. Sci. 2020, 10, 2034. [Google Scholar] [CrossRef] [Green Version]
  29. Huang, B.J.; Zelaya, R. Heat transfer behavior of a rectangular thermosyphon loop. J. Heat Transf. 1988, 110, 487–493. [Google Scholar] [CrossRef]
  30. Ho, C.J. A continuum model for transport phenomena in convective flow of solid–liquid phase change material suspensions. Appl. Math. Model. 2005, 29, 805–817. [Google Scholar] [CrossRef]
  31. Charunyakorn, P.; Sengupta, S.; Roy, S. Forced convection heat transfer in microencapsulated phase change material slurries: flow in circular ducts. Int. J. Heat Mass Transf. 1991, 34, 819–833. [Google Scholar] [CrossRef]
  32. Leonard, B.P. A stable and accurate convective modelling procedure based on quadratic upstream interpolation. Comput. Methods Appl. Mech. Eng. 1979, 19, 59–98. [Google Scholar] [CrossRef]
  33. Metrol, A.; Greif, R.; Zvirin, Y. Two-dimensional study of heat transfer and fluid flow in a natural circulation loop. ASME J. Heat Transf. 1982, 104, 508–514. [Google Scholar] [CrossRef]
  34. Goel, M.; Roy, S.K.; Sengupta, S. Laminar forced conduction heat transfer in micro-capsulated phase change material suspensions. Int. J. Heat Mass Transf. 1994, 37, 593–604. [Google Scholar] [CrossRef] [Green Version]
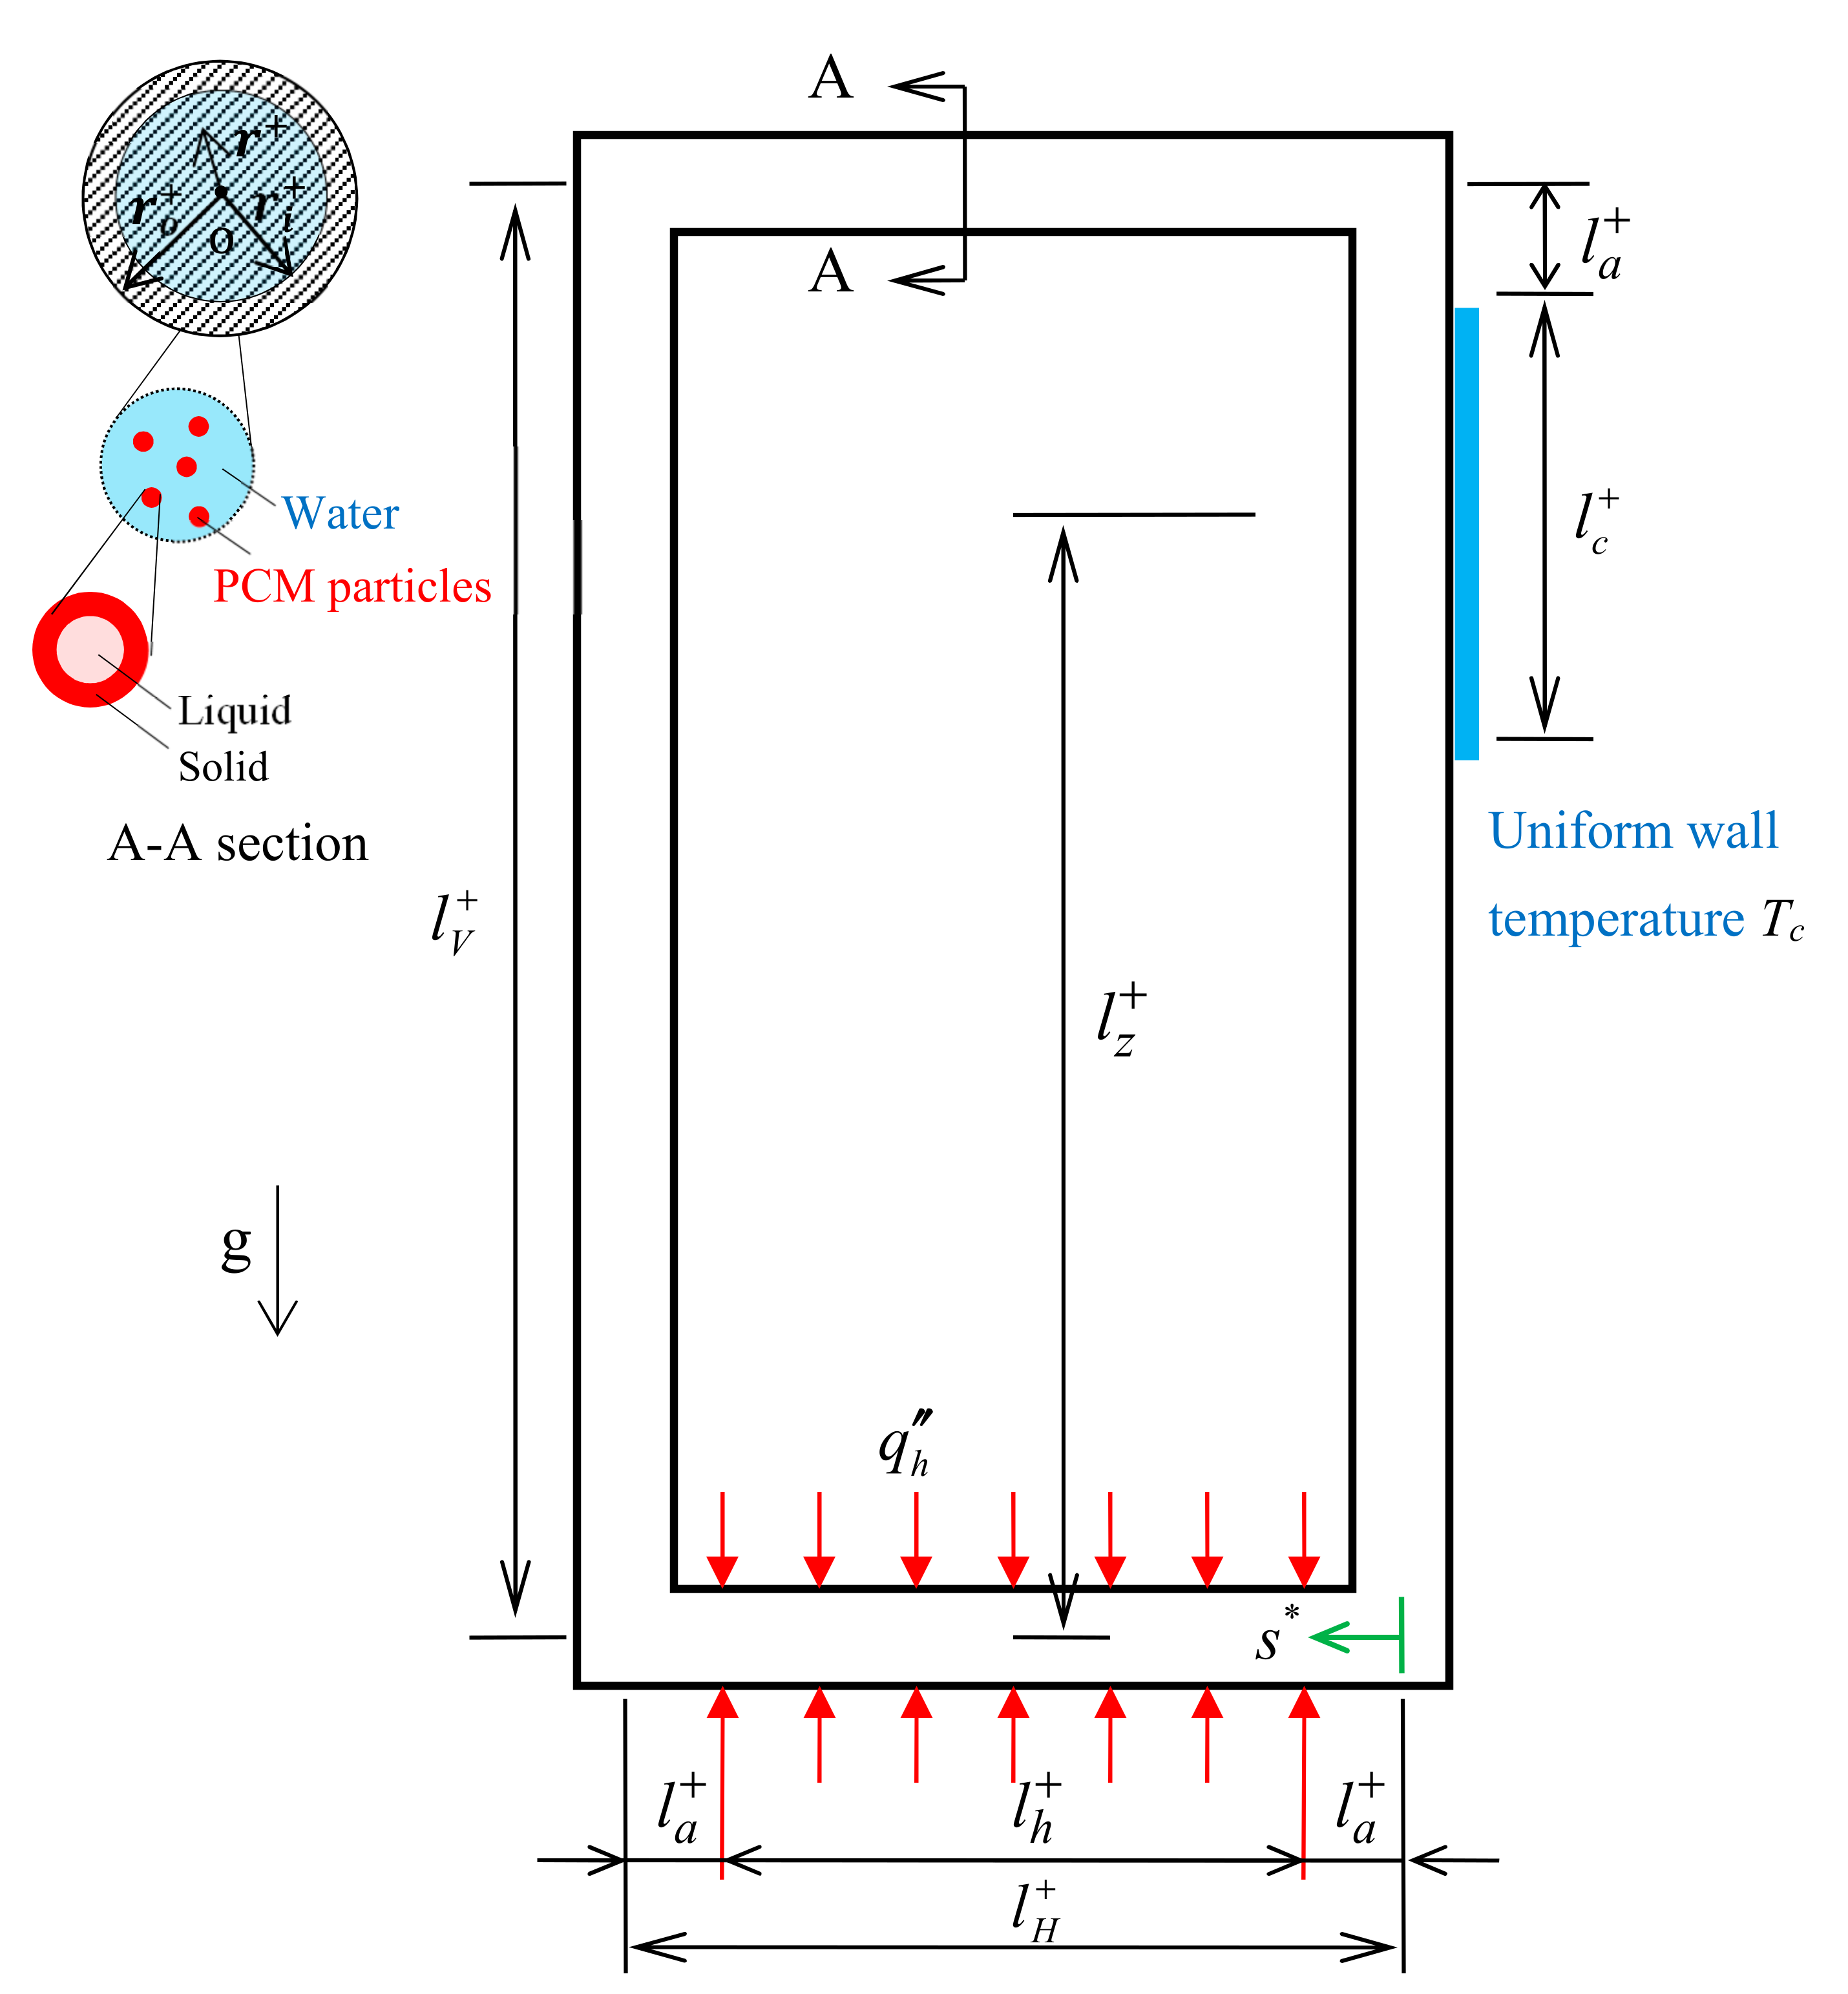
Figure 1. Schematic of rectangular thermosiphon loop and coordinate system.
Applsci 10 06211 g001
Figure 2. Simulation-result comparison with (a) Mertol et al., and(b) Goel et al. [27].
Applsci 10 06211 g002
Figure 3. Axial distributions of different temperature levels (a) θ w , o , (b) θ w , i , and (c) θ b and (d) ξ b for different wall-thickness levels t w (AR = 1, l h * = 0.4, l z = 0.75, S b * = 0.6, S t e * = 0.1, R a * = 1010, c v = 10%, and k w f * = 1.
Applsci 10 06211 g003
Figure 4. Axial distributions of temperatures ((a) θ w , o , (b) θ w , i , (c) θ b ) and (d) ξ b for different k w f * s (AR = 1, l h * = 0.4, l z = 0.75, S b * = 0.6, S t e * = 0.1, R a * = 10 10, c v = 10%, and t w = 0.1).
Applsci 10 06211 g004
Figure 5. Latent-heat contribution of heating section ( Φ h * ) l a t versus wall thickness t w for different k w f * s: (a) R a * = 1010 and (b) R a * = 1011 (AR = 1, l h * = 0.4, l z = 0.75, S b * = 0.6, S t e * = 0.1, and c v = 10%).
Applsci 10 06211 g005
Figure 6. Effect of wall thickness t w on distribution of local dimensionless heat flux q i * for different k w f * s: (a) k w f * = 1 and (b) k w f * = 100 (AR = 1, l h * = 0.4, l z = 0.75, S b * = 0.6, S t e * = 0.1, R a * = 1010, and c v = 10%).
Applsci 10 06211 g006
Figure 7. ε T max of heating section versus t w : (a) R a * = 1010 and (b) R a * = 1011 (AR = 1, l h * = 0.4, l z = 0.75, S b * = 0.6, S t e * = 0.1, and c v = 10%).
Applsci 10 06211 g007