Article

In Vivo Assessment of Water Content, Trans-Epidermial Water Loss and Thickness in Human Facial Skin

1
Sinlen Beauty Clinic, 3 Elm Parade, Main Rd, Sidcup DA14 6NF, UK
2
School of Engineering, London South Bank University, 103 Borough Road, London SE1 0AA, UK
3
Quantitative Recipes, Crown House, 27 Old Gloucester Street, London WC1N 3AX, UK
4
Biox Systems Ltd., Technopark Building, 90 London Road, London SE1 6LN, UK
5
Department of Engineering, Università degli Studi di Perugia, Via Goffredo Duranti 93, 06125 Perugia, Italy
*
Author to whom correspondence should be addressed.
Appl. Sci. 2020, 10(17), 6139; https://doi.org/10.3390/app10176139
Submission received: 30 July 2020 / Revised: 27 August 2020 / Accepted: 1 September 2020 / Published: 3 September 2020
(This article belongs to the Section Applied Biosciences and Bioengineering)

Abstract

:
Mapping facial skin in terms of its biophysical properties plays a fundamental role in many practical applications, including, among others, forensics, medical and beauty treatments, and cosmetic and restorative surgery. In this paper we present an in vivo evaluation of the water content, trans-epidermial water loss and skin thickness in six areas of the human face: cheeks, chin, forehead, lips, neck and nose. The experiments were performed on a population of healthy subjects through innovative sensing devices which enable fast yet accurate evaluations of the above parameters. A statistical analysis was carried out to determine significant differences between the facial areas investigated and clusters of statistically-indistinguishable areas. We found that water content was higher in the cheeks and neck and lower in the lips, whereas trans-epidermal water loss had higher values for the lips and lower ones for the neck. In terms of thickness the dermis exhibited three clusters, which, from thickest to thinnest were: chin and nose, cheek and forehead and lips and neck. The epidermis showed the same three clusters too, but with a different ordering in term of thickness. Finally, the stratum corneum presented two clusters: the thickest, formed by lips and neck, and the thinnest, formed by all the remaining areas. The results of this investigation can provide valuable guidelines for the evaluation of skin moisturisers and other cosmetic products, and can help guide choices in re-constructive/cosmetic surgery.

1. Introduction

The skin is the largest organ in humans and its primary functions are: protecting the body against external agents (such as micro-organisms, ultraviolet radiation, chemicals and physical insults); maintaining homoeostasis by preventing dehydration and regulating temperature; and enabling tactile feedback by sensing pain and pleasant stimuli [1,2,3]. At the macroscopic level the main biophysical characteristics of skin are: water content, thickness, trans-epidermal water loss (TEWL), sebum production, surface pH, melanin index and desquamation [2,4,5]. These properties vary significantly depending on the body part. Knowing such variations is important for many practical applications: medical and beauty treatments, for instance, need to adapt to different skin characteristics; likewise, the ability to identify skin location by its properties can be useful in other areas such as forensic analysis. Certain parameters, for instance, thickness, are important for surgical intervention as they may guide skin resection and restoration procedures.
In the present work we performed an in vivo evaluation of the distribution of water content, TEWL and skin thickness in six facial areas: cheeks, chin, forehead, lips, neck and nose. Water content and TEWL can be regarded, respectively, as the "stock" and "flow" of water in the human skin. The first (also referred to as "hydration") is crucial to maintaining the correct metabolism of the skin. When the amount of water drops below a critical threshold the enzymatic processes can no longer occur properly, resulting in visible changes like dryness, roughens and flaking [6,7]. Trans-epidermal water loss is the flow of water that leaves the body through the skin. It is the most widely used parameter for assessing the skin barrier function [8] and is a good indicator of pathological conditions, such as irritation, atopic eczema, contact dermatitis and psoriasis [2,8,9]. As for skin thickness, we investigated the distribution of this parameter for each of the following layers: stratum corneum (SC), epidermis and dermis.
The main aim of this work was determining whether the distributions of water content, TEWL and skin thickness are significantly different among the six facial areas investigated, and, conversely, whether there are groups of facial sites (clusters) that are statistically undistinguishable in terms of the parameters considered. The contributions of this paper to the literature are therefore various. On the one hand, we carried out the experiments using innovative measurement devices that enable fast and accurate in vivo analysis of the parameters investigated. In particular, we estimated water content through a full-field capacitance system and skin thickness via an ultrasound scanner: to the best of our knowledge neither of the two methods has been used before for the analysis of the face. Another original contribution of the paper is a statistical analysis of the facial areas for each type of measurement, the goal of which was to identify potential clusters and find phenomenological explanations of the patters observed. To this end we applied a pairwise non-parametric Mann–Whitney U test to check the hypothesis that the measurements in the different facial areas were indistinguishable.
In the reminder of the paper we first give an overview of earlier works (Section 2) and then describe the materials and methods used in this investigation (Section 3). We present and discuss the results in Section 4 and Section 5 and conclude the paper with some final considerations (Section 6).

2. Related Research

Mapping skin in terms of its properties has a long history and has received increasing attention in the last two decades. This in part reflects the evolution of the measuring devices, some of which have become available only in recent times [10,11,12]. Research about regional differences of the skin thickness dates back to the early 1970s with the works of Holbrook et al. [13] and has generated a number of relevant studies since [4,14,15,16]. Capacity, TEWL and level of sebum in relation to anatomical site, sex and age were investigated by Conti et al. [17]. Later on, a comprehensive mapping of the human body (23 sites) in terms of hydration was carried out by Cortés et al. [7]. In [5] Firooz et al. investigated variations of sebum content, hydration, TEWL, elasticity, erythema and melanin index as a function of body region (eight sites), gender and age. Of late, differences in hydration and TEWL between five body regions (cheek, forearm, mid-calf, lower back and abdomen) were analysed by Logger et al. [18], and Zainal et al. [19] mapped skin pH, TEWL and hydration in patients with atopic dermatitis.
The facial area has also elicited much research attention due to its obvious implications in cosmetics, beauty treatments and reconstructive surgery. Differences in the biophysical properties have been reported by a number of authors: [20,21] are good introductory reviews on the subject, albeit unfortunately not entirely up-to-date. In [22] Schnetz et al. tested ten face sites for significant inter-area differences in TEWL. Le Fur et al. [23] compared cheeks and forehead regions in terms of capacitance, sebum level, temperature, TEWL, colour and relief. Lopez et al. [24] investigated distributional patterns of TEWL, temperature and sebum level on the foreheads, cheeks and chins of female subjects. Kobayashi and Tagami [25] studied variations of TEWL, conductance, size of corneocytes, amount of surface lipids, pH, blood flow and surface temperature on five facial sites around the perioral region. In a similar study, Marrakchi and Maibach [26] evaluated skin blood flow, TEWL, water content, temperature, pH and sebum content on nine locations of the face. A comparison among seven forehead/cheek biophysical parameters (hydration, sebum level, pH, melanin and erythema index, elasticity and TEWL) was carried out by Lee et al. [27] on Southeast Asian female subjects. Machová et al. [28] measured eight skin parameters (skin gloss, water content, TEWL, melanin level, individual typology angle, erythema, sebum level and elasticity) on the foreheads, cheeks and temples of n = 442 Caucasian female subjects, which makes it the study with the largest population to date. More recently, Voegeli et al. [29] took things a step further by providing continuous, three-dimensional facial maps of hydration, sebum level, barrier function and pH in four ethnic groups (Asians, Black Africans, Caucasians and Indians). Skin thickness has also attracted significant research interest due to its central role in cosmetic and reconstruction surgery. For instance, in [30] the authors studied variations in facial skin thickness using an ultrasound scanner, whereas in [31,32] topographic maps of the skin thickness were obtained via post-mortem biopsy.

3. Materials and Methods

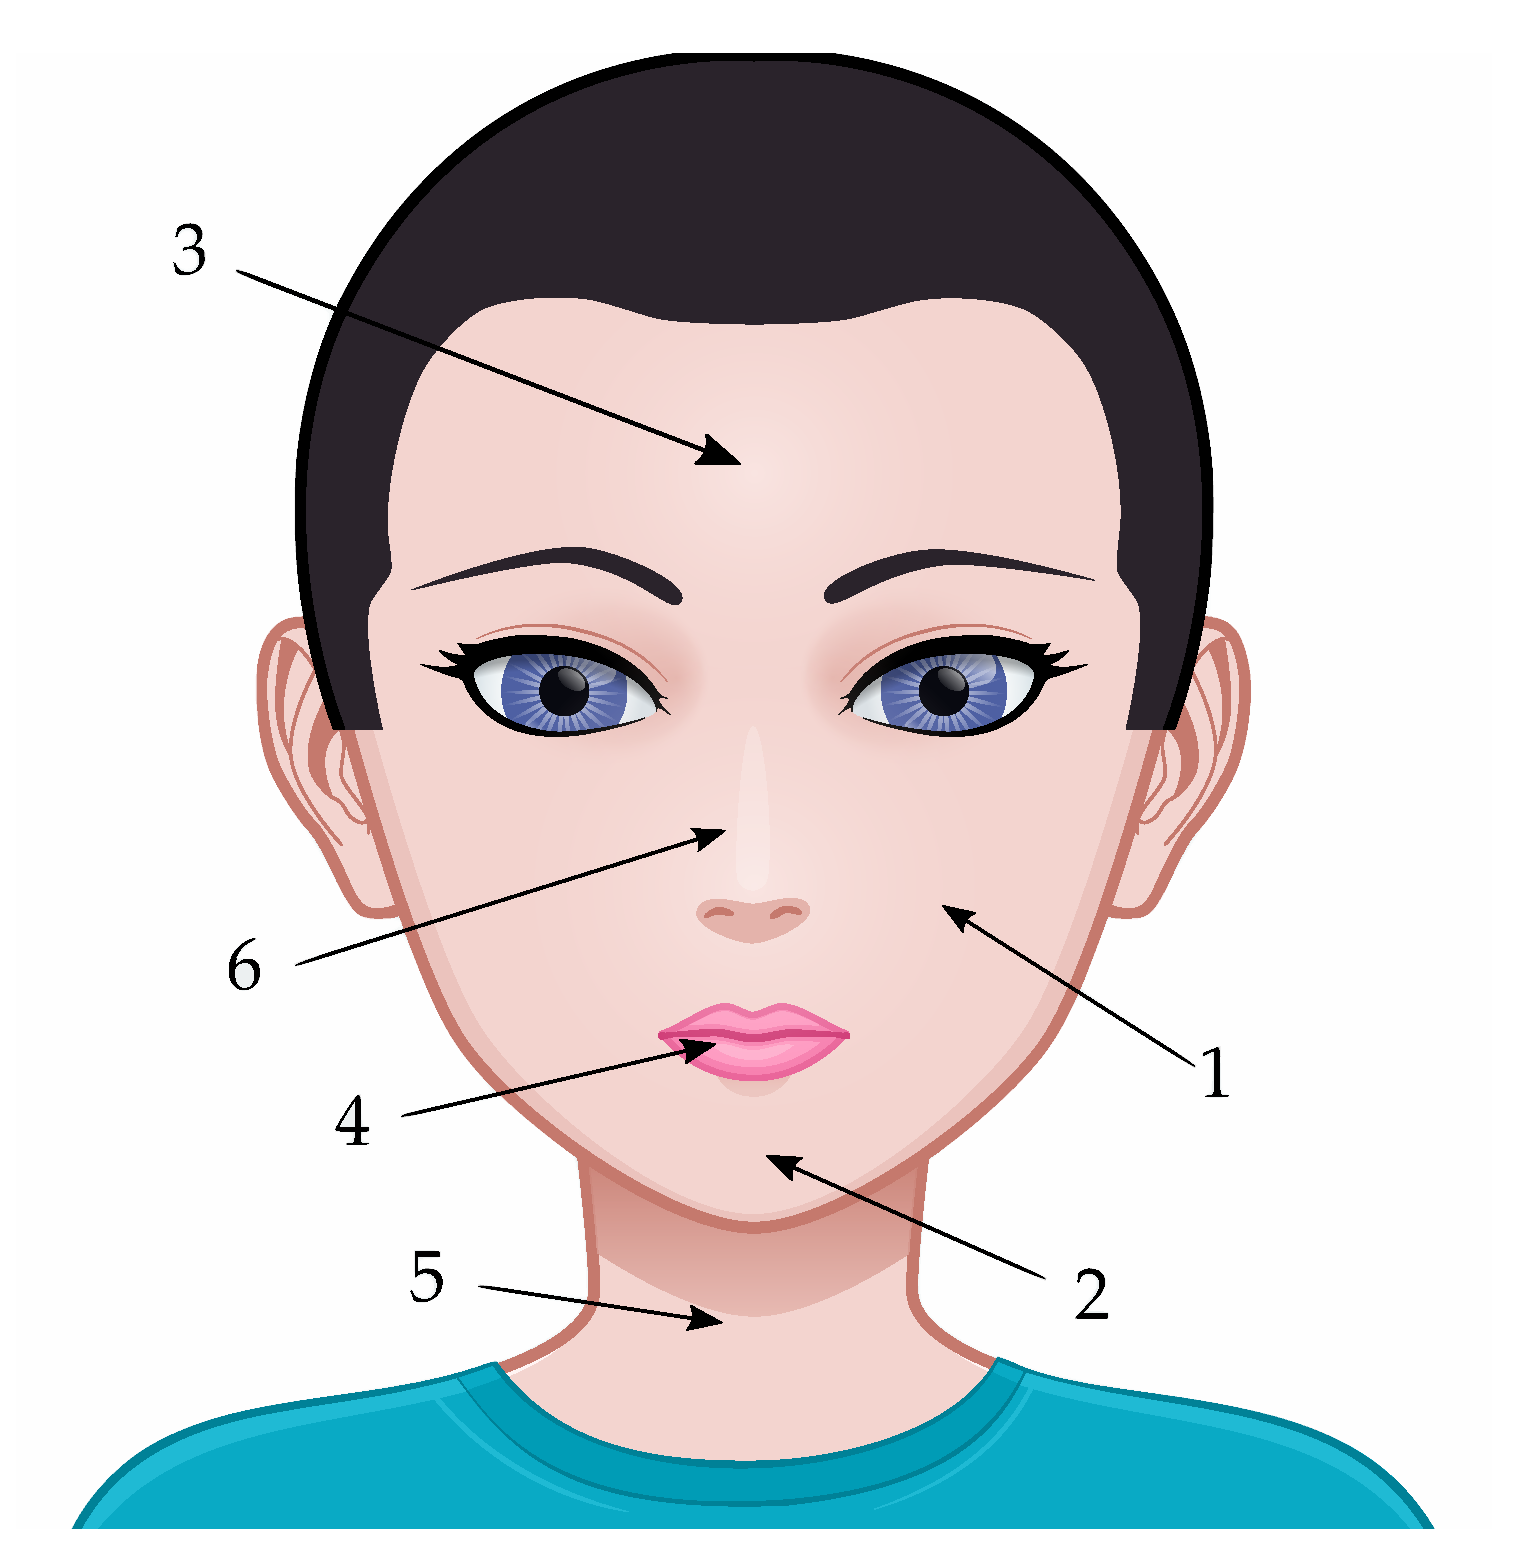
3.1. Study Population and Acquisition Protocol

Skin parameters from 48 healthy volunteers (10 male, 38 female, age = 41.6 ± 12.3 y (range 18–70 y) were acquired at Sinlen Beauty Clinic (Sidcup, UK) at the six facial regions of interest (Figure 1). Before the acquisitions, the volunteers were recommended not to use any soaps, make-ups, creams, lotions, perfumes or any other chemical substances on the skin for at least 4 h before the appointment. They were also advised to keep their skin clean and free from dust/dirt. After arrival, the subjects were invited to sit comfortably in the room for acclimatisation for 15 min. Examination was carried out in controlled conditions (temperature 21.5–22.5 °C, relative humidity 50–60%). All subjects gave their informed consent for inclusion before participating in this research. The study was approved by the ethical committee of London South Bank University (reference “UREC 1412”).

3.2. Measurement Systems

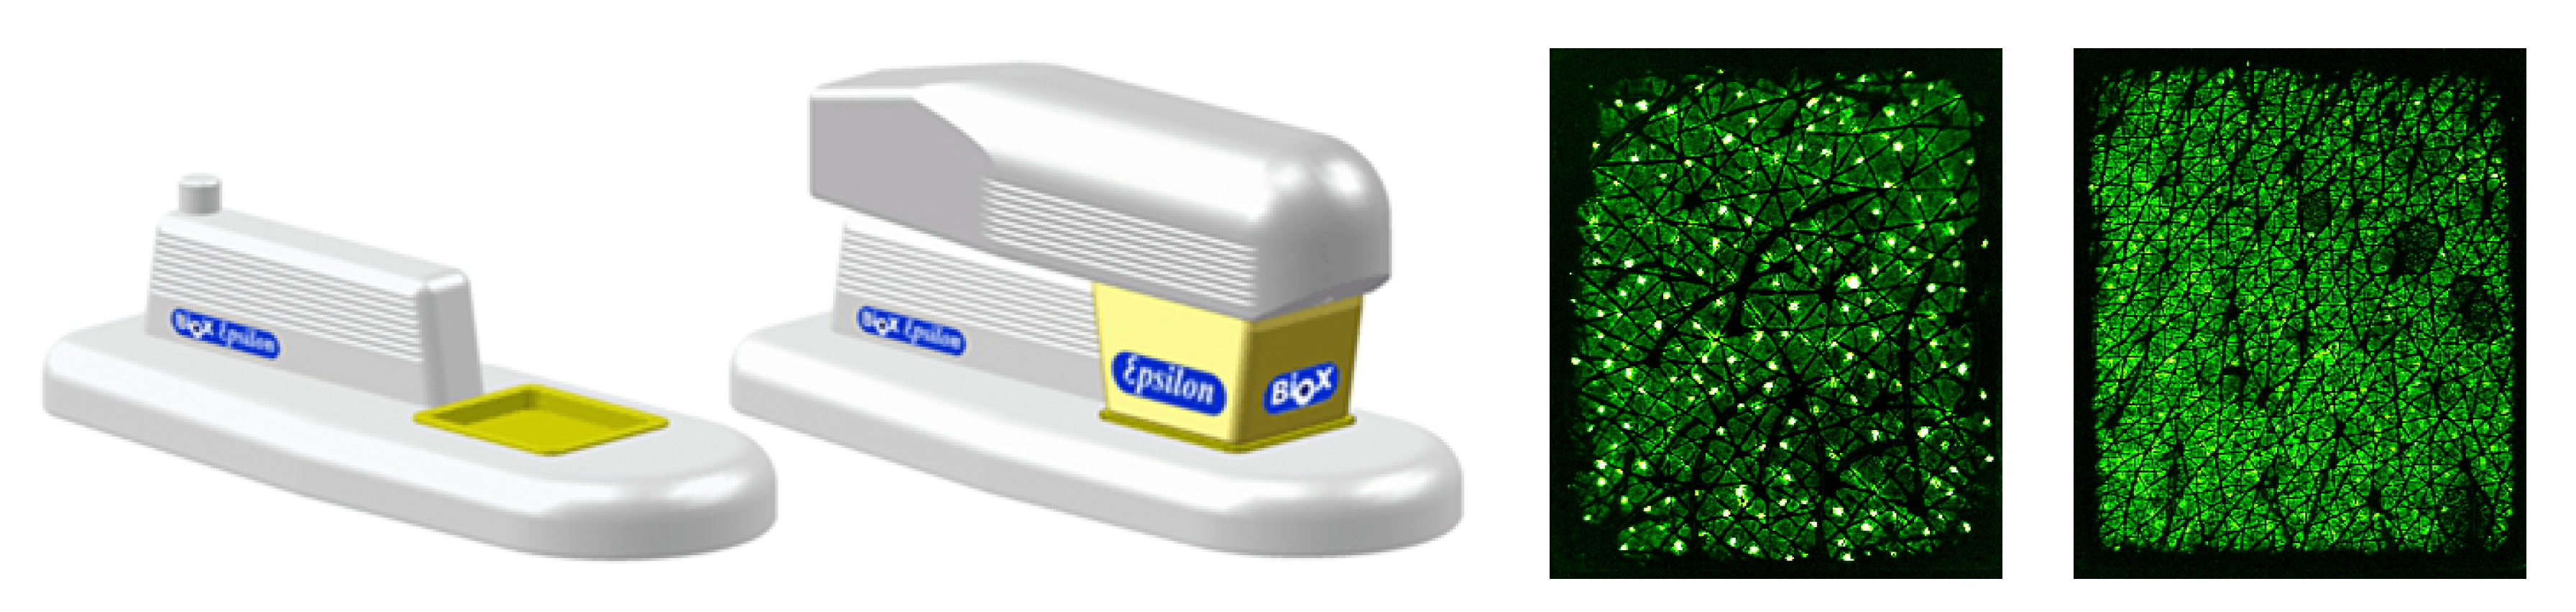
3.2.1. Water Content

Water content was estimated through an EpsilonTM E100 multi-sensor corneometer (Biox Systems Ltd, London, UK), which measures hydration through calibrated dielectric permittivity (dielectric constant, ϵ ). The rationale behind this is that dielectric permittivity of water is much higher than that of other constituents of the skin. A previous study [33] reported a very high correlation (R = 0.97) between the response of the Epsilon and that of a CM820 Corneometer (Courage + Khazaka, Köhln, Germany [34]). Besides, differently from traditional, single-point corneometers, this innovative device (Figure 2) measures the dielectric permittivity through a CMOS sensor matrix [33,35]. This design enables field inspection over an area of 12.8 × 15 mm with 50 μm spatial resolution, the output being represented by an eight-bit instensity image of dimension 256 × 300 px. Similarly to other devices (e.g., the above cited CM820), the Epsilon has ≈20 μm sensing depth which confines the measurement predominantly to the Stratum Corneum (SC).
The system is composed of a hand-held probe, a parking base and an optional foot switch. The device is quick and easy to use, needing nothing more than a USB connection to a computer.

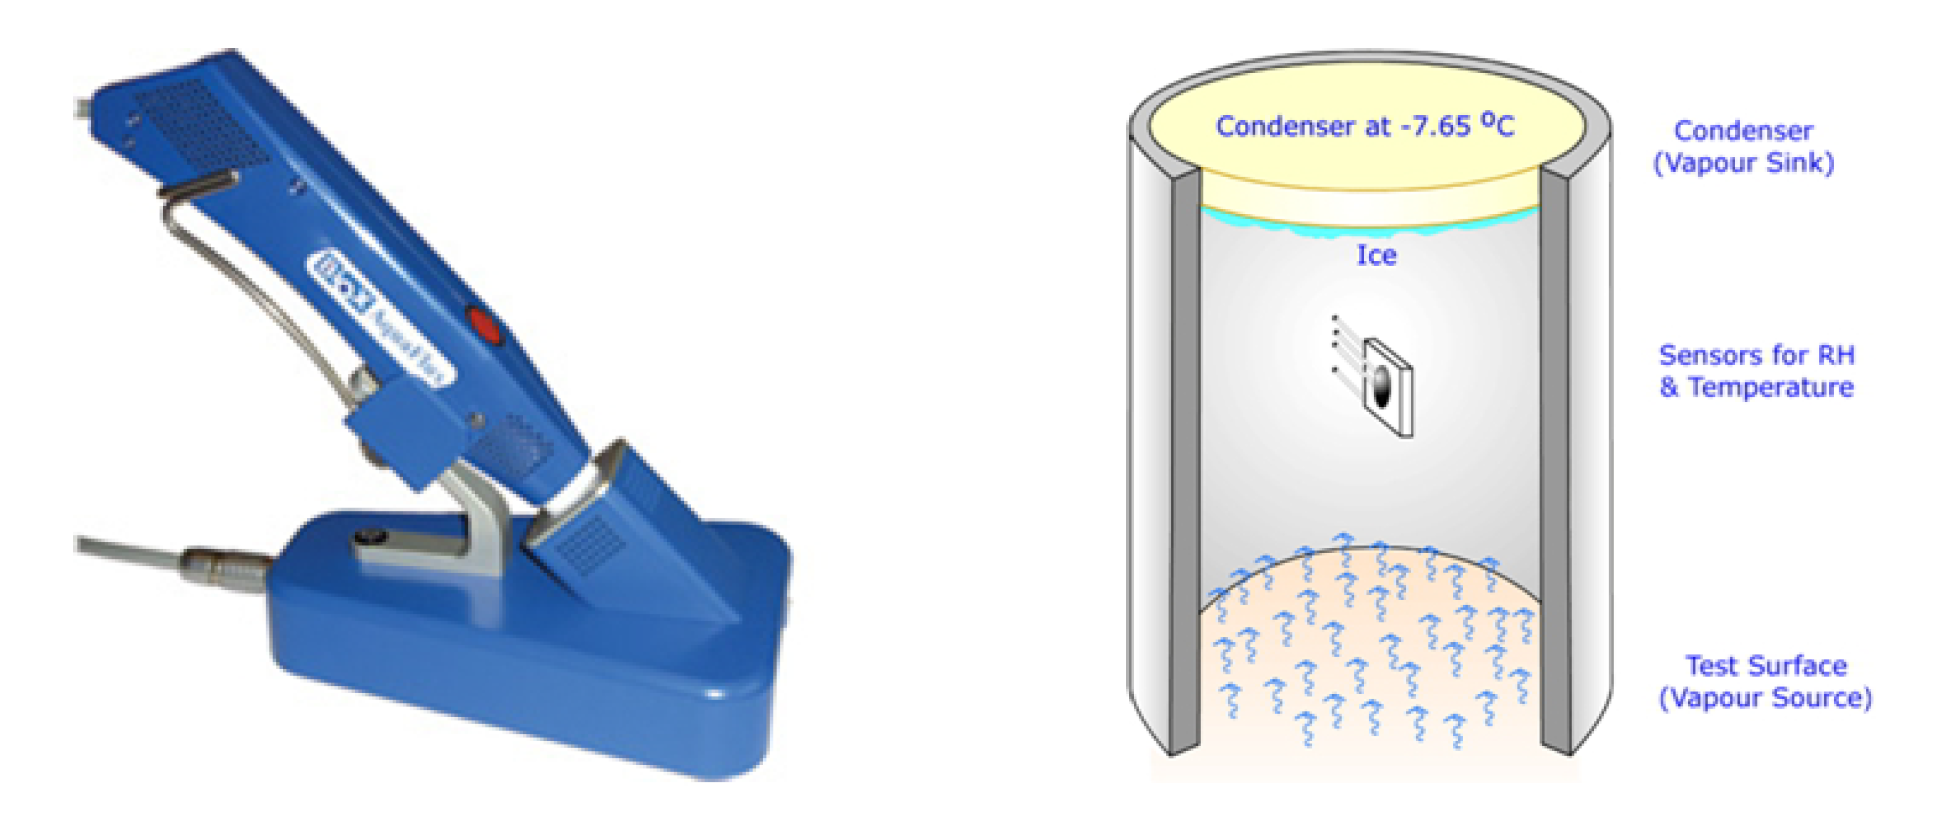
3.2.2. Trans-Epidermal Water Loss

Trans-epidermal water loss was assessed through an AquaFluxTM AF200 evaporimeter (Biox Systems Ltd, London, UK). The core of the device is a cylinder chamber closed at both ends (Figure 3); one end (the skin) is the vapour source and the other end (the condenser) the vapour sink. The temperature of the condenser is kept constant at −7.65 °C by means of a Peltier cooler. This design causes the water vapour to migrate from source to sink by passive diffusion, leading to an approximately linear gradient of humidity along the axis of the chamber. The water vapour flux is estimated from the gradient value through Fick’s first law of diffusion [36]. The effectiveness of the Aquaflux for measuring trans-epidermal water loss was validated in a previous in-vivo study [37].

3.2.3. Skin Thickness

Skin thickness of the stratum corneum, epidermis and dermis was evaluated using an Episcan I-200 dermal ultrasound scanner (Longport Inc., Chadds Ford Township, United States—Figure 4). This device enables non-invasive, cross-sectional imaging of the skin and underlying tissue with resolution up to 40 μm [38]. The instrument can be equipped with three easily interchangeable probes, respectively working on a range of frequencies centred on 18, 35 or 45 MHz.
Earlier works demonstrated that the Episcan can accurately measure up to 34 mm depth from the surface of the transducer with measurement error <1% of the median thickness [15] and have documented the effectiveness of the device for a number of tasks, such as objective burn scar measurement [39], assessment of skin ulcers [40] and pre-operative mapping of skin cancer [41]. Compared with other techniques such as Optical Coherence Tomography (OCT), it is commonly accepted that ultrasound achieves higher penetration but with lower resolution [42].
Notably, although this paper focusses on healthy skin, previous studies have documented the effectiveness of the Episcan for a number of tasks, including objective burn scar measurement [39], assessment of skin ulcers [40] and pre-operative mapping of skin cancer [41].

3.3. Data Analysis

Preliminarily, we carried out exploratory data analysis to summarise the main characteristics of the data in the facial areas considered. Subsequently, we ran a series of paired Mann–Whitney U tests [4,18,24] to check for significant differences between the six facial sites. For all the tests we set a significance level α = 0.05 and applied Bonferroni’s correction [43] to protect from type-I errors (in the remainder we use symbol α * to indicate the significance threshold after correction). Finally, we performed cluster analysis to identify supersets of facial sites in which the areas were pairwise indistinguishable (not statistically different) from one another. We considered maximal clusters only, and therefore discarded those clusters that were proper subsets of other clusters.

4. Results

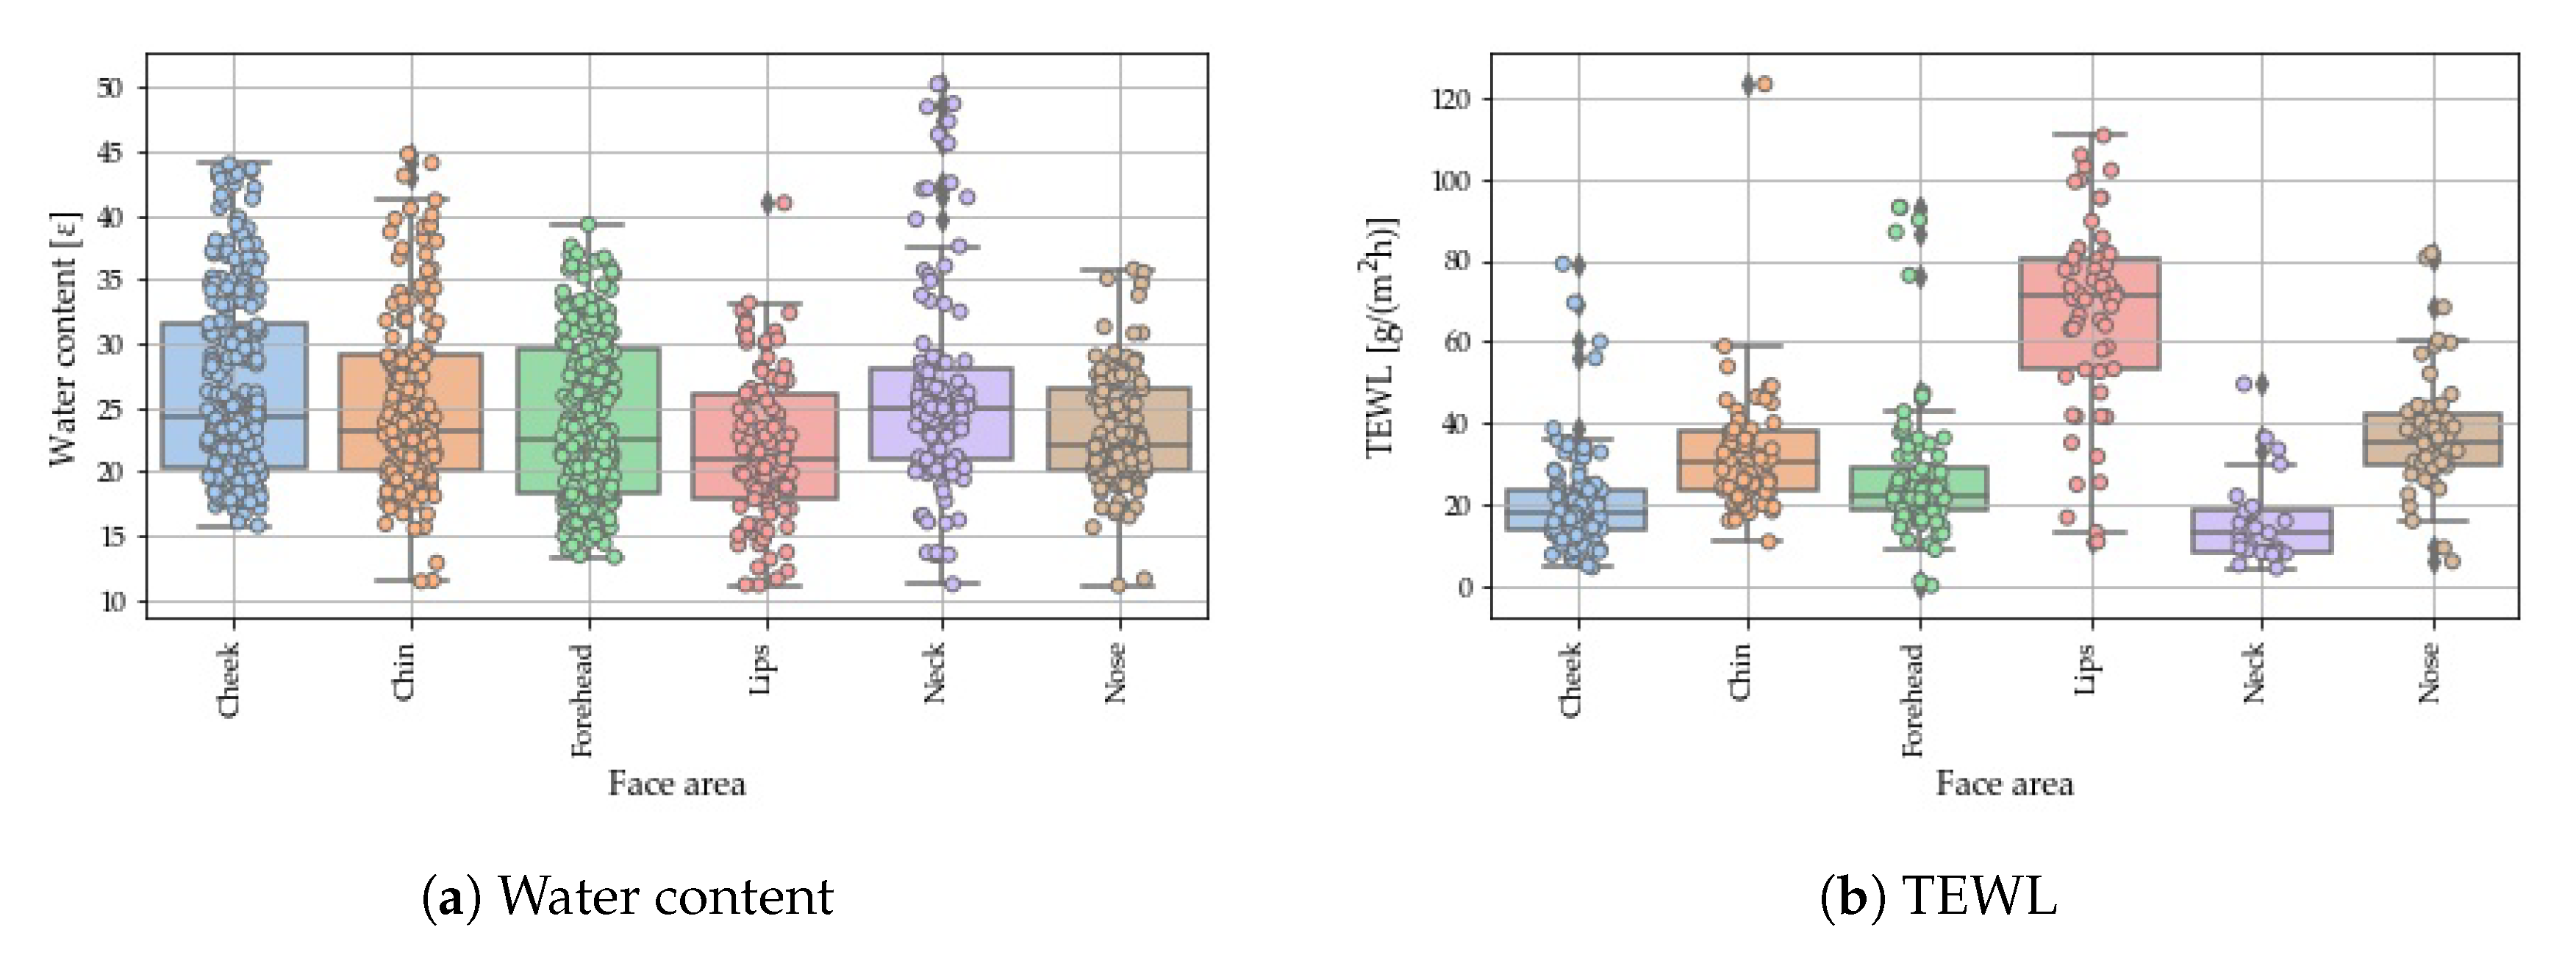
4.1. Anatomical Variations of the Water Content

As can be seen from Table 1 and Figure 5a the water content in the different facial areas was, on the whole, rather uniform (range 21.8–26.5 ϵ , a.u.). The cheeks emerged as the area with the highest hydration, followed by the neck and chin. By contrast, the lips were the area with the least water content. Pairwise comparison revealed statistically significant differences between five pairs out of 15 comparisons (Table 2a). Cluster analysis showed three prominent clusters: (1) chin, forehead, neck and nose; (2) cheeks, chin and neck; and (3) forehead, lips and nose (Figure 6).

4.2. Anatomical Variations in TEWL

In terms of TEWL the results indicate that the lips were the area with the highest average value followed by the nose and chin, whereas the cheeks and neck exhibited the lowest values (Table 1, Figure 5b). Additionally, it is apparent that TEWL had greater variability than water content among the face sites investigated (Figure 5). Pairwise comparison of the facial areas shows that in 13 cases out of 15 trans-epidermal water loss was significantly different from one area to the other (Table 2b). Consequently, there was only one cluster of statistically-undistinguishable areas: neck and nose (Figure 7).

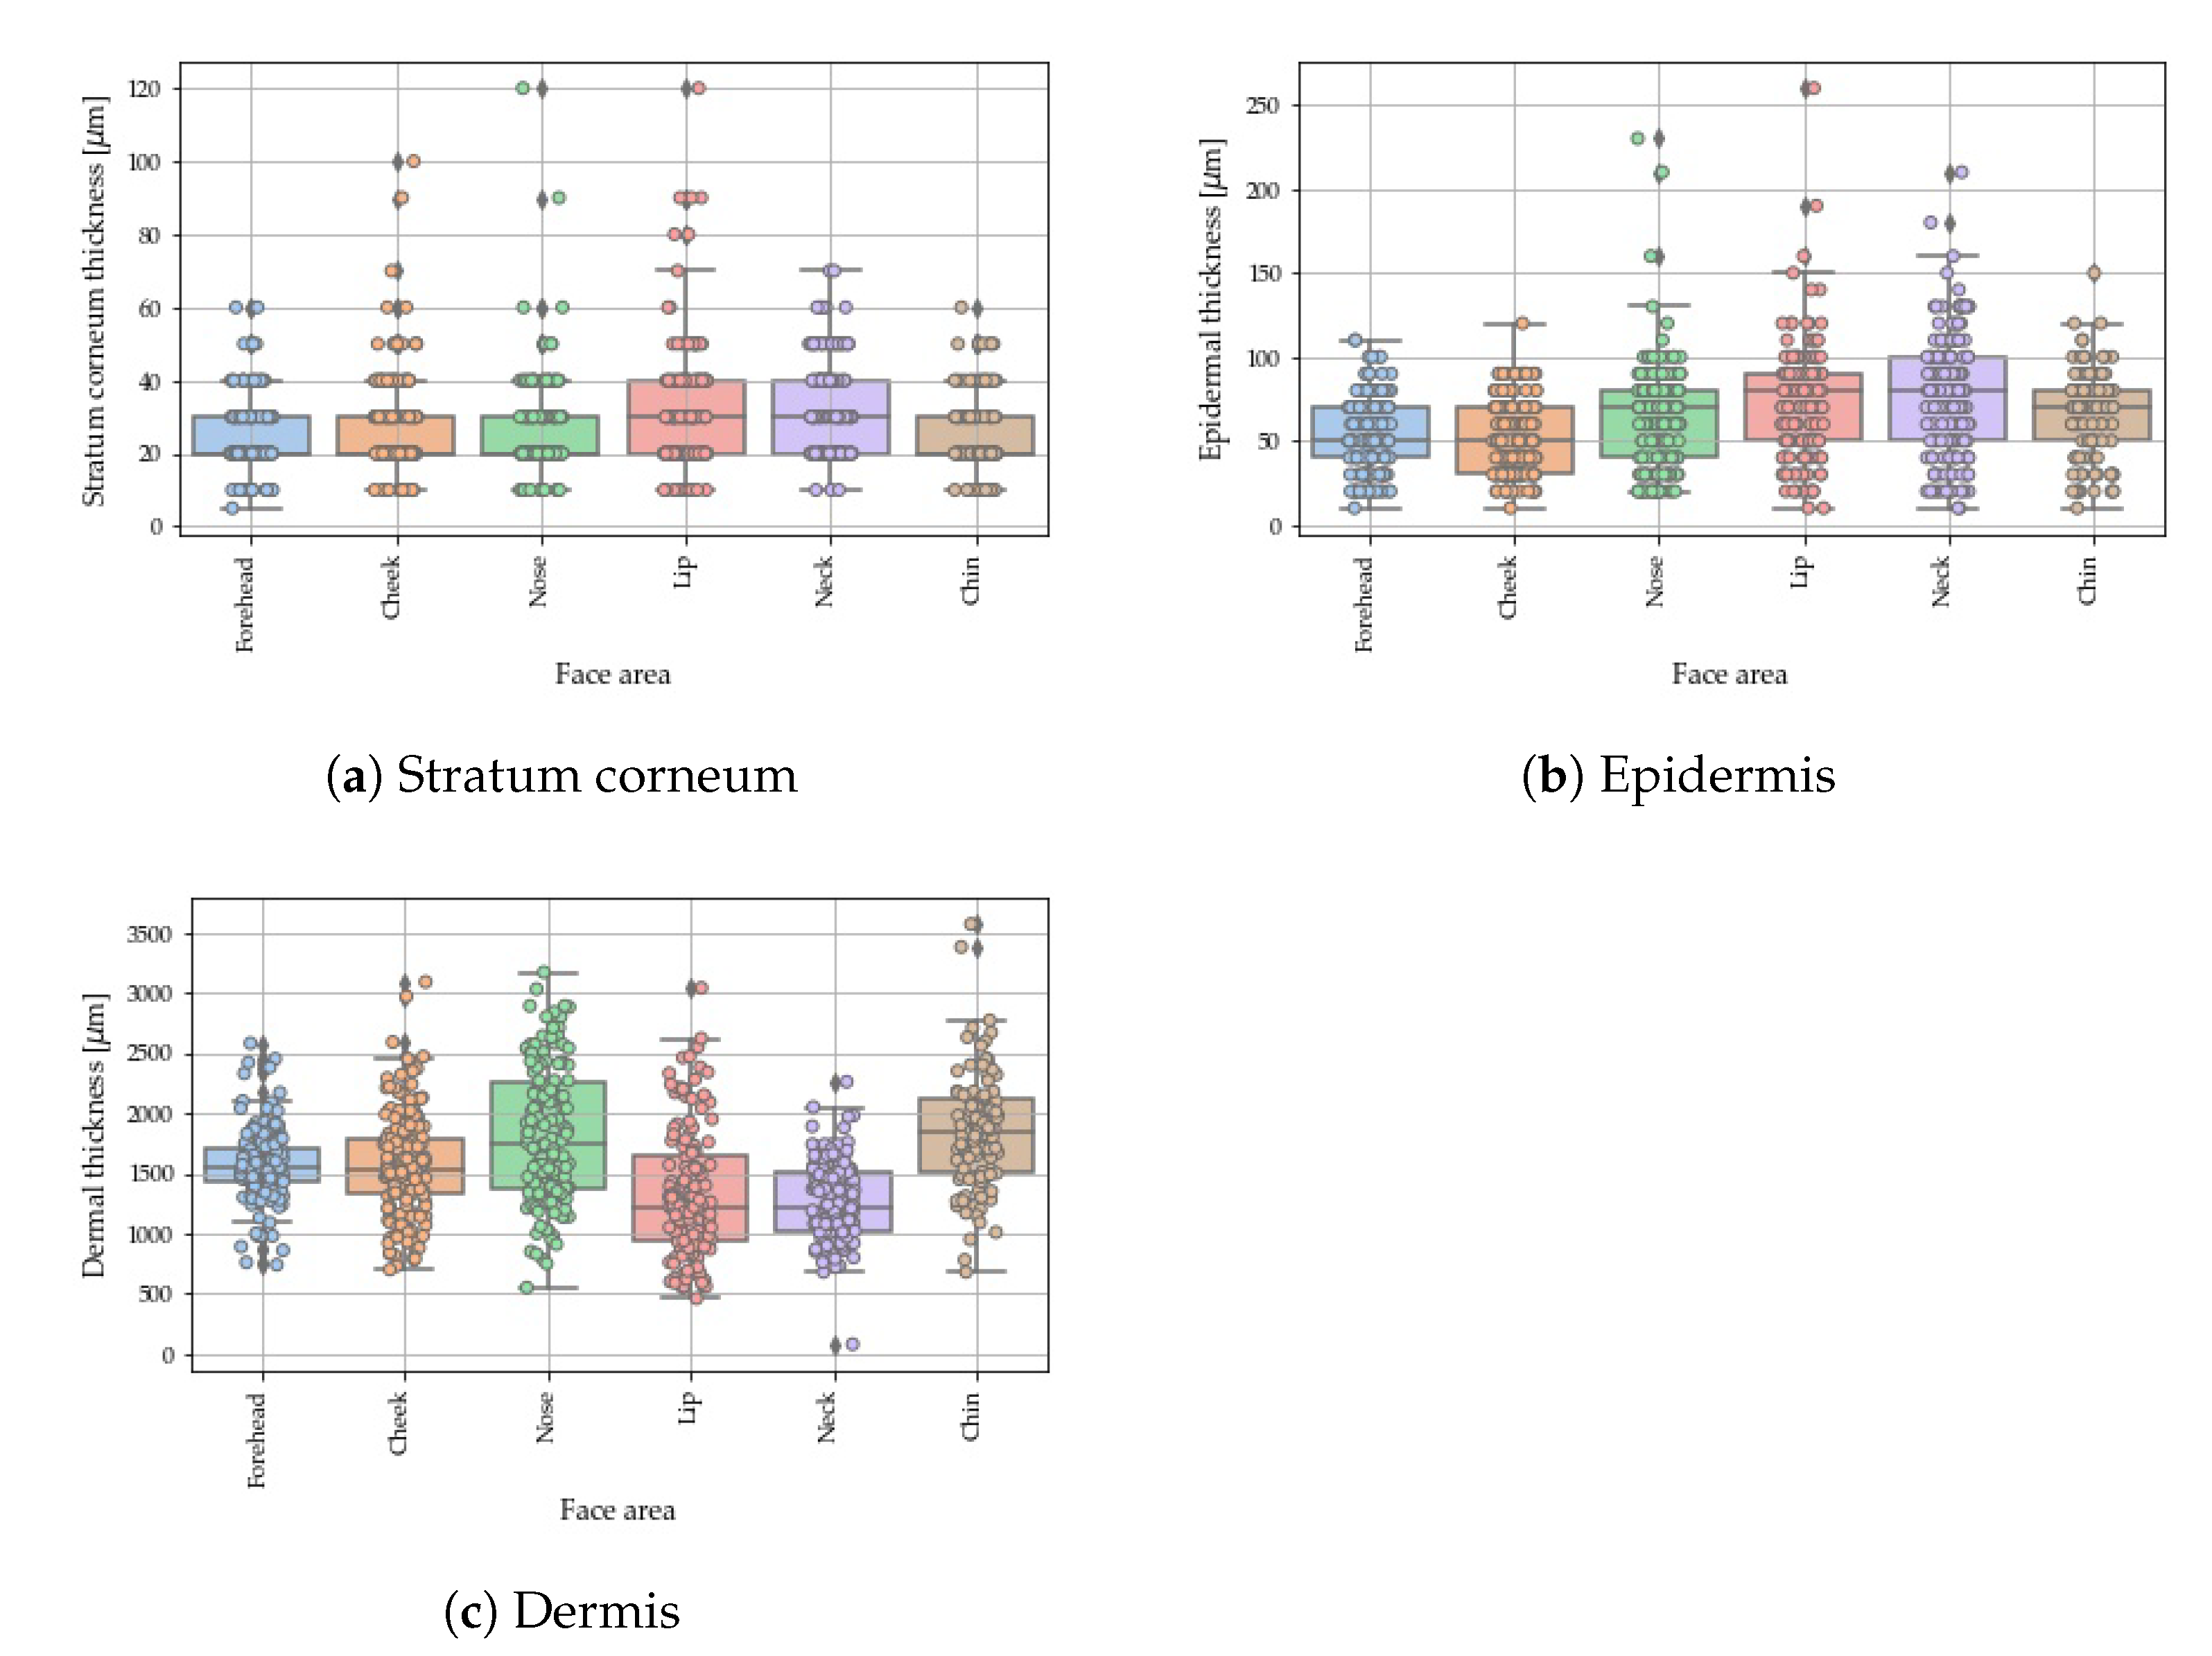
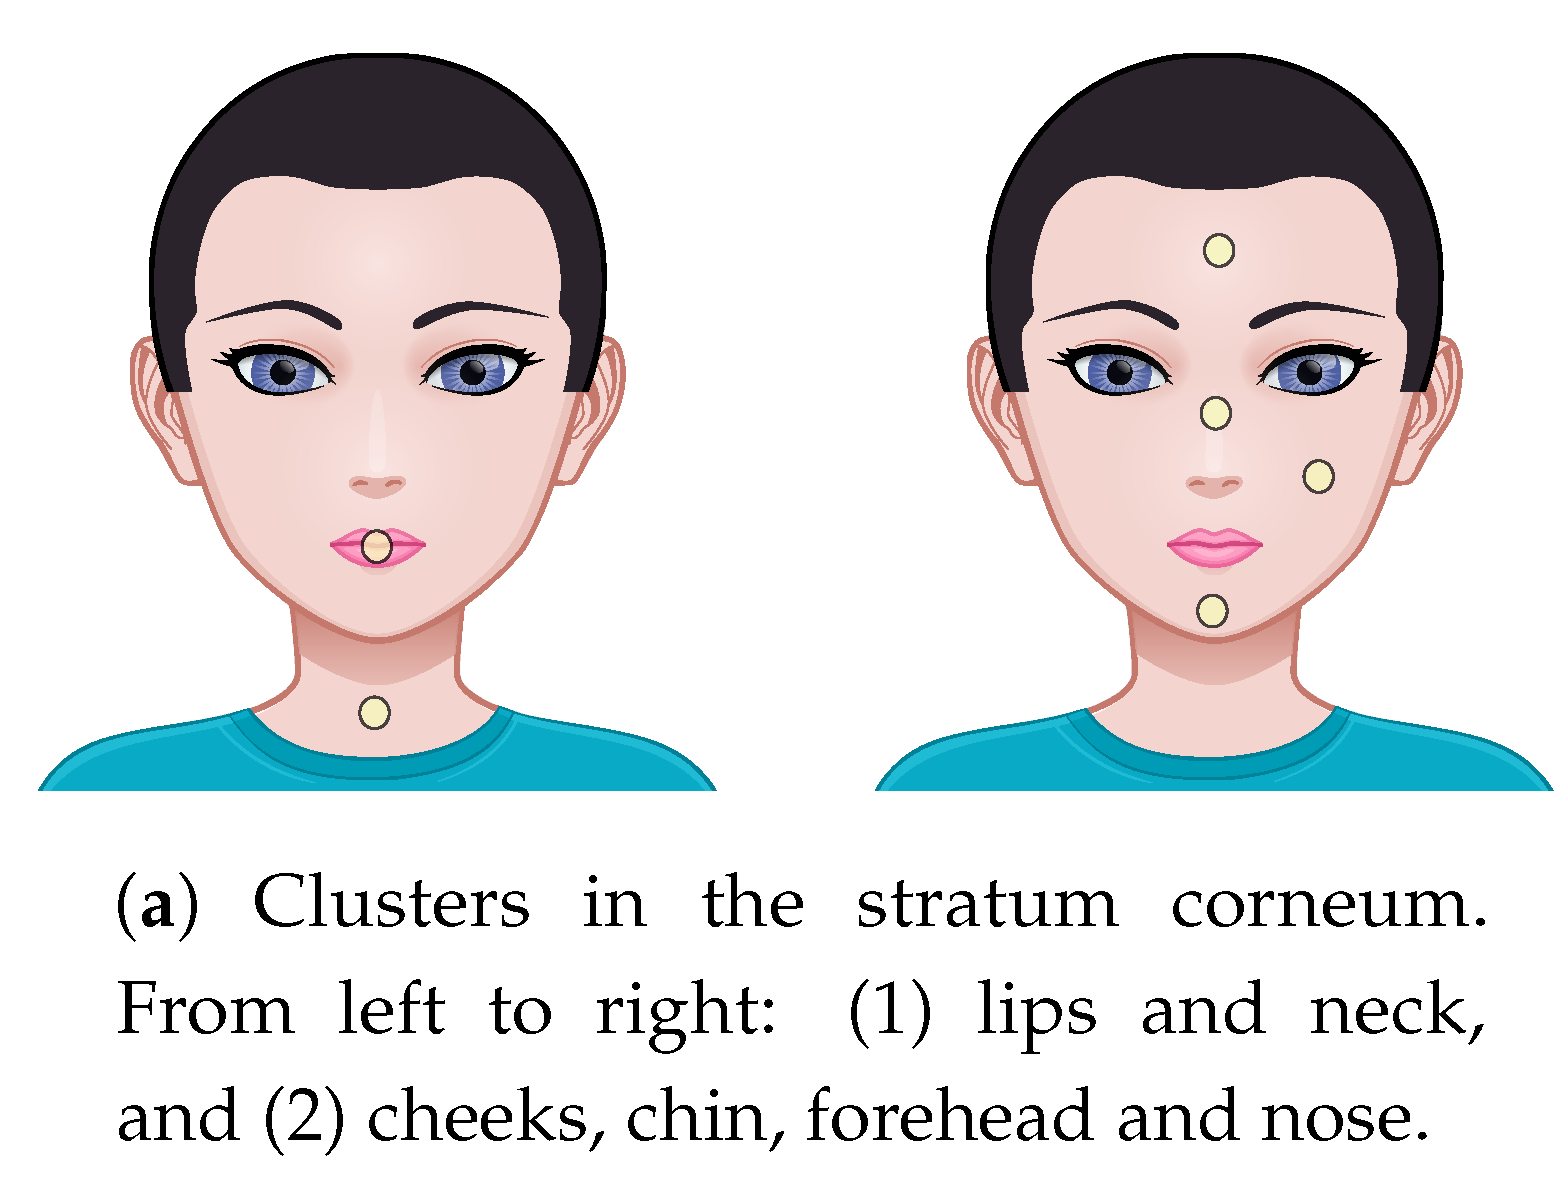
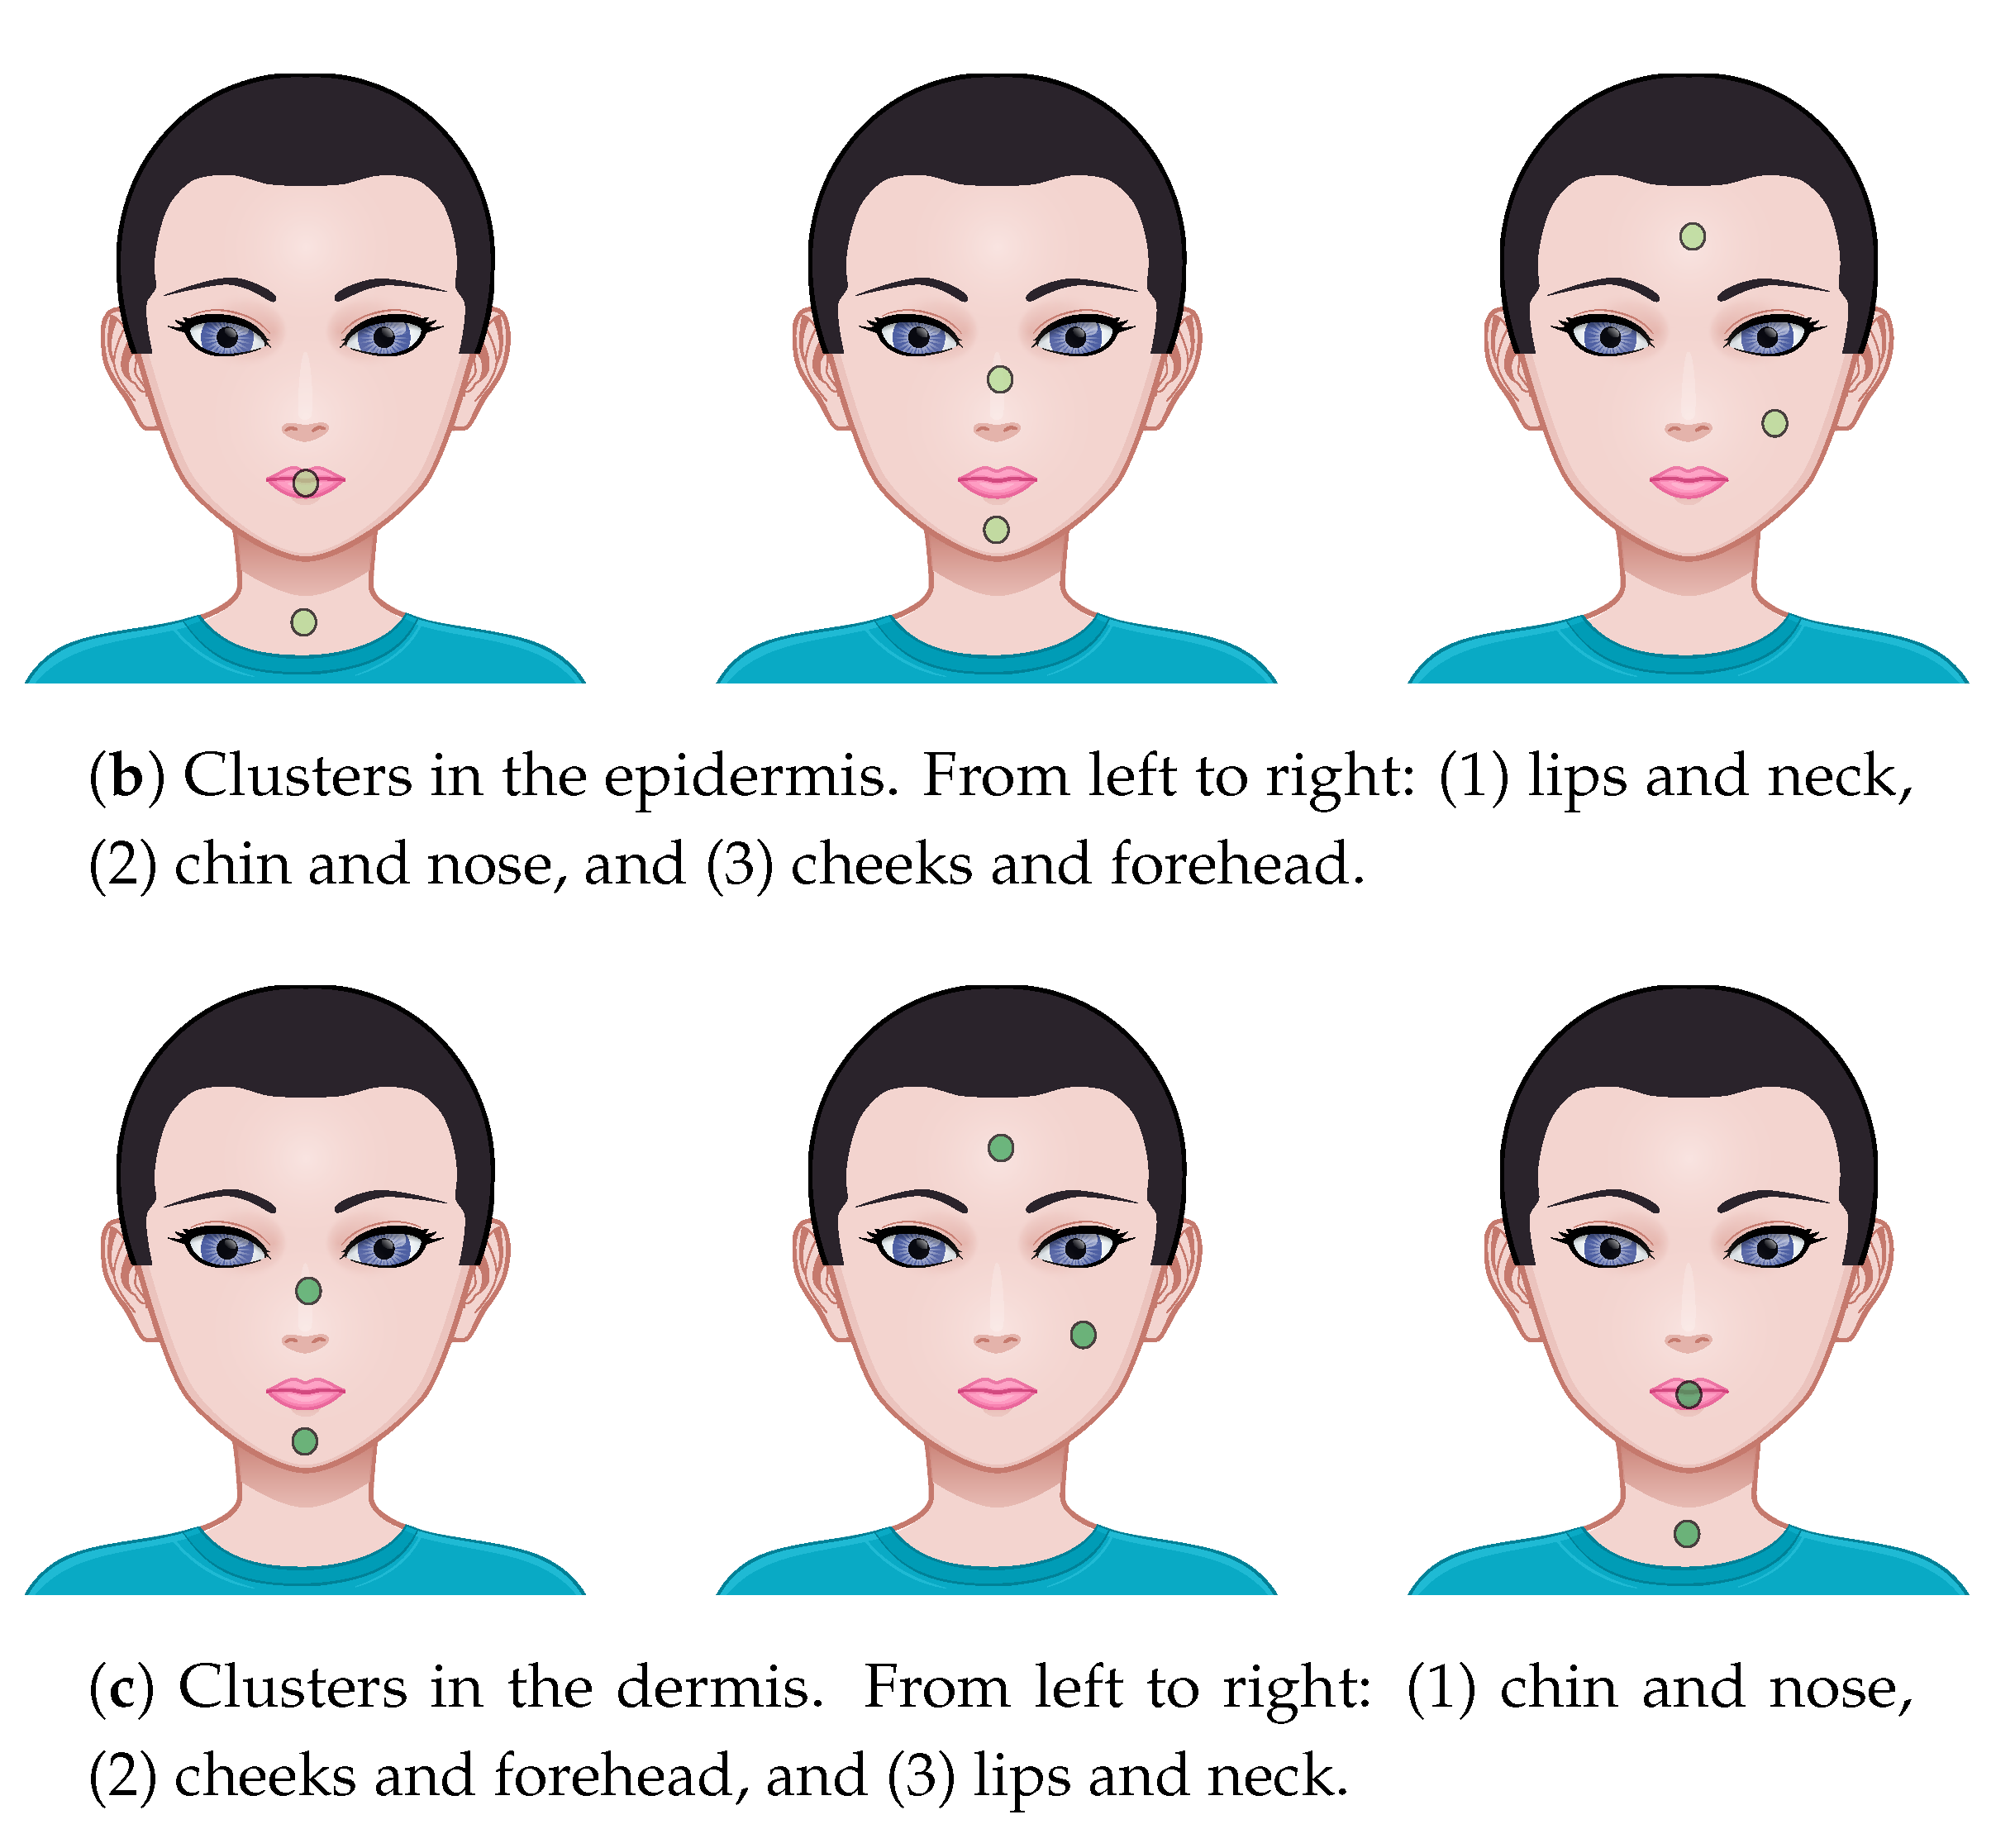
4.3. Anatomical Variations of Skin Thickness

The values reported in Table 1 indicate that the stratum corneum and epidermis accounted, together, only for a small fraction (<8%) of the full skin thickness, whereas the bigger part was taken up by the dermis, as one would expect [2,3]. The total thickness was therefore determined, for the most part of it, by the dermal thickness, and the results indicate that this was highest in the chin and nose regions (Table 1 and Table 3c; Figure 8c), which in fact formed a cluster (Figure 9c). Conversely, the dermis was thinnest in the lips and neck, which formed another cluster. The third cluster, with thickness values in-between the previous two, was composed of the forehead and cheeks.
As for the stratum corneum, this was thicker in the lips and nose than in the other face regions (Table 1 and Table 3a; Figure 8a). The cluster analysis confirmed that there were in fact two clusters: one formed by lips and neck and the other by the remaining regions.
Interestingly, whereas lips and neck were the regions with the thinnest dermis, they were also the ones with the thickest epidermis (Table 1 and Table 3b; Figure 8b). Additionally, the epidermis clustered exactly the same way as the dermis, but the clusters had a different ranking in terms of thickness, as shown in Table 1, Figure 9b).

5. Discussion

The basic working aim of this study was to determine whether the six facial areas considered were statistically different in terms of the parameters investigated. Likewise, we wanted to find potential clusters of facial zones that are statistically undistinguishable from one another. Our results confirm that water content and TEWL can vary significantly between different facial areas—with the former showing more prominent differences than the latter. The statistical analysis indicated that 13 pairs of facial sites were significantly different in terms of TEWL—i.e., more than twice as many than were in terms of water content (five). Conversely, cluster analysis showed that there were larger clusters of statistically indistinguishable areas in terms of water content than were in terms of TEWL. Specifically, the results show that, as regards water content, there were three promient clusters: (1) cheeks, chin and neck; (2) chin, forehead, neck and nose; and (3) forehead, lips and nose. The presence of three relatively large clusters is consistent with the water content being relatively uniform among the six areas investigated (see also Figure 5a).
Earlier works also demonstrated variations of the water content in different facial areas, although the results available in the literature are not always consistent. Water content in the cheeks and forehead was, for instance, evaluated in [23,27,28], but despite the same type of corneometer being used in the three studies, [23] reported higher values in the cheeks than the forehead (which is in agreement with our results), and [27,28] the opposite.
Regarding TEWL, we found prominently more inter-area variation in this case than in terms of water content. This clearly reflects in the presence of only one and relatively small cluster in this case—i.e., chin and nose. By contrast, the lips emerged as a clear outlier with values well above those of all the other areas (Figure 5b). Notably, a previous study by Kobayashy and Tagami [25] determined that chin and nose had significantly higher values than cheeks, which is in accordance with our findings. Marrakchi and Maibach [26] reported that the nasolabial area had higher values than most other areas, which is again consistent with the results of our experiments. We also found that TEWL in the forehead was significantly higher than in the cheeks, which agrees with [17] but contrasts with [22,23]. These difference could be possibly a consequence of the diverse ethnic composition of the study populations, as other authors have suggested [27,29]. Among them, Lee et al. [27], for instance, reported a reversed TEWL difference between the cheeks and forehead when considering populations of Vietnamese and Singaporean female subjects.
It is known that the dermis accounts for most of the skin’s thickness, as our results confirm. Additionally, differences in the skin thickness between the facial areas have been documented in a number of papers [30,31,32,44]. In terms of absolute values of the whole thickness, our results are in line with those reported in [32]. As for the dermis, our findings indicate the presence of three clearly identifiable clusters, which, in descending order of thickness, were: (1) chin and nose, (2) cheeks and forehead and (3) lips and neck. This finding is in agreement with the results that appeared in [31], where the authors determined that the chin and nose were the areas with the highest thickness. The nose also emerged as the region with the highest overall thickness in [32]; however, differently from [31], and in contrast with the results found here, in [32], the chin had a relatively low thickness compared with the other areas. In [44] Kim et al. reported that skin thickness in the cheeks was higher than in the forehead, which is again consistent with our results, although the difference did not reach statistical significance in our experiments.
Interestingly, the epidermis showed the same three clusters as the dermis, but, notably, with a different ordering in terms of thickness, which in this case was: (1) lips and neck, (2) chin and nose and (3) cheeks and forehead (from thickest to thinner). Unfortunately, in this case there are fewer results available to compare with. In [32] Chopra et al. determined that the lips had the highest epidermis thickness, which is line with our results; but differently from the results found here, they found that the neck had lower thickness than most of the other areas.
Finally, our analysis of the stratum corneum returned two clusters of statistically-indistinguishable areas, which, from thickest to thinner were: (1) lips and neck and (2) cheeks, chin, forehead and nose. Regrettably, no comparison with published results is possible in this case, as we are aware of no earlier studies investigating the distribution of the thickness of the stratum corneum in the different facial areas.
We believe the results of this investigation can provide valuable insights for the development and/or evaluation of cosmetic products and medical and surgical treatments. The correct assessment of functional and anatomical differences between facial sites plays in fact a fundamental role for the preparation of cosmetic, dermatological and aesthetic treatments and surgical procedures tailored to the patient’s needs. Specifically, trans-epidermal water loss is a strong indicator of the integrity of the stratum corneum and is widely adopted to evaluate the skin barrier function, with high values of TEWL being related to increases in skin irritability [25]. It is also believed that TEWL plays a major role in inflammatory skin conditions such as eczema and dermatitis [45]. Here we determined that TEWL was significantly higher in the lips and chin compared to the cheeks, thereby confirming previous results [25]. Water content is also a crucial element for a healthy skin, and de-hydrated skin is one of the major concerns of today’s cosmetics consumer base worldwide. In this case we identified three different clusters of facial areas, the least hydrated being composed of forehead, lips and nose (Figure 6), a finding consistent with previous works [23,29]. This result may have direct practical applications, as a recent study by Voegeli et al. [29] demonstrated that moisturising treatments were most effective on the facial areas that had the lowest hydration baseline. Finally, understanding regional thickness differences is essential for optimising reconstructive procedures and minimally invasive treatments. The results presented here can help surgeons in a number of tasks, such as skin reconstruction after cancer resection and determination of optimal needle location for injectable neuro-modulators and/or tissue fillers [32].
Interesting questions arise about what each cluster means physiologically, and more generally, regarding possible links between the results found here and other biophysical and/or anatomical properties of the facial areas investigated. As for water content, a number of factors have been advocated as possible determinants—among them the presence in the skin of natural (endogenous) hygroscopic agents (e.g., glycerol and hyaluronic acid) and that of inter-cellular lipids [6]. However, apart from lipids (sebum), the effects of such factors are difficult to evaluate due to the absence of literature data, and should be therefore explored in future studies. As for sebum, previous works [23,46] have reported a significantly higher concentration in the forehead than in the cheeks; however, neither of the two studies found higher water content in the more sebaceous areas.
With respect to TEWL, it is generally accepted that the size of superficial corneocytes correlates negatively with trans-epidermal water loss [47,48]. In fact in [25] the chin and nasolabial fold had significantly smaller corneocytes than the cheeks, which is in very good agreement with the results found here (Table 1(a), TEWL column). Higher surface temperature also favours evaporation; therefore we would expect this parameter to correlate positively with TEWL. In a previous work [25] it was reported that surface temperature was lowest on the cheeks than in other facial areas, which is again consistent with our findings. Likewise, higher blood flow facilitates heat and fluid exchange, and hence should result in higher TEWL. Indeed, a comparison with [26] indicates that the areas with the highest blood flow (i.e., nose and chin) were also the areas with the highest TEWL in our study—excluding the lips—which were not investigated in [26].
Regarding skin thickness, histological evaluation clearly represents the “ground truth”—for instance, that performed in [31,32]. In general, our in vivo evaluation showed good agreement with post-mortem evaluations. It is known, clinically, that the skin over the nasal dorsum and the chin is thicker than in other facial areas, as our results confirm. Based on the results of the cluster analysis (Figure 9) we may speculate that the more exposed areas of the face—thee nose, chin, forehead and cheeks—are also the ones with the thickest skin. Furthermore, it seems that the zones where the surface curvature is higher (i.e., nose and chin) haver thicker skin than the flatter ones (i.e., forehead and cheeks). These considerations should be further explored and validated in future studies.

6. Conclusions

In this study we carried out an in vivo evaluation of water content, trans-epidermal water loss and skin thickness at six facial areas. For each property we determined statistically significant differences between the areas investigated as well as groups of sites (clusters) that were statistically indistinguishable from one another. The water content distributed quite uniformly on the various sites with cheeks and neck having the highest values and lips the lowest. Trans-epidermal water loss, by contrast, showed higher variability, with the highest values being from the lips and the lowest from the neck. The dermis, which accounted for most of the whole thickness, showed three well-defined clusters, which, from thickest to thinnest were: chin and nose, cheeks and forehead and lips and neck. The epidermis had the same three clusters too, but with a different ordering in term of thickness. Finally, the stratum corneum showed two clusters: the thickest, formed by lips and neck, and the thinnest, formed by all the remaining areas.
Comparisons with previous studies indicated that our findings are in line with the results available in the literature, thereby confirming the reliability of the approaches used here. The main advantage of the proposed methods is that they enable in vivo evaluation of the skin parameters in a fast and easy manner. We believe the results of this investigation can provide valuable guidelines for the evaluation of skin moisturisers and other cosmetic products, and can help guide choices in medical treatments and surgical procedures.
Among the limitations of our study are the relatively small sample size and the lack of complete data as regards age, gender and/or ethnic group of the subject population. The effects of these variables on the skin properties of the six facial areas investigated could therefore not be assessed in this study, but would be certainly interesting subjects for future research.

Author Contributions

Conceptualisation, E.C. and P.X.; *data curation, E.C., A.C., S.D.-E. and F.B.; methodology, E.C., A.C. and P.X.; software, A.C. and F.B.; supervision, P.X.; visualization, F.B.; writing—original draft, E.C., S.D.-E. and F.B.; writing—review and editing, E.C., A.C., P.X., S.D.-E. and F.B. All listed authors meet the IC; All authors have read and agreed to the published version of the manuscript.

Funding

This research received no external funding.

Acknowledgments

The authors wish to acknowledge the support from London South Bank University (London, UK) and Sinlen Beauty Clinic, (London, UK). They also want to thank Longport Inc. (Chadds Ford, PA, USA) for kindly providing the Episcan ultrasound scanner used in the experiments.

Conflicts of Interest

The authors declare no conflict of interest.

References

  1. Benedetti, J. Structure and Function of the Skin. Merck Manual. Consumer Version, Apr 2019; MSD Manuals. 2019. Available online: https://www.merckmanuals.com/home/skin-disorders/biology-of-the-skin/structure-and-function-of-the-skin (accessed on 26 June 2020).
  2. Honari, G.; Malbach, H. Applied Dermatotoxicology; Academic Press: Amsterdam, The Netherlands, 2014. [Google Scholar]
  3. Kolarsick, A.; Kolarsick, M.; Goodwin, C. Anatomy and Physiology of the Skin. J. Dermatol. Nurses’ Assoc. 2011, 3, 203–213. [Google Scholar] [CrossRef] [Green Version]
  4. Mehta, H.; Nikam, V.; Jaiswal, C.R.; Mehta, H. A cross-sectional study of variations in the biophysical parameters of skin among healthy volunteers. Indian J. Dermatol. Venereol. Leprol. 2018, 84, 521. [Google Scholar] [CrossRef] [PubMed]
  5. Firooz, A.; Sadr, B.; Babakoohi, S.; Sarraf-Yazdy, M.; Fanian, F.; Kazerouni-Timsar, A.; Nassiri-Kashani, M.; Naghizadeh, M.; Dowlati, Y. Variation of biophysical parameters of the skin with age, gender, and body region. Sci. World J. 2012, 2012, 386936. [Google Scholar] [CrossRef] [PubMed] [Green Version]
  6. Verdier-Sévrain, S.; Bonté, F. Skin hydration: A review on its molecular mechanisms. J. Cosmet. Dermatol. 2007, 6, 75–82. [Google Scholar] [CrossRef]
  7. Cortés, H.; Mendoza-Muñoz, N.; Galván-Gil, F.; Magaña, J.; Lima, E.; González-Torres, M.; Leyva-Gómez, G. Comprehensive mapping of human body skin hydration: A pilot study. Skin Res. Technol. 2019, 25, 187–193. [Google Scholar] [CrossRef] [PubMed]
  8. Alexander, H.; Brown, S.; Danby, S.; Flohr, C. Research Techniques Made Simple: Transepidermal Water Loss Measurement as a Research Tool. J. Investig. Dermatol. 2018, 138, 2295–2300. [Google Scholar] [CrossRef] [PubMed] [Green Version]
  9. Holm, E.; Wulf, H.; Thomassen, L.; Jemec, G. Instrumental assessment of atopic eczema: Validation of transepidermal water loss, stratum corneum hydration, erythema, scaling, and edema. J. Am. Acad. Dermatol. 2006, 55, 772–780. [Google Scholar] [CrossRef]
  10. Bontozoglou, C.; Xiao, P. Applications of capacitive imaging in human skin texture and hair analysis. Appl. Sci. 2020, 10, 256. [Google Scholar] [CrossRef] [Green Version]
  11. Qassem, M.; Kyriacou, P. Review of modern techniques for the assessment of skin hydration. Cosmetics 2019, 6, 19. [Google Scholar] [CrossRef] [Green Version]
  12. Sim, D.; Kim, S.; Kim, S.; Doh, I. Portable skin analyzers with simultaneous measurements of transepidermal water loss, skin conductance and skin hardness. Sensors 2019, 19, 3857. [Google Scholar] [CrossRef] [Green Version]
  13. Holbrook, K.; Odland, G. Regional differences in the thickness (cell layers) of the human stratum corneum: An ultrastructural analysis. J. Investig. Dermatol. 1974, 62, 415–422. [Google Scholar] [CrossRef] [PubMed] [Green Version]
  14. Böhling, A.; Bielfeldt, S.; Himmelmann, A.; Keskin, M.; Wilhelm, K.P. Comparison of the stratum corneum thickness measured in vivo with confocal Raman spectroscopy and confocal reflectance microscopy. Skin Res. Technol. 2014, 20, 50–57. [Google Scholar] [CrossRef]
  15. Kong, L.; Caspall, J.; Duckworth, M.; Sprigle, S. Assessment of an ultrasonic dermal scanner for skin thickness measurements. Med. Eng. Phys. 2008, 30, 804–807. [Google Scholar] [CrossRef] [PubMed]
  16. Sandby-Møller, J.; Poulsen, T.; Wulf, H. Epidermal Thickness at Different Body Sites: Relationship to Age, Gender, Pigmentation, Blood Content, Skin Type and Smoking Habits. Acta Derm.-Venereol. 2003, 83, 410–413. [Google Scholar] [CrossRef] [PubMed]
  17. Conti, A.; Schiavi, M.; Seidenari, S. Capacitance, Transepidermal Water Loss and Causal Level of Sebum in Healthy Subjects in Relation to Site, Sex and Age. Int. J. Cosmet. Sci. 1995, 17, 77–85. [Google Scholar] [CrossRef] [PubMed]
  18. Logger, J.; Münchhoff, C.; Olydam, J.; Peppelman, M.; Van Erp, P. Anatomical site variation of water content in human skin measured by the Epsilon: A pilot study. Skin Res. Technol. 2019, 25, 333–338. [Google Scholar] [CrossRef] [Green Version]
  19. Zainal, H.; Jamil, A.; Md Nor, N.; Tang, M. Skin pH mapping and its relationship with transepidermal water loss, hydration and disease severity in adult patients with atopic dermatitis. Skin Res. Technol. 2020, 26, 91–98. [Google Scholar] [CrossRef]
  20. Tagami, H. Location-related differences in structure and function of the stratum corneum with special emphasis on those of the facial skin. Int. J. Cosmet. Sci. 2008, 30, 413–434. [Google Scholar] [CrossRef]
  21. Wa, C.; Maibach, H. Mapping the human face: Biophysical properties. Skin Res. Technol. 2010, 16, 38–54. [Google Scholar] [CrossRef]
  22. Schnetz, E.; Kuss, O.; Schmitt, J.; Diepgen, T.; Kuhn, M.; Fartasch, M. Intra- and inter-individual variations in transepidermal water loss on the face: Facial locations for bioengineering studies. Contact Dermat. 1999, 40, 243–247. [Google Scholar] [CrossRef]
  23. Le Fur, I.; Lopez, S.; Morizot, F.; Guinot, C.; Tschachler, E. Comparison of cheek and forehead regions by bioengineering methods in women with different self-reported ‘cosmetic skin types’. Skin Res. Technol. 1999, 5, 182–188. [Google Scholar] [CrossRef]
  24. Lopez, S.; Le Fur, I.; Morizot, F.; Heuvin, G.; Guinot, C.; Tschachler, E. Transepidermal water loss, temperature and sebum levels on women’s facial skin follow characteristic patterns. Skin Res. Technol. 2000, 6, 31–36. [Google Scholar] [CrossRef] [PubMed]
  25. Kobayashi, H.; Tagami, H. Distinct locational differences observable in biophysical functions of the facial skin: With special emphasis on the poor functional properties of the stratum corneum of the perioral region. Int. J. Cosmet. Sci. 2004, 26, 91–101. [Google Scholar] [CrossRef] [PubMed]
  26. Marrakchi, S.; Maibach, H. Biophysical parameters of skin: Map of human face, regional, and age-related differences. Contact Dermat. 2007, 57, 28–34. [Google Scholar] [CrossRef]
  27. Lee, M.; Nam, G.; Jung, Y.; Park, S.; Han, J.; Cho, J.; Suh, K.; Hwang, J. Comparison of the skin biophysical parameters of Southeast Asia females: Forehead-cheek and ethnic groups. J. Eur. Acad. Dermatol. Venereol. 2013, 27, 1521–1526. [Google Scholar] [CrossRef]
  28. Machková, L.; Švadlák, D.; Dolečková, I. A comprehensive in vivo study of Caucasian facial skin parameters on 442 women. Arch. Dermatol. Res. 2018, 310, 691–699. [Google Scholar] [CrossRef]
  29. Voegeli, R.; Gierschendorf, J.; Summers, B.; Rawlings, A. Facial skin mapping: From single point bio-instrumental evaluation to continuous visualization of skin hydration, barrier function, skin surface pH, and sebum in different ethnic skin types. Int. J. Cosmet. Sci. 2019, 41, 411–424. [Google Scholar] [CrossRef] [Green Version]
  30. Pellacani, G.; Seidenari, S. Variations in facial skin thickness and echogenicity with site and age. Acta Derm.-Venereol. 1999, 79, 366–369. [Google Scholar]
  31. Ha, R.; Nojima, K.; Adams, W., Jr.; Brown, S. Analysis of facial skin thickness: Defining the relative thickness index. Plast. Reconstr. Surg. 2005, 115, 1769–1773. [Google Scholar] [CrossRef] [Green Version]
  32. Chopra, K.; Calva, D.; Sosin, M.; Tadisina, K.; Banda, A.; De La Cruz, C.; Chaudhry, M.; Legesse, T.; Drachenberg, C.; Manson, P.; et al. A comprehensive examination of topographic thickness of skin in the human face. Aesthetic Surg. J. 2015, 35, 1007–1013. [Google Scholar] [CrossRef] [Green Version]
  33. Pan, W.; Zhang, X.; Chirikhina, E.; Xiao, P. Skin hydration measurement using contact imaging. In Proceedings of the 69th Annual Scientific Meeting and Technology Showcase, New York City, NY, USA, 11–12 December 2014; Society of Cosmetic Chemists: New York, USA, 2014. [Google Scholar]
  34. Courage + Khazaka Electronic GmbH. Corneometer® CM 825. Available online: https://www.courage-khazaka.de/en/scientific-products/all-products/16-wissenschaftliche-produkte/alle-produkte/183-corneometer-e (accessed on 18 August 2020).
  35. Biox Systems Ltd. EpsilonTM Model E100. Available online: https://www.bioxsystems.com/products/epsilon-model-e100/ (accessed on 29 June 2020).
  36. Biox Systems Ltd. AquaFluxTM Model AF200. Available online: https://www.bioxsystems.com/products/aquaflux/ (accessed on 29 June 2020).
  37. Farahmand, S.; Tien, L.; Hui, X.; Maibach, H. Measuring transepidermal water loss: A comparative in vivo study of condenser-chamber, unventilated-chamber and open-chamber systems. Skin Res. Technol. 2009, 15, 392–398. [Google Scholar] [CrossRef] [PubMed]
  38. Episcan I-200. Available online: https://www.longportinc.com/episcan-i-200 (accessed on 6 July 2020).
  39. Lee, K.; Dretzke, J.; Grover, L.; Logan, A.; Moiemen, N. A systematic review of objective burn scar measurements. Burns Trauma 2016, 4, 14. [Google Scholar] [CrossRef] [PubMed] [Green Version]
  40. Hughes, M.; Moore, T.; Manning, J.; Dinsdale, G.; Herrick, A.; Murray, A. A pilot study using highfrequency ultrasound to measure digital ulcers: A possible outcome measure in systemic sclerosis clinical trials? Clin. Exp. Rheumatol. 2017, 35, S218–S219. [Google Scholar]
  41. Rohrbach, D.; Muffoletto, D.; Huihui, J.; Saager, R.; Keymel, K.; Paquette, A.; Morgan, J.; Zeitouni, N.; Sunar, U. Preoperative Mapping of Nonmelanoma Skin Cancer Using Spatial Frequency Domain and Ultrasound Imaging. Acad. Radiol. 2014, 21, 263–270. [Google Scholar] [CrossRef] [PubMed] [Green Version]
  42. Murray, A.; Moore, T.; Manning, J.; Dinsdale, G.; Wilkinson, J.; Bhushan, M.; Griffiths, C.; Herrick, A. Non-invasive imaging of localised scleroderma for assessment of skin blood flow and structure. Acta Derm.-Venereol. 2016, 96, 641–644. [Google Scholar] [CrossRef] [PubMed] [Green Version]
  43. Chalkidou, A.; O’Doherty, M.; Marsden, P. False discovery rates in PET and CT studies with texture features: A systematic review. PLoS ONE 2015, 10, e0124165. [Google Scholar] [CrossRef] [Green Version]
  44. Kim, Y.S.; Lee, K.W.; Kim, J.S.; Gil, Y.C.; Tanvaa, T.; Shin, D.; Kim, H.J. Regional thickness of facial skin and superficial fat: Application to the minimally invasive procedures. Clin. Anat. 2019, 32, 1008–1018. [Google Scholar] [CrossRef]
  45. Kelleher, M.; Dunn-Galvin, A.; Hourihane, J.O.B.; Murray, D.; Campbell, L.E.; McLean, W.H.I.; Irvine, A.D. Skin barrier dysfunction measured by transepidermal water loss at 2 days and 2 months predates and predicts atopic dermatitis at 1 year. J. Allergy Clin. Immunol. 2015, 135, 930–935. [Google Scholar] [CrossRef] [Green Version]
  46. Mukherjee, S.; Mitra, R.; Maitra, A.; Gupta, S.; Kumaran, S.; Chakrabortty, A.; Majumder, P. Sebum and Hydration Levels in Specific Regions of Human Face Significantly Predict the Nature and Diversity of Facial Skin Microbiome. Sci. Rep. 2016, 6, 36062. [Google Scholar] [CrossRef]
  47. Machado, M.; Salgado, T.; Hadgraft, J.; Lane, M. The relationship between transepidermal water loss and skin permeability. Int. J. Pharm. 2010, 384, 73–77. [Google Scholar] [CrossRef]
  48. Hadgraft, J.; Lane, M.E. Transepidermal Water Loss and Skin Site: A Hypothesis. Int. J. Pharm. 2009, 373, 1–3. [Google Scholar] [CrossRef] [PubMed]
Figure 1. The six facial regions considered in the study: (1) cheeks, (2) chin, (3) forehead, (4) lips, (5) neck and (6) nose.
Applsci 10 06139 g001
Figure 2. EpsilonTM E100 multi-sensor corneometer (left) and sample scans (right).
Applsci 10 06139 g002
Figure 3. AquaFluxTM AF200 evaporimeter. Overall view of the device (left) and scheme of the measuring chamber (right).
Applsci 10 06139 g003
Figure 4. Episcan I-200 ultrasonic dermal scanner (left) and sample scans (right).
Applsci 10 06139 g004
Figure 5. Box-plots/strip-plots showing the water content and trans-epidermal water loss at the six facial sites.
Applsci 10 06139 g005
Figure 6. Results of the cluster analysis on the distribution of water content. From left to right, in descending order of water content: (1) cheeks, chin and neck; (2) chin, forehead, neck and nose; and (3) forehead, lips and nose.
Applsci 10 06139 g006
Figure 7. Cluster analysis on the distribution of TEWL returned only one cluster of statistically indistinguishable areas: neck and nose.
Applsci 10 06139 g007
Figure 8. Box-plots/strip-plots of the thickness by skin layer and facial area.
Applsci 10 06139 g008
Figure 9. Cluster analysis on the distribution of the skin thickness in the stratum corneum, epidermis and dermis. In each subfigure the clusters are shown from left to right in descending order of average thickness.
Applsci 10 06139 g009aApplsci 10 06139 g009b
Table 1. Descriptive statistics of the water content, trans-epidermal water loss and skin thickness at the six facial sites. Data format is mean ± standard deviation (median, inter-quartile range).
(a)
AreaWater ContentTEWL
[ ϵ , a.u.][g/m2h]
Cheek26.5 ± 7.4 (24.2, 11.3)20.4 ± 11.9 (17.6, 9.9)
Chin25.3 ± 7.0 (23.2, 8.9)32.3 ± 15.5 (30.1, 14.5)
Forehead24.0 ± 6.4 (22.6, 11.2)27.2 ± 17.7 (21.9, 10.2)
Lips21.8 ± 5.8 (20.9, 8.2)66.9 ± 23.6 (71.0, 27.5)
Neck26.2 ± 8.2 (25.0, 7.2)15.7 ± 10.6 (12.9, 9.8)
Nose23.1 ± 4.7 (22.1, 6.4)37.5 ± 15.2 (35.3, 12.8)
(b)
Thickness [μm]
SCEpidermisDermis
Cheek27.6 ± 13.0 (20.0, 10.0)51.8 ± 21.2 (50.0, 40.0)1610.8 ± 742.1 (1525.0, 452.5)
Chin26.3 ± 10.7 (20.0, 10.0)65.4 ± 25.9 (70.0, 30.0)1837.1 ± 479.7 (1840.0, 610.0)
Forehead24.6 ± 10.1 (20.0, 10.0)53.7 ± 22.6 (50.0, 30.0)1569.0 ± 292.6 (1550.0, 270.0)
Lips32.4 ± 16.3 (30.0, 20.0)73.9 ± 33.6 (80.0, 40.0)1320.1 ± 530.3 (1220.0, 705.0)
Neck32.8 ± 12.8 (30.0, 20.0)77.4 ± 36.5 (80.0, 50.0)1267.4 ± 320.7 (1220.0, 485.0)
Nose27.0 ± 12.9 (20.0, 10.0)64.3 ± 32.2 (70.0, 40.0)1820.6 ± 563.5 (1740.0, 885,0)
Table 2. Water content and TEWL: results of the pairwise comparisons (p-value) between the six facial areas. Significant differences ( α * = 3.3 × 10 3 ) are highlighted.
(a) Water Content
ChinF’headLipsNeckNose
Cheeks0.2 4 × 10 4 4 × 10 7 0.9 6 × 10 4
Chin 7 × 10 2 2 × 10 4 0.4 3 × 10 2
F’head 8 × 10 3 4 × 10 2 0.5
Lips 8 × 10 5 4 × 10 2
Neck 6 × 10 3
(b) TEWL
ChinF’headLipsNeckNose
Cheeks 1 × 10 11 6 × 10 5 3 × 10 20 6 × 10 3 3 × 10 13
Chin 3 × 10 4 4 × 10 13 1 × 10 8 0.01
F’head 5 × 10 15 7 × 10 6 2 × 10 7
Lips 8 × 10 12 9 × 10 10
Neck 1 × 10 8
Table 3. Thickness of the stratum corneum, epidermis and dermis: results of the pairwise comparisons (p-value) between the six facial areas. Highlighted figures indicate significant differences ( α * = 3.3 × 10 3 ).
(a) Stratum Corneum
ChinF’headLipsNeckNose
Cheeks 6.2 × 10 1 8.7 × 10 2 1.7 × 10 3 5.3 × 10 5 7.3 × 10 1
Chin 2.9 × 10 1 1.1 × 10 3 4.6 × 10 5 8.5 × 10 1
F’head 3.0 × 10 6 4.3 × 10 8 1.6 × 10 1
Lip 3.5 × 10 1 3.4 × 10 4
Neck 8.1 × 10 6
(b) Epidermis
ChinF’headLipsNeckNose
Cheeks 3.7 × 10 6 4.8 × 10 1 5 × 10 12 5 × 10 12 9.3 × 10 5
Chin 1.1 × 10 4 2.7 × 10 2 3.1 × 10 3 5.6 × 10 1
F’head 3.7 × 10 9 1.7 × 10 9 1.6 × 10 3
Lip 2.6 × 10 1 2.8 × 10 3
Neck 1.9 × 10 4
(c) Dermis
ChinF’headLipsNeckNose
Cheeks 7.6 × 10 7 7.7 × 10 1 9.3 × 10 8 5 × 10 12 6.3 × 10 5
Chin 8.2 × 10 8 8 × 10 14 2 × 10 22 6.9 × 10 1
Forehead 1.3 × 10 9 1 × 10 15 2.8 × 10 4
Lip 7.9 × 10 1 6 × 10 14
Neck 2 × 10 19

