Testing and Fatigue Life Assessment of Timber Truck Stanchions


Abstract
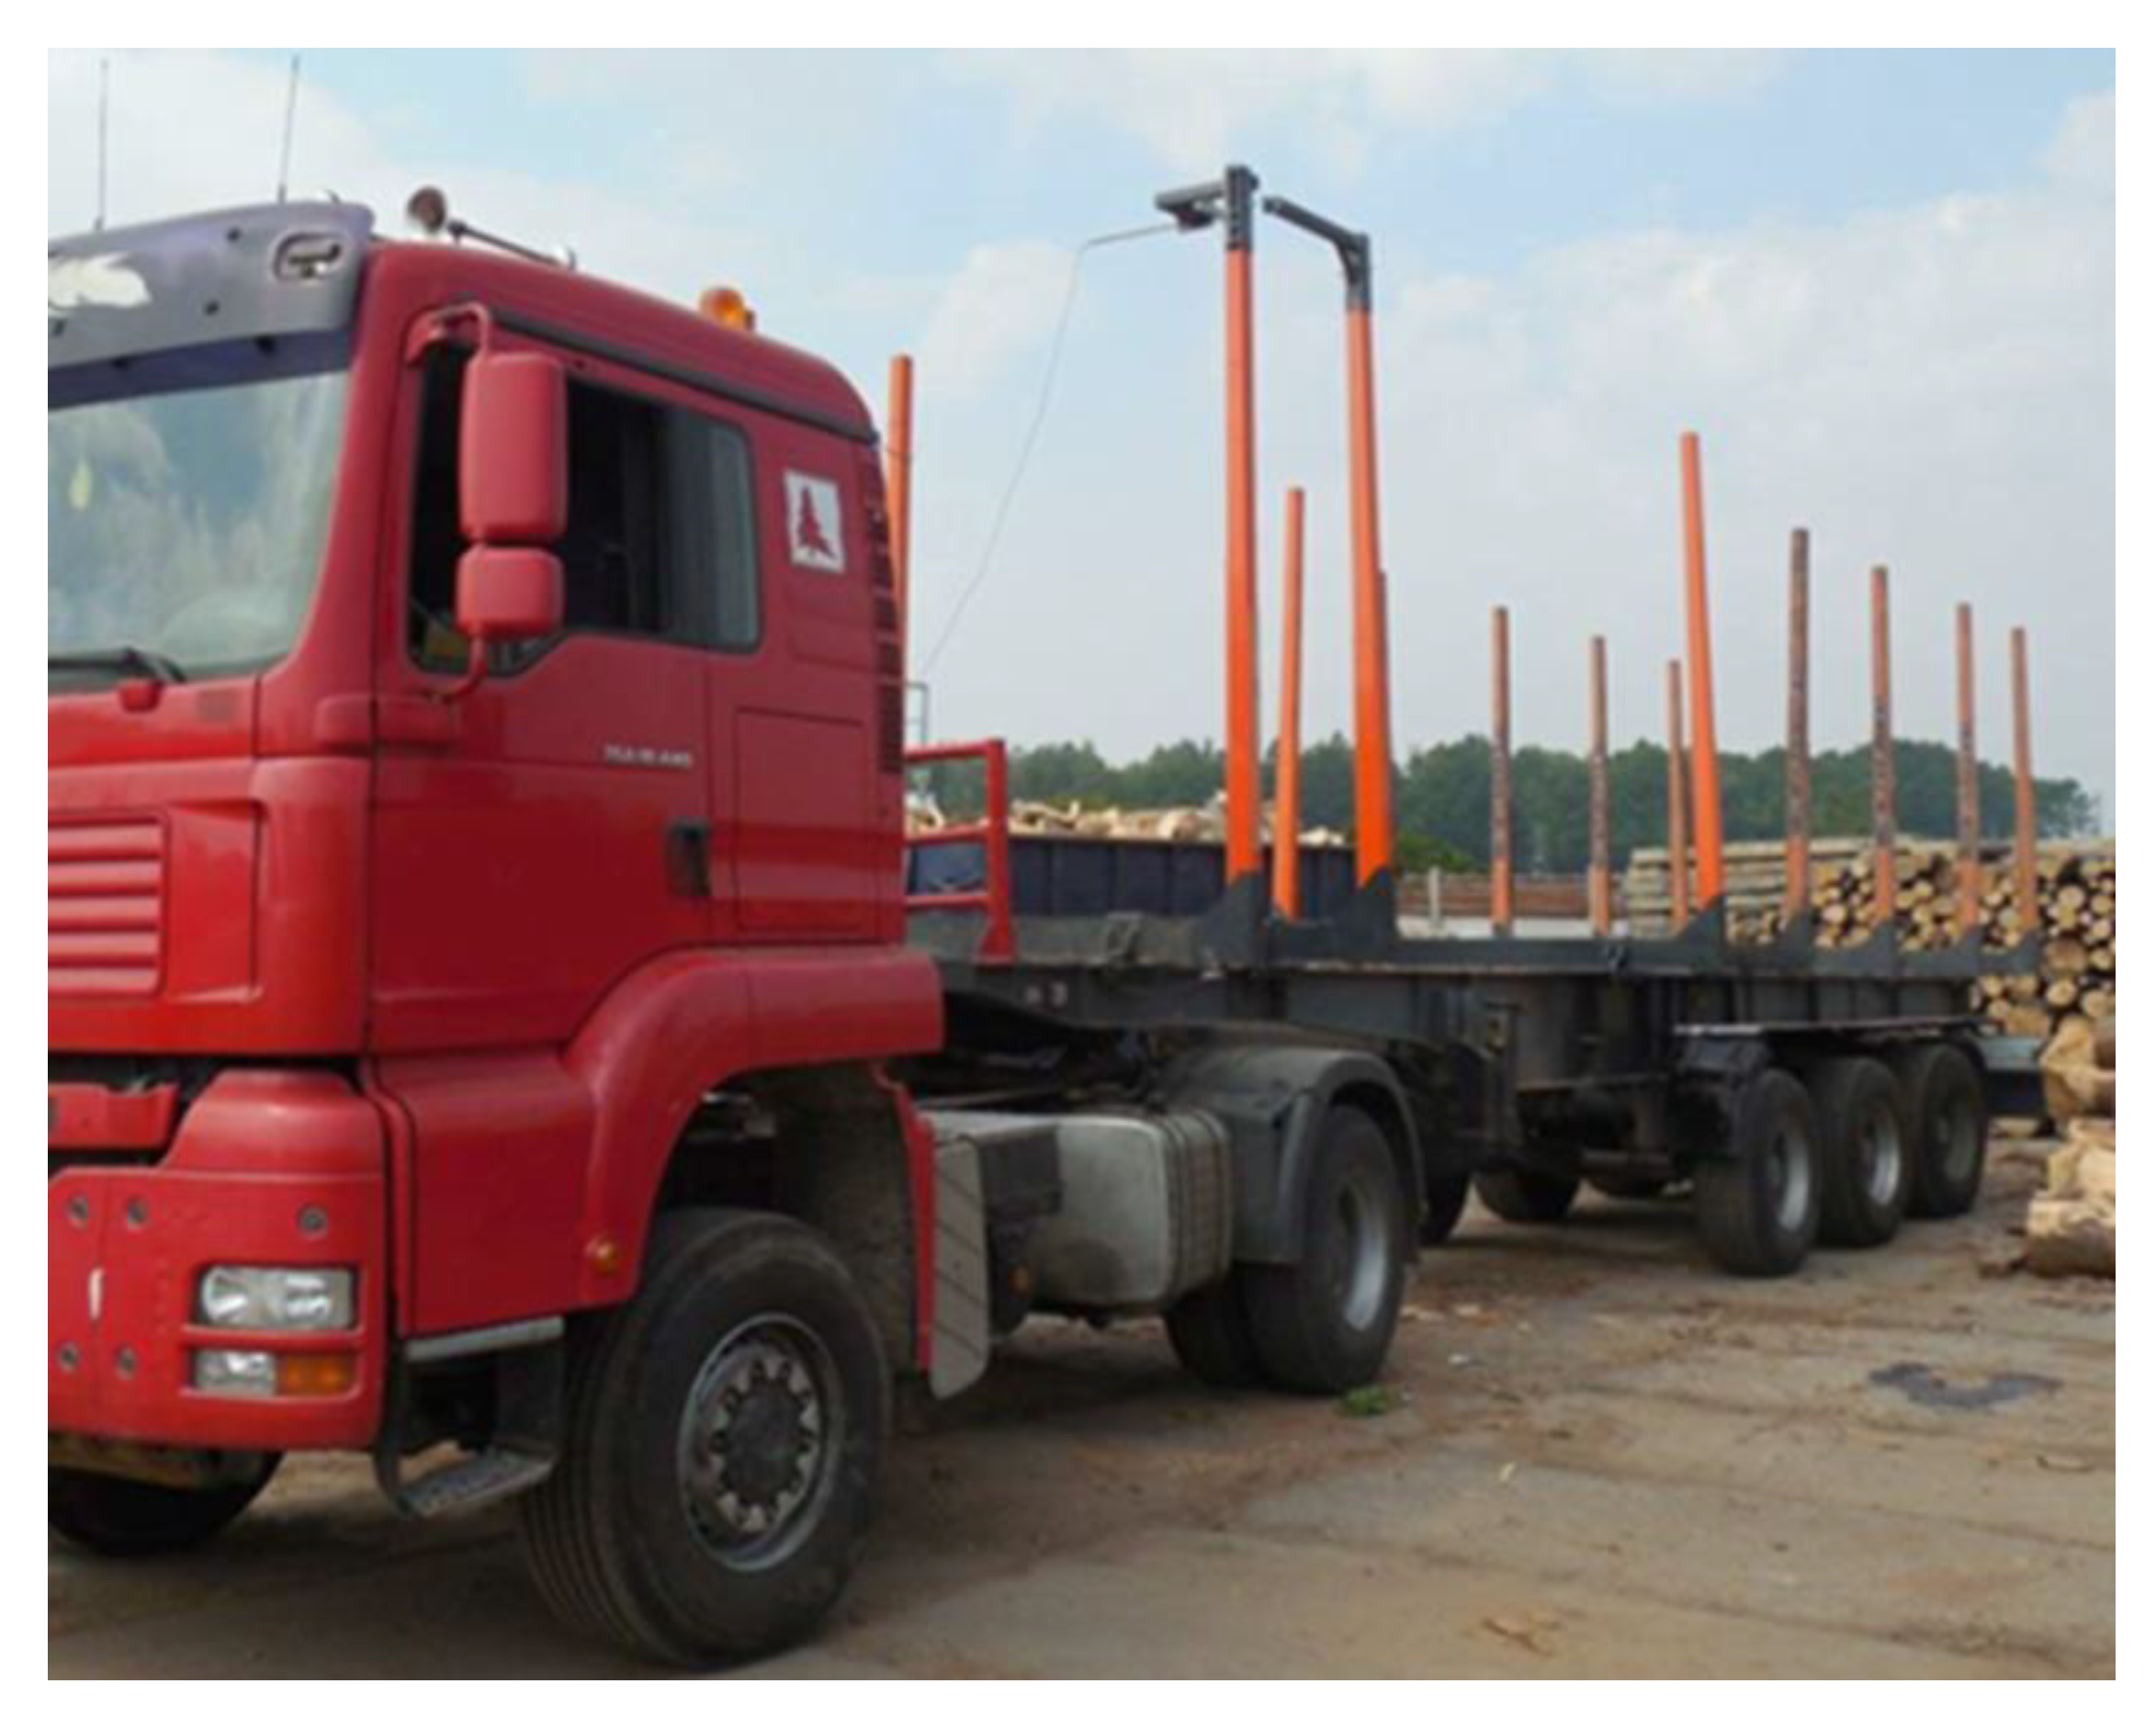
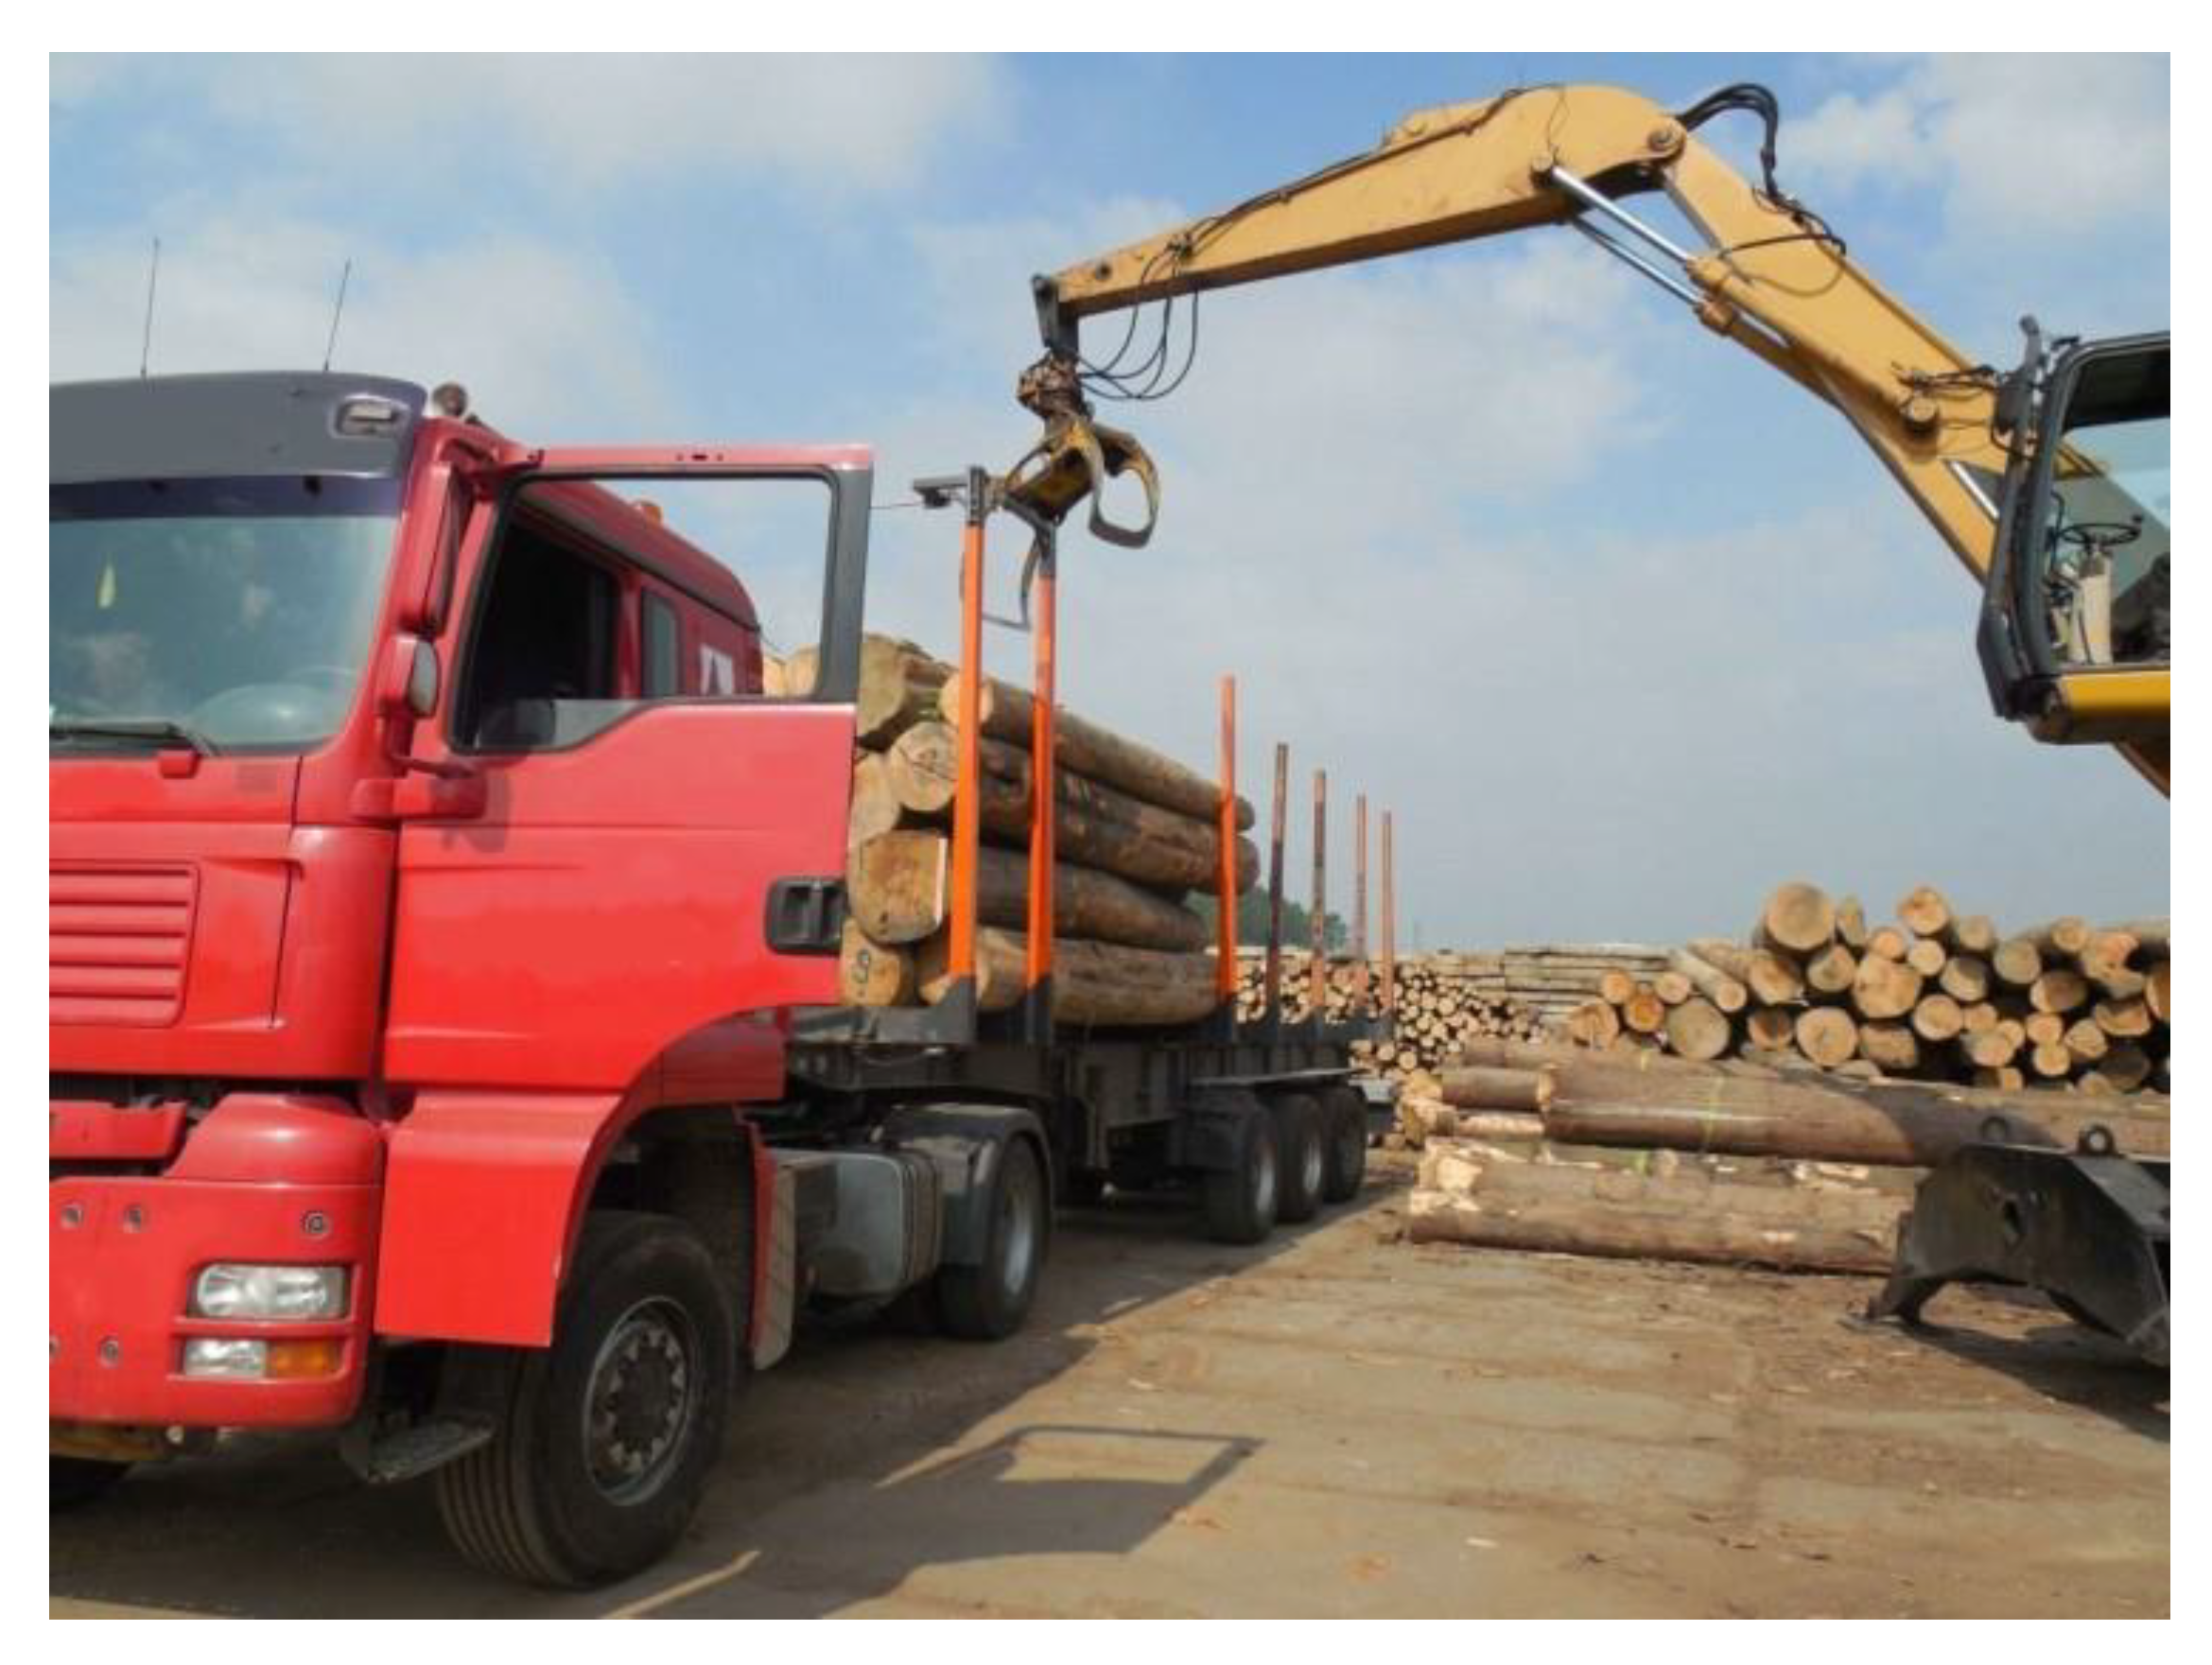
1. Introduction
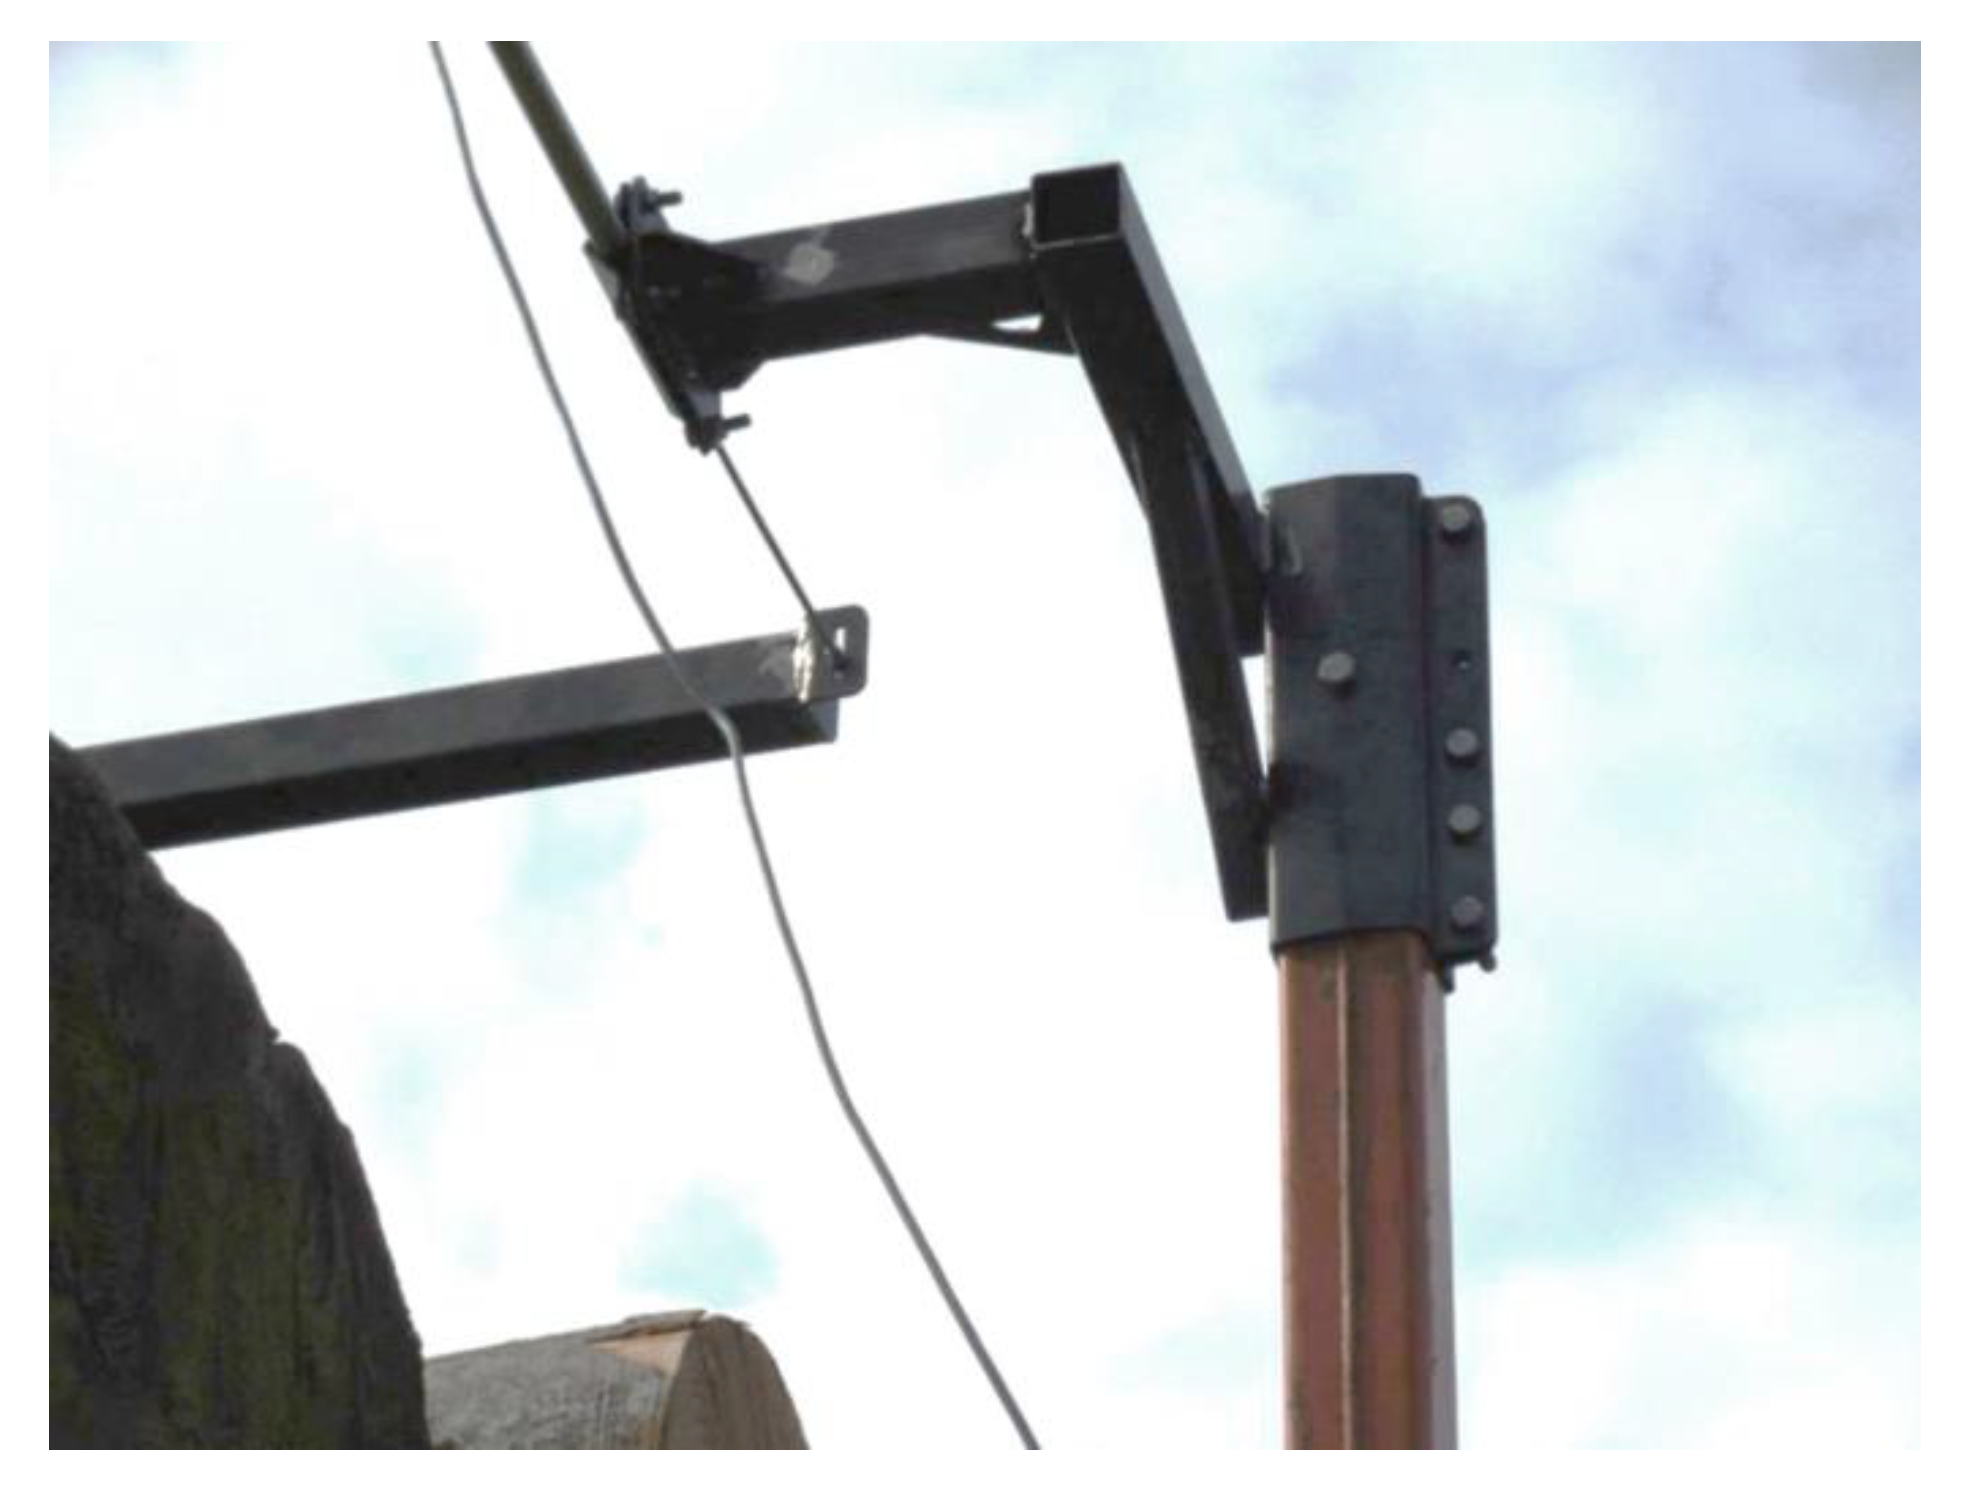
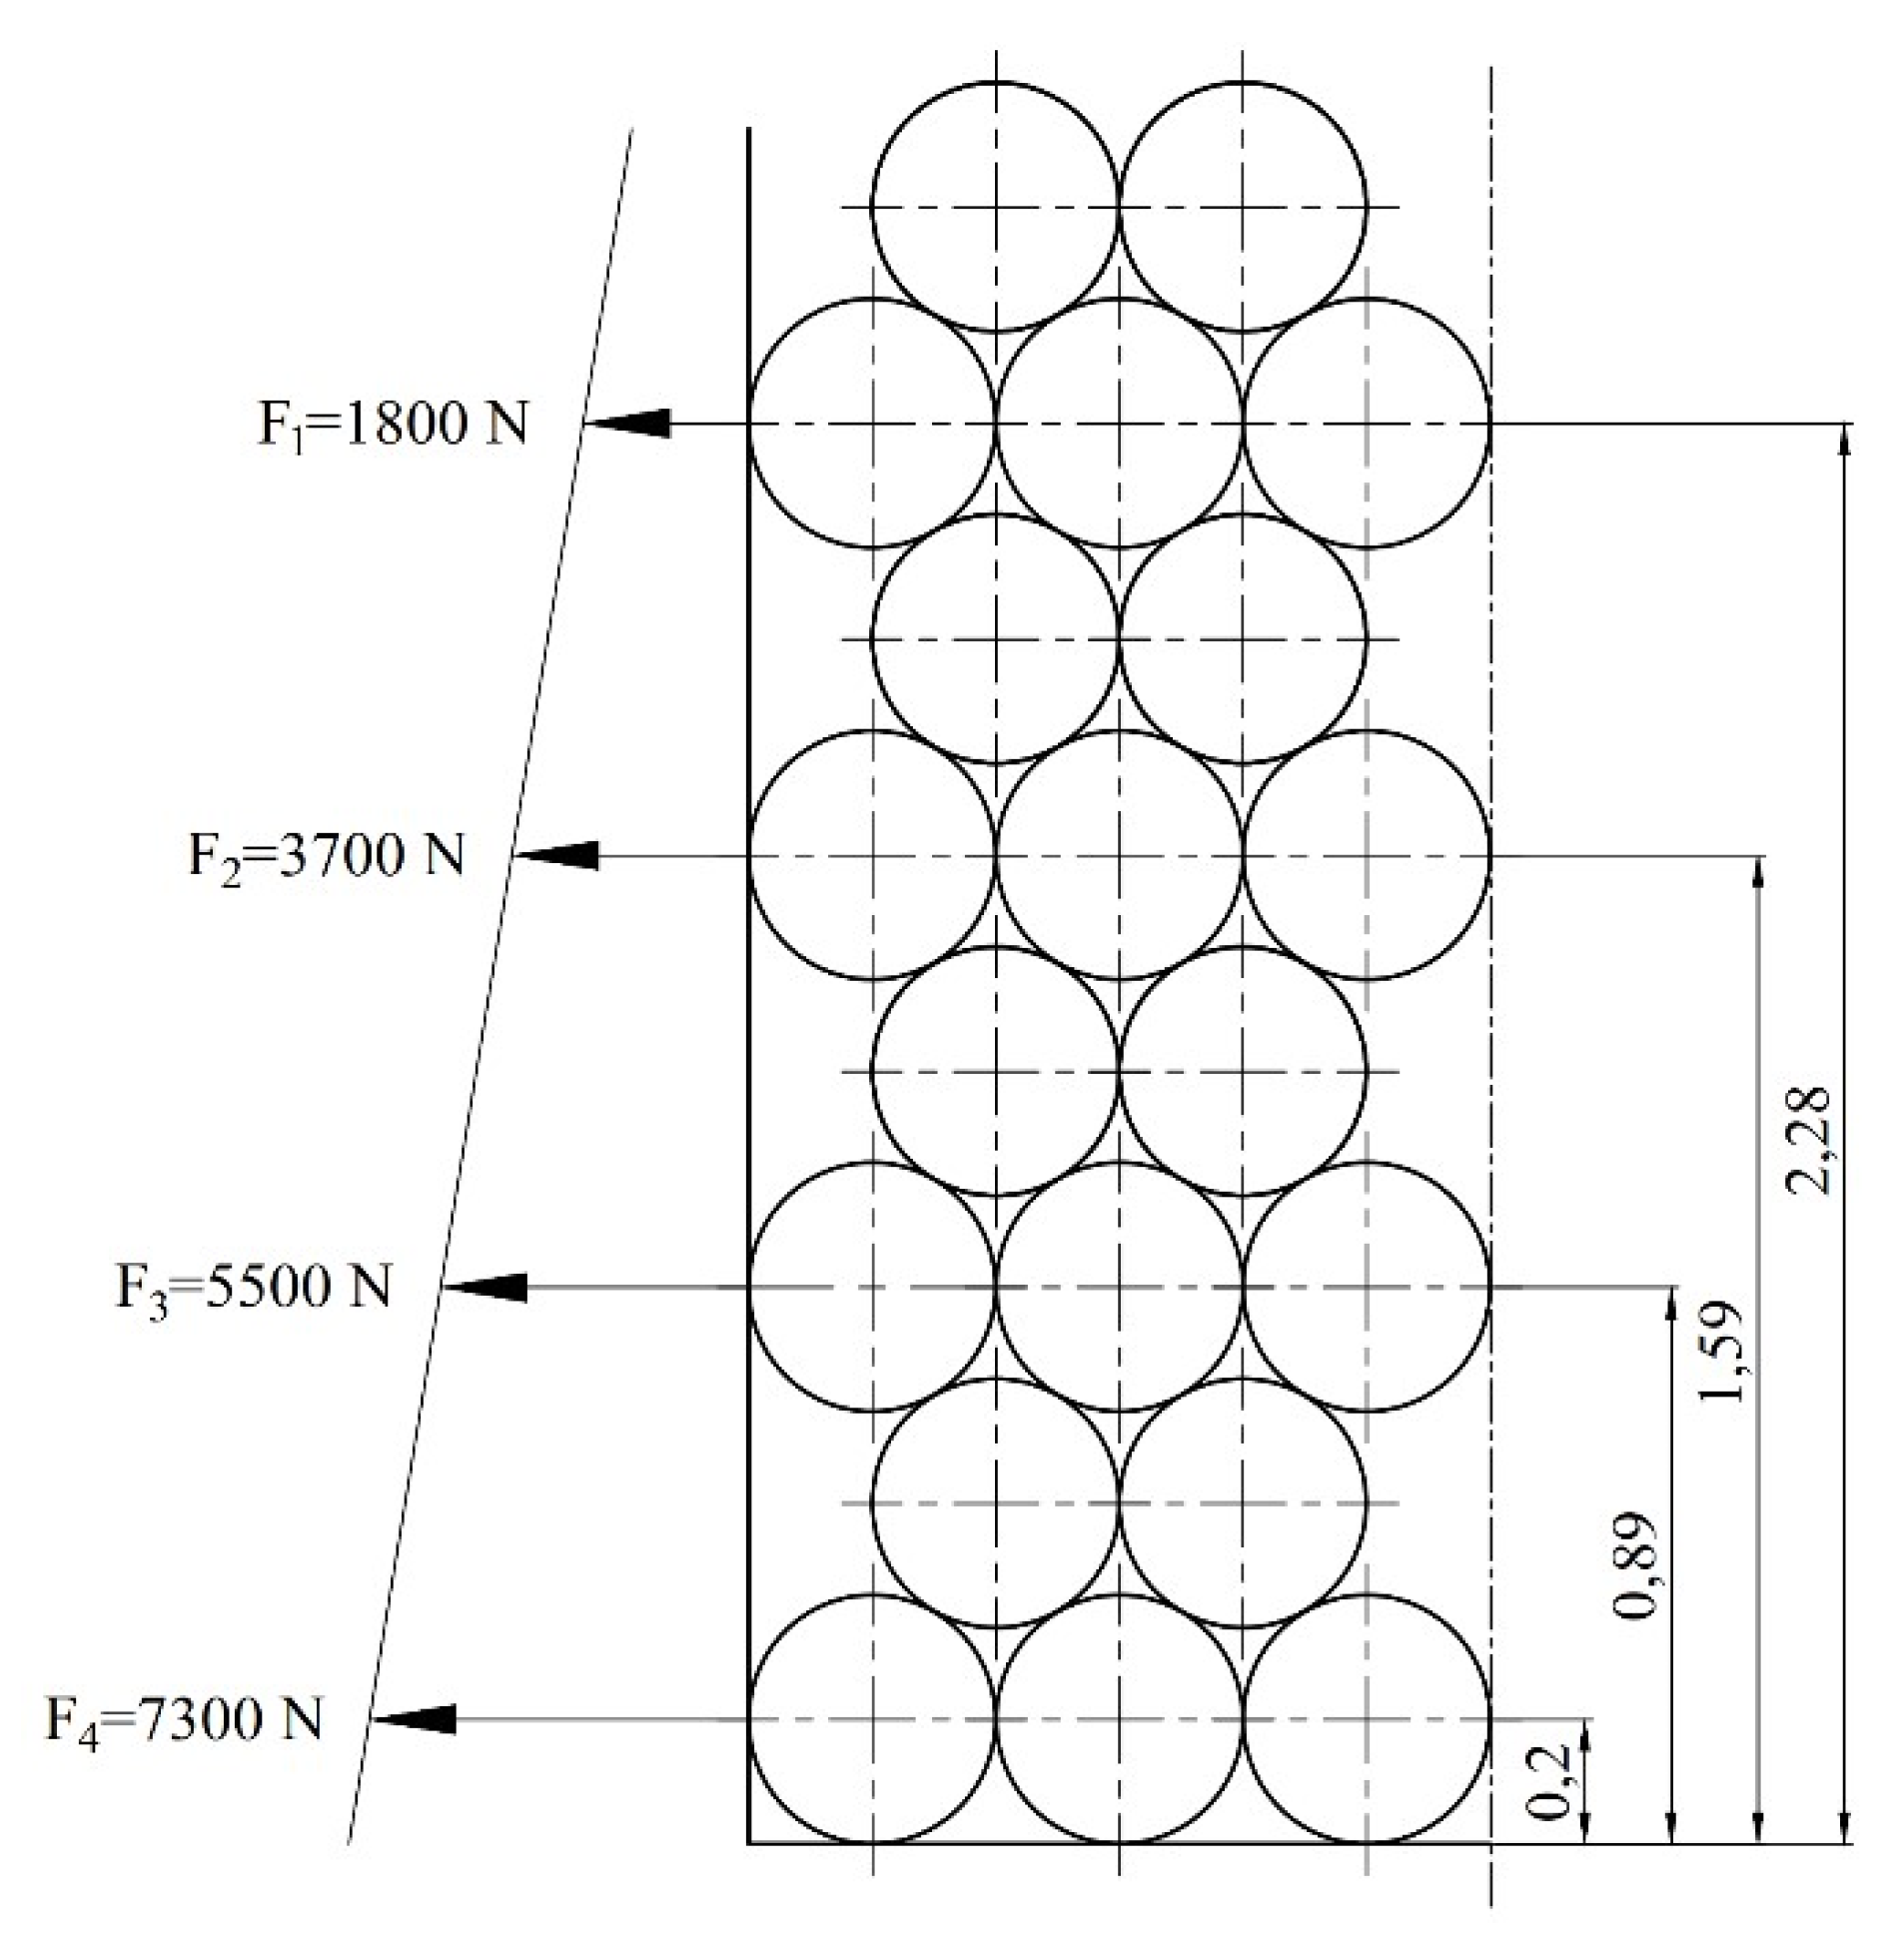
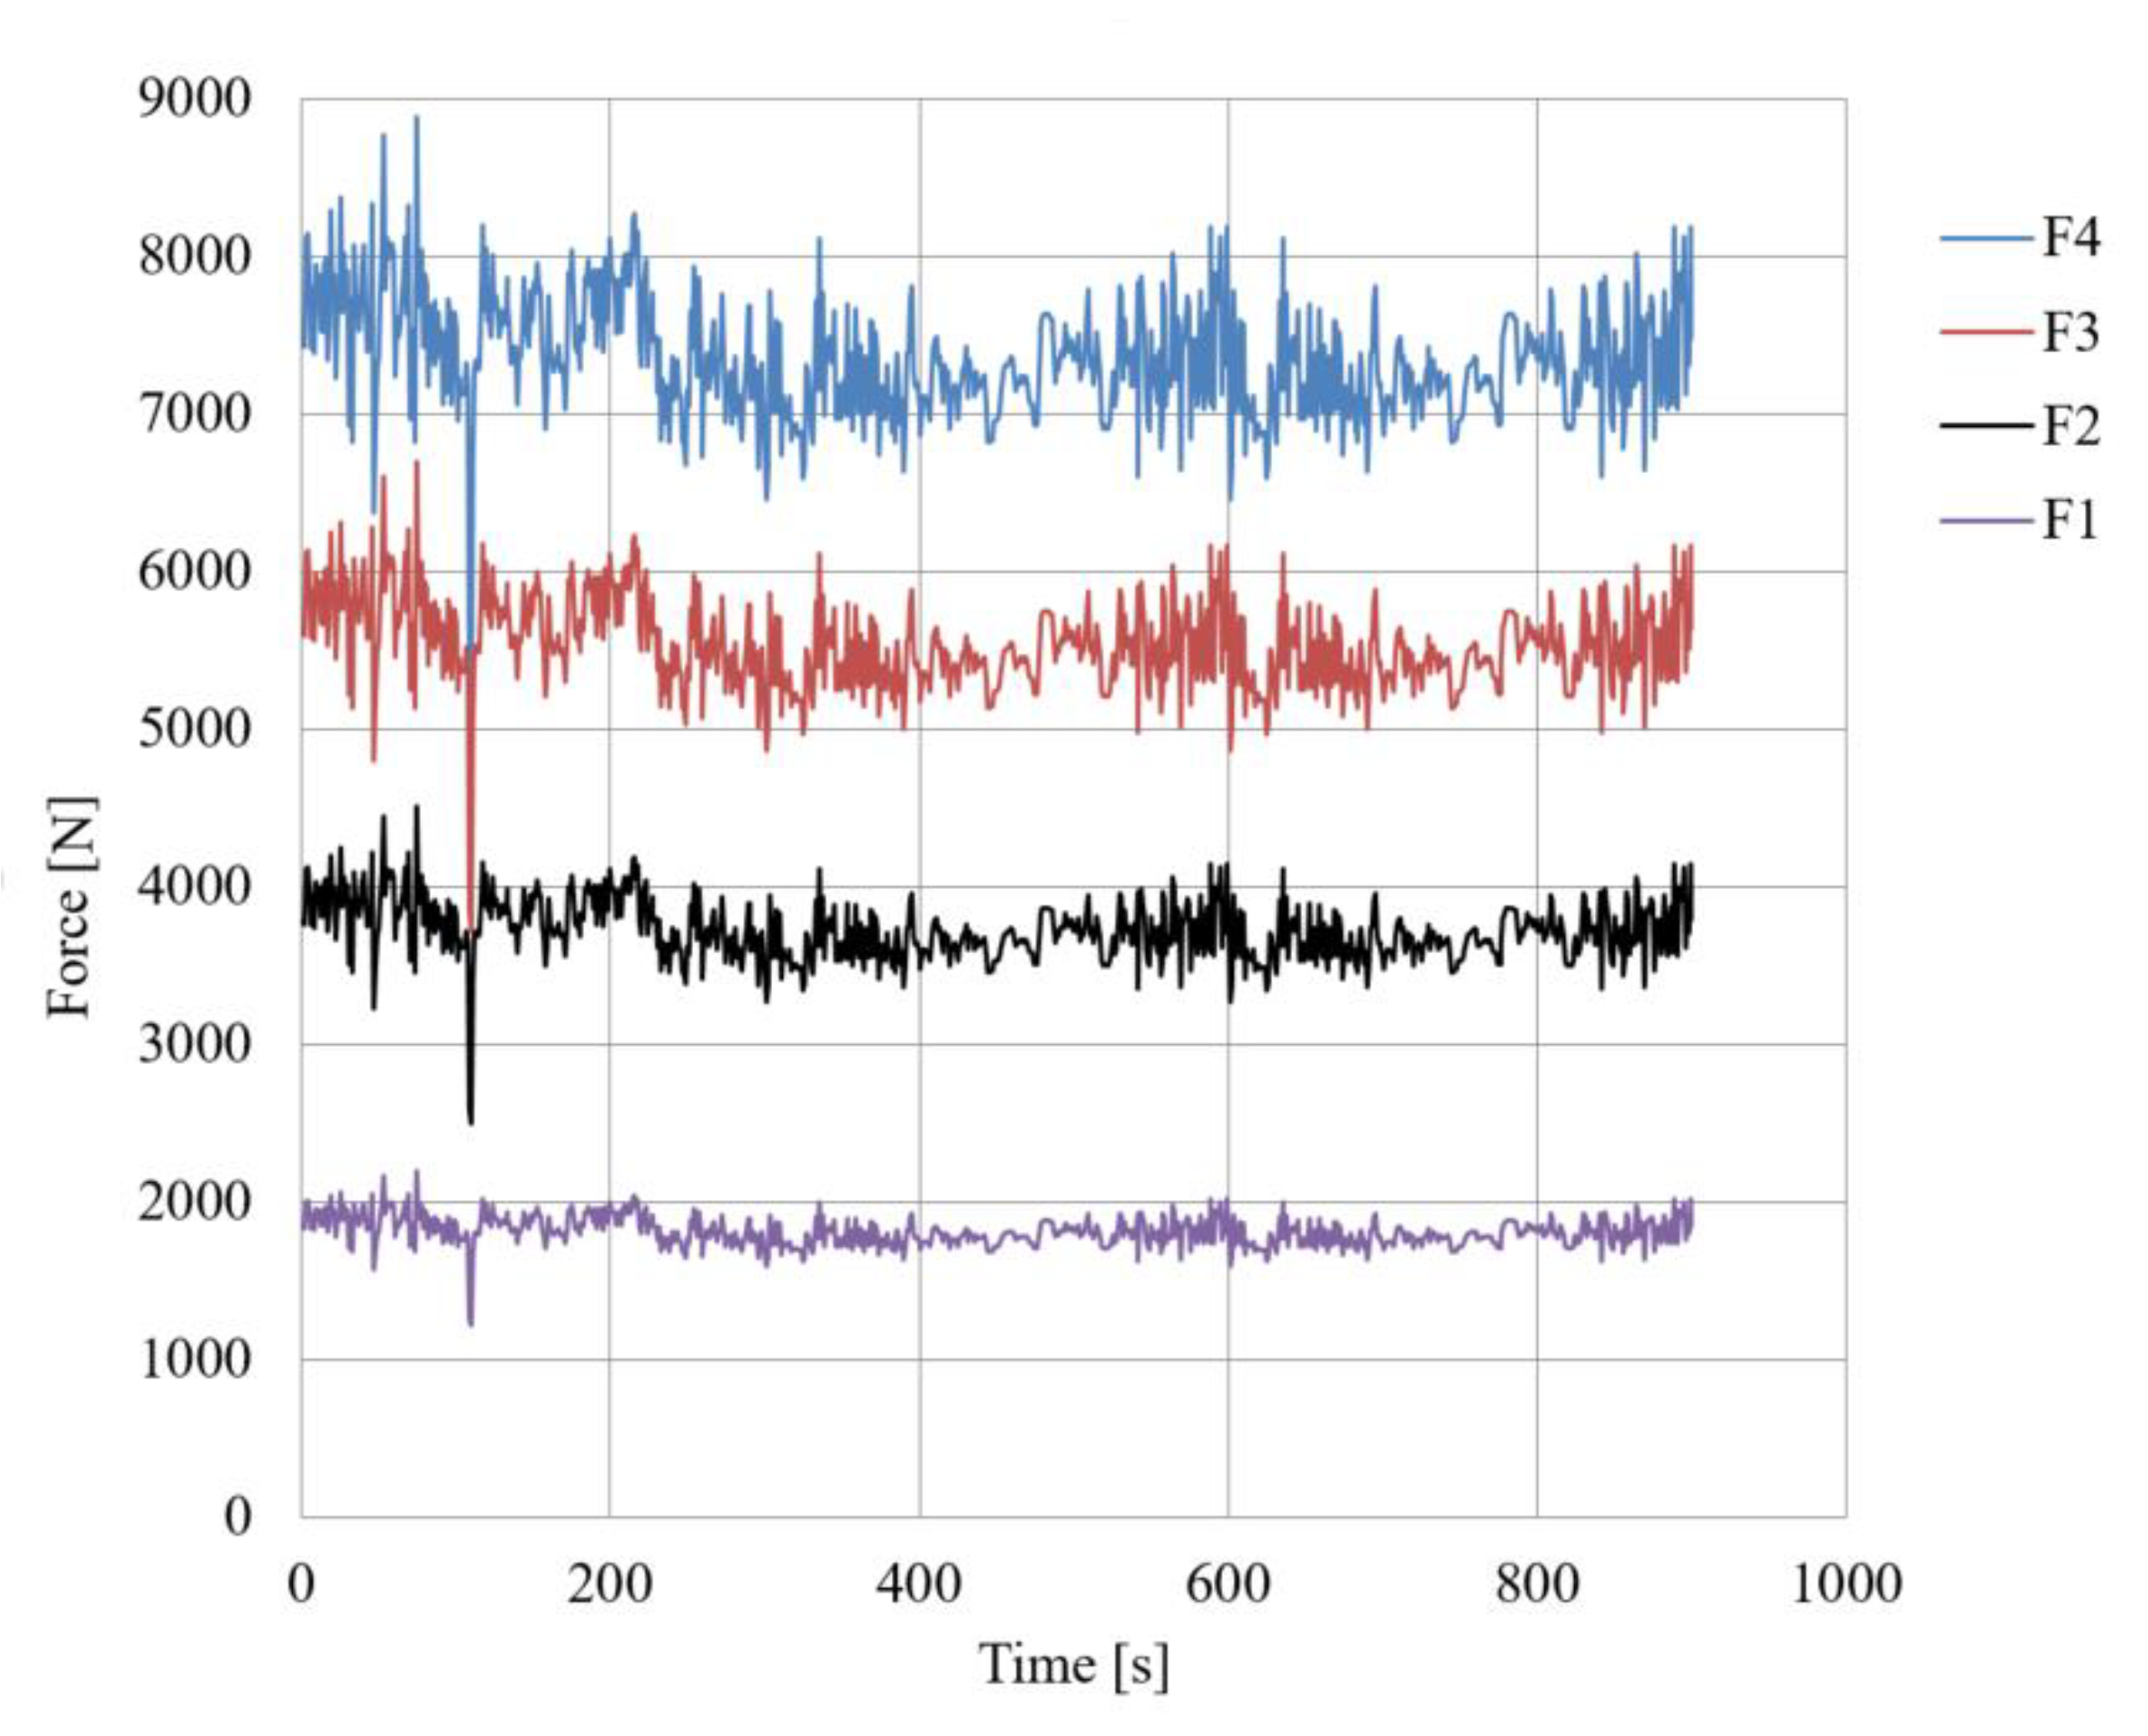
2. Experimental Load History Data Collection
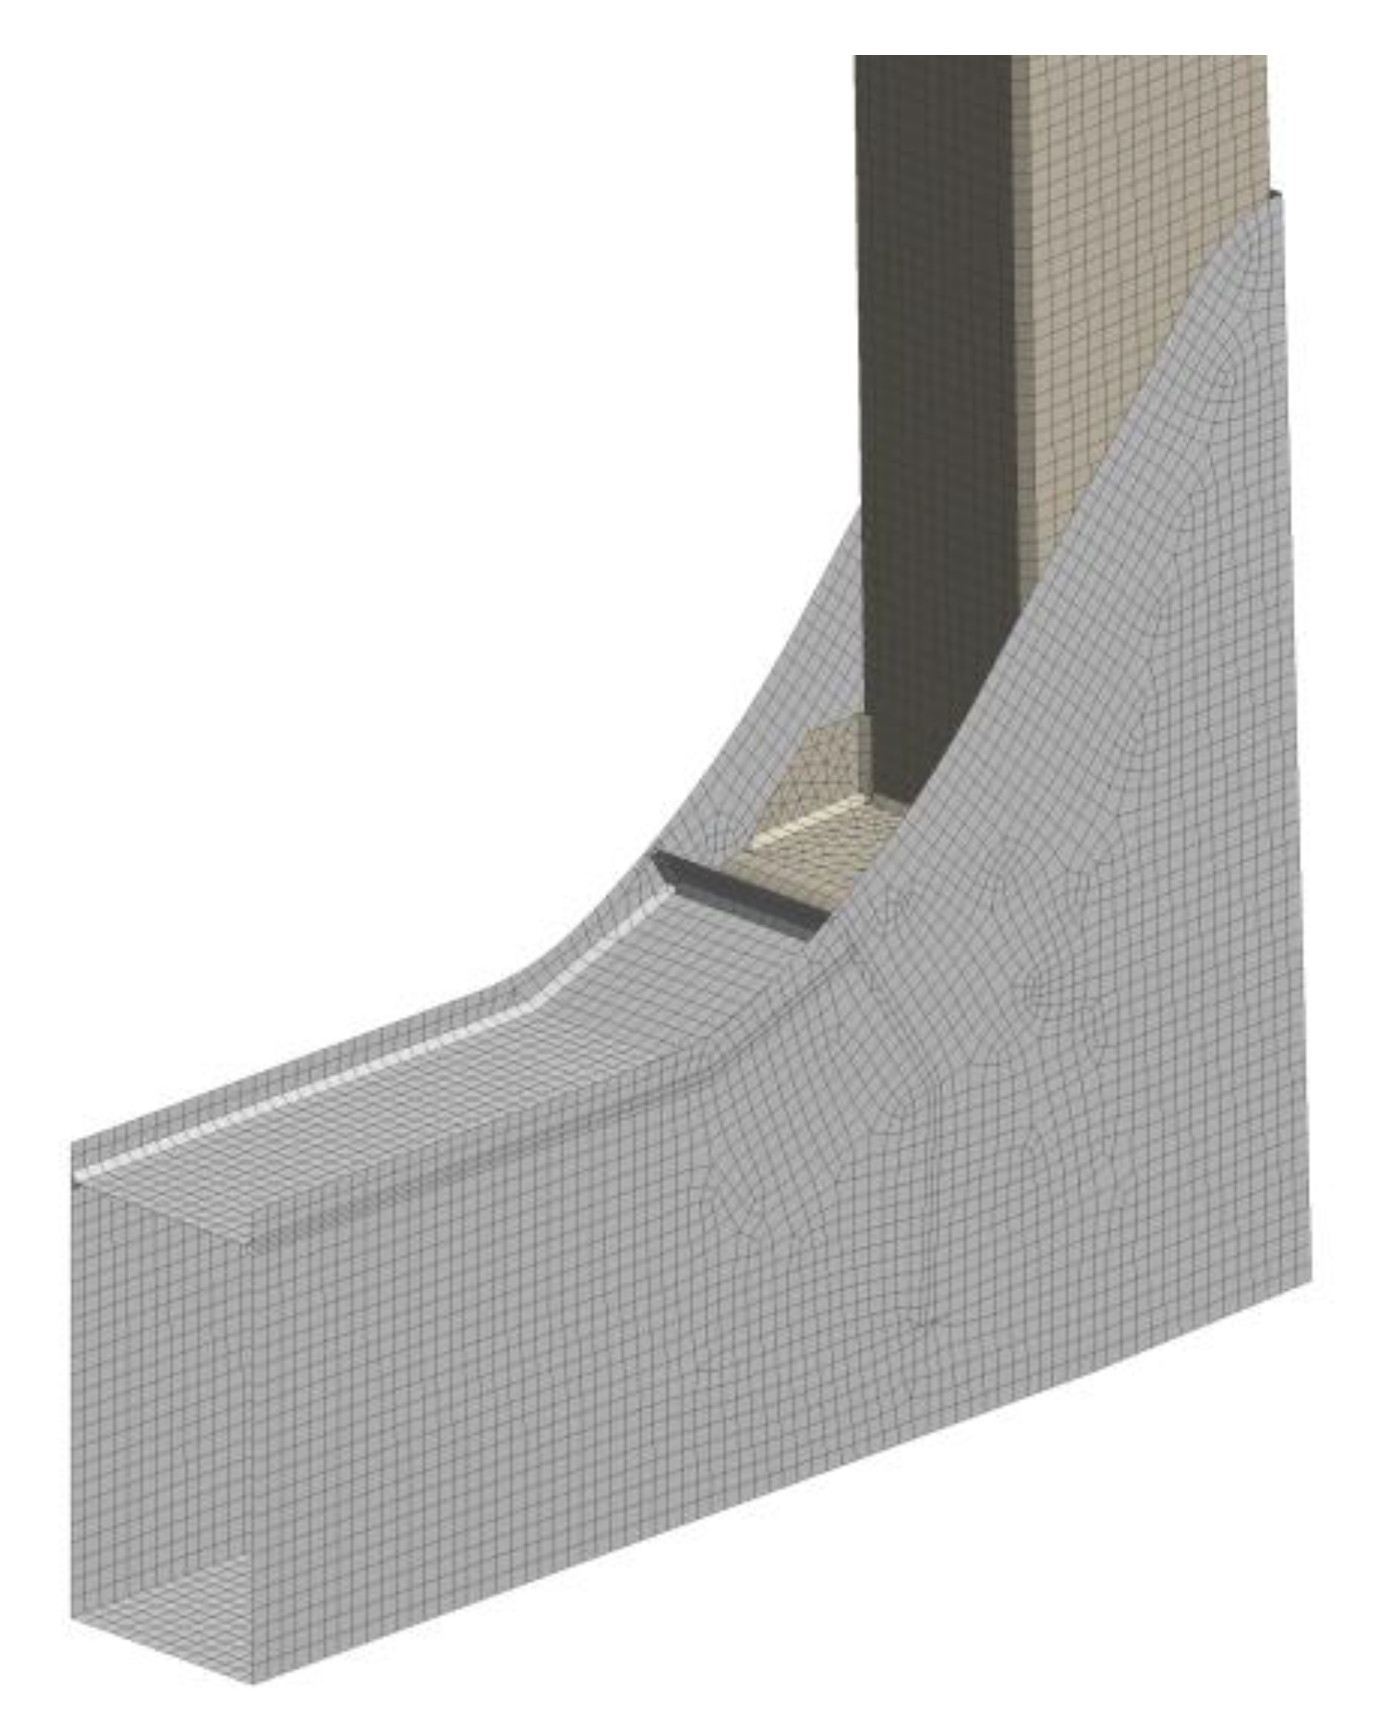
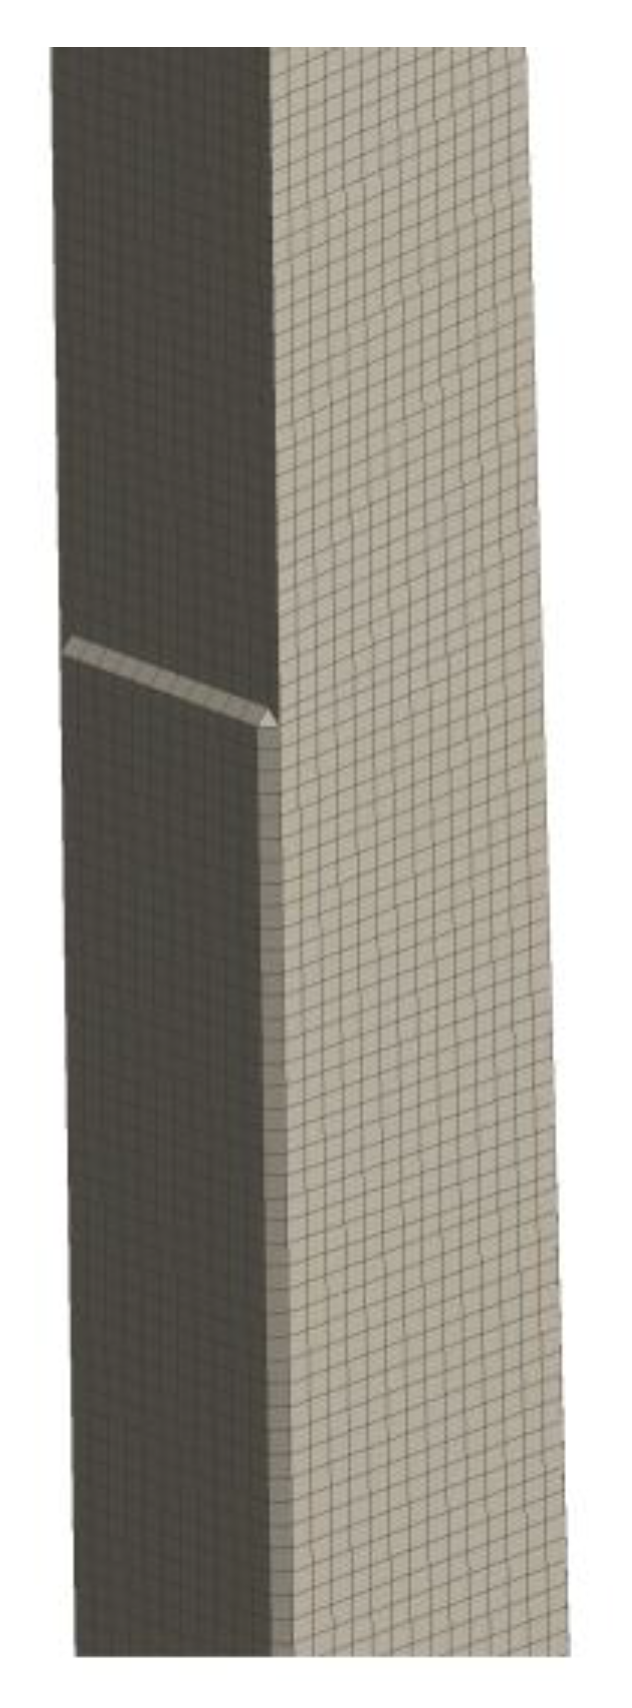
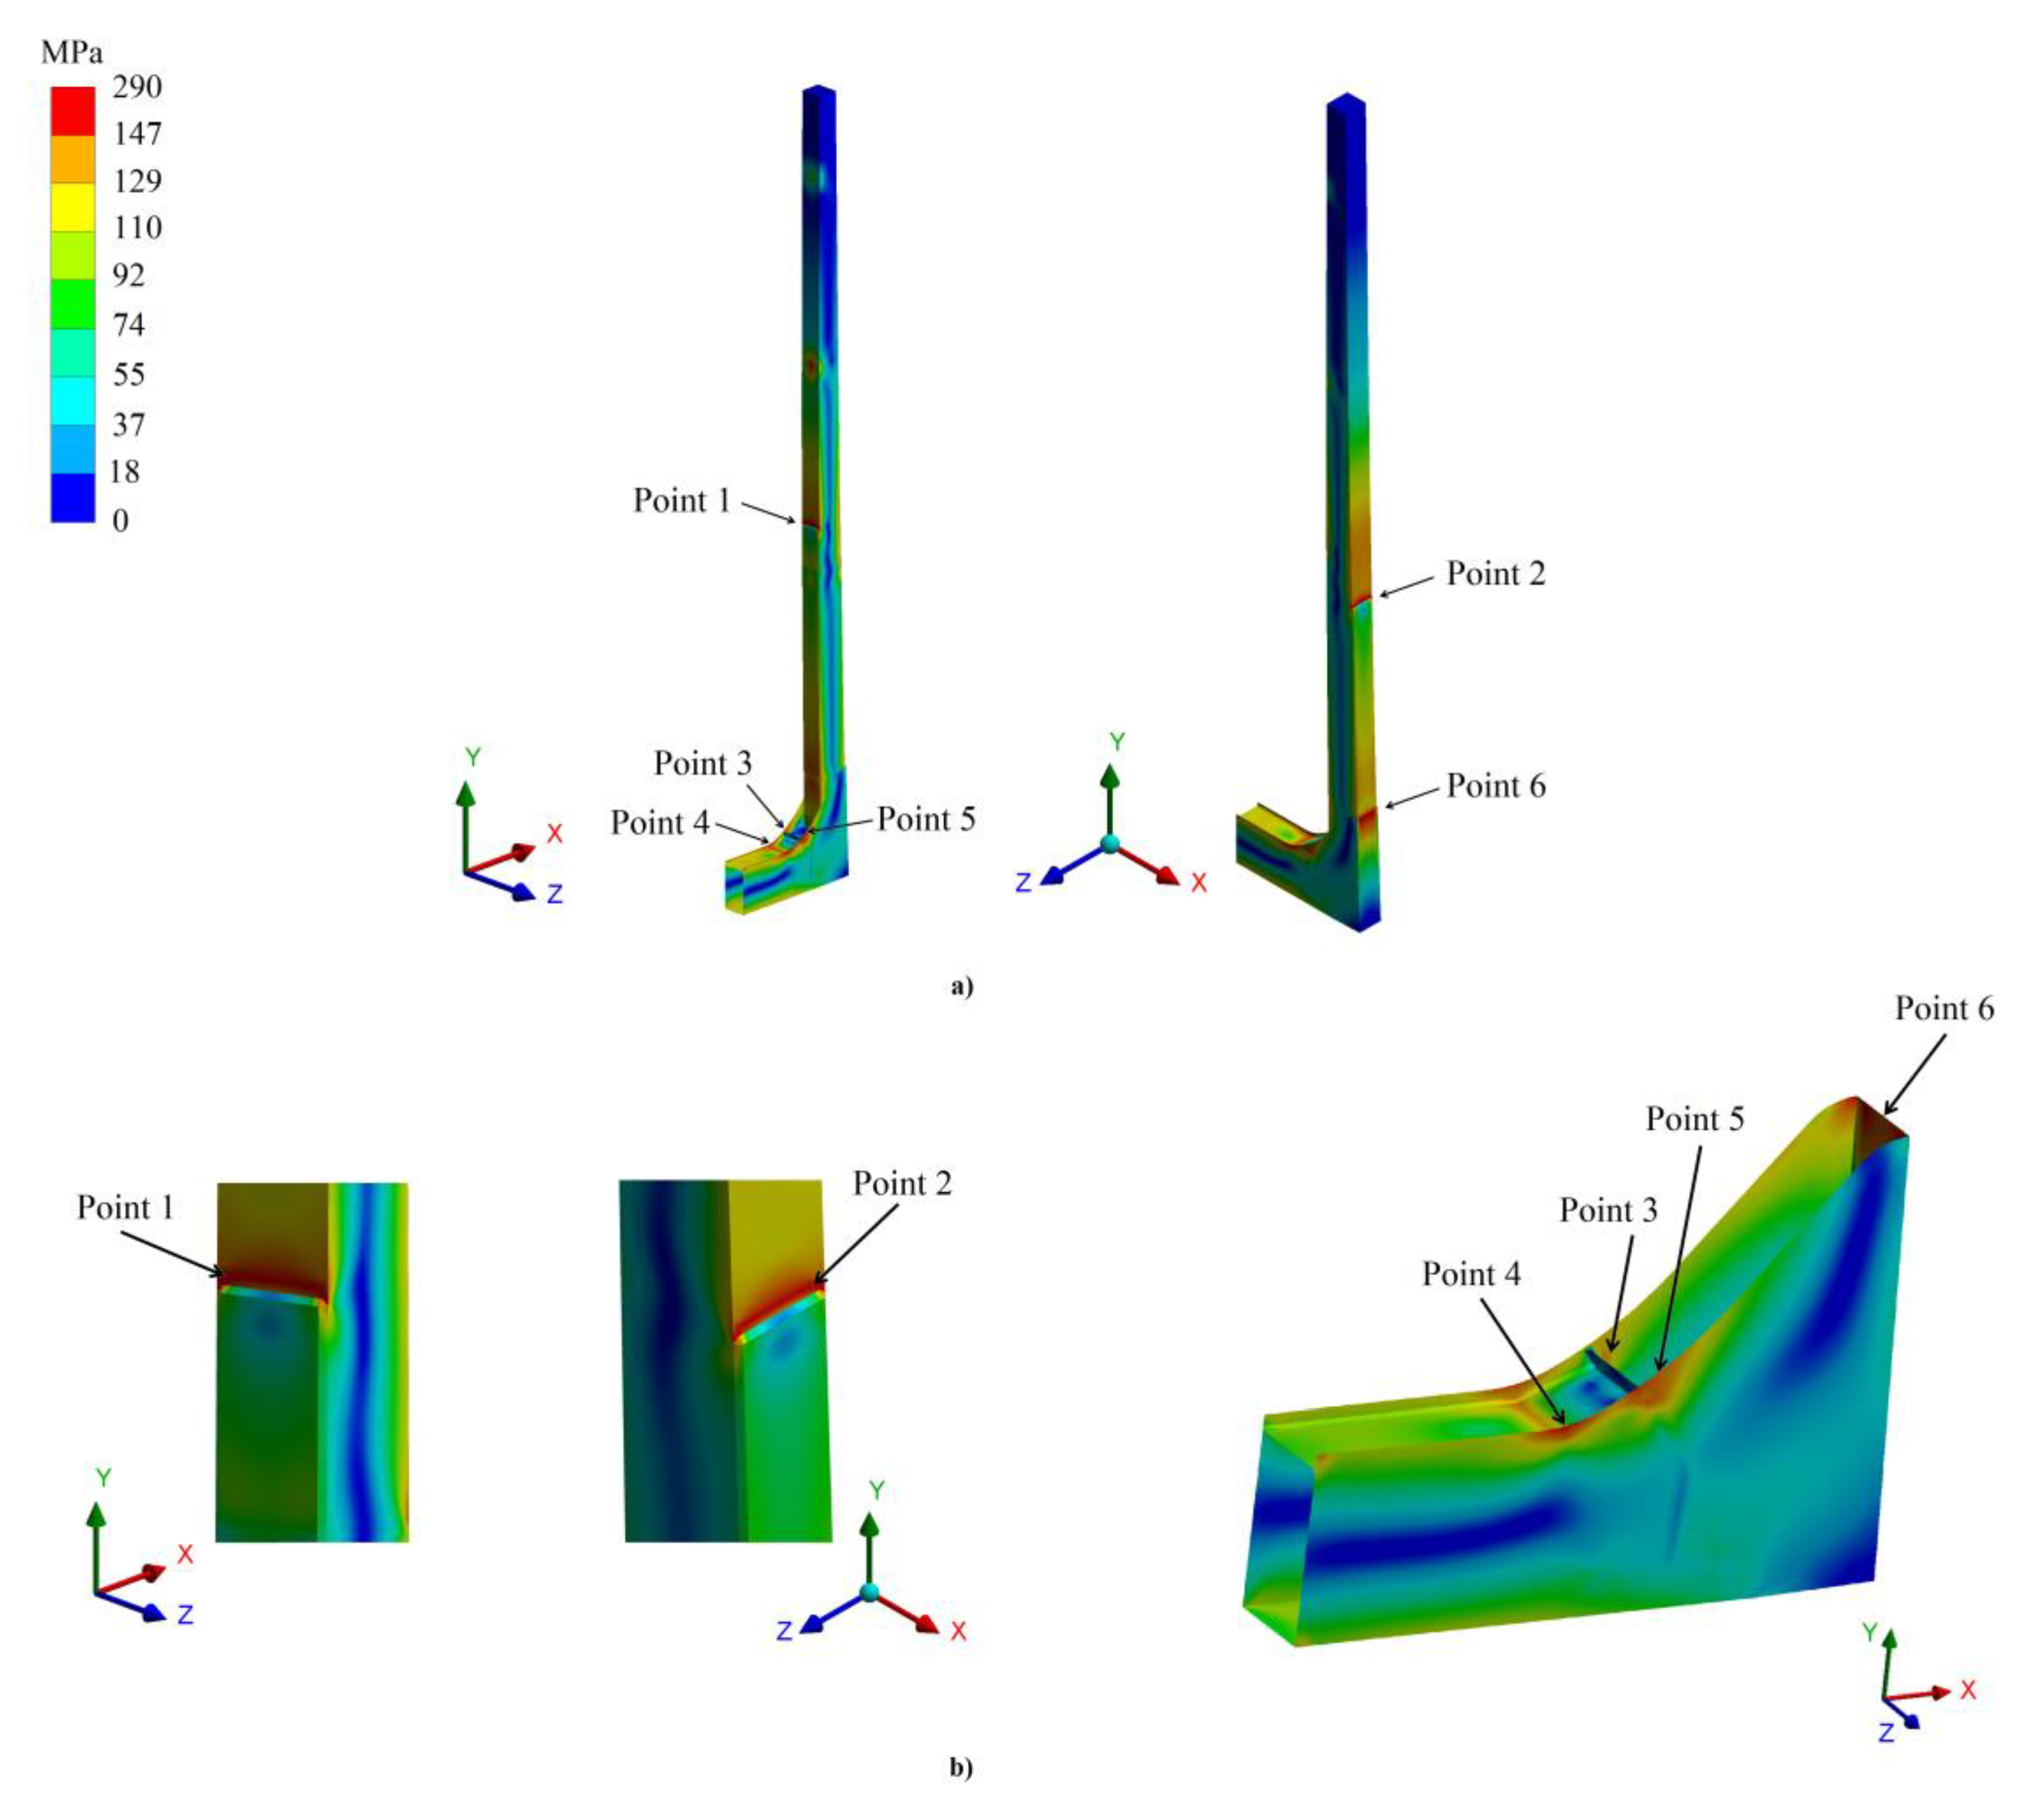
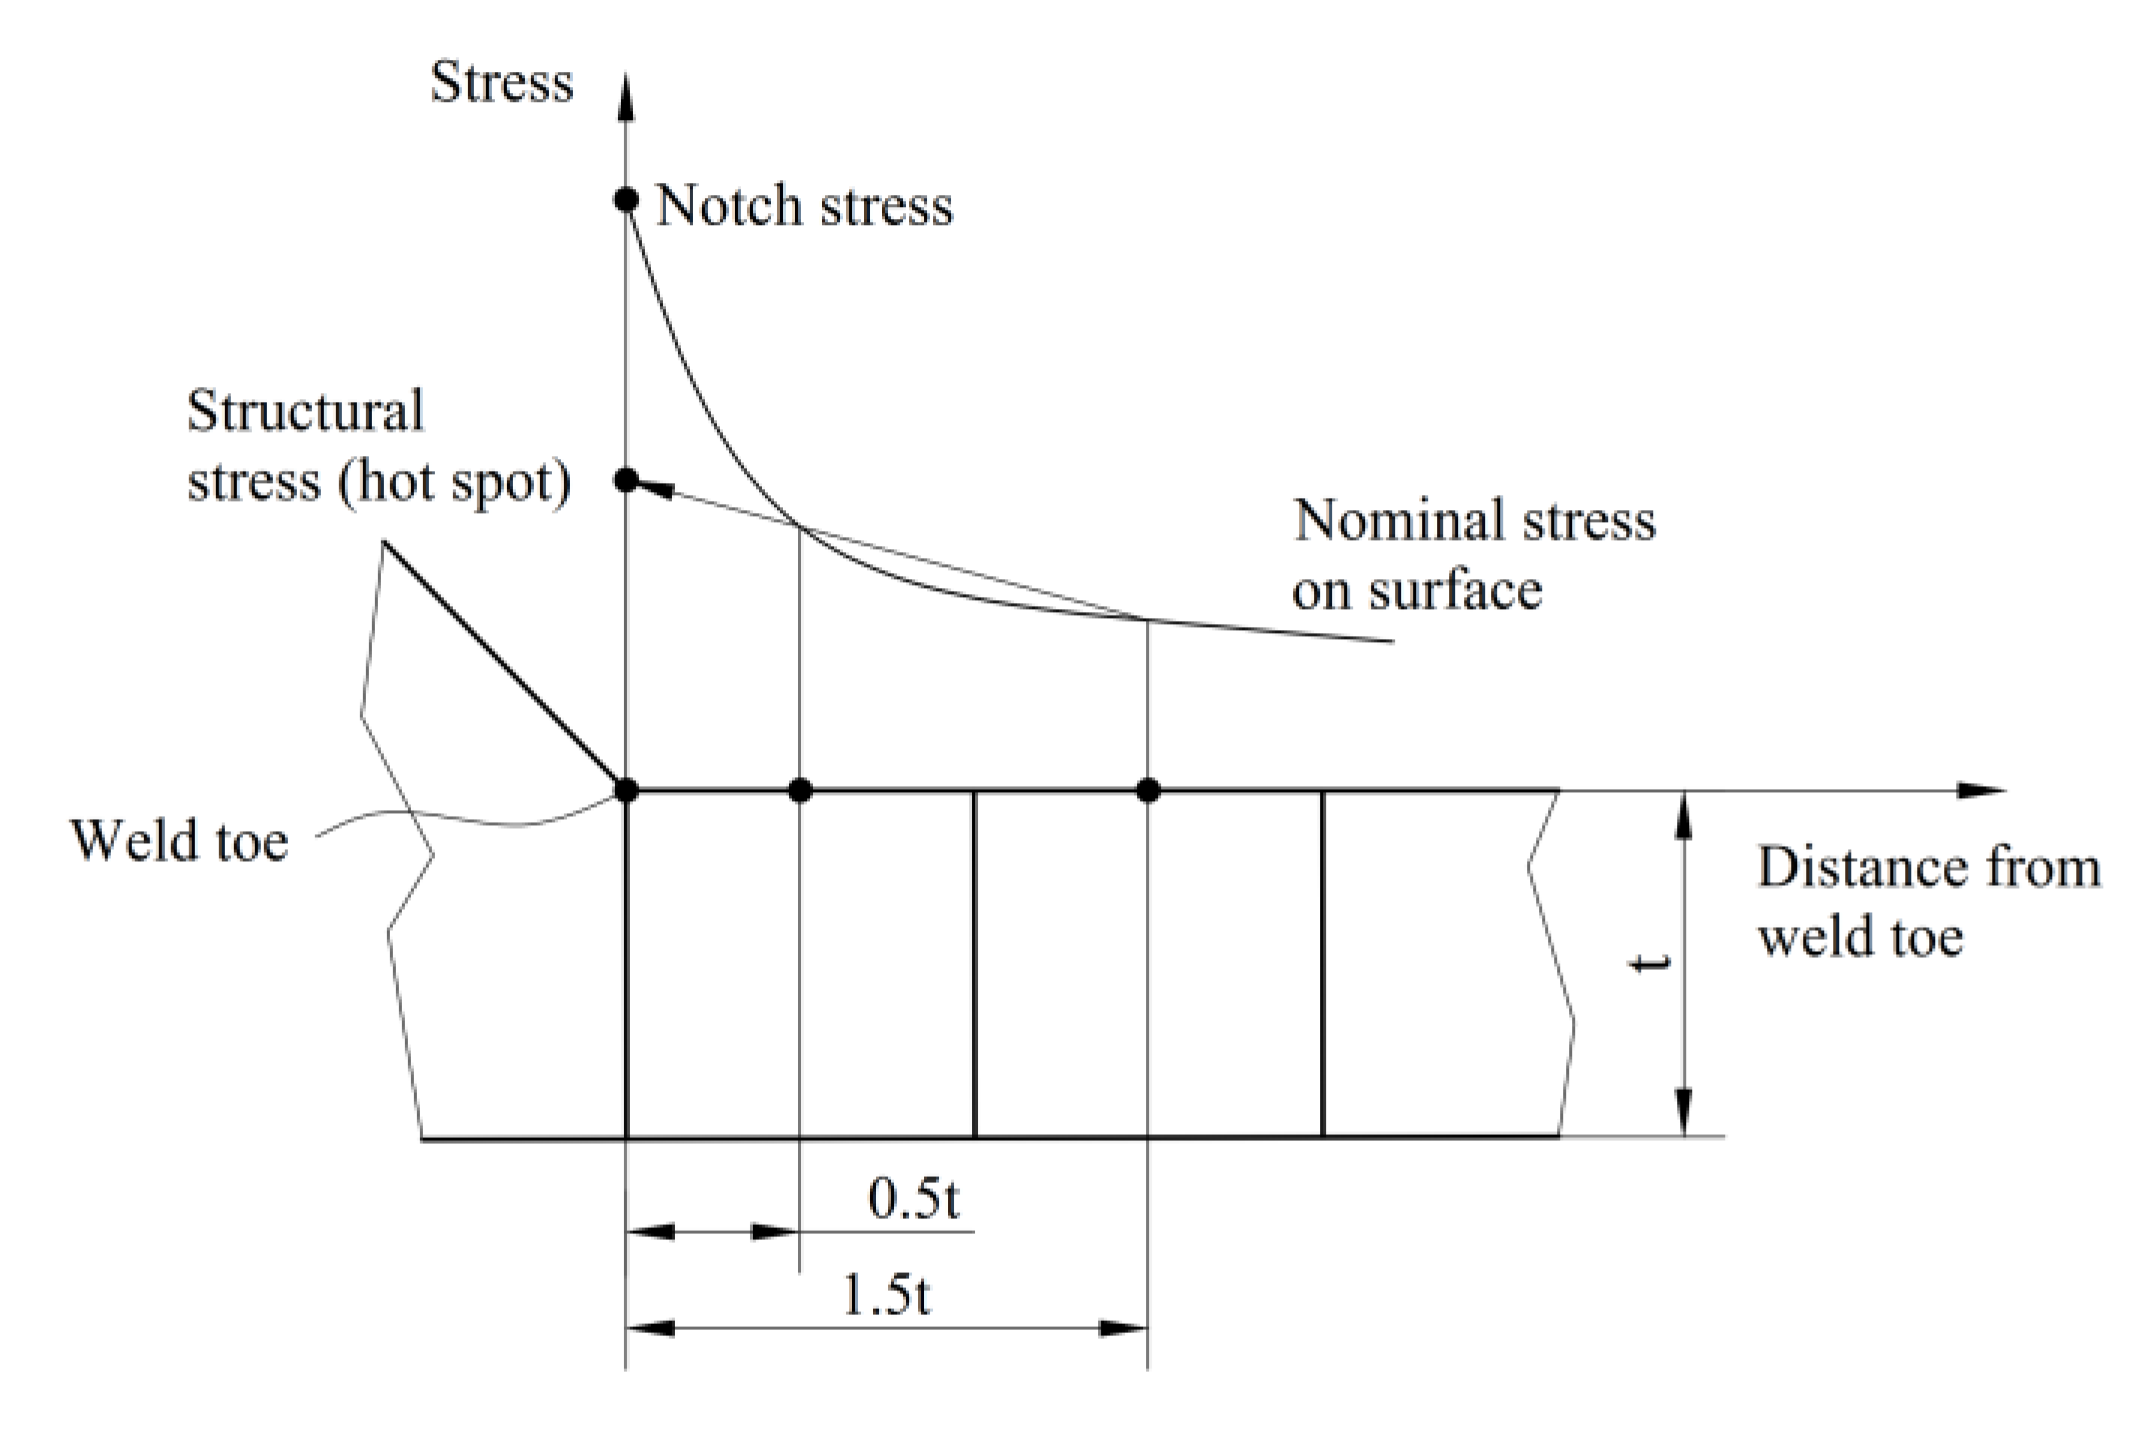
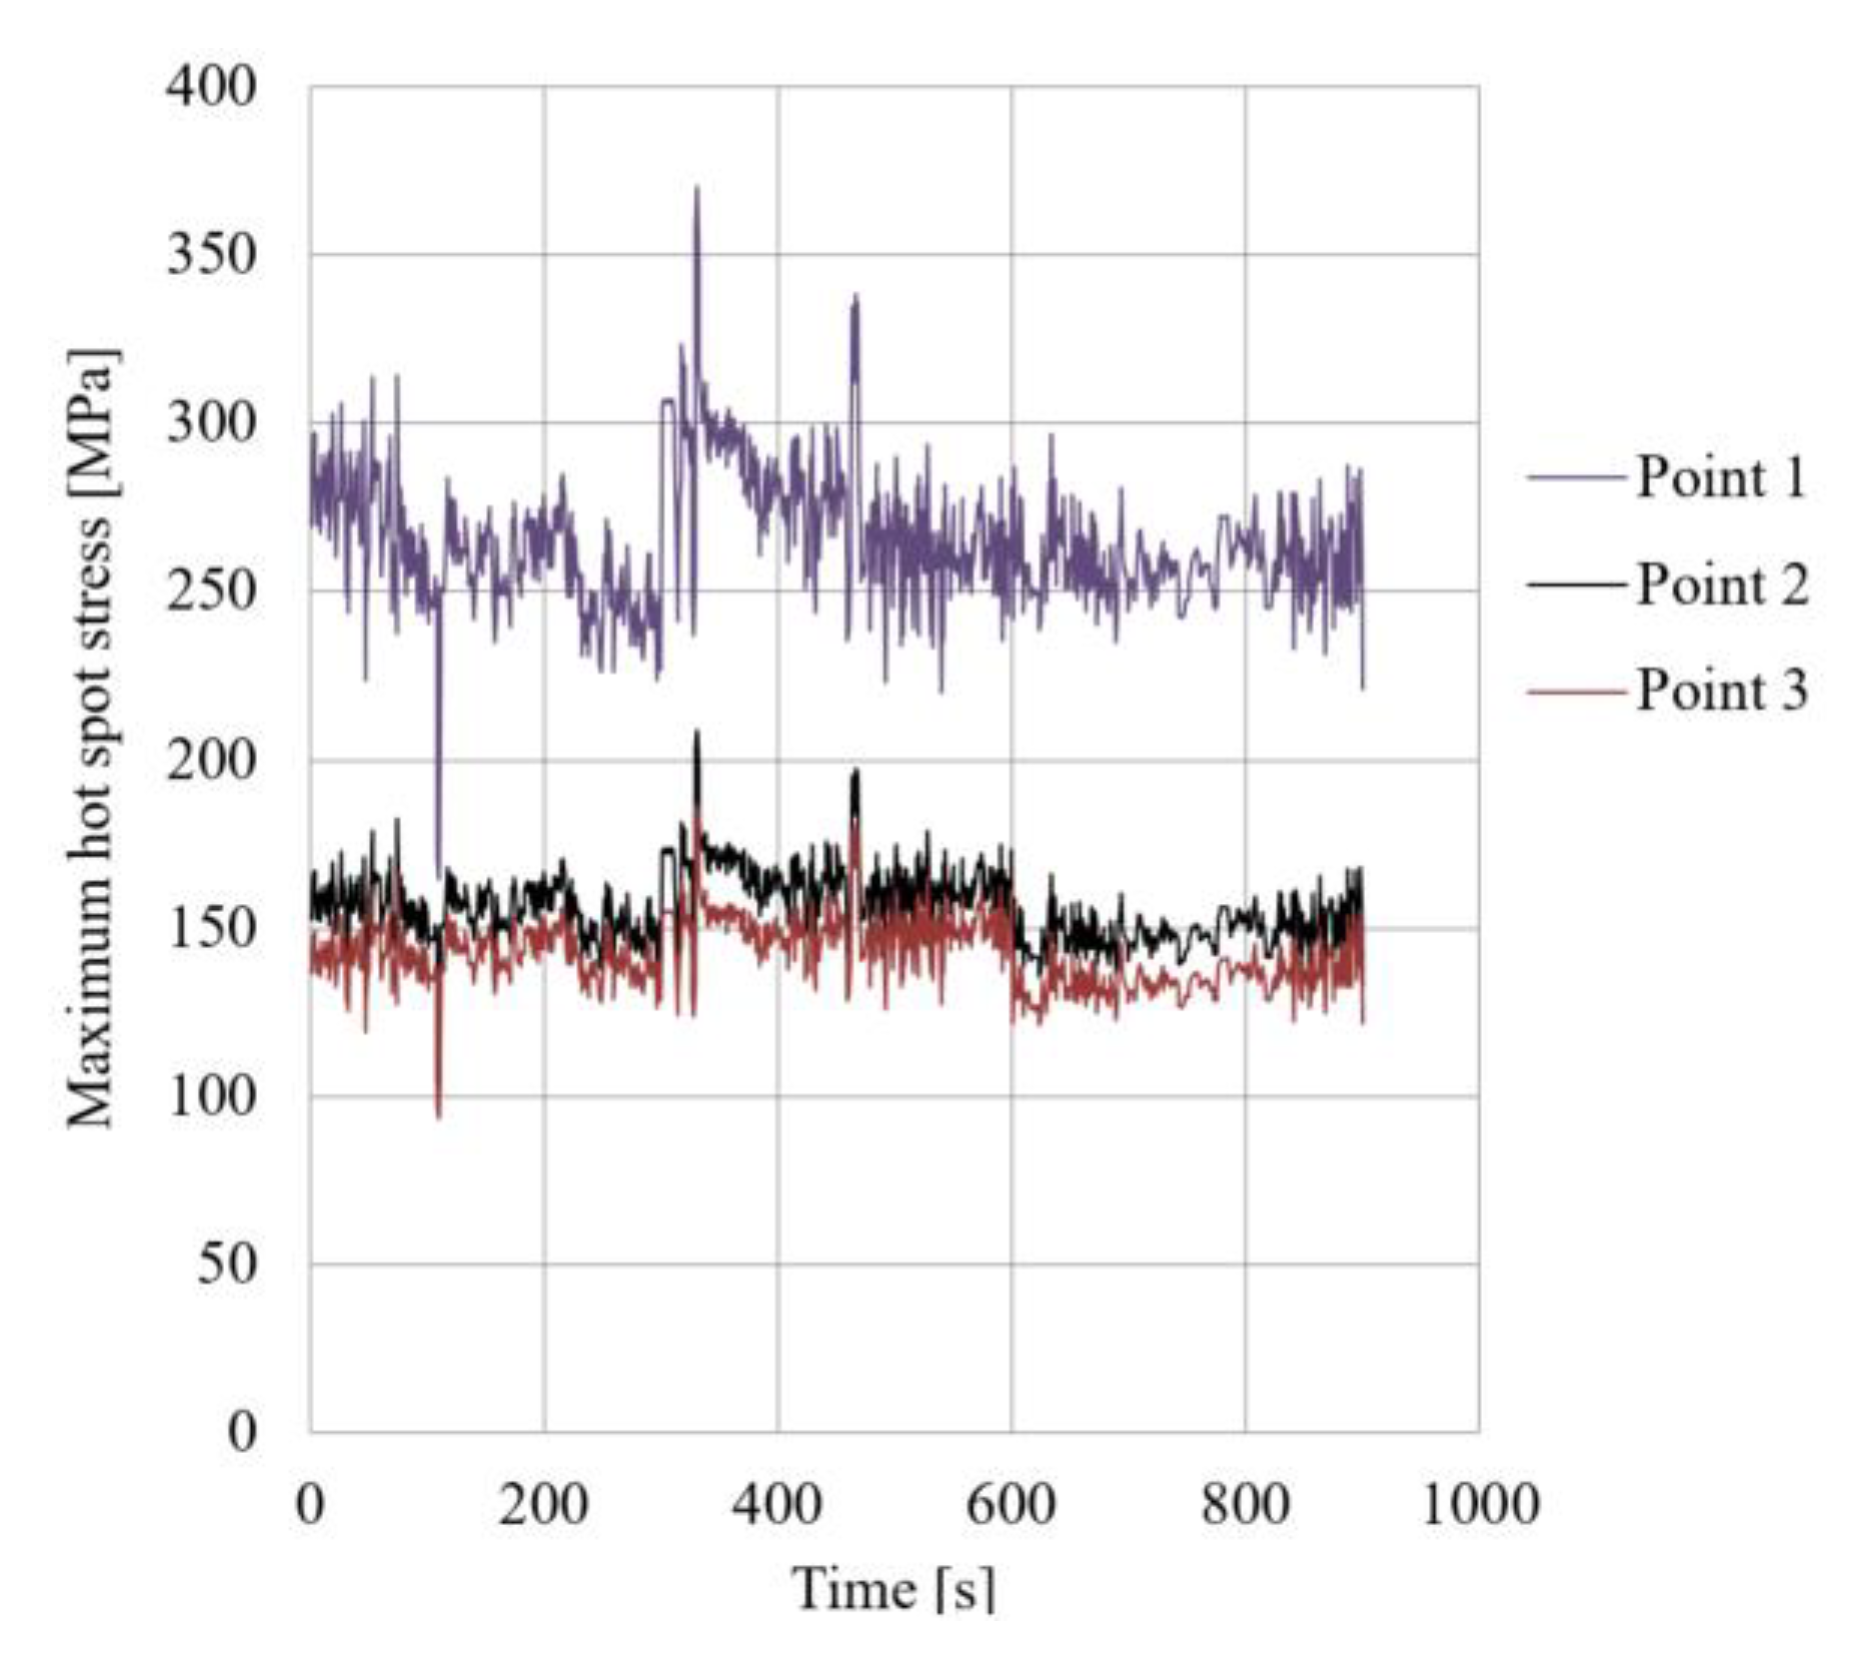
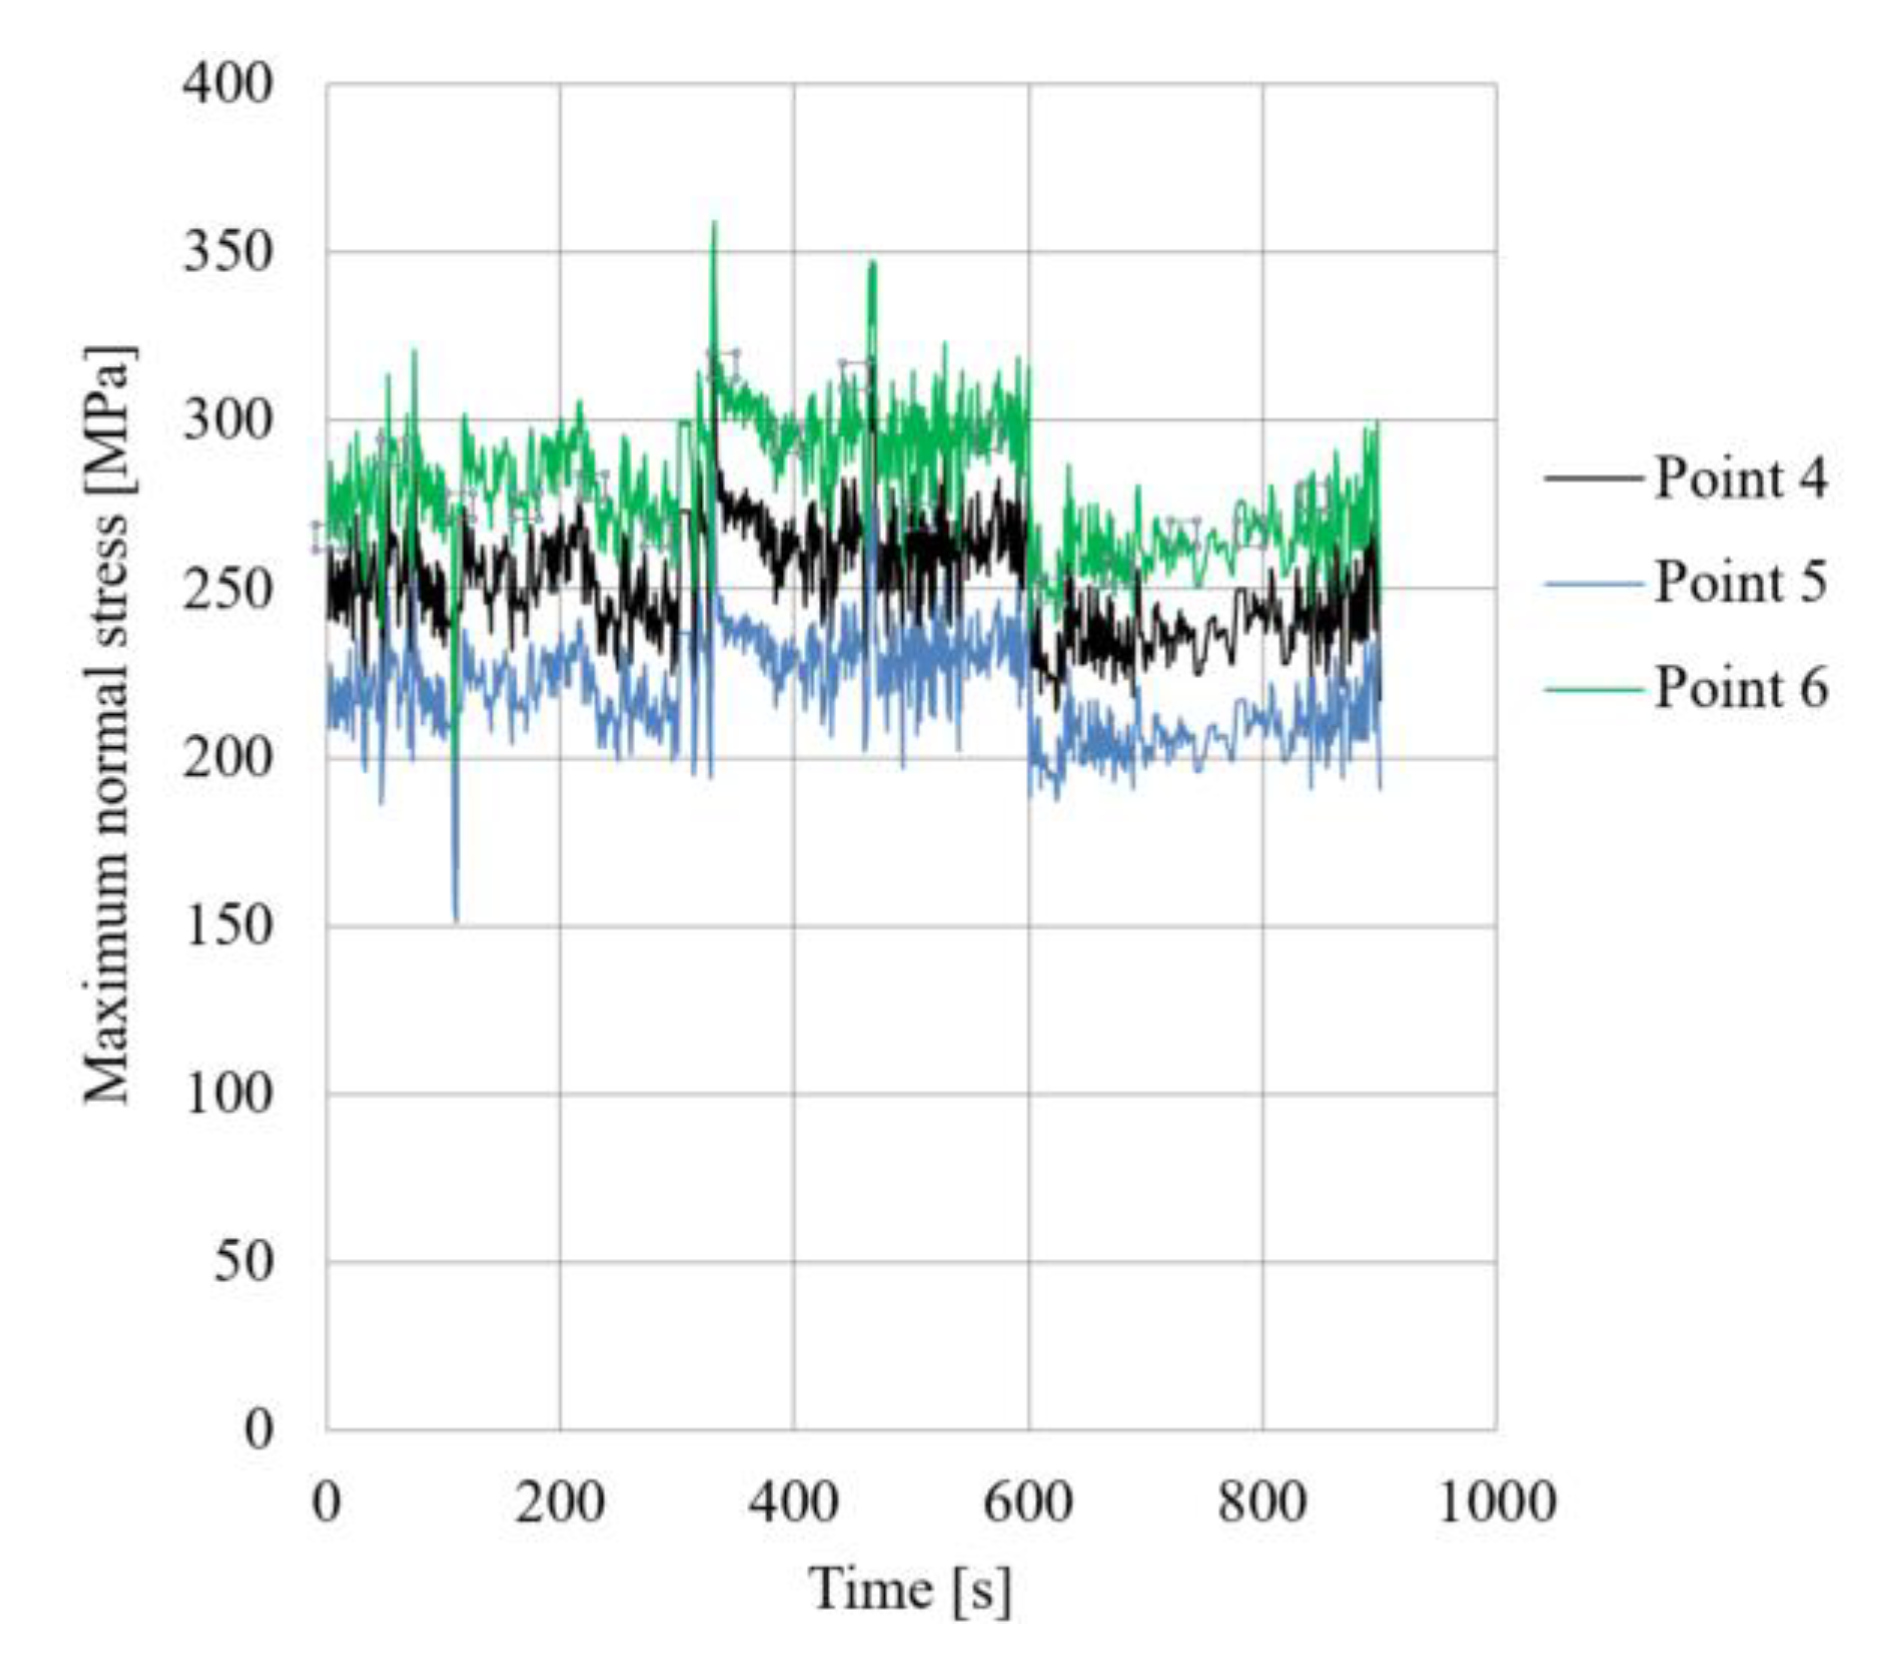
3. Finite Element Analysis
4. Fatigue Analysis
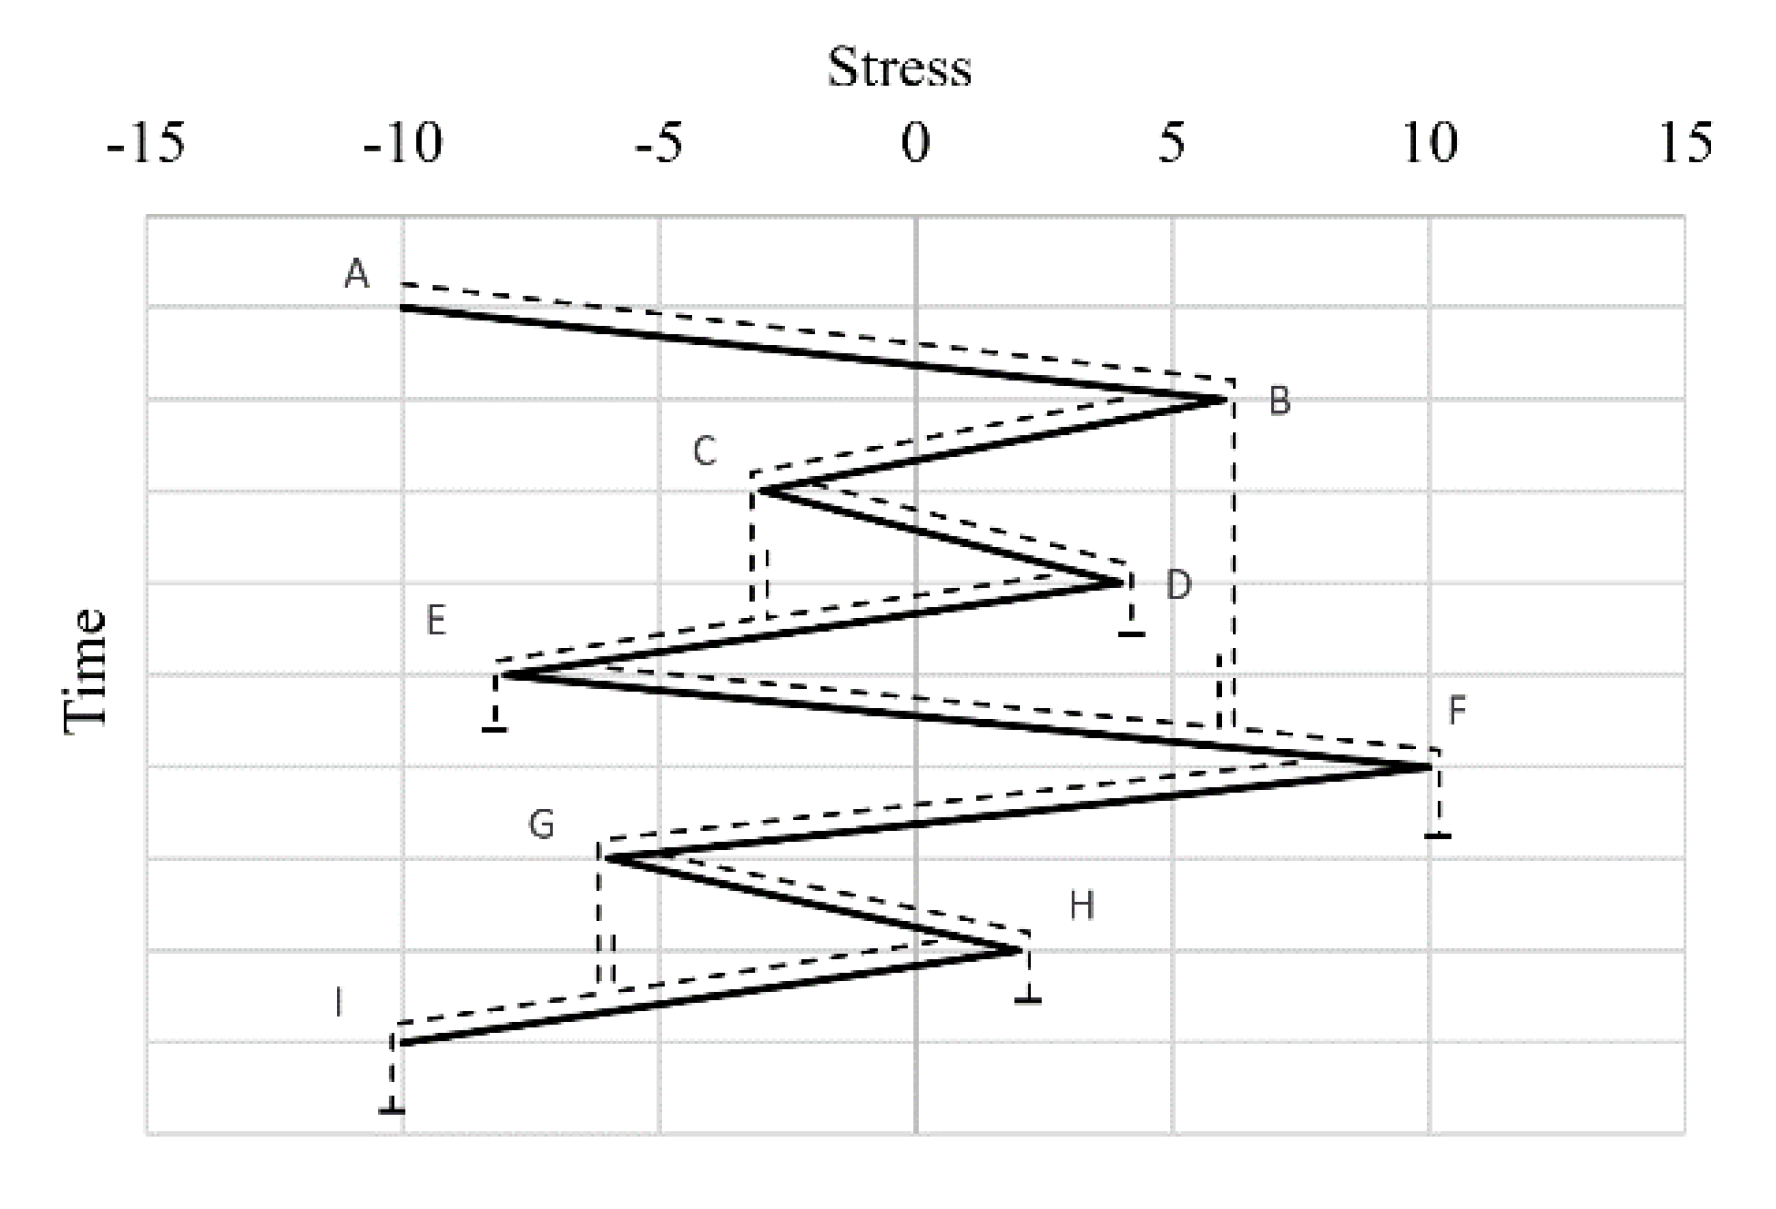
4.1. Rainflow Cycle Counting Method
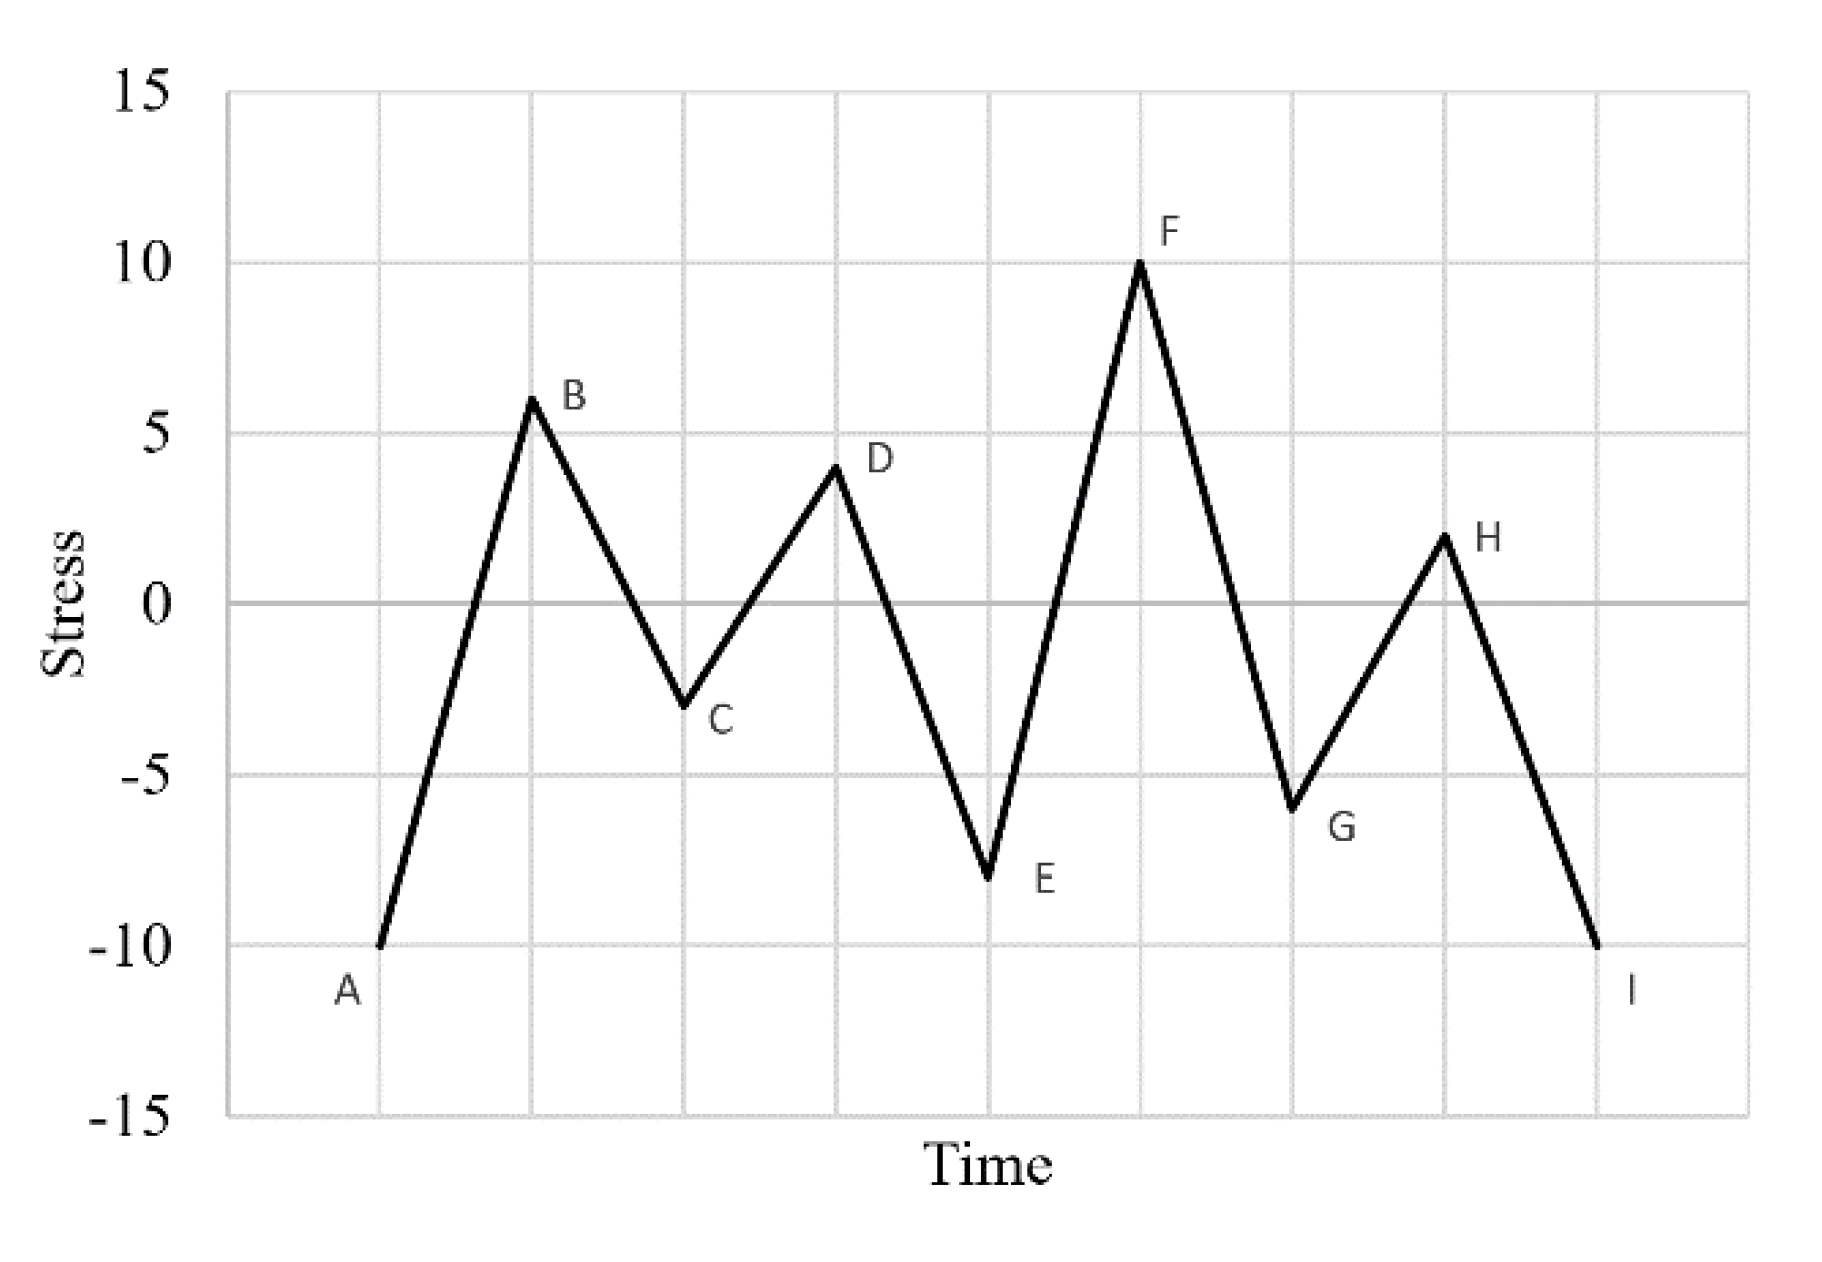
- The stress history plot is rotated by 90° to reflect the direction of the rain that is falling down.
- Rainflow starts at each successive point of the extreme.
- Stress reversals are defined with the assumption that rain falls until one of the following conditions is met:
- It drops on the opposite larger maximum or smaller minimum point;
- It meets another flow;
- It falls outside the roof.
- The stress history plot is rotated by 90° so that Figure 13 is obtained.
- Point A is identified as the largest peak in the stress history.
- A–F is identified as the first largest reversal.
- F–I is identified as the second largest reversal.
- Within the first largest reversal A–F:
- B–E reversal is identified.
- E–B reversal is identified.
- C–D reversal is identified.
- D–C reversal is identified.
- Within the second largest reversal F–I:
- G–H reversal is identified.
- H–G reversal is identified.
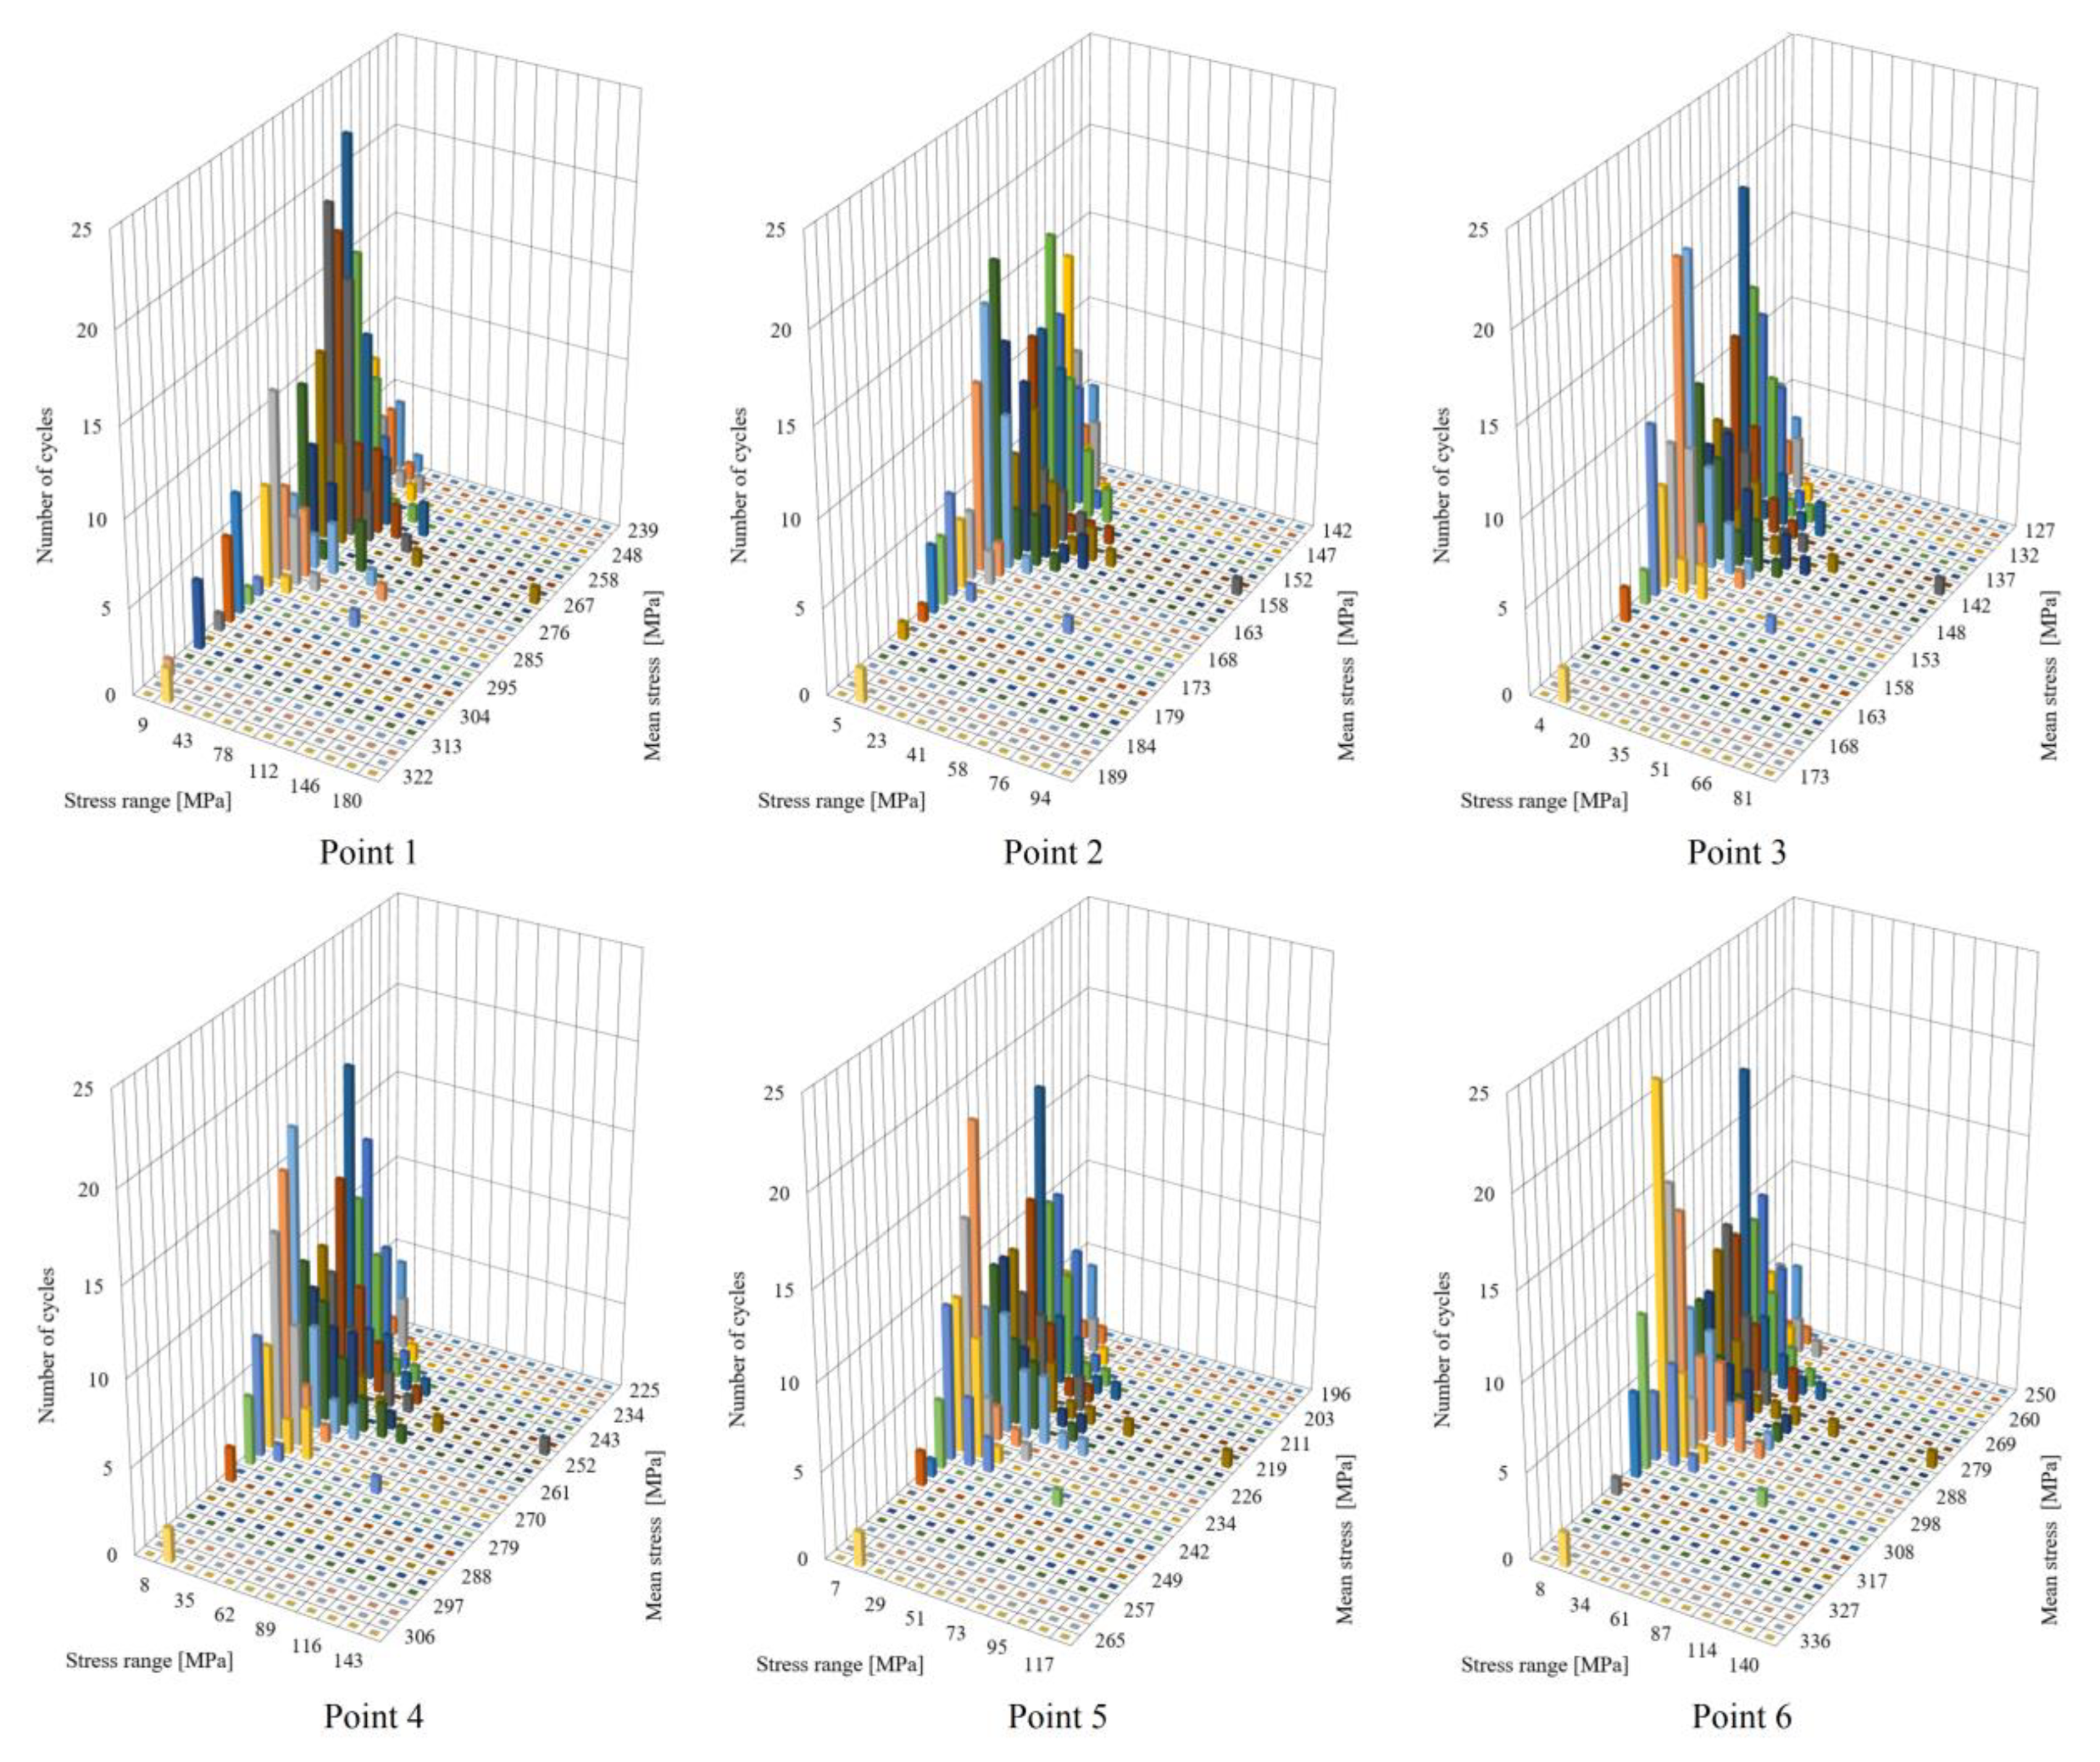
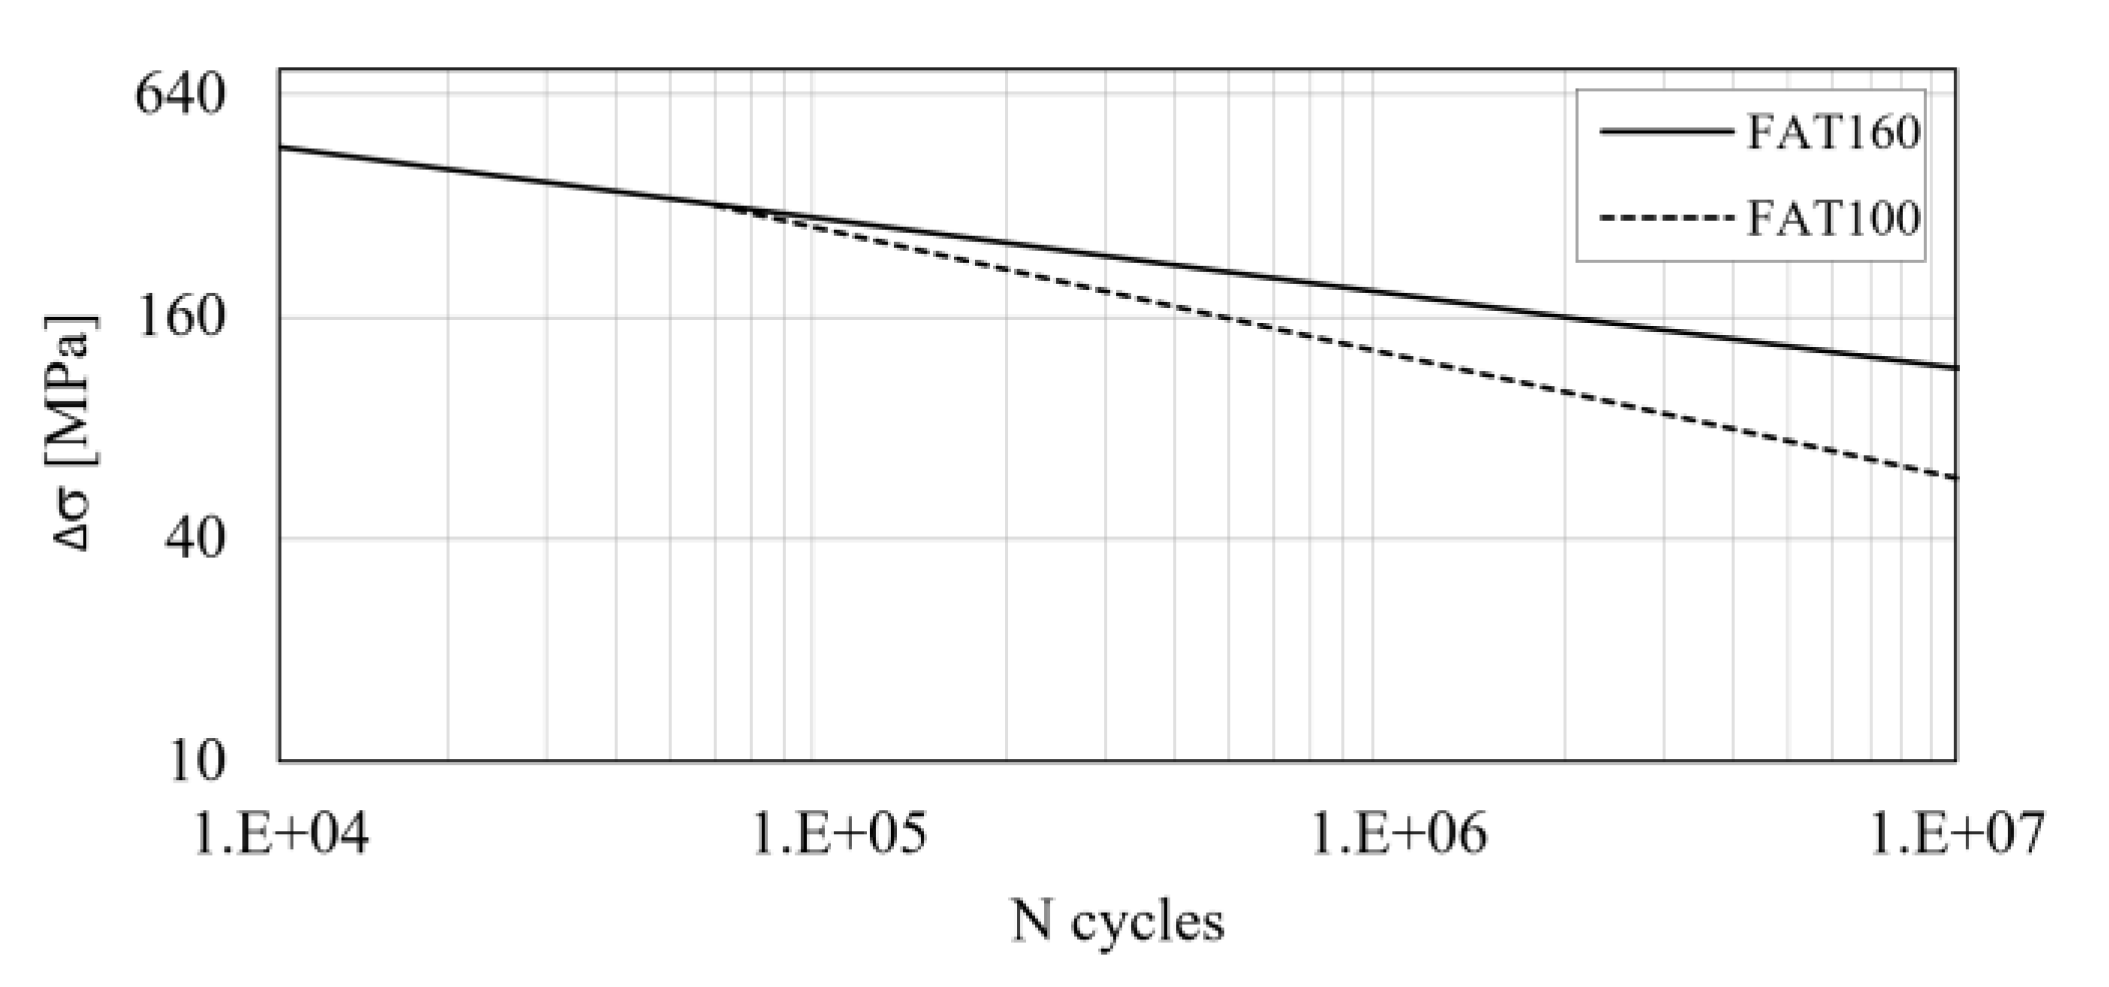
4.2. Fatigue Life Calculations
5. Discussion
6. Conclusions
Author Contributions
Funding
Conflicts of Interest
References
- Trzciński, W.; Sieniawski, W.; Moskalik, T. Effects of timber loads on gross vehicle weight. Folia For. Pol. Ser. A 2013, 55, 159–167. [Google Scholar] [CrossRef]
- Heuler, P.; Klätschke, H. Generation and use of standardized load spectra and load–time histories. Int. J. Fatigue 2005, 27, 974–990. [Google Scholar] [CrossRef]
- Będkowski, W. Assesnent of the fatigue life of machine components under service loading—A review of selected problems. J. Theor. Appl. Mech. 2014, 52, 443–458. [Google Scholar]
- Mrzygłód, M.; Zieliński, A.P. Numerical implementation of multiaxial high-cycle fatigue criterion to structural optimization. J. Theor. Appl. Mech. 2006, 44, 691–712. [Google Scholar]
- Mrzygłód, M. Two–stage optimization method with fatigue constraints for thin-walled structures. J. Theor. Appl. Mech. 2010, 48, 567–578. [Google Scholar]
- Szala, G. Application of two-parameter fatigue characteristics in fatigue persistence calculations of structural components under conditions of a board spectrum of loads. Pol. Marit. Res. 2016, 23, 138–145. [Google Scholar] [CrossRef][Green Version]
- Armentani, E.; Greco, A.; De Luca, A.; Sepe, R. Probabilistic analysis of fatigue behavior of single lap riveted joints. Appl. Sci. 2020, 10, 3379. [Google Scholar] [CrossRef]
- Romanowicz, P.J.; Szybiński, B. Fatigue life assessment of rolling bearings made from AISI 52100 bearing steel. Materials 2019, 12, 371. [Google Scholar] [CrossRef] [PubMed]
- Romanowicz, P. Numerical assessment of fatigue load capacity of cylindrical crane wheel using multiaxial high-cycle fatigue criteria. Arch. Appl. Mech. 2017, 87, 1707–1726. [Google Scholar] [CrossRef]
- Savkin, A.N.; Gorobtsov, A.S.; Badikov, K.A. Estimation of truck frame fatigue life under service loading. Procedia Eng. 2016, 150, 318–323. [Google Scholar] [CrossRef]
- Jadav, C.S.; Panchal, K.C.; Patel, F. A review of the fatigue analysis of an automobile frames. Int. J. Adv. Comput. Res. 2012, 2, 103–107. [Google Scholar]
- Zehsaz, M.; Morteza, H.S.; Ettefagh, M.M.; Hassanneja, R. Fatigue strength of a chassis of a semi-heavy truck under dynamic loads due to real road roughness. Trans. FAMENA 2014, 38, 89–105. [Google Scholar]
- Yuan, Z.; Ma, H.; Lu, Y.; Zhu, S.; Hong, T. The application of load identification model on the weld line fatigue life assessment for a wheel loader boom. Eng. Fail. Anal. 2019, 104, 898–910. [Google Scholar] [CrossRef]
- Han, J.W.; Kim, J.D.; Song, S.Y. Fatigue strength evaluation of a bogie frame for urban maglev train with fatigue test on full-scale test rig. Eng. Fail. Anal. 2013, 31, 412–420. [Google Scholar] [CrossRef]
- Baek, S.H.; Cho, S.S.; Joo, W.S. Fatigue life prediction based on the rainflow cycle counting method for the end beam of a freight car bogie. Int. J. Automot. Technol. 2008, 9, 95–101. [Google Scholar] [CrossRef]
- Witek, L. Numerical stress and crack initiation analysis of the compressor blades after foreign object damage subjected to high-cycle fatigue. Eng. Fail. Anal. 2011, 18, 2111–2125. [Google Scholar] [CrossRef]
- Song, M.; Zhang, W.; Jiang, W.; Wang, J.; Zhao, X.; Zhai, X. Fatigue life assessment of the shell structure of purified terephthalic acid filter press. Materials 2020, 13, 3276. [Google Scholar] [CrossRef] [PubMed]
- Ansys Academic Research Mechanical, Release 18.1; ANSYS, Inc.: Canonsburg, PA, USA, 2017.
- Hobbacher, A.F. Recommendations for Fatigue Design of Welded Joints and Components, 2nd ed.; IIW Document IIW-2259-15 ex XIII-2460-13/XV-1440-13; Springer International Publishing: Cham, Switzerland, 2016. [Google Scholar]
- Matsuishi, M.; Endo, T. Fatigue of Metals Subjected to Varying Stress; Japan Society of Mechanical Engineering: Fukuoka, Japan, 1968. [Google Scholar]
- Fatemi, A.; Yang, L. Cumulative fatigue damage and life prediction theories: A survey of the state of the art for homogeneous materials. Int. J. Fatigue 1998, 20, 9–34. [Google Scholar] [CrossRef]


| Repeats to Failure | Operating Time to Failure (h) | Mileage to Failure (km) | |
|---|---|---|---|
| Point 1 | 84,420 | 21,105 | 1,055,250 |
| Point 2 | 1,327,376 | 331,844 | 16,592,200 |
| Point 3 | 3,095,003 | 773,751 | 38,687,538 |
| Point 4 | 1,400,038 | 350 010 | 17,500,475 |
| Point 5 | 7,182,869 | 1,795,717 | 89,785,863 |
| Point 6 | 791,447 | 197,862 | 9,893,088 |
© 2020 by the authors. Licensee MDPI, Basel, Switzerland. This article is an open access article distributed under the terms and conditions of the Creative Commons Attribution (CC BY) license (http://creativecommons.org/licenses/by/4.0/).
Share and Cite
Lisowski, F.; Lisowski, E. Testing and Fatigue Life Assessment of Timber Truck Stanchions. Appl. Sci. 2020, 10, 6134. https://doi.org/10.3390/app10176134
Lisowski F, Lisowski E. Testing and Fatigue Life Assessment of Timber Truck Stanchions. Applied Sciences. 2020; 10(17):6134. https://doi.org/10.3390/app10176134
Chicago/Turabian StyleLisowski, Filip, and Edward Lisowski. 2020. "Testing and Fatigue Life Assessment of Timber Truck Stanchions" Applied Sciences 10, no. 17: 6134. https://doi.org/10.3390/app10176134
APA StyleLisowski, F., & Lisowski, E. (2020). Testing and Fatigue Life Assessment of Timber Truck Stanchions. Applied Sciences, 10(17), 6134. https://doi.org/10.3390/app10176134