1. Introduction
Rehabilitating any building requires inspection prior to intervention in order to collect as much information as possible about existing pathologies or damage. Based on that information, a precise diagnosis can be made to facilitate taking appropriate decisions about its restoration. Such analysis and diagnosis of the state of preservation is fundamental in the case of listed heritage buildings, especially of its structural safety. In order to ensure its structural performance is correctly assessed, the materials used in the various elements that provide its resistance, as well as the structure’s overall behaviour must be characterised.
Numerous techniques have appeared in recent decades that offer information about the condition of a building’s structure and the quality of the results obtained has progressively improved. Non-destructive testing (NDT) is significant among technologies designed for structural assessment. Unlike conventional inspection techniques that may cause damage to heritage buildings, NDT provides detailed information about them without altering or affecting their earlier and highly valuable characteristics in any way. Prominent among the non-destructive tests commonly applied to buildings are impulse radar/ground penetrating radar, endoscopy, ultrasound, moisture measurement or infra-red thermography [
1]. Numerous papers cite optimal success with these systems in obtaining substantial data for suitable decision-making in rehabilitation processes [
2,
3,
4].
However, these survey techniques also entail certain negative aspects, one being the huge volume of data they can produce and secondly, the expertise required by technicians to analyse and interpret that data [
5]. Consequently, more in-depth examination is required of how these various techniques can be applied and the outcome analysed in order to facilitate their calibration, interpret their results and reach a subsequent diagnosis to support decision-making.
From the point of view of historical buildings with load-bearing walls, regardless of the type of construction, one issue that tends to cause controversy among experts is identifying the parameters needed to characterise their mechanical behaviour properly [
6,
7,
8]. Defining the mechanical properties of the materials depends on parameters such as the modulus of elasticity (E), shear modulus (G, μ) or Poisson ratio (ν), all of which need to be defined accurately in order to assess their structural safety using numerical models properly [
9,
10,
11]. Certain simple procedures based on assessing the construction of the masonry define those parameters, such as the masonry quality index (MQI) [
12], which provides a simple and systematic approach whereby, in view of the wall’s construction configuration, it is possible to specify an approximate range for compressive and shear strength (f
m and τ
0), and for the elastic modulus or tangent/Young’s modulus (E). These values are sufficiently accurate to effectively estimate the masonry’s structural behaviour, as ratified by various researchers [
13].
Apart from the above procedure using quality assessment criteria and in view of the complexity of the problem given the large number of variables, other techniques need to be used to obtain empirical information about the masonry under assessment. One such technique that provides substantial data on the state of the structure relates to the fundamental period/frequency, based on which, each case study can be individually analysed and diagnosed, enabling specific areas with the probability of resonance to be identified and the relevance of existing damage to the structure or its seismic vulnerability to be estimated.
The natural period (
T) of a system can be defined using Equation (1) as a function of the system’s total mass (
m) and its lateral stiffness (
k).
Lateral stiffness (
k) is known to depend on geometric parameters, such as the dimensions or second moment of area (
I) of the section of the resisting elements and the elastic modulus of the materials used in structural elements [
14]. Therefore, when the total mass is known, from the natural period, structural stiffness can be directly linked with E and thus the material defined unequivocally.
Analytical procedures exist that estimate the value of the fundamental period of a masonry structure using a specific formula for each structural type [
15]. These formulae usually imply testing structures against dynamic loads such as earthquakes. They have been developed from empirical studies and represent an easy way of approximating the fundamental period according to existing data. This method is particularly useful when simplified seismic calculation procedures are applied, because, when the period of the vibration mode considered is lower than the maximum period that marks the plateau of the elastic response spectrum, a more refined estimate is no longer necessary, as the spectral ordinate is independent in simplified methods. This empirical value is included in national seismic regulations. However, despite the widespread use of this type of structure across the world, only Spain, France, Dominican Republic, Cuba, Peru, Romania and Albania include a specific formula in their building codes to calculate the fundamental period (IAEE, 2004) of most masonry wall constructions and which attempts to condense different structural configurations into a single expression adapted to each territory’s individual conditions and construction methods. The formula varies from one set of regulations to another, i.e., from one country to another. Equation (2) shows the formula used in Spain (code for seismic design (NCSE, 2002)) and France (code de l’environnement), where
TF corresponds to the natural period,
H is the height of the wall, and
L is its length:
In its attempt to afford generalisation, given the H and L variables used and the fact that it is an empirical formula, the range of results obtained may vary and disperse greatly from real values. These differences are more significant in historical masonry structures that have special or unique properties and characteristics or structural configurations. One must also remember that the main purpose of seismic standards is to calculate new construction structures and therefore the range of application differs significantly from the assessment of historical masonry.
Consequently, applying this simple procedure may be somewhat inaccurate as a way of validating structural behaviour, especially due to the uncertainties raised by the type of construction materials used and the state of preservation. Therefore, given the complexity involved in ascertaining the mechanical properties of such structures in a deterministic way, probabilistic methods are called for, based on measuring a representative sample of the main existing typology and adjusting simplified empirical formulae to estimate the natural period of a building easily using basic data, such as its height or the number of storeys.
In order to reduce the uncertainty and dispersion of results that can occur when adjusting the results of analytical procedures, several tests have been developed to provide information on the mechanical properties of masonry. Some of these are destructive testing (DT) or minor destructive testing (MDT), which can be performed both on site [
16,
17] and in the lab [
18]. These destructive tests, such as the diagonal compression test, drilling by Gucci penetrometer (PNT-G), single and double flat jack tests or twin panel testing (TPT), provide real data about compressive strength, elastic limit and ultimate strength. Furthermore, based on factory deformability, it is possible to determine parameters such as E, ν and G.
Prominent among the non-destructive tests (NDT) that make it possible to define the above parameters are procedures based on measuring the displacement-time histories of seismic waves through materials in order to obtain shear and compressional velocity waves (P-wave and S-wave) [
19], especially the ambient vibration test (AVT), also applied as operational modal analysis (OMA). The use of this technique enables finite element models to be improved and mechanically validated, especially for assessing the non-linear dynamic response of structures under seismic loads [
20,
21]. The technique allows the values of both the materials’ mechanical properties and the boundary conditions to be adjusted [
22,
23,
24], thus providing the value of the elastic modulus. Consequently, based on Equation (1), it is possible to estimate the dynamic elastic modulus (E
d) of the structure from its natural period and thus the value of E. A simple application of this procedure is described by Pérez-Gálvez et al. [
25], where the equations used for a cantilever wall are presented.
The significant differences encountered between the results of analytical studies and experimental testing carried out on multiple structures highlight the need to calibrate finite element models to produce a more reasonable indication of mechanical behaviour that matches the reality of the build structure [
26]. In addition, the test provides values that are useful in restoration work. Comparing the results of the test carried out before and after intervention illustrates the effectiveness of the reinforcement measures employed, thus indicating how the structure’s safety index has increased [
27]. With periodic monitoring, the use of this interesting technique measures how stability and structural safety conditions evolve over time [
28,
29] and so promotes structural health monitoring and ultimately improves the state of preservation of historical building heritage.
2. Materials and Methods
2.1. Type of Construction under Analysis
The defensive watchtowers in this study can be classified into three main periods. Firstly, the most numerous and heterogeneous group is comprised of towers of medieval construction and probably of Nasrid origin. Their construction system varies from region to region, mainly in respect of the materials and wall bonding used but also of the type of tower itself, with different configurations in terms of height, number of levels, section and plan shape and wall finishes [
30]. These towers, especially watchtowers, usually have a solid level down to the tower access level, located at a height of around 5.0 m (or even higher), where distribution of the inner levels begins. In the case of watchtowers, there is usually one solid level.
Secondly, in the modern defence towers that appeared between the 16th and 17th centuries, the walls are seen to be more sophisticated, with the construction of more elaborate masonry walls and widespread use of bricks to constitute openings and other additional elements. This enabled watchtowers to evolve towards more complex buildings, whose size and stability increased with the generalisation of sloping wall sections. Some of them were often erected on the sites of earlier medieval towers in disuse or in a poor state of preservation. As in the case of the afore-mentioned medieval watchtowers, most of these towers have a solid lower level up to the access level.
Finally, the formal and material characteristics of towers built in the 18th century respond to a very particular type of construction, designed to support artillery batteries for two cannons designed by engineer Jose Crame and built in the 1760s, which include the Moya tower (Velez-Malaga) and other examples along the Andalusian coastline, such as the Lance de las Cañas tower (Marbella, Málaga) or the Mesa Roldan tower (Carboneras, Almeria). Unlike the earlier constructions, these towers have very thick sloping walls and larger plan dimensions.
Figure 1,
Figure 2,
Figure 3,
Figure 4 and
Figure 5 describe the elevations and sections of all the towers in the study, sorted by historical period and type.
Figure 6 shows the locations of the towers in relation to the provinces of Granada, Malaga, and Almeria, and to the unstable border of the Nasrid Kingdom of Granada.
In our analysis of the construction used in the various towers, distinction is drawn between two main building techniques: rammed earth, defined by the dimensions of the formworks used in the construction of the preserved walls, and masonry, a system whose characteristics enable more specific types of construction to be defined.
In this survey group, the examples built with rammed earth are El Fuerte (Las Gabias), the Huétor tower (Huétor Tájar) and the Pimentel tower (Torremolinos), all dating back to medieval times. The first two have a lime mortar-reinforced rammed earth wall and, despite clear differences in the buildings’ shapes, heights and levels, the dimensions of the wall are very similar.
The rest of the towers in the study are built with masonry, although the construction system varies considerably. Standard thickness is in the range of 1.0 m, although it oscillates between 2.0 m and 0.60 m thick at the first level.
Figure 7 and
Figure 8 show the elevation and section of the wall construction in each of the towers. Because most of the towers have a solid bottom level, the plan of the tower was taken at Level 1. With respect to the wall’s cross section, the layout of both the vertical and horizontal joints was studied. This information provides data about the homogeneity of each wall in order to determine its mechanical behaviour. The transverse sections were obtained from different towers where the cross section of the walls was visible, following collapse due to diverse pathologies over their life-span.
2.2. Image Analysis Application
To describe the specific construction system, a sufficiently representative sample of the wall from each tower was used. In each case, a square 1.0 × 1.0 m section of the elevation at Level 1 in each tower is selected to create an image that would allow us to compare the different models. They were compared using ImageJ Fiji (v. 1.52p) (National Institutes of Health, Bethesda, MD, USA) image processing software [
31]. Based on that, a measurement and analysis protocol were drawn up to obtain the most relevant data from each image to classify the construction systems:
Area—selected area in square pixels. Area is in calibrated units, in this case, square centimetres.
Perimeter—the length of the outside boundary of the selected area.
Shape descriptors (previously circularity). Calculate and display the following shape descriptors:
Circ. (circularity): 4π× area/perimeter2. A value of 1.0 indicates a perfect circle. The nearer the value is to 0.0, the more elongated its shape is.
AR (aspect ratio): major_axis/minor_axis
Round (roundness): 4× area/(π× major_axis2), or the inverse of the aspect ratio.
Solidity: area/convex area. The Edit > Selection > Convex Hull command makes a selected area convex.
Feret diameter—the longest distance between any two points along the selected boundary, also known as maximum caliper. Feret angle (0°–180°) is the angle between the Feret diameter and a line parallel to the x-axis of the image. MinFeret is the minimum caliper diameter. The starting co-ordinates of the Feret diameter (FeretX and FeretY) are also displayed. This data can characterise the homogeneity and settlement of the successive courses and therefore define the quality of the construction.
The results of the image analysis enabled conclusions to be drawn both at the general level of the elevation and by studying each of the materials and elements individually. Some of these calculations, such as the circularity of the rough stone or Feret diameters, are highly variable, i.e., their values are highly dispersed as they are directly linked to the original conditions of the area in which the construction is located and from which the materials for each tower were collected. Therefore, these parameters are not valid as a way of defining a complete typology and although parameters that can be used for more detailed analysis of the masonry were calculated, the only functional parameter for differentiating one type from another is the percentage (%) of rough stones. Indeed, given that the study was carried out on several towers of similar type and age, the proportion of masonry and mortar present in each sample enables thresholds to be established that sort each specimen into one or other construction technique. The rest of the parameters enable the visual data of the elevation to be depicted.
2.3. Ambient Vibration Tests
This non-destructive test, used to determine the stiffness of a structure in situ, measures the movement or vibration generated by excitation sources external to the structure. All systems are subjected to a series of ambient loads (e.g., wind, traffic, human activity) that generate a response expressed as an oscillation or vibration. The consequence of these external loads is called ambient vibration. Ascertaining the structure’s response enables its fundamental period/frequency to be estimated accurately, which in turn means the structure’s stiffness and consequently bracing can be determined.
In this manner, the outcome of the test makes it possible to estimate the overall stiffness of a structure (Equation (1)), providing an empirical value to assess its state of preservation. The use of this technique in buildings stems from the need to empirically obtain some of their dynamic characteristics in order to work out their behaviour in response to loads such as earthquakes or wind. The energy used to determine these properties can be provided by induced vibration techniques or from existing ambient vibration where the building is located. Compared to the use of forced or induced vibration, cultural noise has significant advantages, such as efficiency, time and economy. Besides, the method avoids the use of any type of stress on a structure that may be in poor condition, thus, eliminating a risk both for the people performing the test and for the structure itself. The outcome of various experiments [
32,
33,
34,
35] reveals that the use of ambient vibration is sufficiently precise to obtain the fundamental period of a structure and other dynamic characteristics.
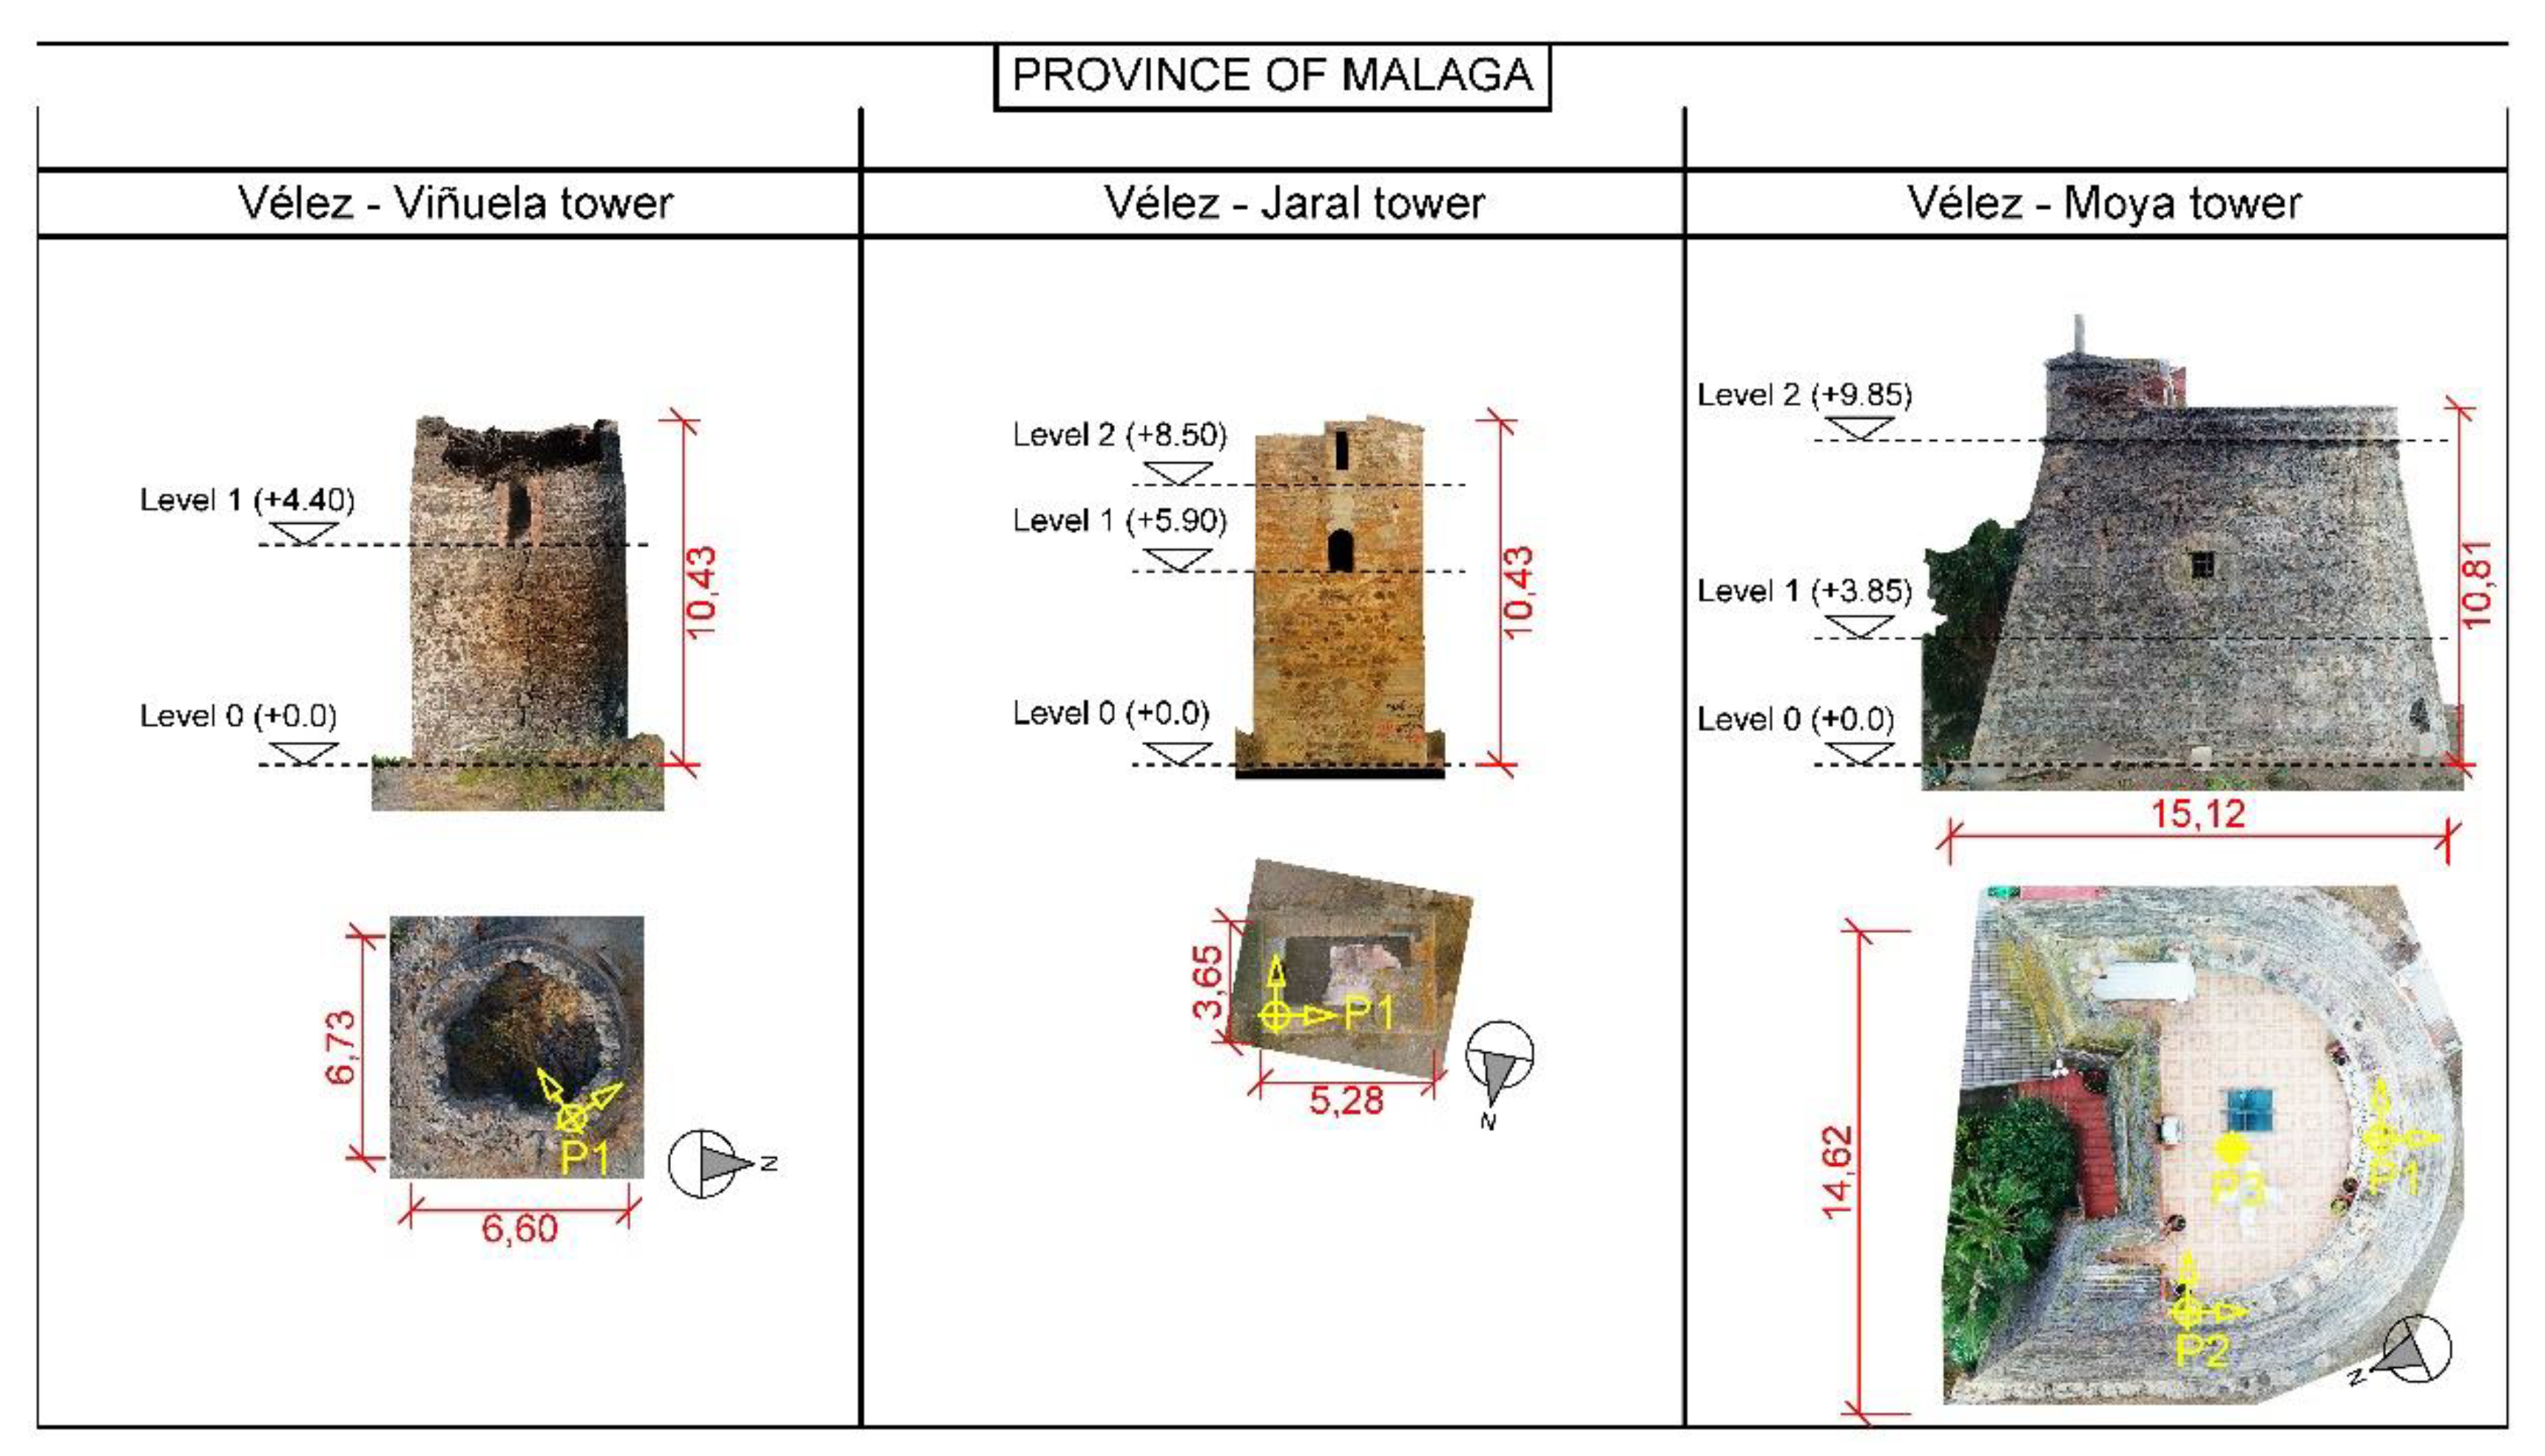
The tests are performed using a single accelerometer placed on the top floor of the structure, capable of measuring small oscillations, especially those not perceptible by humans. The data registered by the accelerometer are filtered through an analogue–digital converter and the signal is then analysed using appropriate software. Readings were taken with a uniaxial high sensitivity Innomic KB12VD (10,000 mV/g) accelerometer, capable of measuring a frequency range between 0.08 and 260 Hz. The accelerometer was connected by a uniaxial transducer connection signal cable to the digital data capturing system, whereupon the filtered signal was analysed and recorded throughout the test using specific software installed on a laptop. Testing points in the different towers are shown in
Figure 9,
Figure 10 and
Figure 11, which also display the general dimensions of the towers, as well as the dimensions corresponding to the inner levels and their orientations from North. Except for the Campanillas, Tramores and Sal towers, all tests were carried out on the upper level of the towers. Two readings—parallel and perpendicular to the wall—were taken at each point.
Figure 12 shows the equipment used to take measurements in the Duque (Marbella) and Torremolinos (Malaga) towers: a laptop computer, accelerometer and analogical-digital converter.
The set of measurements obtained at the different points in each of the towers were processed analytically to obtain the fundamental vibration frequency of the masonry structure.
3. Results
3.1. Construction Characterisation
Image analysis was used to study the elevations and sections of the selected walls and thus objectively determine and quantify certain fundamental characteristics of each construction in order to understand its mechanical behaviour.
In the 19 samples of masonry under study, an initial examination of the elevations revealed mainly ordinary and concerted (masonry in which the outer, visible face is made of stones dressed in more or less regularly-shaped polygons to produce a fundamentally flat external surface) masonry, as well as examples of masonry with a lacing course (identified as more rounded stones) and fronted masonry (where dressed stone is only used on the outer face with no specific shapes or size while rubble masonry is used on the inside of the wall). By analysing the proportion of materials visible in the elevation, we were able to classify the standard percentage of rubble in each type of masonry into intervals and thus obtain information about how the materials had been arranged. As part of the same process, the average rubble size was measured for each sample over a certain surface area and length of the horizontal face, as shown in
Figure 13. This data was subsequently used to determine the quality of the masonry.
Table 1 lists the essential characteristics of the masonry elevations studied. It indicates the proportion of visible rubble in the sample, considered to be sufficiently representative to characterise the tower’s construction system. The average size of the stones used and deviation of global rubble size from that value are also included. This parameter objectively describes the homogeneity of the construction, where the higher the value, the more diverse the size of the masonry used (for example, in galletting constructions, deviation scores are very high as a result of rough stones of significantly smaller size than in the rest of the masonry being used). Based on that data, it is possible to make an analytical graph of the elevations in the masonry walls (
Figure 14):
Figure 14 shows the surface area with points of each of the pieces that form the elevation under study, as well as the calculated statistical values for each sample. The height of the boxes represents the degree of dispersion among the surface area data (between the first and third quartile), i.e., the range of surface area values between which 50% of the rough stones in the walls of each tower are found. The box is divided into two sectors by the median (quartile 2). The vertical lines (whiskers) represent the amplitude of the complete set of values and the arithmetic mean is represented by a cross. To avoid distortion in the graph, maximum values have been omitted, i.e., values over 75 per cent and lower than 25 per cent have not been included.
Finally, the joints were studied to complete the characterisation of rough stone distribution in the masonry. This step allowed us to assess the masonry’s jointing and the homogeneity of its courses, which is essential to defining the quality of the construction appropriately (
Figure 15).
Rammed earth towers were characterised on the basis of the height of the caissons, the thickness of the walls, and the possible insertion of other materials, such as spot reinforcement in certain areas (
Table 2).
3.2. Mechanical Features
Given that the constructions under study are listed heritage buildings, it was not possible to carry out mechanical characterisation analysis, mainly due to its destructive nature. For that reason, MQI-based quality analysis was used to determine the mechanical behaviour of the masonry walls. By applying this method based on analysing the configuration and geometric characteristics of each wall, it is possible to classify the quality of the building in each of the towers in the survey. The procedure produces a range of values with respect to E (
Figure 16) and f
m (
Figure 17) from the values of the MQI obtained for each of the samples.
Table 3 shows the MQI obtained by visual inspection of the different masonry walls in the towers, correlated with the mechanical parameters of the construction [
13]. The characteristics of rammed earth walls were taken from existing literature [
36,
37].
3.3. Geometrical Features
In this type of defensive structures, resistance to gravity loads is not the decisive parameter in their design. In fact, assuming a standard specific weight for masonry of 20 kN/m
3, the average compressive stress is 0.2 MPa per 10 m of wall height. As seen in
Table 3 the minimum estimated value of the compressive strength of the studied walls is 1.5 MPa, which suggests this type of wall could reach a height of up to 70.5 m. Accordingly, the main issue for this type of structure is the effect of horizontal loads, especially those relating to earthquake or wind. The high vulnerability of masonry towers against such loads depends particularly on geometric characteristics directly related to their design, such as the slenderness or the number and size of the openings. Pathological processes, such as loss of verticality or cracks in walls due, for instance, to differential settlement, are also relevant [
38].
Figure 18 provides data on the slenderness of the towers in the survey. The values are shown together with the shape index, which indicates the ratio between the two main dimensions of the floor plan at level 0 (length/width). This index provides information about the homogeneity of how the structure behaves in relation to a given direction. To enable comparison between the different units, the data was classified according to the morphology of the tower in question.
The analysis reveals that tower slenderness decreased over the centuries: Andalusian towers built prior to the 16th century have a higher slenderness index than those built in later times. Thus, the average slenderness for medieval towers is around 1.80 compared to modern towers, which do not exceed 1.5. This reduced slenderness reaches its maximum expression with the modern “horseshoe-shaped” towers of the 18th century, whose slenderness is around 0.8. Such lower slenderness is the result of adaptation to the gradual introduction of long-range weaponry in siege warfare constructions. By the 15th century, weapons had acquired enough firepower to become a significant danger to defensive constructions, which needed to be adapted to withstand their impact by evolving towards more massive buildings, with no protruding edges, steep slopes and lower elevation from the ground.
Furthermore, although the average slenderness of the medieval towers is 1.5, as indicated above, that value is not representative of this typology, because it includes towers that nowadays are missing part of their original height, either due to progressive degradation by exposure to environmental agents or to the deliberate destruction of some of their levels to avoid or minimise their military usage as much as possible. Looking at the series of towers that today remain practically intact, the slenderness is around 2.0–2.5, both for the cube-shaped type, usually connected with farming, and for the cylindrical towers used as watchtowers, whose purpose was exclusively as look-outs. Slenderness is of interest because it serves as the basis to estimate the number of levels certain dilapidated medieval towers may originally have had.
As far as shape index is concerned, remarkable homogeneity of around 1.0 is found in almost all cases, which demonstrates that most towers had a floor plan of significantly square proportions. The highest dispersion occurs in the Agicampe and Jaral towers, where the index is around 1.5, thus maintaining a ratio of 1:2.
3.4. Structure Characterisation
Having completed ambient vibration testing on each of the afore-mentioned towers, their natural frequencies were calculated in the laboratory. The measurements were taken in the frequency domain and an example of the results is illustrated in
Figure 19.
Figure 20 shows the comparison made between the analytically estimated natural frequency and the empirical natural frequency identified through ambient vibration testing. In order to express correlation with the geometric characteristics of the towers under assessment, both measurements in this figure are compared to their slenderness.
Comparative analysis of the results indicates there is no direct correlation between the estimation made through empirical formulation and the results obtained from the tests. General analysis shows that, for 20% of the towers, the measurements are similar, while dispersion above the standard error is found in the rest of the towers. At a deeper level, both the estimated historical period of the construction and its morphology were assessed. Thus, for cube-shaped towers with a slenderness of less than 2.0, the estimated frequency is higher than the measured frequency, except in the Duque tower. The ratio is maintained in cylindrical towers with no exceptions. However, that is not the case for the Moya tower (horseshoe-shaped), due to a fact that relates directly to the massiveness of its construction, where the surface area of the walls on Level 0 is 72% of the total figure and 57% on Level 1.
When slenderness is compared with the estimated natural frequency (
Figure 21a), it is possible to see how the curve varies with the values obtained, which is logical given that the values for frequency were attained by applying the empirical Equation (2). On the other hand, when the ratio between slenderness and the measured natural frequency is compared (
Figure 21b), the curve is seen to adapt less that would appear to be related to the state of conservation of the structures under assessment, which include towers with significant structural damage. In fact, structures whose measured natural frequency is lower than would normally be expected given their slenderness tend to suffer from structural damage. Therefore, towers which reveal significant dispersion below the curve imply a greater presence of structural damage that influences their frequency and, therefore, their level of bracing. On the other hand, if dispersion occurs in the upper part of the curve, the structure has a satisfactory safety index against horizontal loads, most likely related to earlier restoration measures in which the original wall structure has been consolidated or reinforced.
Based on the above analysis, the towers of Urique, Esteril, Manganeto, Lagos, Duque and, to a lesser extent, Tramores do not reach the required level of stiffness in respect of their slenderness, which implies that the wall structure has significant damage affecting its bracing. Of the afore-mentioned towers, Duque is worth highlighting in that it has the greatest variation between its measured natural frequency and what could be expected given its slenderness. Intervention to reinforce its strength structure would at least need to attain a natural frequency over 4.5–5 Hz, thus achieving suitable adjustment to the curve proposed in
Figure 21b. In any case, both figures clearly show that the lower the natural frequency, the higher the slenderness of the structure, and therefore that both factors are inversely proportional.
4. Discussion
By characterising the construction of each of the towers in this study, the mechanical properties of the structural materials in the walls could be estimated, thus providing information on E, as well as on the masonry’s compressive strength. These data are essential when elaborating numerical models to assess their stability and vulnerability, especially against horizontal loads [
39]. The MQI method provides an initial approximate value for these parameters: although based on quantitative and qualitative analysis of different variables associated with the walls, it returns a wide range of values for E that need to be detailed and reduced according to the specific conditions of the structures under assessment. To do so, a correlation can be established between the natural frequency obtained from ambient vibration testing and the average values obtained for E using MQI (
Figure 22). The graphs exclude towers built with rammed earth walls, which were not included in the MQI method.
The resulting curve represents the optimal adjustment between E and the natural frequency of the structure for each type of tower. Dispersion from the curve indicates a need to adjust the value of E, bearing in mind the average value established in respect of the minimum and maximum values included in
Table 3, from which the values of E are adjusted for the towers that have higher dispersion: Campanillas and Cantal. In the case of Campanillas, the value changes from 1556 to 1828 MPa, and for Cantal, it varies from 1583 to 1859 MPa. Once the value of E has been adjusted, it is possible to fine-tune the curve and thus obtain an R
2 value of 0.88. Such adjustment is made coherently with the actual characteristics of the masonry walls in the towers. As far as the numerical analysis of masonry structures is concerned, establishing a value for the structure’s global elastic modulus is particularly relevant for an accurate assessment of its overall mechanical behaviour and as a basic starting-point to study its seismic vulnerability and develop non-linear analysis using finite element models [
40].
Furthermore, slenderness is one of the key parameters involved in the resistance of historical structures against horizontal actions such as earthquake [
41]. This study has shown the relevance of slenderness when estimating the natural frequency to be expected in these defensive structures. Slenderness can be easily worked out from the results of ambient vibration testing and can be compared with the curve proposed in
Figure 21b. In addition, depending on the percentage of dispersion from the curve, the relevance of any structural damage present in the wall can be estimated and thus its general bracing against horizontal loads assessed. Our results are sustained by other studies that propose an empirical formula to obtain the fundamental vibration frequency of historic masonry towers [
15].
In addition, also significant is how slenderness can be used to estimate the number of levels in some of the towers. Our analysis shows that medieval towers of Nasrid origin (13th–15th century) used for agricultural purposes have a slenderness between 1.8 and 2.0. Based on that value, it appears that towers with distinctly lower slenderness had no upper level, possibly, as in the case of Urique and Esteril towers, because they were pruned by Castilian conquerors to prevent them being used for defence in the event of a military uprising. On the other hand, some watchtowers from the same period would have a slenderness around 2.3–2.5, a value that serves as a reference to estimate the original height of the Guadalmansa, Viñuela or Jaral towers. In later times, slenderness is found to decrease to between 1.25 and 1.5 (16th century), a trend that continued over time to reach less than 1.0 in 18th century horseshoe-shaped towers. Slenderness analysis of the 16th and 18th-century towers in the survey reveals all of them are thought to have maintained their original proportions with no loss of any upper levels.

 ,
, 


