Article

Effect of Surface Groove Structure on the Aerodynamics of Soccer Balls

1
Faculty of Health and Sport Sciences, University of Tsukuba, Tsukuba 305-8574, Japan
2
Advanced Research Initiative for Human High Performance, University of Tsukuba, Tsukuba 305-8574, Japan
*
Author to whom correspondence should be addressed.
Appl. Sci. 2020, 10(17), 5877; https://doi.org/10.3390/app10175877
Submission received: 17 July 2020 / Revised: 11 August 2020 / Accepted: 24 August 2020 / Published: 25 August 2020
(This article belongs to the Special Issue Sports Fluid Mechanics)

Abstract

:
Soccer balls have undergone dramatic changes in their surface structure that can affect their aerodynamics. The properties of the soccer ball surface such as the panel shape, panel orientation, seam characteristics, and surface roughness have a significant impact on its aerodynamics and flight trajectory. In this study, we performed wind-tunnel tests to investigate how the introduction of grooves on the surface of a soccer ball affects the flight stability and aerodynamic forces on the ball. Our results show that for soccer balls without grooves, changing the panel orientation of the ball causes a significant change in the drag coefficient. Soccer balls with grooves exhibited a smaller change in air resistance (Cd) in the supercritical region (20 to 30 m/s; 3.0 × 10⁵Re ≤ 4.7 × 10⁵), compared to the ungrooved ball where only the panel orientation was changed. Furthermore, at power-shot speeds (25 m/s), the grooved ball exhibited smaller variations in lift force and side force than the ungrooved ball. These results suggest that a long groove structure on the surface of the soccer ball has a significant impact on the air flow around the ball in the supercritical region, and has the effect of keeping the air flow separation line constant.

1. Introduction

In recent years, a variety of patterns have been used to make the surface panels for soccer balls. The panels have undergone dramatic changes in structure, with new types of soccer balls appearing at every FIFA World Cup since the 2006 event in Germany through to the 2018 event in Russia. Recently, in addition to the official World Cup balls, soccer balls with unique panel structures have been manufactured by different sports manufacturers and have been adopted as the official balls in different soccer leagues around the world. Changes to the number of panels that make up a soccer ball have been reported to significantly affect the flight trajectory of the ball and subsequently influence the performance of players [1,2,3,4]. Similarly, it has been reported that the seam characteristics (length, depth, and width) of the panel surface also have a significant impact on the aerodynamics and flight trajectory [5]. Furthermore, the direction and number of seams can change the air flow around the soccer ball and move the position of the air flow separation line [5,6]. Researchers have also analyzed the aerodynamics and flight trajectories of balls from various other sports using a variety of techniques to investigate the effect of factors such as the roughness (bumpy dimples) of the ball’s surface [7,8,9,10,11,12,13,14,15,16].
However, the effect of design changes on aerodynamic forces, due to changes in the structure of the surface of the ball, requires further investigation. In this study, we investigated how the aerodynamics of an existing soccer ball (TUJI-FA, Nassau, four-panel) can be altered by directly introducing a groove that is shallower than the seams on the surface of the ball. In this study, conducted as basic research on the impact of grooves, the aerodynamics were examined using a soccer ball with large panels, so that new grooves could be easily introduced on the panel surface. We examined whether it is possible to change the aerodynamics of the ball in a less intrusive manner by introducing a groove structure into a ball with a fixed number of panels. We produced both new and old type (T1 and T2, respectively) soccer balls with grooves evenly inserted between the panels on the ball surface, with no change in the number of panels. We then compared an existing old-type (TUJI-FA, four-panel, T1) ball to a new-type (four-panel, T2) ball with the added groove structure, focusing on the aerodynamics of the balls and the variation in aerodynamic force due to differences in the orientation of the panels. In this study, the test focused on a fixed non-rotating soccer ball. It should be noted that measuring a rotating soccer ball is also important and will be part of a future study; however, in this case, a non-rotating ball was examined to obtain the initial basic and fundamental data.

2. Methods

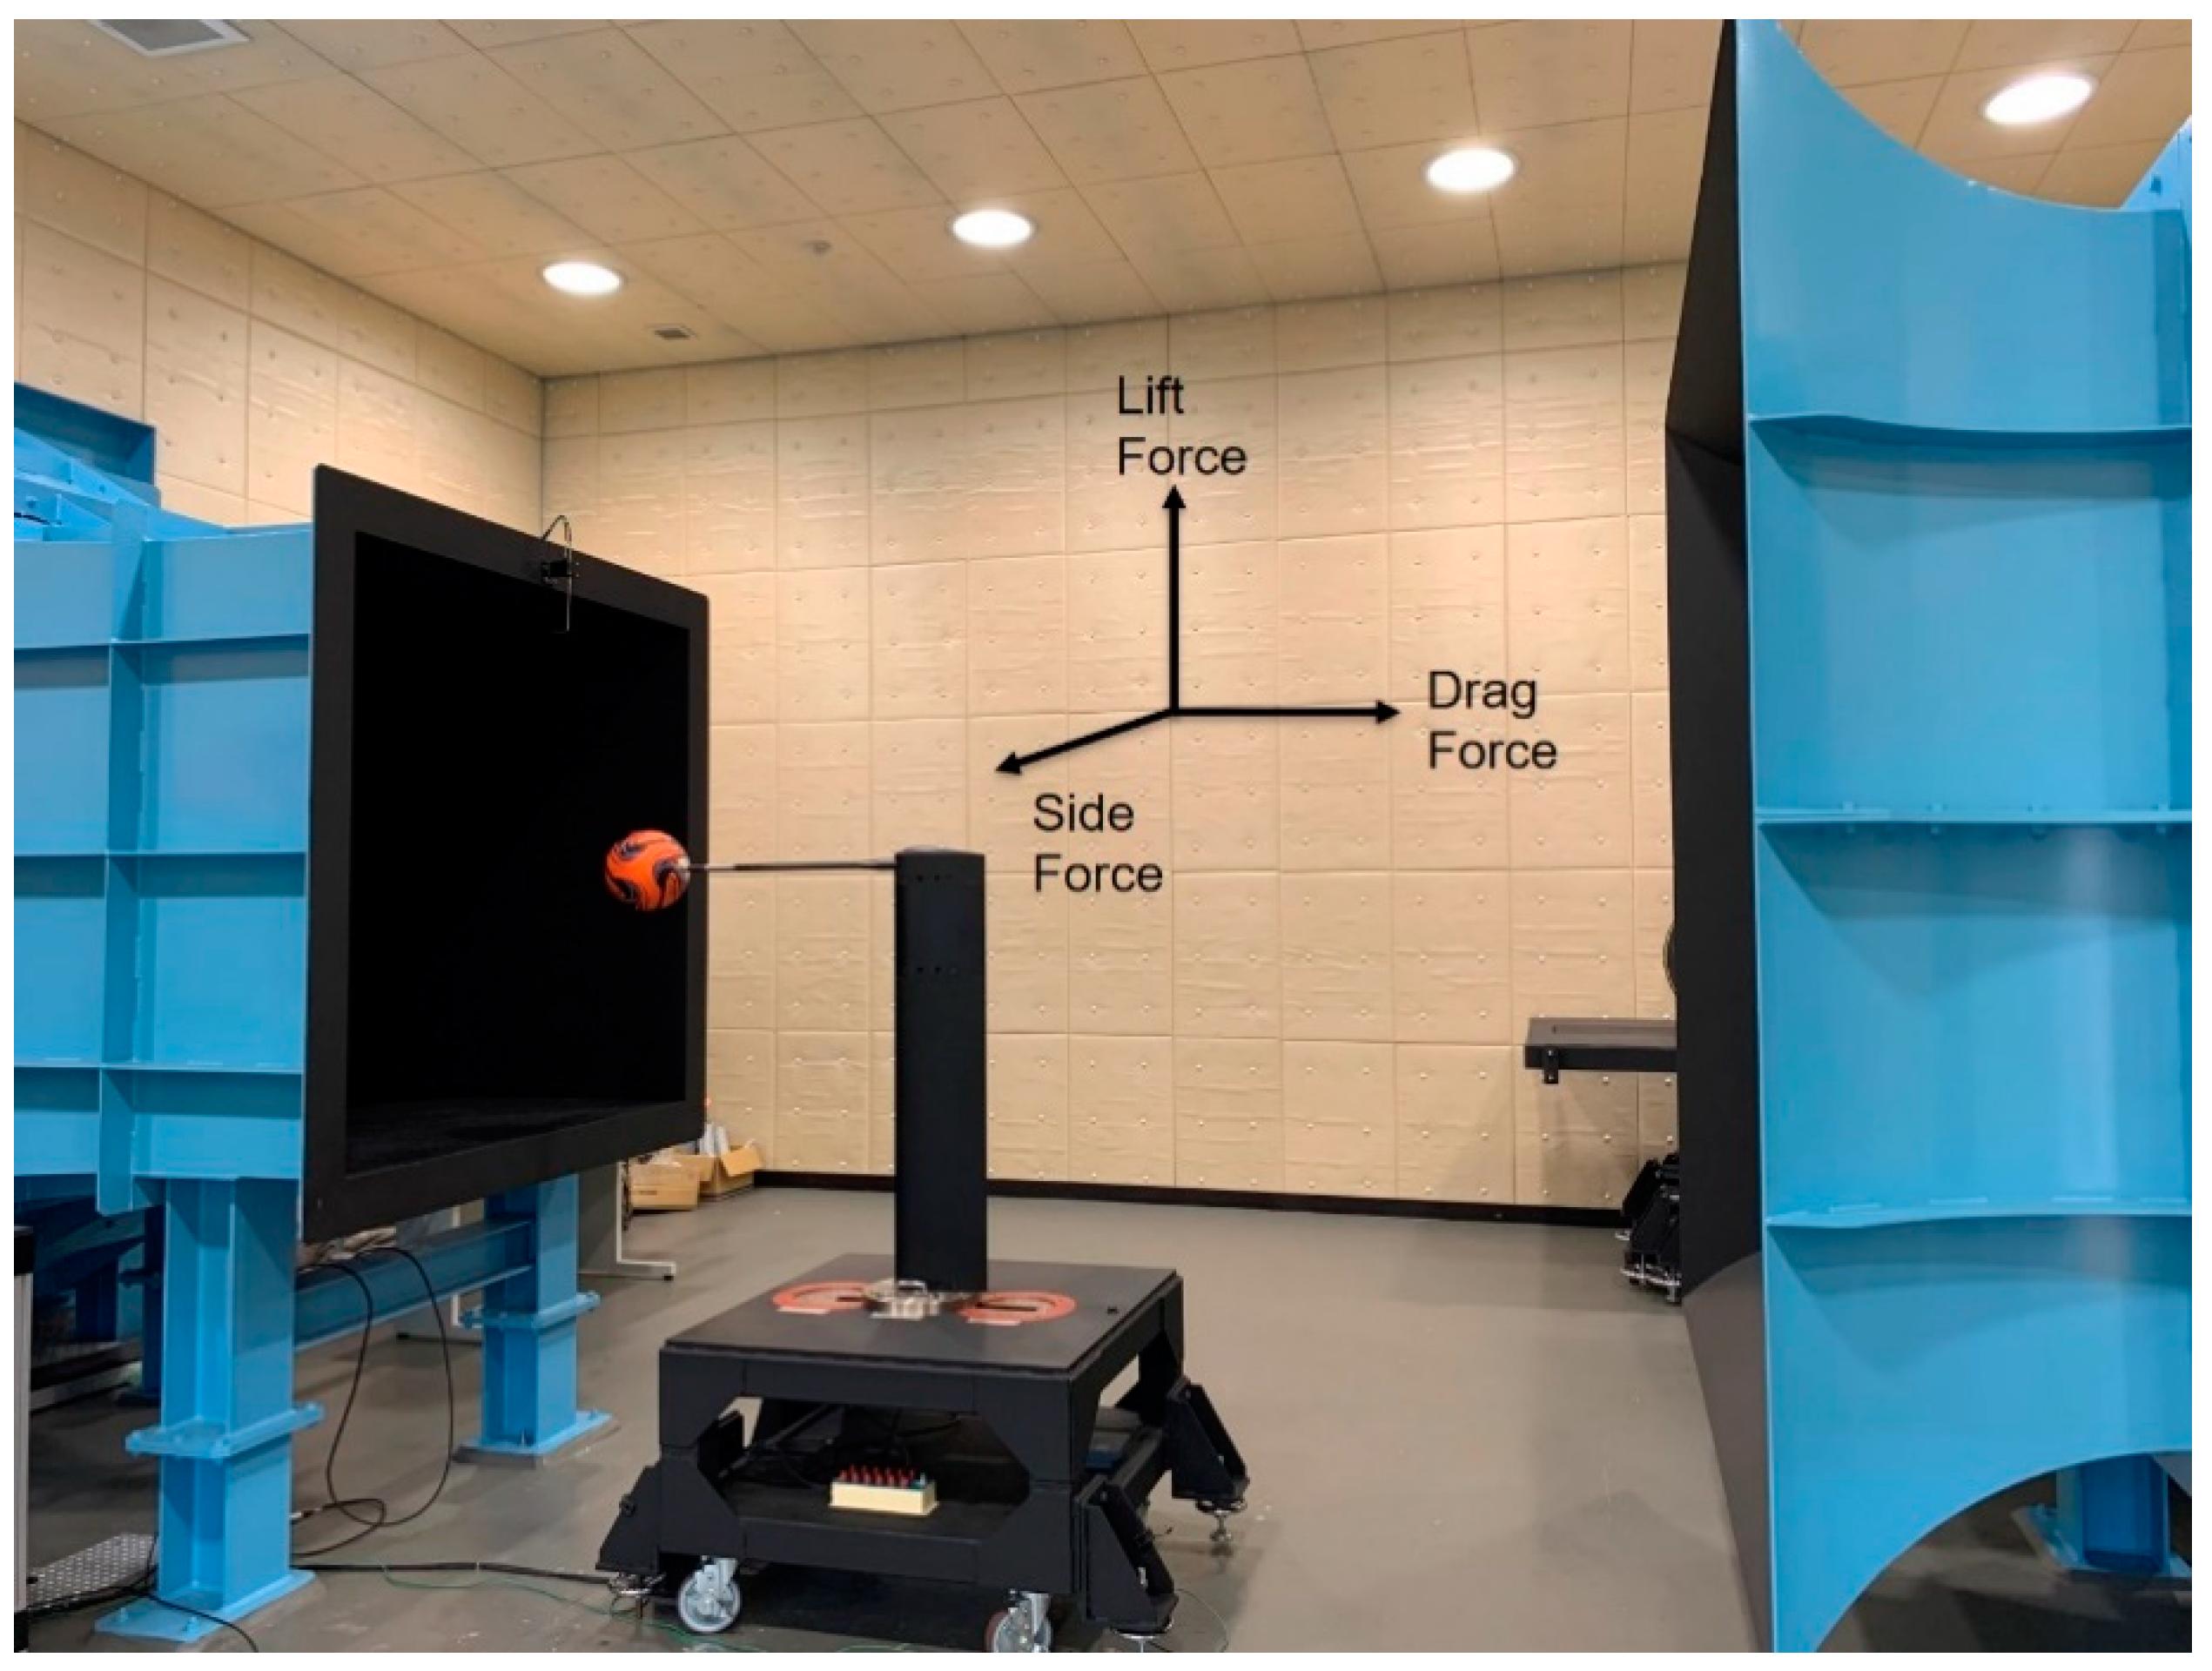
Wind-Tunnel Experiment

For this study, we used a re-circulating wind tunnel (San Technologies Co., Ltd., Tochigi, Japan) located at the University of Tsukuba (Figure 1). The maximum wind velocity of the tunnel was 55 m/s, the outlet dimensions were 1.5 m × 1.5 m, the wind velocity distribution was within ±0.5%, and the turbulence was less than or equal to 0.1%. The wind tunnel system was able to automatically measure the wind velocity at 0.1 m/s intervals from the Pitot-static tube located above the measurement position of the soccer ball. To ensure that the flow generated from the Pitot-static tube would have no direct effect on the flow around the ball, the ball was positioned at the exact center of the nozzle cross section and the distance between the nozzle and the ball was adjusted to zero for the measurements. For example, when the wind speed was set to 25 m/s, the measured mean wind speed was 25.28 m/s, with a deviation from the measurement position in the range −0.46% to 0.45% and a wind speed distribution within ±0.5%. Similarly, the degree of turbulence downstream of the nozzle when the wind speed was 25 m/s was 0.05 to 0.06, which was within approximately ±0.1%, so the error from the ball position had little effect on the wind speed. Furthermore, the measuring system can automatically measure the dynamic pressure at 0.1 Pa intervals by means of the Pitot-static tube placed above the measuring portion of the soccer ball. The length of the sting used in this study was 0.6 m, and its width was 0.02 m. All the soccer balls used in this study had the same diameter of 0.22 m, weight of 0.429 ± 0.001 kg, and internal pressure of 0.9 kgf/cm2. To measure the force of the soccer balls, we attached a round-shaped plate to the rear of the soccer ball to fix it and connected it to the sting. In this arrangement, there was no imbalance caused by changes such as distortions from a round sphere.
An old-type soccer ball (TUJI-FA, Nassau, Figure 2a) and a new-type soccer ball (Nassau, Figure 2c) were mounted on the wind tunnel for the experiments. The new soccer ball has the same four-panel structure as the old ball. However, a groove in the pattern was introduced into the new-type soccer ball (Figure 2b).
The seams on the surface of the two soccer balls used in this experiment were 10 mm wide and 3.8 mm deep. The groove introduced into the new soccer ball (T2) was 450 mm long (450 × 4 = 1800 mm total length at all four locations), 5 mm wide, and 2 mm deep (Figure 3). The grooves were carved on the ball surface using a press machine. The difference between a seam and a groove is that a seam is generated between two panels that are tied together, and, depending on the soccer ball type, they are sewn with thread or bond. A groove is a pattern introduced directly to the surface of a panel; it has a unique shape with a slightly different depth and width from that of a seam.
The aerodynamic forces on the ball were measured at two different panel orientations, i.e., A and B (Figure 4). Panel orientation (A) positions the air valve front and center, while panel orientation (B) (which is the opposite of orientation (A)) positions the point where the seams meet directly opposite the air valve at the front and center. T1_A indicates the old Type 1 soccer ball positioned at orientation A, and T1_B indicates the same ball positioned at orientation B. Similarly, T2_A indicates the new Type 2 soccer ball positioned at orientation A, and T2_B indicates the same ball positioned at orientation B (Figure 4).
We measured the aerodynamic forces applied to each ball at 1 m/s intervals at a wind velocity (U) ranging from 7 m/s (Re ≈ 1.0 × 10⁵) to 30 m/s (Re ≈ 4.7 × 10⁵), the speed interval most commonly used by actual soccer players. The Reynolds number (Re) is a dimensionless number that is defined as the ratio of inertial force to viscous force and can be expressed as
Re = UD/v
where U is the velocity (m/s), D is the ball diameter (m), and v is the kinematic viscosity coefficient (m2/s).
Air forces acting on the ball were measured during a 10 s time interval by a sting-type six-component force detector (model number LMC-61256 by Nissho Electric Works Co, Ltd., Tokyo, Japan). The data were recorded for 10 s using a PC equipped with a A/D converter board with a sampling rate of 1000 Hz. The aerodynamic forces measured in this experiment were converted into a drag coefficient (Cd), lift coefficient (Cl), and side force coefficient (Cs), as shown in Equations (2)–(4),
C d   =   2 D ρ U 2 A
C l   =   2 L ρ U 2 A
C s   =   2 S ρ U 2 A
where ρ is the air density, expressed as ρ = 1.2 kg/m3; U is the flow velocity; and A is the projected area of the soccer ball, expressed as A = π × 0.112 = 0.038 m2.

3. Results and Discussion

3.1. Drag Coefficient Variation by Ball Type

Figure 5 shows the drag characteristic curves of each soccer ball obtained from the wind-tunnel tests. We positioned T1 and T2 soccer balls with two panel orientations (A and B) (Figure 4) and measured the drag coefficient of each soccer ball at wind velocities ranging from 7 m/s to 30 m/s. The drag characteristic curves represent the mean values over three trials for each soccer ball. For each ball, the Pearson product-moment correlation coefficient for the results of the three trials was r = 0.95 (p < 0.01), suggesting that there was no significant difference between trials. In the case of the four-panel T1 with no grooves, it was observed that changing the panel orientation caused a significant change in the drag exerted on the ball. However, in the case of the T2 ball with new grooves introduced on the surface of the panel, changing the panel orientation caused slight change in the drag exerted on the ball. These drag coefficient results suggest that introducing a shallow groove into the surface of the ball is an effective way to minimize the variation in aerodynamic force due to changes in the position of the ball.
The relationship between wind velocity and drag coefficient is illustrated. T1_A indicates the drag coefficient on the Type 1 soccer ball positioned at orientation A, and T1_B indicates the same at orientation B. Likewise for the drag coefficient on the Type 2 soccer ball (T2_A, T2_B)
We found no significant difference in the critical Reynolds number (Rec) of each soccer ball under the different panel orientations. For the T1 soccer ball, the critical Reynolds number was ~2.4 × 10⁵ (Cd ≈ 0.16) under orientation A (T1_A) and ~2.4 × 10⁵ (Cd ≈ 0.16) under orientation B (T1_B). For the T2 soccer ball, the critical Reynolds number was ~2.6 × 10⁵ (Cd ≈ 0.15) under orientation A (T2_A) and ~2.5 × 10⁵ (Cd ≈ 0.15) under orientation B (T2_B). It can be observed that the difference was insignificant. However, in the case of T1, the drag coefficient values varied significantly depending on the orientation of the ball in the supercritical region (above Re = 2.5 × 10⁵) where the wind velocity is higher. The fact that the air resistance acting on the T1 soccer ball (T1_A & T1_B) varies greatly in this high-speed segment (at wind velocities of 20 to 30 m/s) suggests that changes in the orientation of the T1 soccer ball could cause significant changes in its flight. In contrast, the T2 ball (T2_A & T2_B) with grooves on the surface of the ball exhibited little orientation-dependent variation in aerodynamic force even at high velocity (Figure 5), which suggests that this ball will follow a more stable flight trajectory with less orientation-dependent variation over the course of its flight.

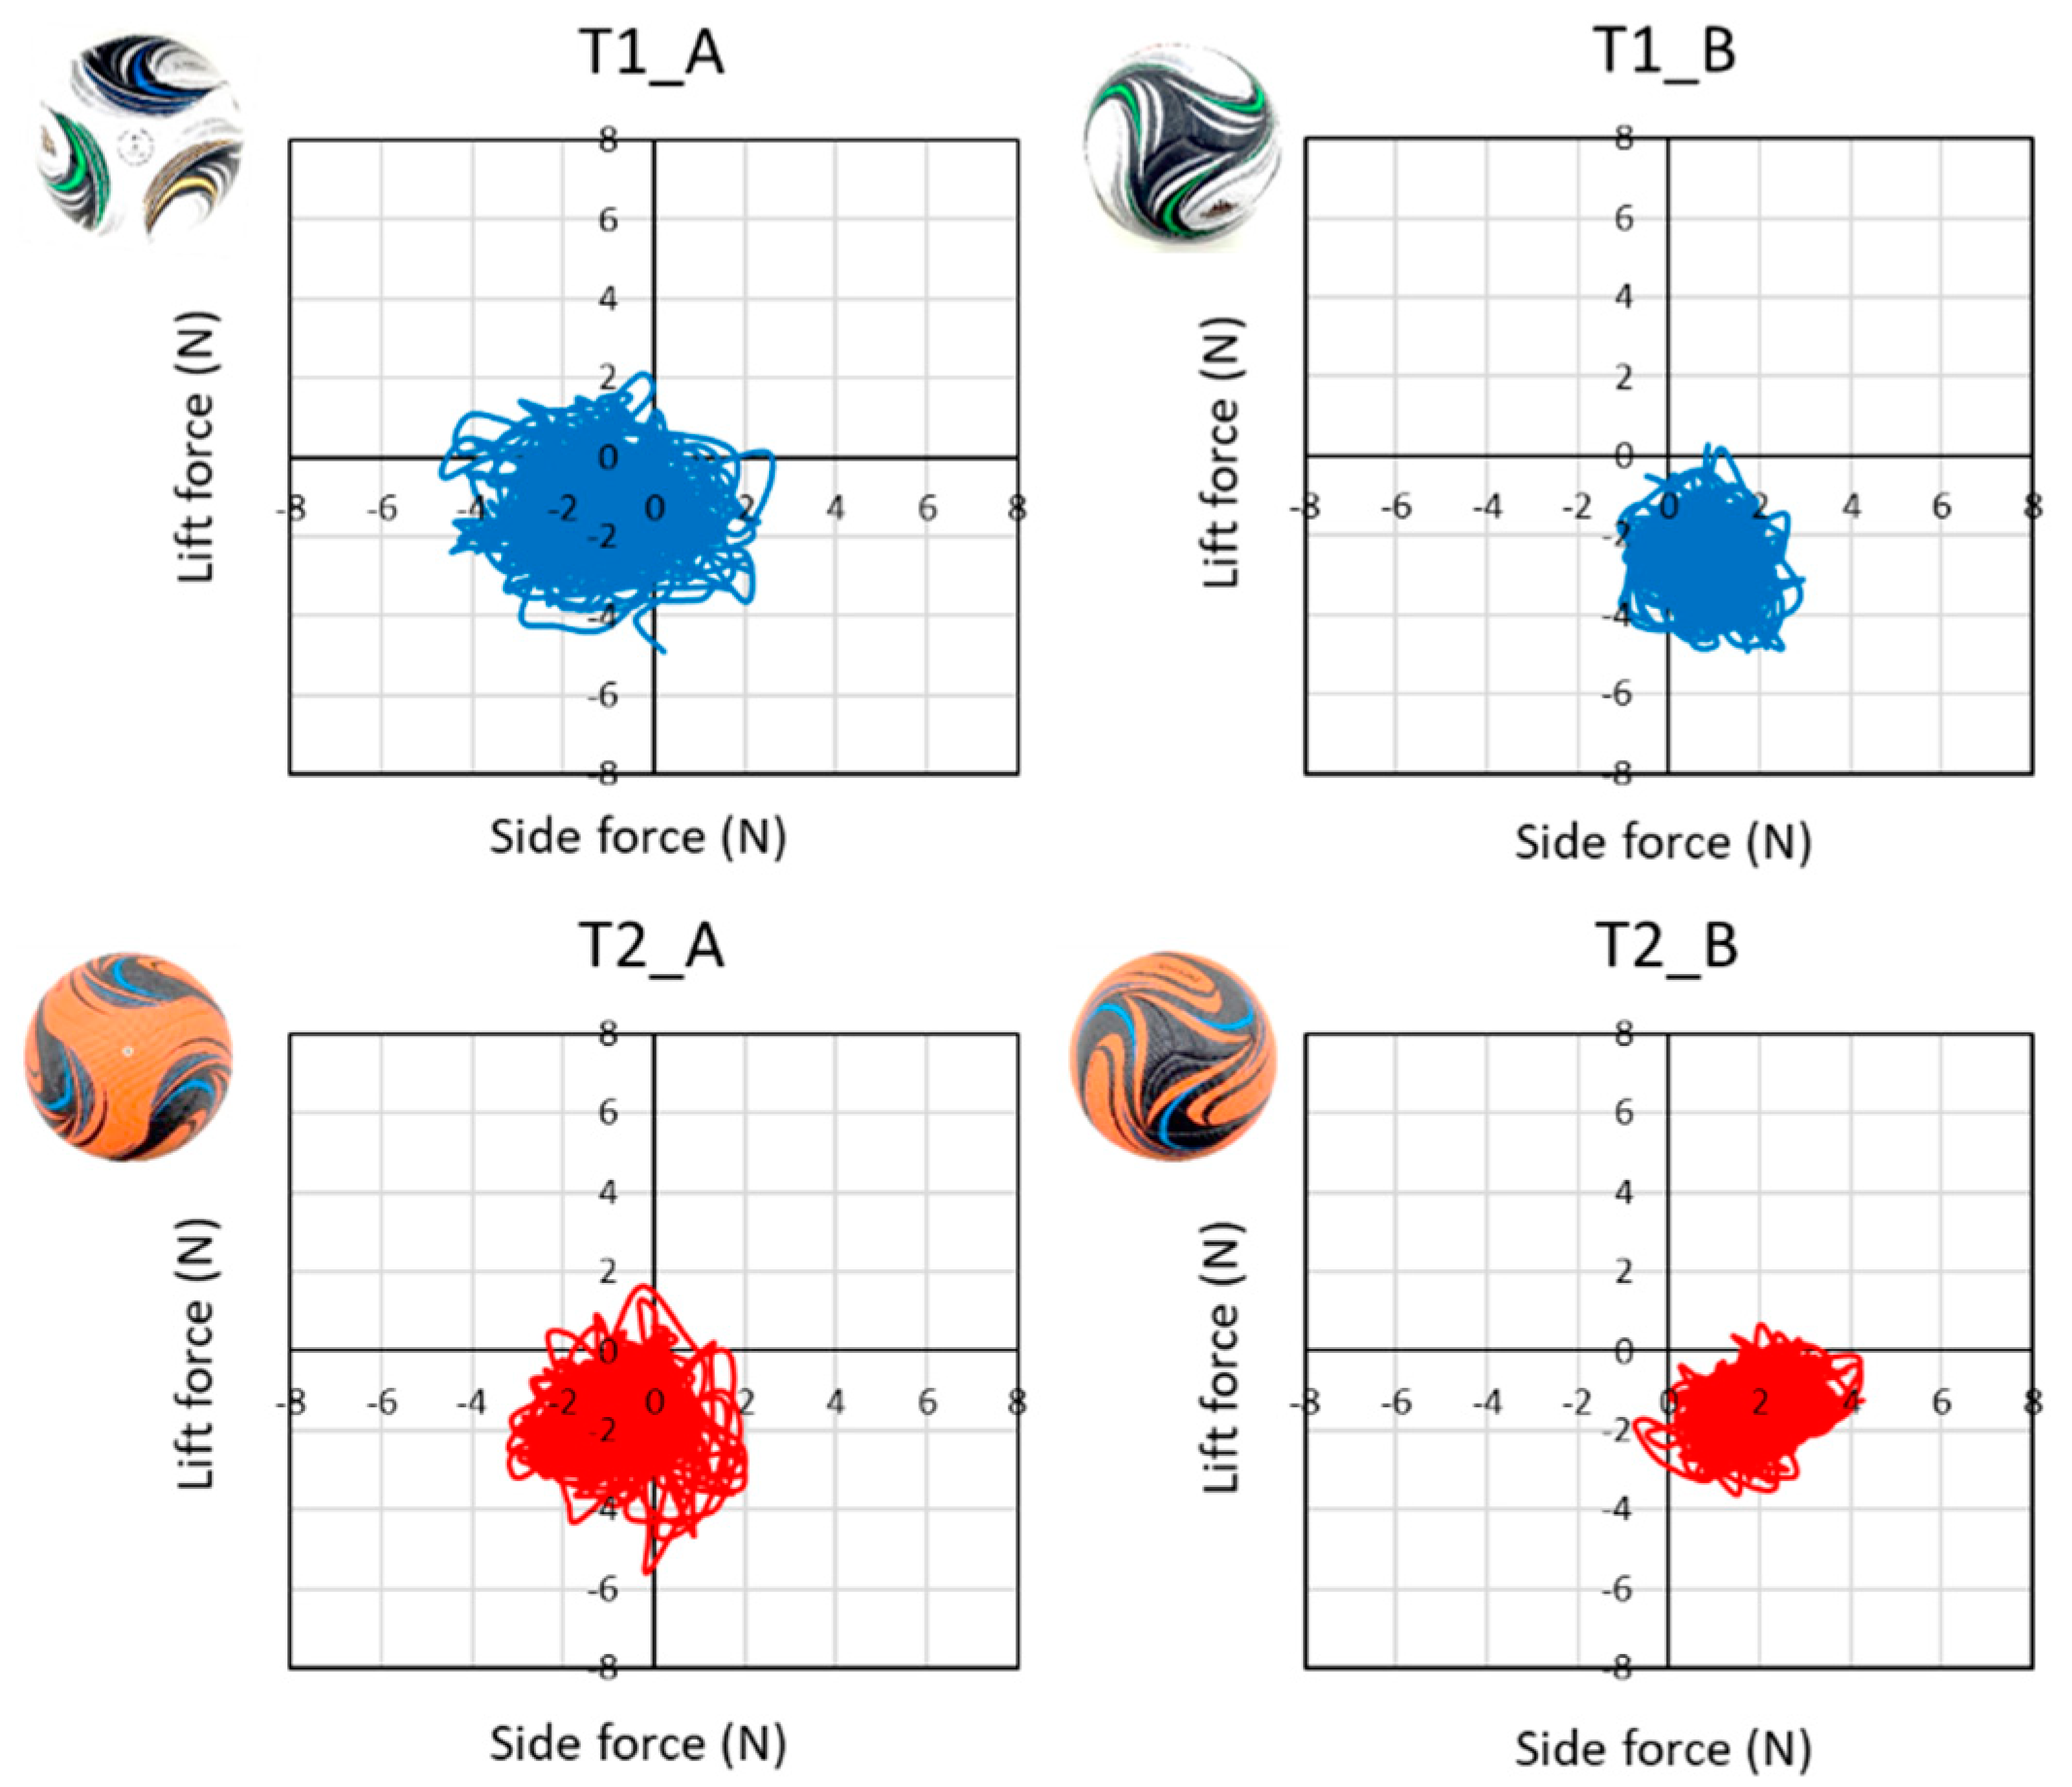
3.2. Changes in the in Lift and Side Forces over Time

Figure 6 plots the changes in standard deviations for the side and lift forces on each soccer ball for a 10 s duration at a constant wind velocity of 25 m/s. T1_A indicates the changes in the standard deviations of the side and lift forces on the Type 1 soccer ball positioned at orientation A for 10 s, and T1_B indicates the same at orientation B. Similar changes were observed for the side and lift forces on the Type 2 soccer ball (T2_A, T2_B) (10 s, wind velocity of 25 m/s). When T1 and T2 are compared, it is possible to see that the drag coefficient of T1 is more direction-dependent, but no significant difference was observed when the lift and side forces were changed.
Non-stationary forces often exhibit irregular fluctuations; furthermore, the fluctuations in the lift and side forces acting on the ball varied depending on the type of soccer ball as shown in Figure 6. Specifically, we found that the irregular fluctuations for aerodynamic force differed more between different orientations of the same ball than between different ball types (Table 1). The variations in the lift and side forces were approximately 15% smaller (p < 0.1) for the T2 ball with grooves compared to the T1 ball, which suggests that introducing a shallow groove structure on the surface of a soccer ball is an effective way to minimize the irregular vertical and horizontal force fluctuations and hence can be expected to produce a more stable flight trajectory. Specifically, the results of Figure 6 indicate that the forces standard deviation (SD) vary more widely when the orientation of the same ball is changed than when different ball types are used (Table 1).
Previous research has shown that adding a bumpy dimple pattern to the soccer ball’s surface causes the air flow separation line to move backwards, thereby reducing the force (air resistance) exerted on the ball [17]. It has also been reported that the aerodynamics of a soccer ball are significantly affected by the characteristics of its seams, in particular the length, width, and depth of the seam [1]. With respect to the length of the seam in particular, it has been reported that the longer the seam, the smaller the critical Reynolds number (Rec) [1,2]. However, in this study, the value of Rec for the T1 soccer ball (with a seam length of 2300 mm) was ~2.4 × 10⁵ (Cd ≈ 0.16) for T1_A and ~2.4 × 10⁵ (Cd ≈ 0.16) for T1_B. For the T2 soccer ball with grooves (each 450 mm long) at four locations, with a seam length of 2300 mm and a total groove length of 1800 mm, the value of Rec was ~2.6 × 10⁵ (Cd ≈ 0.15) for T2_A and ~2.5 × 10⁵ (Cd ≈ 0.15) for T2_B. The fact that the two balls exhibit little difference in the value of Rec, counter to the result from previous research [1,2] on the relationship between the length of the seam and the critical Reynolds number (Rec). This is considered to be due to the fact that the depth (2 mm) and width (5 mm) of the groove introduced in this study are shallower and narrower than the depth (3.8 mm) and width (10 mm) of the seam. In addition, previous research on golf balls has shown that the form of the dimples on the surface of the ball has a large impact on the ball’s aerodynamics, and that the ball’s wind velocity range characteristics depend on the size of the dimples [18]. We speculate that the deep seams and shallow grooves on the surface of the soccer ball in this study act like dimples of different sizes on a golf ball. Furthermore, the fact that the shallow, narrow groove reduces the air resistance in the high-velocity segment suggests that the groove structure has a significant impact on the air flow around the ball in the supercritical region.

4. Conclusions

In our previous research on the aerodynamics of soccer balls, we examined how different panel shapes and positions, the number and direction of panels [2,12], the characteristics of the seams, and the shape of the surface impacted the ball’s aerodynamic [3,4,5]. Further, for the experiment, we used existing soccer balls and made simple changes to the roughness of their surfaces by directly introducing grooves into them. For this reason, we believe this experiment was based on the results of our previous study, and the data obtained from it supports our research results concerning the surface structure of soccer balls. In this study, we conducted wind-tunnel tests on soccer balls to investigate the impact of the ball’s surface structure on its aerodynamics. We compared the aerodynamics of an actual Type 1 (T1) soccer ball with an actual Type 2 (T2) soccer ball that was modified by introducing a groove into the surface of the ball. The wind-tunnel tests show that the ungrooved T1 soccer ball has a higher level of dependence on the panel orientation, and that changes to the panel orientation can produce significant changes in the drag exerted on the T1 ball. In contrast, the T2 ball with grooves on the surface of the ball exhibited little orientation-dependent variation in drag, which suggests that this ball delivers a more uniform and stable flight than the T1 ball. This is because the long and shallow grooves on the surface of the T2 ball stabilize or regularize the air flow around the ball, thereby minimizing the movement of the air flow separation line. In this study, the test was conducted on a non-rotating soccer ball and the aerodynamic forces acting on a fixed soccer ball were measured. However, since rotating balls are more frequent than non-rotating balls in actual matches, we intend to perform measurements on a rotating soccer ball, using a wind tunnel, in future studies. Since this is a basic study that does not consider the air flow, we are currently using a 3D CFD (Computational Fluid Dynamics) software based on the lattice Boltzmann method [19] to analyze how these surface shapes affect the air flow on the ball surface and the position of the detachment points. Additionally, we plan to use visualization methods such as PIV (Particle Image Velocimetry) to conduct a more detailed investigation of how the structure of the grooves on the surface of the soccer ball affects the structure of air flow around the ball (generation, decay, and detachment) and the movement of the points of air flow separation.

Author Contributions

Conceptualization, S.H. and T.A.; methodology, S.H.; software, S.H.; validation, S.H.; formal analysis, S.H.; investigation, S.H.; resources, S.H. and T.A.; data curation, S.H. and T.A.; writing—original draft preparation, S.H.; writing—review and editing, S.H.; funding acquisition, S.H. and T.A. All authors have read and agreed to the published version of the manuscript.

Funding

This research was funded by the Ministry of Education, Culture, Sports, Science and Technology of the Japanese government, JSPS KAKENHI grant number 15K16442, 20K11413 and 20H04066.

Conflicts of Interest

The authors declare no conflict of interest.

References

  1. Naito, K.; Hong, S.; Koido, M.; Nakayama, M.; Sakamoto, K.; Asai, T. Effect of seam characteristics on critical Reynolds number in footballs. Mech. Eng. J. 2018, 5, 17-00369. [Google Scholar] [CrossRef] [Green Version]
  2. Hong, S.; Asai, T. Effect of panel shape of soccer ball on its flight characteristics. Sci. Rep. 2014, 4, 5068. [Google Scholar] [CrossRef] [PubMed]
  3. Goff, J.E.; Hong, S.; Asai, T. Aerodynamic and surface comparisons between Telstar 18 and Brazuca. Proc. Inst. Mech. Eng. Part P J. Sports Eng. Technol. 2018, 232, 342–348. [Google Scholar] [CrossRef]
  4. Goff, J.E.; Asai, T.; Hong, S. A comparison of Jabulani and Brazuca non-spin aerodynamics. Proc. Inst. Mech. Eng. Part P J. Sports Eng. Technol. 2014, 228, 188–194. [Google Scholar] [CrossRef] [Green Version]
  5. Hong, S.; Asai, T.; Seo, K. Visualization of air flow around soccer ball using a particle image velocimetry. Sci. Rep. 2015, 5, 15108. [Google Scholar] [CrossRef] [PubMed] [Green Version]
  6. Goff, J.E.; Hong, S.; Asai, T. Effect of a soccer ball’s seam geometry on its aerodynamics and trajectory. Proc. Inst. Mech. Eng. Part P J. Sports Eng. Technol. 2019, 234, 19–29. [Google Scholar] [CrossRef]
  7. Passmore, M.A.; Rogers, D.; Tuplin, S.; Harland, A.; Lucas, T.; Holmes, C. The aerodynamic performance of a range of FIFA-approved footballs. Proc. Inst. Mech. Eng. Part P J. Sports Eng. Technol. 2011, 226, 61–70. [Google Scholar] [CrossRef] [Green Version]
  8. Aoki, K.; Muto, K.; Okanaga, H. Aerodynamic characteristics and flow pattern of a golf ball with rotation. Procedia Eng. 2010, 2, 2431–2436. [Google Scholar] [CrossRef] [Green Version]
  9. Djamovski, V.; Rosette, P.; Chowdhury, H.; Alam, F.; Steiner, T. A comparative study of rugby ball aerodynamics. Procedia Eng. 2012, 34, 74–79. [Google Scholar] [CrossRef] [Green Version]
  10. Price, D.S.; Jones, R.; Harland, A.R. Computational modelling of manually stitched soccer balls. Proc. Inst. Mech. Eng. Part L J. Mater. Des. Appl. 2006, 220, 259–268. [Google Scholar] [CrossRef]
  11. Asai, T.; Ito, S.; Seo, K.; Hitotsubashi, A. Fundamental aerodynamics of a new volleyball. Sports Technol. 2010, 3, 235–239. [Google Scholar] [CrossRef] [Green Version]
  12. Hong, S.; Weon, B.M.; Nakanishi, Y.; Kimachi, K.; Seo, K.; Asai, T. Aerodynamic effects of a panel orientation in volleyball float serve. In Proceedings of the 2018 International Society of Biomechanics in Sports, Auckland, New Zealand, 10–14 September 2018; pp. 1–4. [Google Scholar]
  13. Hong, S.; Asai, T.; Weon, B.M. Surface patterns for drag modification in volleyballs. Appl. Sci. 2019, 9, 4007. [Google Scholar] [CrossRef] [Green Version]
  14. Asai, T.; Nakanishi, Y.; Akiyama, N.; Hong, S. Flow Visualization of Spinning and Nonspinning Soccer Balls Using Computational Fluid Dynamics. Appl. Sci. 2020, 10, 4543. [Google Scholar] [CrossRef]
  15. Thomson, J.J. The dynamics of a golf ball. Nature 1910, 85, 2151–2157. [Google Scholar]
  16. Mehta, R.D.; Bentley, K.; Proudlove, M.; Varty, P. Factors affecting cricket ball swing. Nature 1983, 303, 787–788. [Google Scholar] [CrossRef]
  17. Hong, S.; Asai, T. Aerodynamic effects of dimples on soccer ball surfaces. Heliyon 2017, 3, e00432. [Google Scholar] [CrossRef] [PubMed]
  18. Naruo, T.; Mizota, T. The influence of golf ball dimples on aerodynamic characteristics. Procedia Eng. 2014, 72, 780–785. [Google Scholar] [CrossRef] [Green Version]
  19. Chen, H. Volumetric formulation of the lattice Boltzmann method for fluid dynamics: Basic concept. Phys. Rev. E 1998, 58, 3955–3963. [Google Scholar] [CrossRef]
Figure 1. Wind-tunnel setup.
Applsci 10 05877 g001
Figure 2. Soccer balls used in this experiment: (a) old-type soccer ball (T1), (b) shape of the groove introduced into the ball surface (at four locations), and (c) new-type soccer ball (T2) with grooves.
Applsci 10 05877 g002
Figure 3. Seam and groove structure: (a) the width and depth of the seam and (b) the groove structure.
Applsci 10 05877 g003
Figure 4. Soccer balls used in this experiment and their panel orientations.
Applsci 10 05877 g004
Figure 5. Drag coefficient of the soccer balls.
Applsci 10 05877 g005
Figure 6. Scatter diagrams of changes in the lift and side forces acting on the balls in the wind tunnel test.
Applsci 10 05877 g006
Table 1. Mean and standard deviation of the lift and side forces on the soccer balls used in this experiment (10 s at wind velocity of 25 m/s).
TypeT1_AT1_BT2_AT2_B
Side ForceLift ForceSide ForceLift ForceSide ForceLift ForceSide ForceLift Force
Mean−1.10−1.380.77−2.69−0.83−1.741.85−1.50
SD1.231.050.700.800.920.880.740.70

