Article

Understanding Time-Evolving Citation Dynamics across Fields of Sciences

Department of Artificial Intelligence and Software Technology, Sunmoon University, Asan-si 31460, Chungcheongnam-do, Korea
Appl. Sci. 2020, 10(17), 5846; https://doi.org/10.3390/app10175846
Submission received: 23 July 2020 / Revised: 11 August 2020 / Accepted: 18 August 2020 / Published: 24 August 2020
(This article belongs to the Special Issue Bayesian Inference in Inverse Problem)

Abstract

:
Scholarly publications draw collective attention beyond disciplines, leading to highly skewed citation distributions in sciences. Uncovering the mechanisms of such disparate popularity is very challenging, since a wide spectrum of research fields are not only interacting and influencing one another but also time-evolving. Accordingly, this study aims to understand citation dynamics across STEM fields in terms of latent affinity and novelty decay, which is based upon Bayesian inference and learning of the Affinity Poisson Process model (APP) with bibliography data from the Web of Science database. The approaches shown in the study can shed light on predicting and interpreting popularity dynamics in diverse application domains, by considering the effect of time-varying subgroup interactions on diffusion processes.

1. Introduction

Individual information items compete for our attention and generate varied scales of cascade sizes via information diffusion processes. Forecasting the popularity growth over time is significant in a variety of application domains such as online social networking, e-commerce, marketing, risk management, and public policy in order to establish timely strategies and make an efficient control [1]. Accordingly, there have been attempts to predict an individual item’s future diffusion trend among diverse communities in online social media [2,3,4,5], academia [6,7], or a nation [8]. However, despite recent advancements in popularity prediction, most prior work has neglected the effects of subgroup interactions on diffusion processes. That is, different social groups interact and exert disproportionate influences on each item’s popularity with their own set of interest and motives [9]. For instance, a scholarly paper’s citation volume is not only influenced by its own field’s attention but also dependent on time-evolving interrelationships with other fields in science due in part to interdisciplinary collaborations, research funds, and scientific movements. In this context, our prior work [9] has proposed the Affinity Poisson Process (APP) for a general framework in order to model popularity dynamics across subpopulations in a complex social system.
This study aims to show how we can interpret rich context of popularity disparity in scholarly publications and to understand time-evolving citation dynamics across fields of sciences, based upon Bayesian inference and learning of the APP. For interpretation, three important counter-balancing factors are investigated: (1) latent affinity between different research communities (fields), considering the effect of intra- and inter-field interactions on popularity growth of publications, (2) heterogeneous preferential attachment reflecting different cumulative popularity within each research field, and (3) field-level time decay capturing fading attention to publications, varying from field to field. Such rich context, attributed subpopulation-level affinity, enables the way of interpretation to be more applicable to a broad range of real-world diffusion scenarios.
For this study, interdisciplinary citation volumes of individual journals are predicted with the APP and two baselines, by using bibliography data from the Web of Science database [10]. This data covers 108 subjects in STEM fields during the last two decades between 1991 and 2011. For macro-level analysis, 108 subjects are grouped into higher-level research subfields and fields, by referring to the classifications of academic programs by the National Research Council (NRC) [11]. Target NRC fields are: (1) Agricultural Sciences (AS), Biological & Health Sciences (BH), Engineering (EG), and (4) Physical & Mathematical Sciences (PM). By conducting experiments on real data, prediction error with the APP is reduced by 15% and 27% over two baselines. Based on parameter estimation, interdisciplinary citation flow in STEM fields is examined in accordance with the counter-balancing factors. In general, the four NRC fields become more interdisciplinary over time, but with time-varying intra- and inter-field affinity. In terms of novelty decay, the EG, PM, AS, and BH fields are aging in that order. The AS and PM fields exhibit slower decay of earlier publications, while the EG field shows the opposite trend, i.e., faster decay of earlier publications. In particular, the BH field shows a consistent aging for different year publications.
To the best of the author’s knowledge, present work is the first to incorporate the effect of subfield interactions on interdisciplinary popularity growth of publications across fields of sciences, which has been neglected in previous studies. This study can help reveal attention-space dynamics across subpopulations, applicable to a wide range of diffusion scenarios in the real world.
In the rest of this paper, Section 2 begins with the reviews of related work. Section 3 explains the background of our proposed framework for diffusion processes across a heterogeneous social system. Section 4 conducts experiments on real data for predicting interdisciplinary citation volumes of individual journals. Section 5 interprets citation dynamics across fields of sciences based on parameter estimation, and finally Section 6 concludes this study with future directions.

2. Related Work

The explosive growth of scientific papers makes it challenging to keep track of all relevant publications. Consequent selective attention not only decays differently in sciences [12], but also leads to forming heavy-tailed distributions of citation volumes [13] with core-periphery linkage structures in literature [14]. As collaboration increasingly plays a crucial role [12,15], its patterns have been investigated with diverse angles, such as distinct modes in the distribution of collaborators [16], the growth of interorganizational collaboration and its driving to field evolution [17], and multiuniversity research teams beyond geographical and disciplinary boundaries [18]. In the context of such skewed popularity and boundless collaborations in sciences, this study focuses on understanding interdisciplinary citation flow in STEM fields, mainly based upon (1) the estimation of latent influence on knowledge propagation and (2) the prediction of citation volumes.
In terms of latent influence, it has been one of essential topics for diffusion studies to infer propagation trajectories of target individual items. For example, causal relationships are estimated by information-theoretic measures at micro [19] and macro levels [20]. Also, both external and internal influences have been quantified to infer their effect on diffusion of Web posts [21,22] or scholarly papers [23]. However, most of the previous studies need prior knowledge of current social network structures, which increases dependency on data and thus limits applicability to real-world scenarios.
On the other hand, predicting popularity of individual items helps understand the underlying diffusion process; i.e., how it has driven drastic popularity disparity [24]. For understanding dynamics of collective attention, the spread of information has been considered as a point process for modeling random events in time and predicting its popularity, based upon Poisson processes [9,22,25] and Hawkes processes [2,8,26]. As a generative probabilistic model, a point process can be easily incorporated into the Bayesian framework to account for Bayes factors and model selection [27,28] via filtering theory [29], or for composite factors [4,6,7,30] such as time relaxation and cumulative attention space. Under the Bayesian framework, these all point process approaches not only improve prediction power but also remove the dependency on domain-specific knowledge by considering the lasting impact of an individual item [1].
However, they all ignore the effect of interactions between subgroups on diffusion processes, which results in inaccurate predictions and insufficient context of popularity distributions. In this study, both perspectives are covered based upon our prior work [9] on generative temporal processes, without dependency on social network structures but with disproportionate influence of different subgroups as a latent factor.

3. Background

A fundamental assumption of citation flow is that most bodies of information are organized into categories or fields of varying levels of concreteness and abstraction. In academia, information is situated in abstract areas like physics, chemistry, and computer science. These areas are then composed of research fields, such as when computer science entails artificial intelligence and software engineering. In particular, this study targets publications in STEM fields for understanding interdisciplinary citation dynamics across major branches of sciences.

3.1. Interdisciplinary Citation Flow

Academic publications are increasingly cited crossing the border of various disciplines, which implies that research becomes more interdisciplinary and collaborative between scholars from different scientific fields [1,9,31]. Accordingly, Figure 1 illustrates the concept of underlying interdisciplinary citations across diverse fields of sciences. As the figure shows, an individual paper p i is cited by publications from its own and/or distinct fields, which is affected by time-evolving intrafield attention as well as interfield affinity.
In this regard, our new framework [9], Affinity Poisson Process (APP), has been proposed to model diffusion processes across a heterogeneous social system and provide interpretable insights, by incorporating latent affinity between subpopulations. This model has shown high performance in predicting citation volumes of publications in computer science, by reducing error an additional 50% compared to the state-of-the-art baselines. That is mainly because the proposed model considers the effect of subgroup interactions on the popularity growth of individual items. In the next section, the main idea of the APP is introduced.

3.2. Affinity Poisson Process

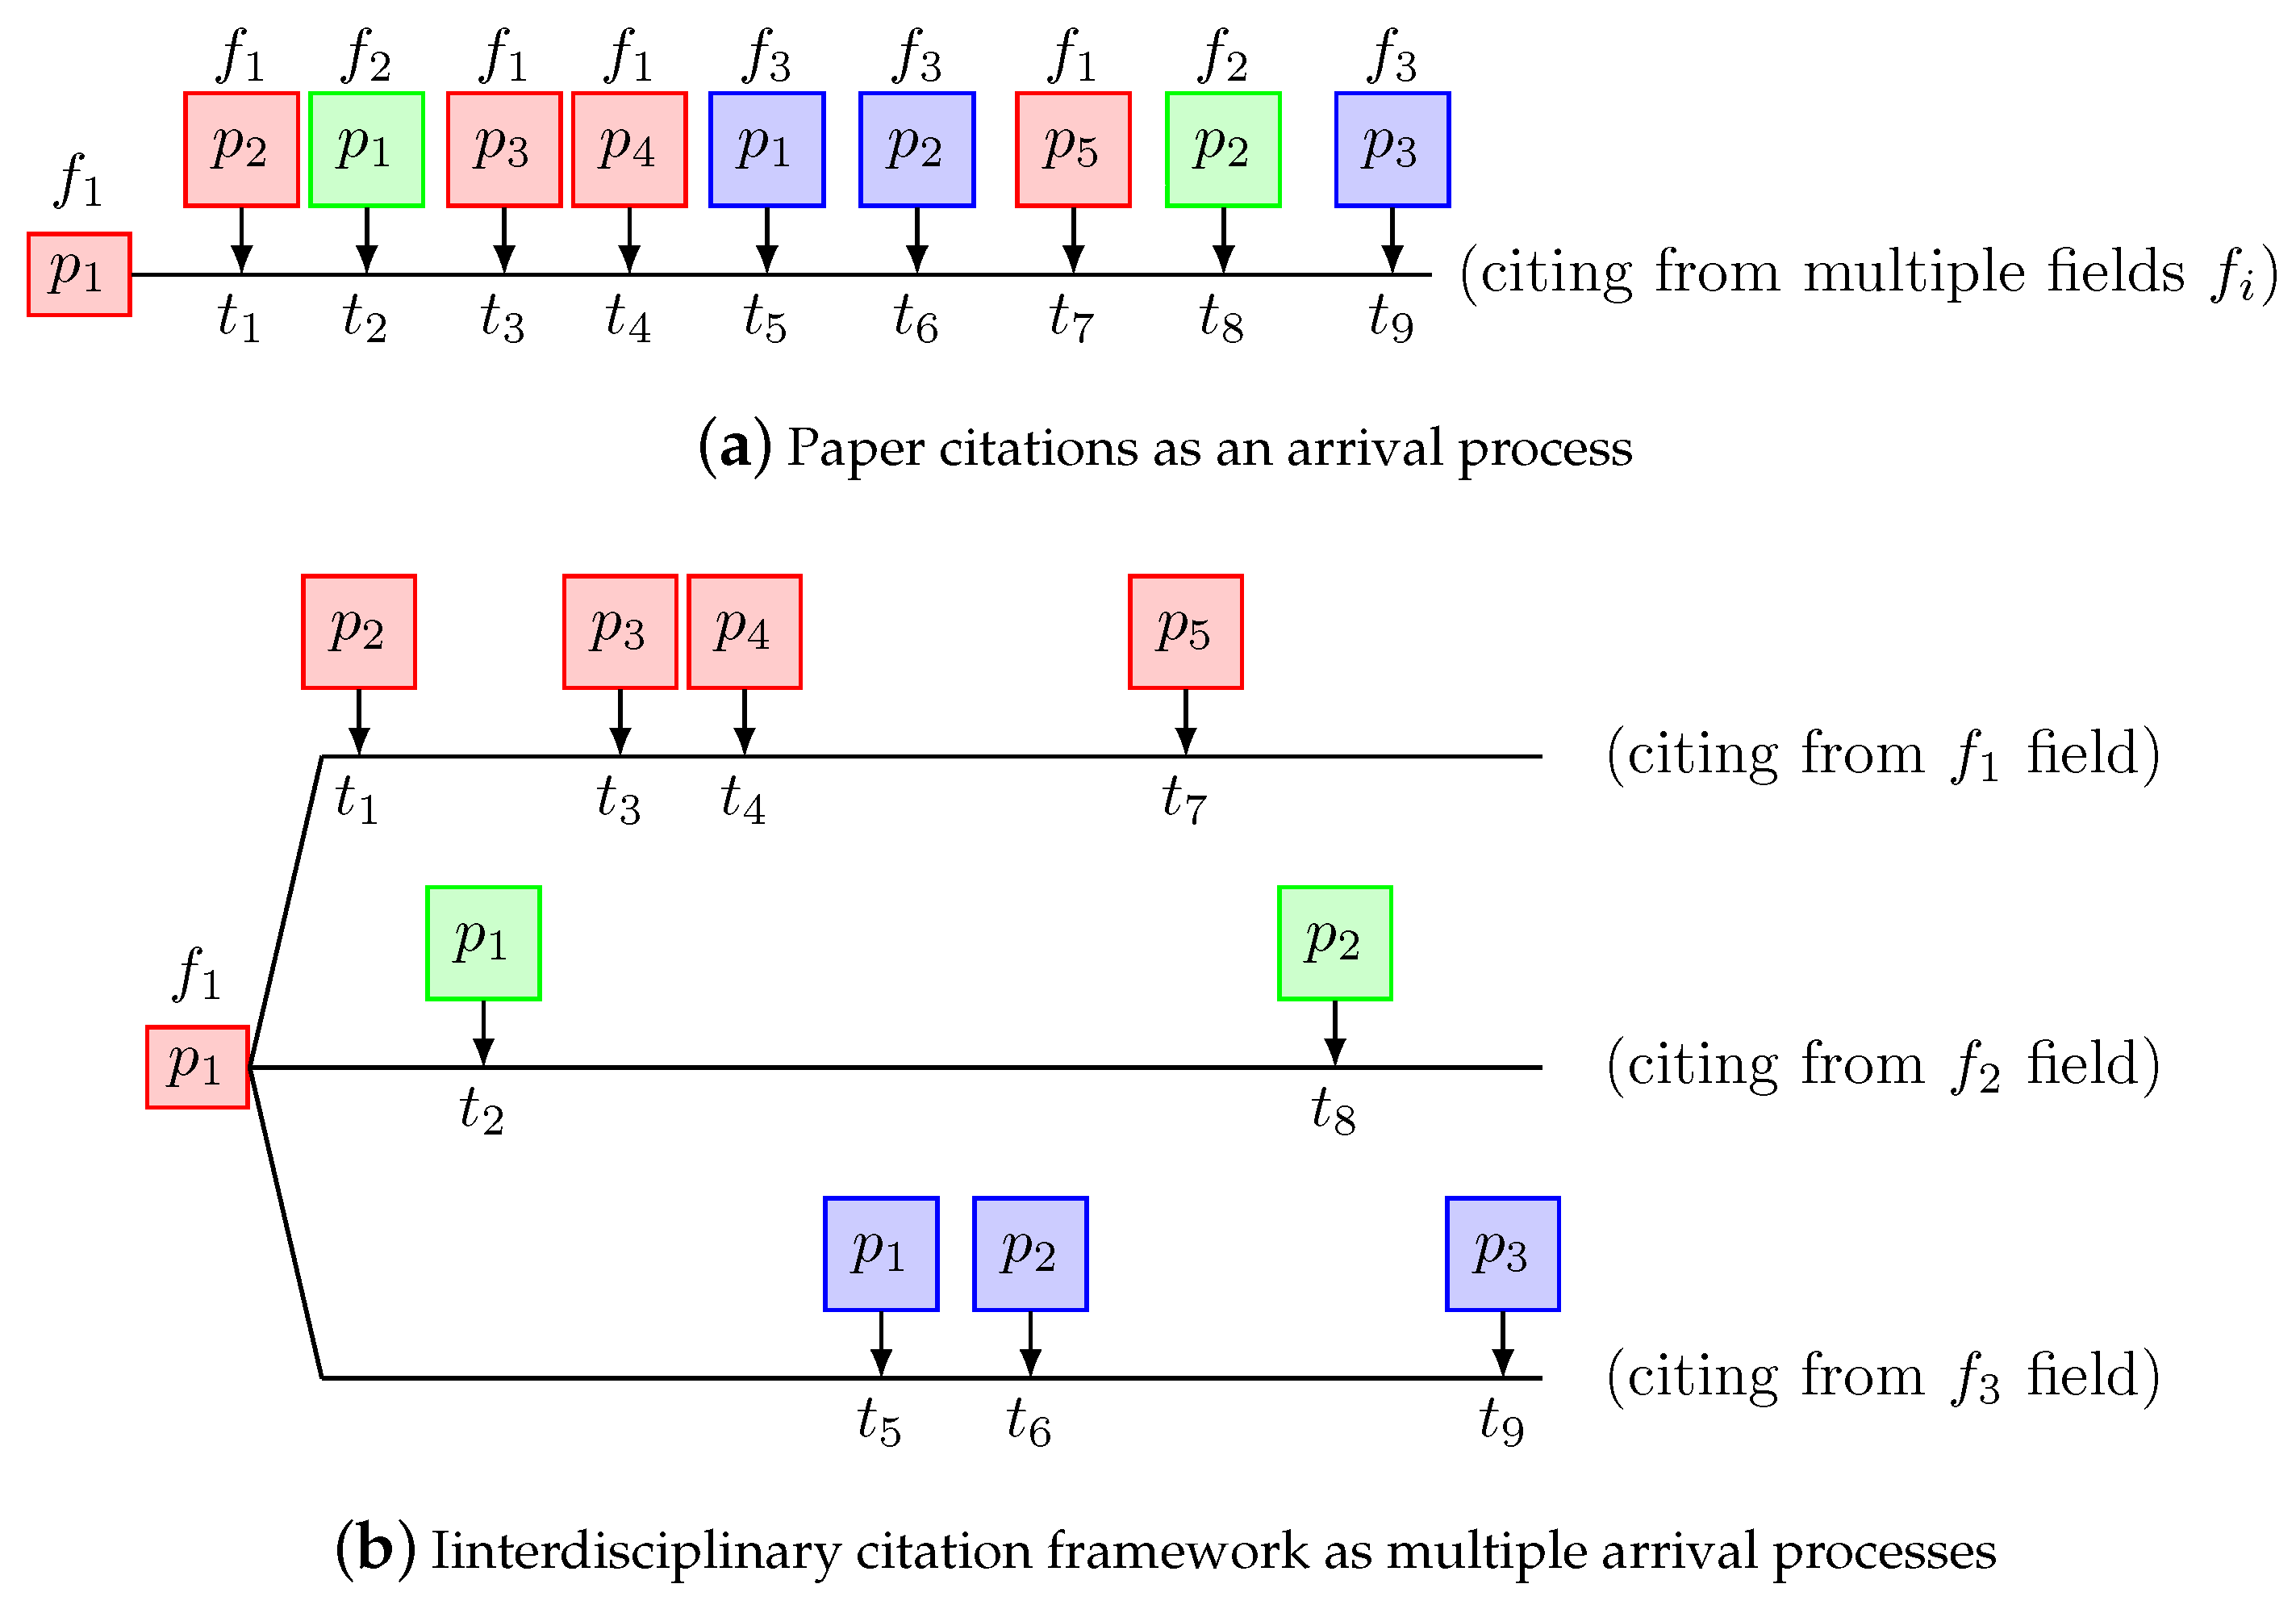
Figure 2a shows an example that a paper p 1 accumulates citations over time, which can be considered as each citing paper’s arrival at its publication time. Prior work [6] modeled such arrivals as a Poisson process with one intensity function. That is, paper citations are indistinguishable and homogeneous regardless of a citing paper’s research field. However, as research become more interdisciplinary, an individual paper is likely cited by both internal and external publications from the same and other research fields respectively. Thus, the single horizontal timeline in Figure 2a cannot differentiate varying citation intensities generated by numerous fields over time. In other words, the prior work has neglected disproportionate influences of different fields on individual papers’ citations, exposing limitations of understanding interdisciplinary citation dynamics across fields of sciences.
In this respect, a new framework has been proposed to model popularity dynamics by incorporating heterogeneous nature of a social system consisting of subgroups interacting one another (i.e., intra- and interfield interactions) and view the paper citations as the superposition of multiple Poisson processes for different citing fields [9]. As shown in Figure 2b, the paper citations are now decomposed into different timelines depending on the research fields of citing papers, and each timeline is modeled as an independent Poisson process. Since the superposition of Poisson processes is still a Poisson process [32], the new framework extends the prior work [6] from a homogeneous citation process to cross-field popularity dynamics.
Problem Statement. In more detail, let us first define a set of research fields F in sciences and focus on the paper citations in one specific field f cited     F . Suppose that the i-th paper ( i   =   1 ,   ,   I ) in the cited field f cited , published at time t   =   0 , has received N i f citations from a citing field f     F during a time period [ 0 ,   T ] . When the citations came from the same field, they are called internal citations (i.e., f cited   =   f ), otherwise called external citations (i.e., f cited     f ). Then, paper i’s citation timestamps from each citing field f, D i f consist of the publication times of the citing papers such that
D i f = { t n f     n   =   1 ,   ,   N i f ,   0   t n f     T } .
By aggregation, the citation timestamps of the cited field receiving from each field f, D f and from all citing field D are respectively,
D f   =   { D i f     i   =   1 ,   ,   I } , D   =   { D f     f     F } .
Note that the timestamps are shifted by the publication time of the cited paper for simplicity. The fundamental objective is to predict individual paper i’s citation volume c i ( t ) at time t, by learning model parameters from all the citation histories D received by i’s research field. In a more general statement, it is aimed to predict the popularity of each information item at an arbitrary time based on its popularity histories.
Citation Intensity. As shown in Figure 2a, the time-series citations received by paper i are modeled as a nonhomogeneous Poisson process for representing paper i’s citation intensity λ i ( t ) . Based on the superposition property of Poisson processes, as shown in Figure 2b, λ i ( t ) can be represented as the sum of citation intensities receiving from each citing field f     F , λ i f ( t ) ,
λ i ( t )   =   f F λ i f ( t ) .
Here, three important counter-balancing factors are considered to determine λ i f ( t ) : (1) citing field f’s latent affinity to cited one ξ f , (2) heterogeneous preferential attachment to paper i in the field f, c i f ( t ) , and (3) paper i’s fading attractiveness in the field f as the time decay function p i f ( t ) as
λ i f ( t )   =   ξ f   ·   ( n 0   +   c i f ( t ) )   · p i f ( t ;   θ i f ) ,
where n 0 represents the prior citations for each time line, and θ i f   =   ( μ i f ,   σ i f ) denotes the parameters (mean and standard deviation) of lognormal distributions. For details, refer to [9]. Table 1 summarizes the notation used throughout the paper.
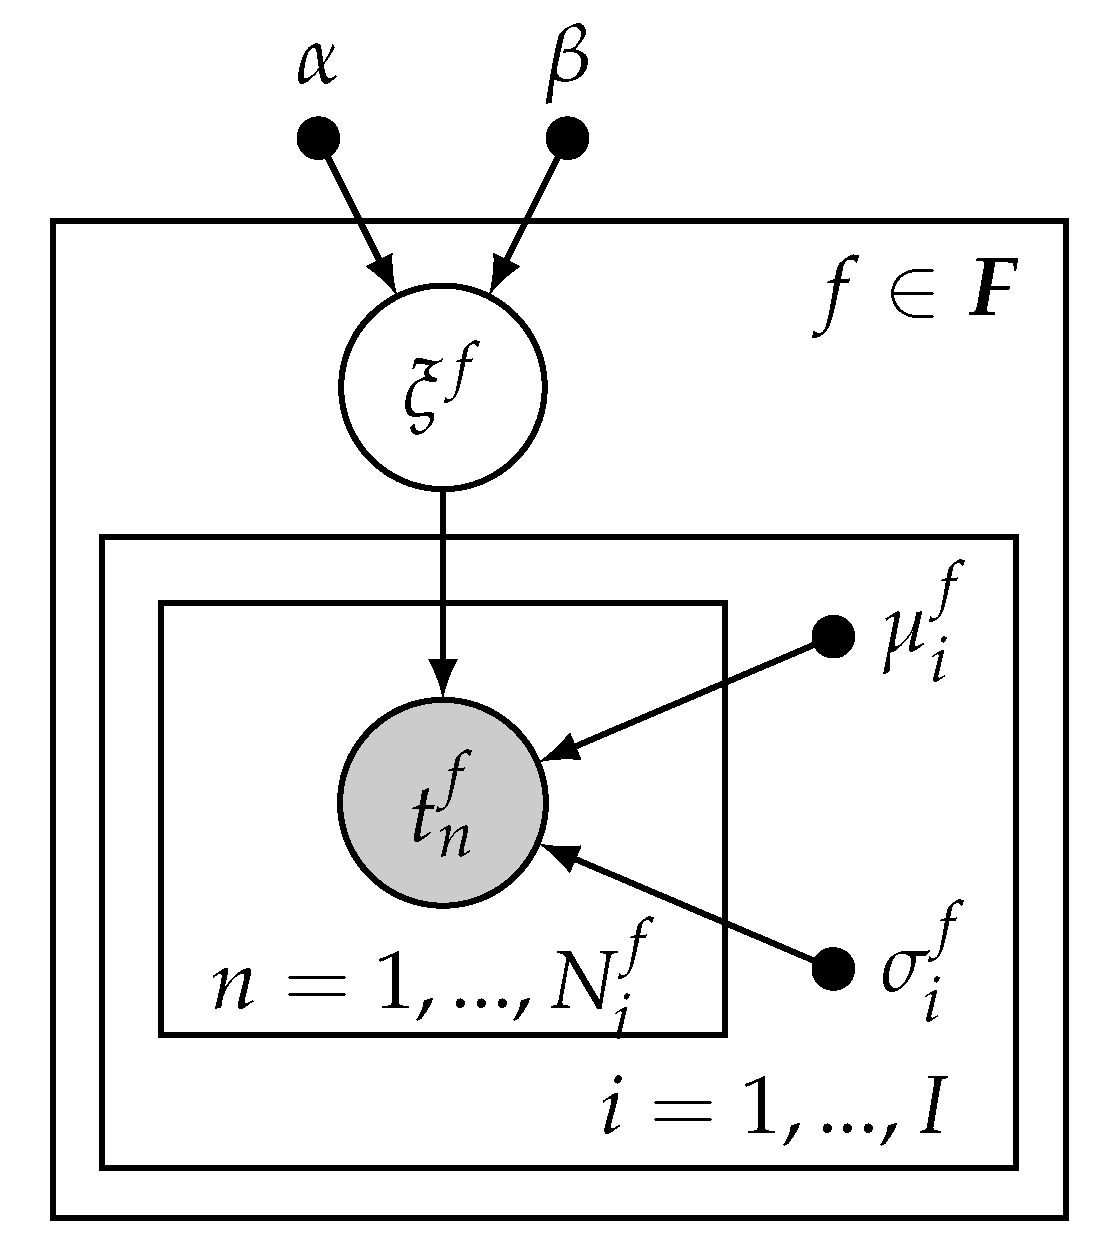
The parameter values of the APP model are estimated using Bayesian inference. Based on the model formulation in this section, the likelihood of observing paper citation histories are first calculated. Then, by imposing a conjugate prior, the posterior distribution of the latent affinity ξ f is computed. Accordingly, Figure 3 illustrates the corresponding graphical model of the APP model for expressing the overall conditional dependence structure between random variables. Detailed approaches of Bayesian inference and parameter learning are explained in Appendix A, Appendix B, Appendix C and Appendix D, respectively.

4. Popularity Prediction

Bibliographic data in STEM fields are now applied to the APP, and the prediction performance is compared with two baselines (APP without a prior and RPP) as done in our previous work [9]. Based on the Bayesian inference and learning in Appendix A, Appendix B, Appendix C and Appendix D, estimated parameter values with real data are interpreted in the next section for understanding interdisciplinary citation dynamics across fields of sciences.

4.1. Data Statistics

The Web of Science data (WoS) [10] is investigated during the last two decades between 1991 and 2011, since publication data consistent for all target fields is only available during this period. The data contains publication records from a wide range of academic areas, each of which consists of paper profile (e.g., title, keywords, publication year, venue, and associated subjects) and citation relationships (e.g., cited and citing articles). This study focuses on STEM field publications covering 108 subjects, where some disciplines such as Biology and Engineering are more fine-grained. For the less biased and macro-level observations of interdisciplinary citation flows in sciences, these 108 subjects are grouped into higher-level research areas, i.e., 37 subfields and 4 fields, by referring to the classifications of academic programs, conducted by the National Research Council (NRC) [11]. The four NRC fields are Agricultural Sciences, Biological & Health Sciences, Engineering, and Physical & Mathematical Sciences, and the detailed correspondence between the WoS and NRC classifications is presented in Table A2, Table A3 and Table A4 in Appendix F.
As data preprocessing steps, journals are first targeted, whose publication records are available during the entire data period (i.e., from 1991 to 2011). In order to secure at least 10-year citation histories, individual articles published between 1991 and 2000 are then selected. Fundamental statistics of the target publications are presented in Table 2. For a macro view of cross-discipline citation flows, an individual journal’s citation intensity is estimated (i.e., λ i ( t ) in Equation (3)) by collecting and decomposing citation time moments into multiple timelines according to citing articles’ associated NRC subfields (i.e., horizontal timelines in Figure 2b). Note that there are 878 journals which have entire citation histories during the data period, and an individual journal’s citation volume is predicted for separate years between 1991 and 2000. Thus, prediction is conducted 8780 times (878 journals × 10 years) in total.

4.2. Prediction of Interdisciplinary Citation Volumes

Popularity prediction tests are conducted with real data and the prediction results are compared between our proposed model (APP) and the baselines (APP without a prior and RPP), as done in [9]. Individual journals’ citation volumes are predicted by training the proposed and baseline models with at least 10 year citation histories. The first two plots in Figure 4 illustrate the prediction errors in MAPE (a) as increasing the length of training years (from 10 to 20 years) and (b) as varying the test years (from 1 to 10 years) after training with 10 year citation histories. In both cases, our proposed model outperforms the baseline models, improved by 15% over APP without a prior and by 27% over RPP on average when comparing the prediction performances with the least citation histories (10 years). Figure 4c compares the distributions of citation sizes between real data and prediction results from our proposed model. As shown in this figure, the predicted citation sizes are distributed quite similarly to ones from real data. That is, the APP well explains popularity dynamics of individual journals across fields of sciences, not limited to specific ones.
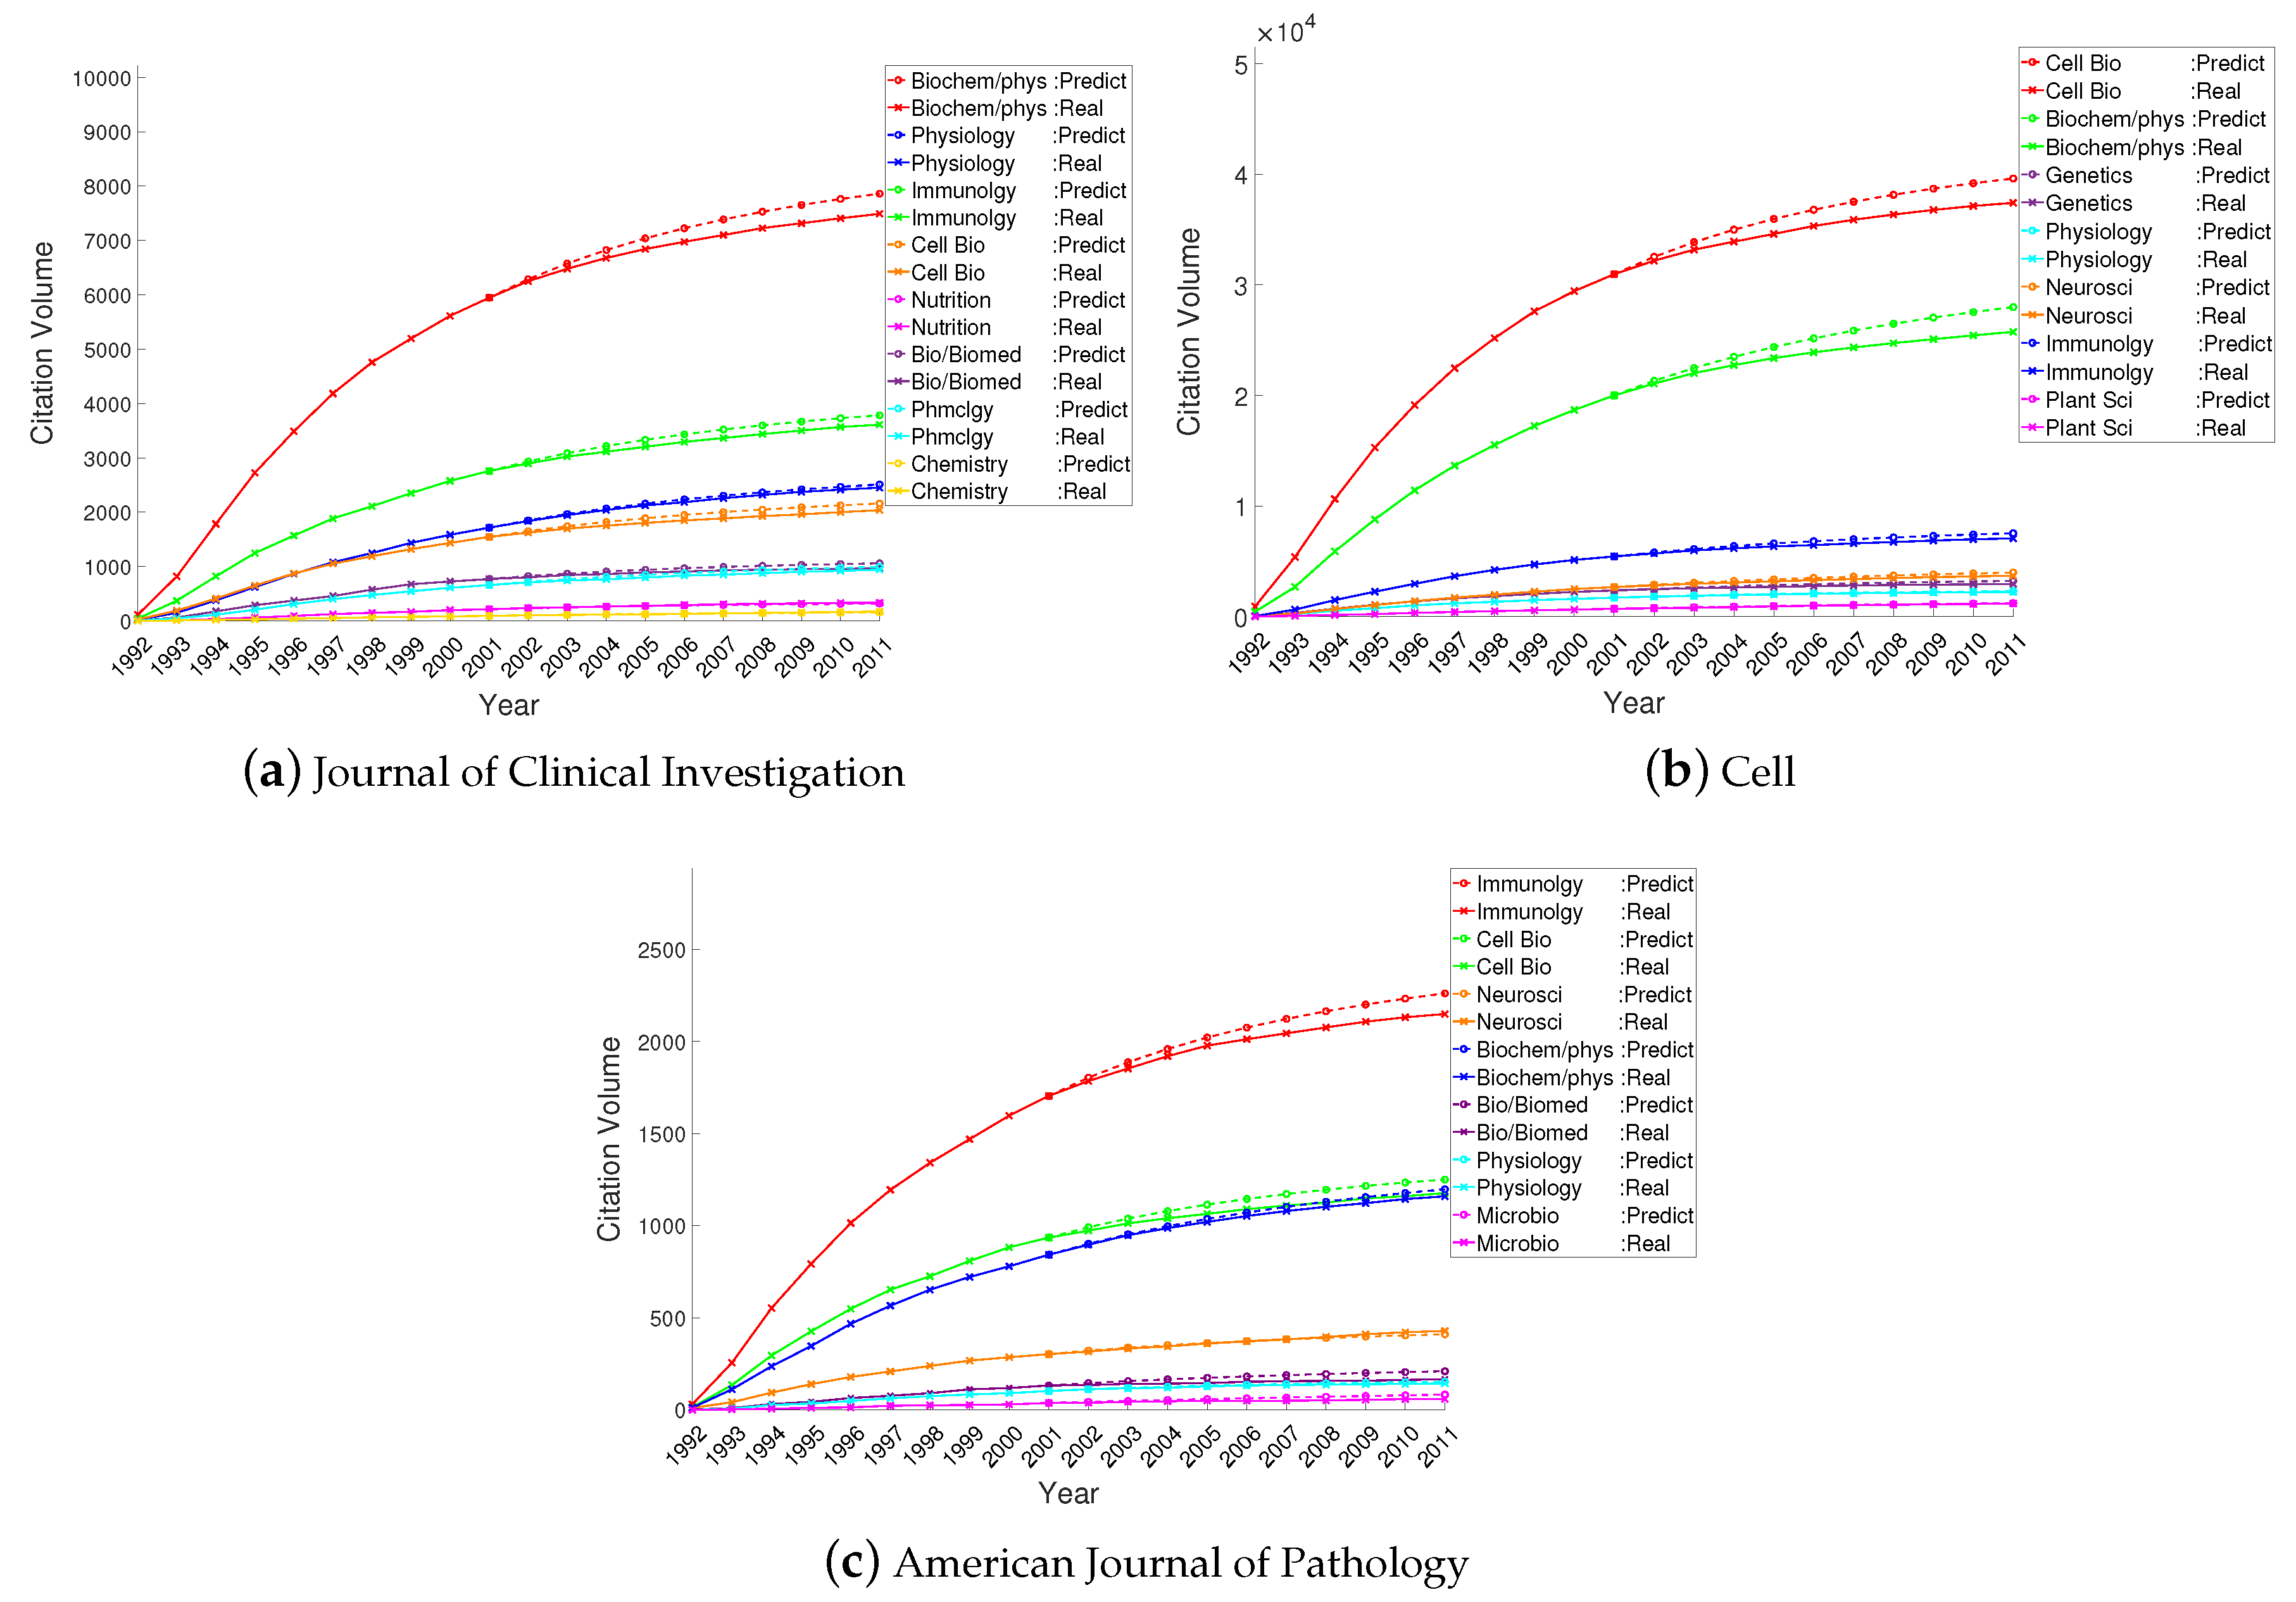
Figure 5 shows example prediction results from our model. In the figure, three journals are from different NRC subfields, but they all are paid interdisciplinary attention from different subfields. As the figure shows, the APP does not only predict an individual journal’s total number of citations but also separately predict its citations received from each citing subfield.
Based on the parameter estimation, in the next section citation dynamics are analyzed in terms of affinity network, affinity density, and novelty decay across subfields of sciences.

5. Affinity Map

Model parameters are estimated, such as latent affinity and aging effect between every pair of subfields, using more than 10-year citation histories of an individual journal’s publications from 1991 to 2000 until the data end year, 2011. That is, a subfield’s accumulated affinity and novelty decay of its publications across subfields are all inferred so that we can examine time-evolving citation dynamics between different publication years.
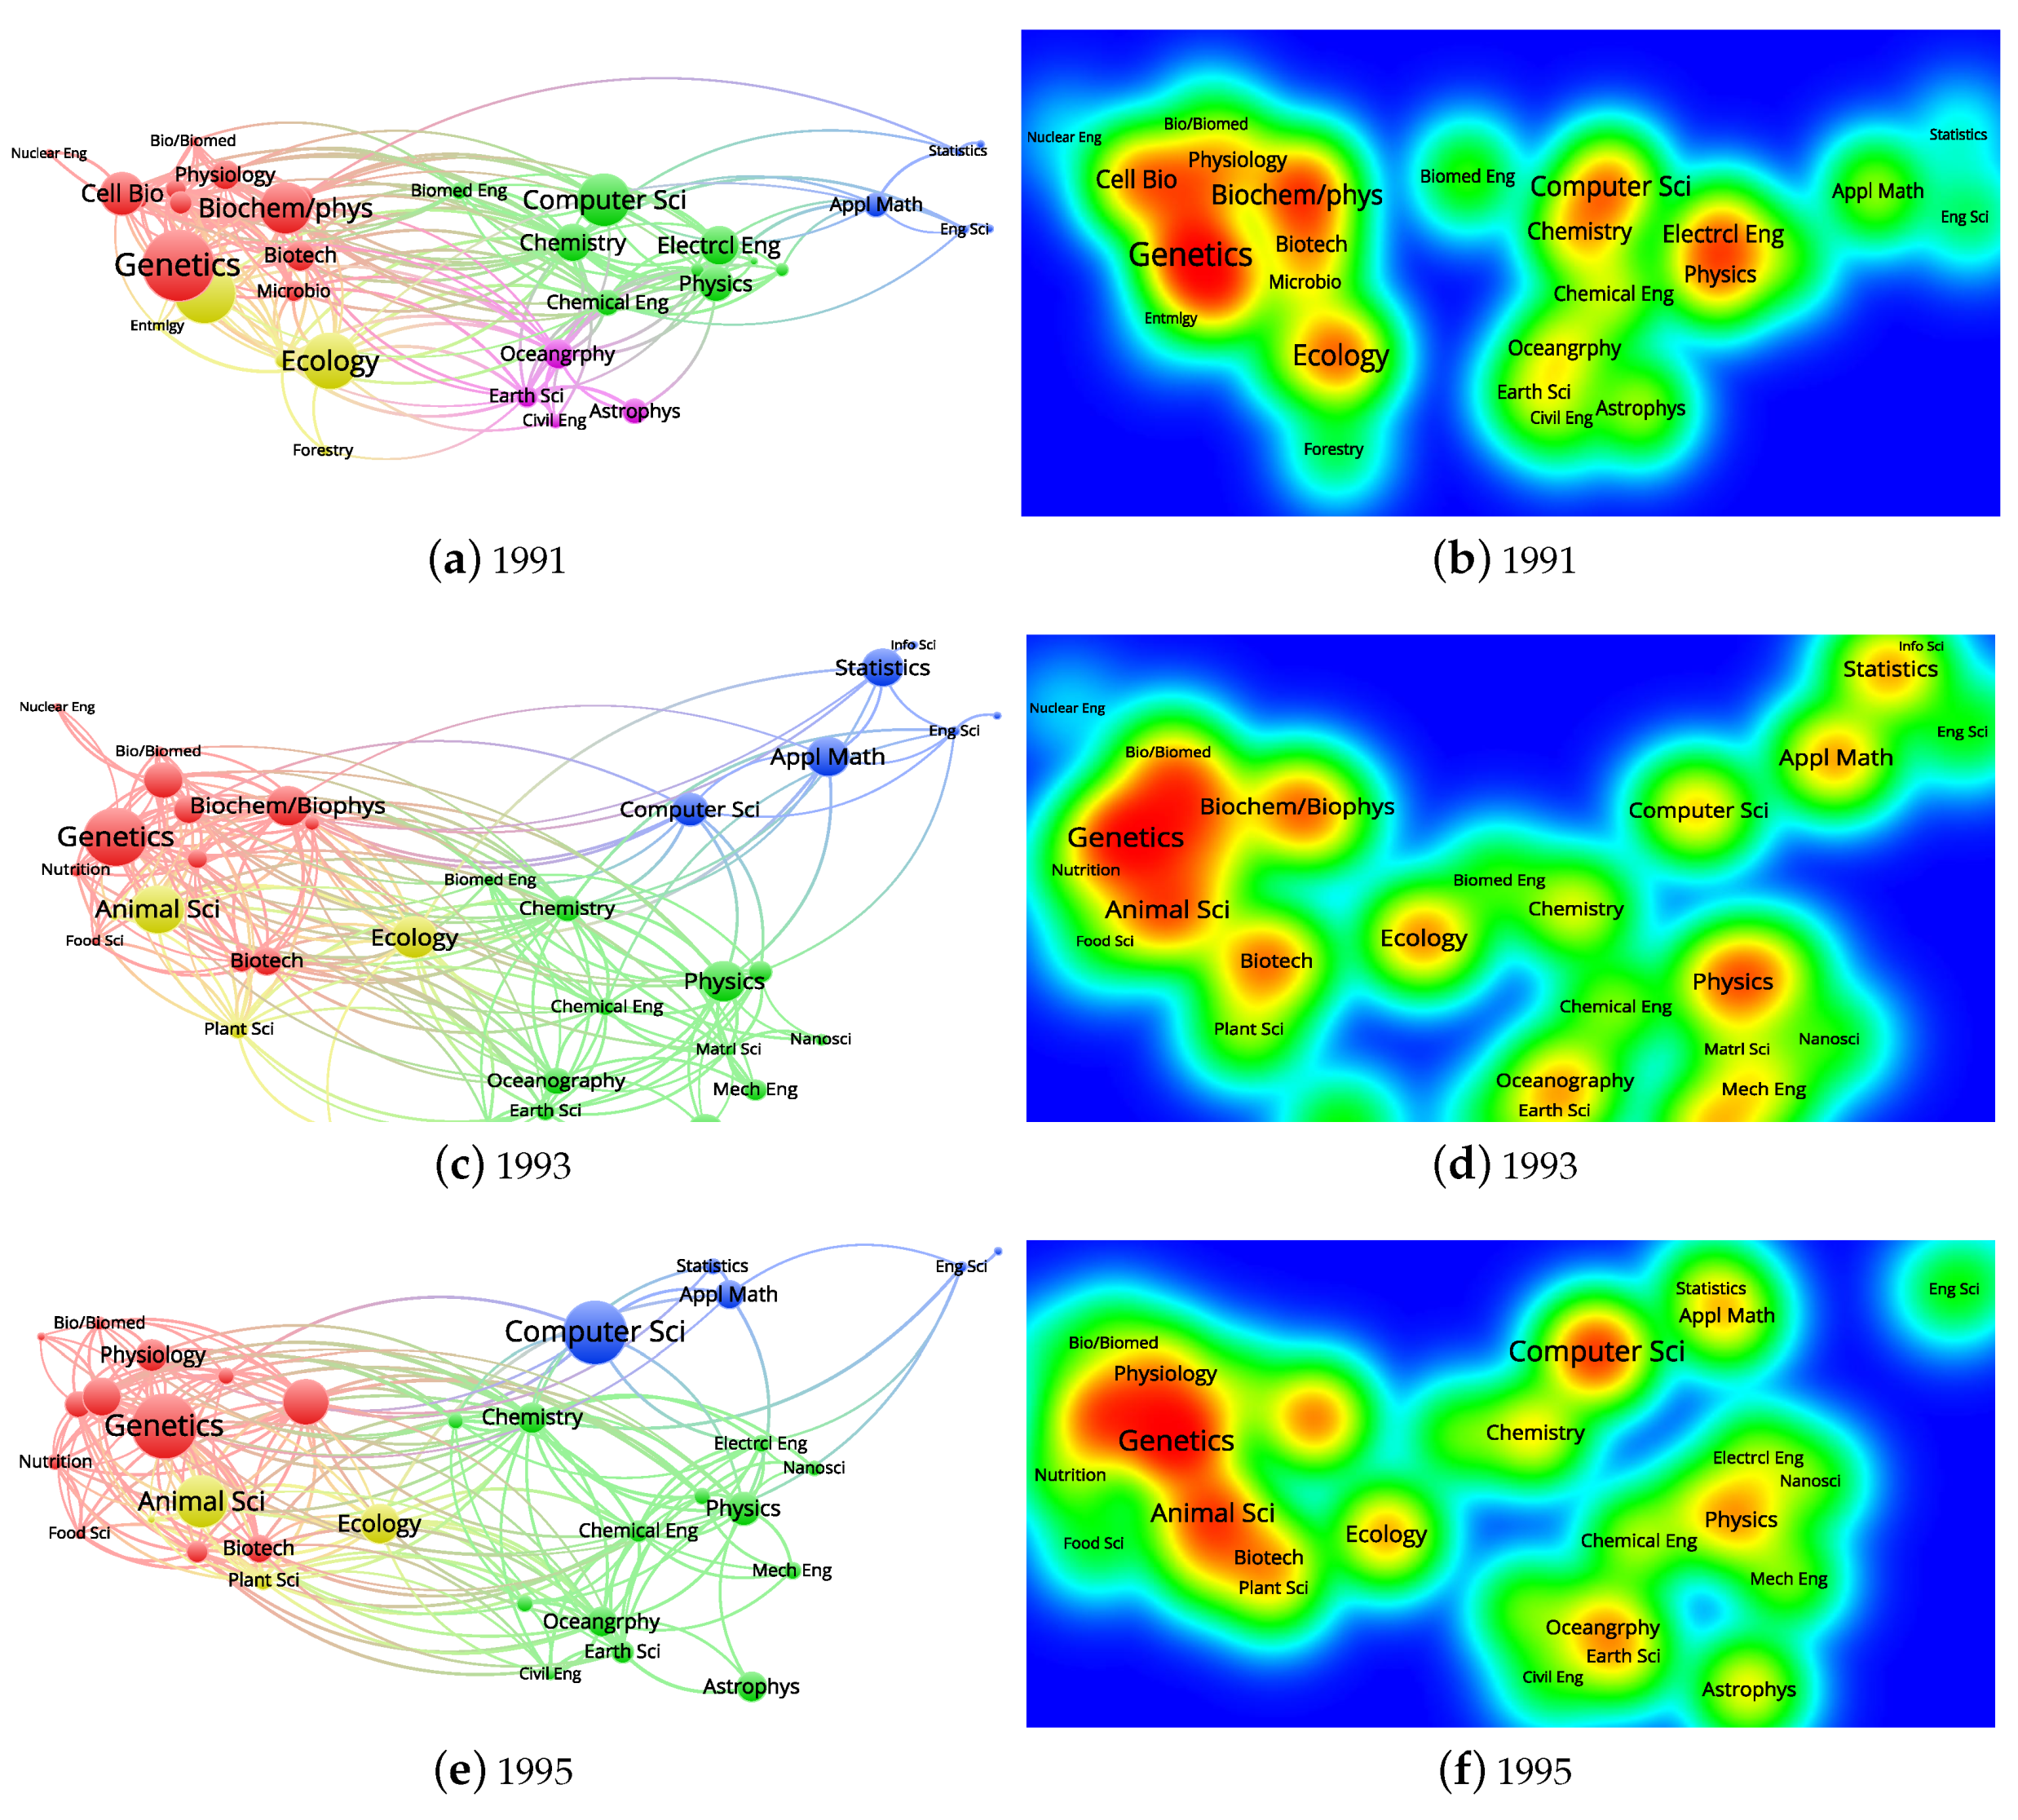
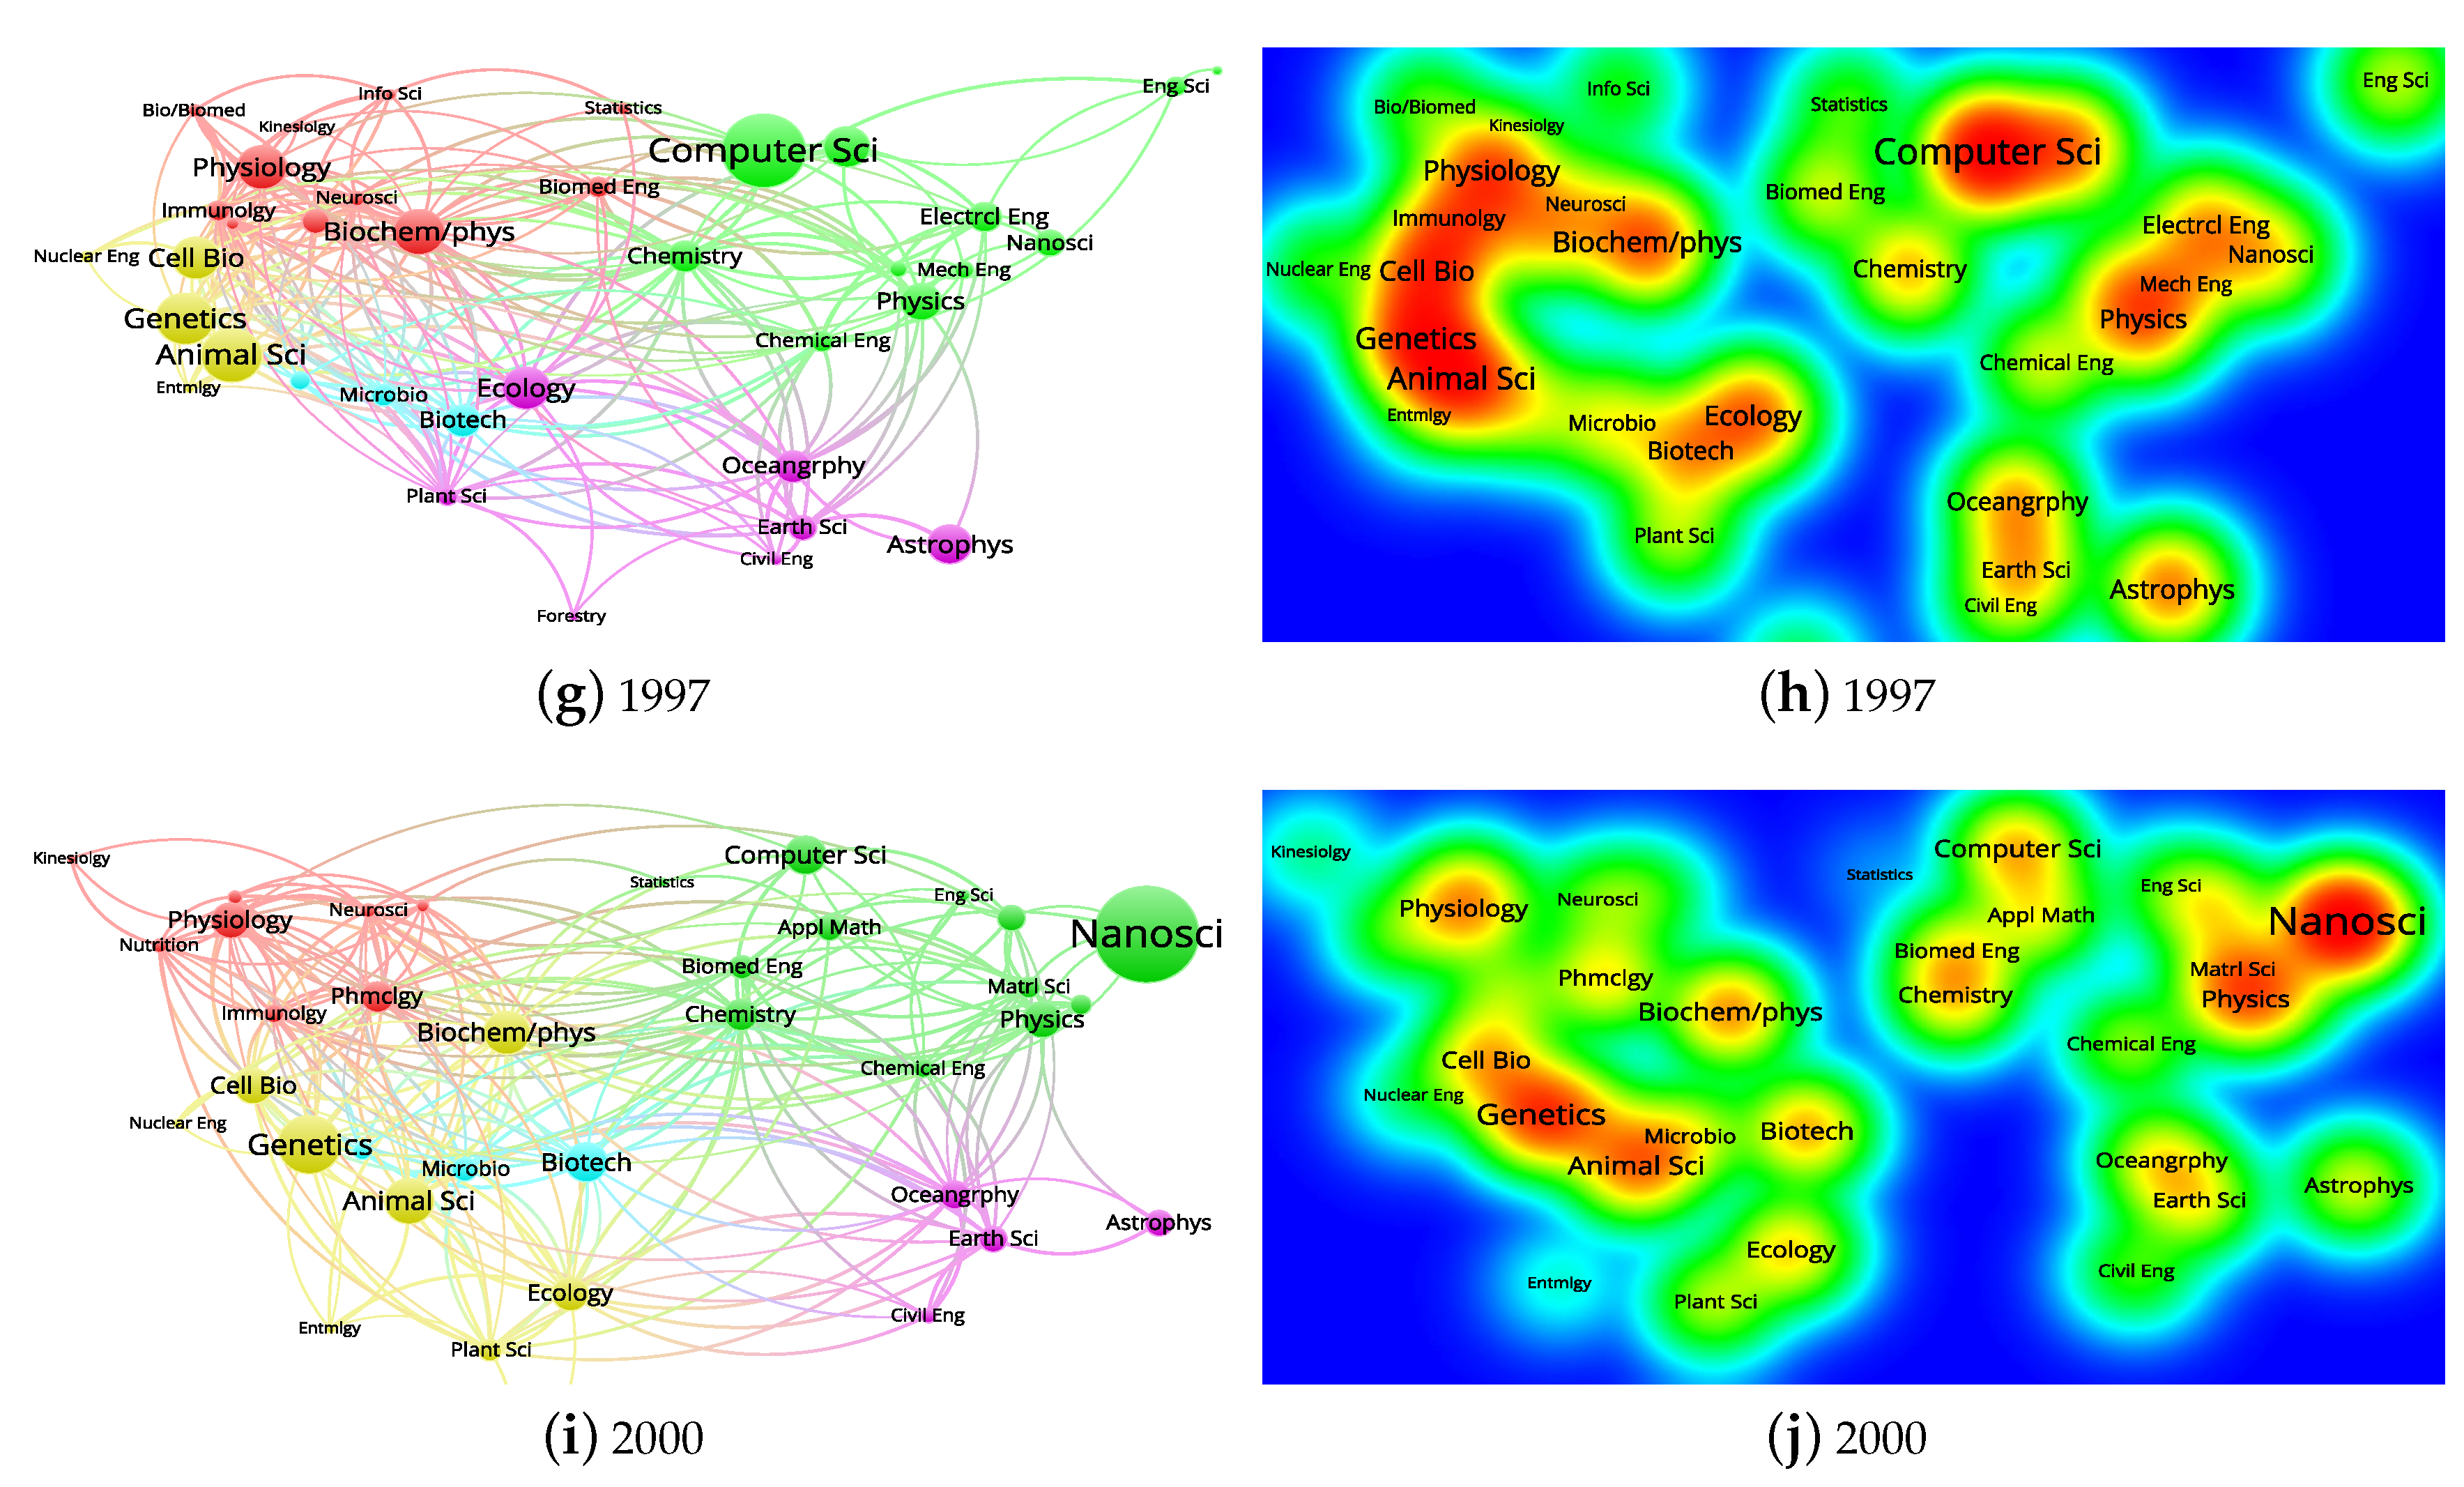
Based on the estimation, Figure 6 presents affinity maps of all 37 NRC subfields with affinity network (the first column) and affinity density (the second column) for different publication years from 1991, 1993, 1995, 1997, to 2000. As shown in the figure, network clusters (color-coded) and densities are varied by publication years, which implies that affinity between every pair of subfields is time-evolving.

5.1. Affinity Network

The first column of Figure 6 illustrates networks, each of which consists of nodes for NRC subfields and links for directed pairwise affinity. Here, the distance between nodes reflects the strength of affinity between two subfields (i.e., closer distance for stronger affinity). The size and color of a node present a subfield’s interdisciplinarity and its associated clusters based on the normalized cut on the network [33]. As shown in the figure, affinity between the BH subfields becomes more distant from each other but closer to other NRC field over time. On the other hand, affinity between the PM subfields is locally clustered earlier but they become closer to each other and also to other fields over time. Specifically, computer science, applied mathematics, statistics, and engineering science (blue nodes) are more isolated from their own NRC fields at the beginning but become closer to their own and different fields, while oceanography, earth science, civil engineering, and astrophysics (purple nodes) exhibit consistent membership over time.

5.2. Affinity Density

These generated networks are also presented with density maps in the second column in Figure 6, where a node with higher interdisciplinarity and density is closer to red. As shown in the figure, dense areas are changing over time, such as genetics and biochemistry/biophysics in 1991, physics and applied mathematics in 1993, computer sciences and animal sciences in 1995, cell & developmental biology in 1997, and nanoscience in 2000.
Accordingly, Figure 7 presents the keyword distributions of the highly interdisciplinary subfields from the density maps in 1991, 1995, and 2000. Keywords are extracted from titles and abstracts of journal articles published in the corresponding year, which are collected from the Web of Science [10] by querying highly cited journal names of a same publication year within each subfield. In addition, keywords are color-coded by co-occurrence based clusters. Overall, about 13% of keywords are commonly used in a citing subfield with high affinity, while less than 5% of keywords are common between subfields with low or no affinities. That is, our estimated affinity between two subfields well reflects a close relation in their research. In more detail, Table A1 shows example keywords which are commonly used between the subfields in Figure 7 and the top three subfields with the highest affinities for each selected subfield. The keywords of citing subfields in Table A1 are one of the top mostly used 300 keywords, which are collected from individual papers’ keyword records in the Web of Science data.
Overall, NRC subfields become more interdisciplinary across the four NRC fields, but affinity between subfields are not static but time-evolving, collectively leading to highly popular subfields of every publication year.

5.3. Novelty Decay

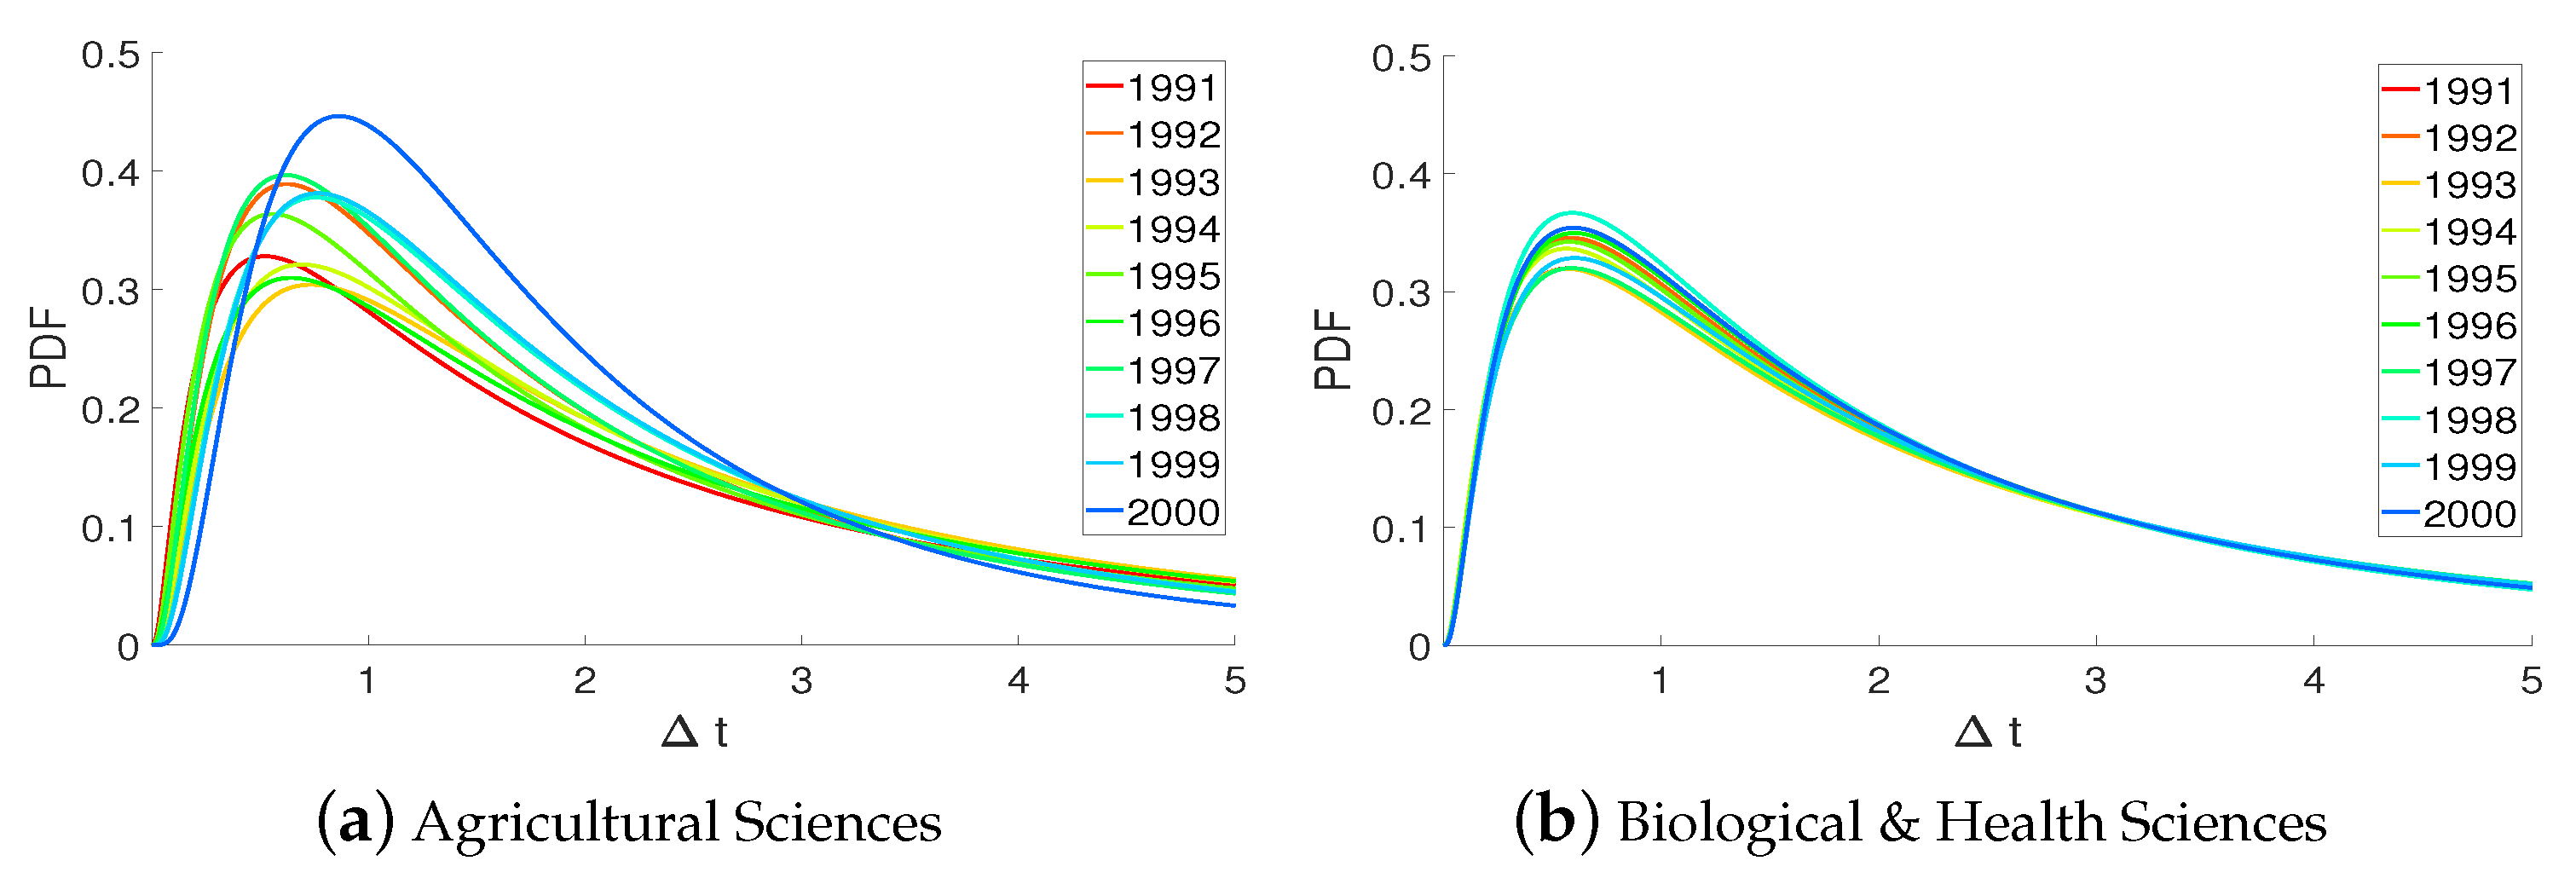
Figure 8 shows the novelty decay of the four NRC fields’ publications from 1991 to 2000. As shown in the figure, the Agricultural Sciences (AS) and PM fields exhibit slower decay of earlier publications, while the Engineering (EG) field shows the opposite, i.e., faster decay of earlier publications. That is, publications in the EG field are more quickly forgotten than ones in the AS and PM fields, which can be interpreted as citing fields tend to be updated with the latest technological breakthrough of the EG field. On the other hand, the BH field’s publications show similar time decay patterns between different publication years, but their aging is slowest among the NRC fields. This implies that aging of the BH field is consistent regardless of publication years and that its publications are less forgotten across the fields compared to other fields’ publications. For instance, articles aged more than two years have similar likelihood to be cited no matter when they are published.

5.4. Holistic View

Figure 9 summarizes overall affinity maps for all different publication years between 1991 and 2000. As shown in Figure 9a, in general 37 NRC subfields can be grouped into four clusters based on affinity between subfields, which are different from the four NRC fields. That is, different subfields are not only locally clustered but also globally interrelated with each other beyond disciplines and NRC fields. As Figure 9b illustrates, biochemistry/biophysics, genetics, and ecology in the BH field, animal science in the AS field, physics, chemistry, computer science, and applied mathematics in the PM field, electrical engineering, oceanography, and nanoscience in the EG field have been highly interdisciplinary in STEM field. In terms of novelty decay in Figure 9c, the EG, PM, AS, and BH fields are aging in that order. The slowest aging of the BH field reflects larger number of average citations as well as citing subfields than the other NRC fields.

6. Conclusions

As the Affinity Poisson Process incorporates the effects of subpopulation-level interactions on diffusion processes, it not only enables to predict the citation volumes of individual publications but also helps to reveal interdisciplinary citation dynamics across subfields of sciences, such as time-evolving latent affinity and novelty decay. Based on Bayesian inference and learning, the main findings are summarized as below.
  • Affinity between subfields is time-evolving, and overall NRC subfields become more interdisciplinary across the four NRC fields over time; affinity between the BH subfields becomes more distant but closer to other NRC field over time, while affinity between the PM subfields is locally clustered earlier but becomes closer to other fields over time.
  • In terms of novelty decay, the AS and PM fields exhibit slower aging for earlier publications, while the EG field shows the opposite, i.e., faster decay of earlier publications. The BH field shows a consistent aging for different year publications and the slowest time decay among the four NRC fields.
  • Overall, 37 NRC subfields are not only locally clustered but also globally interrelated with each other beyond disciplines and NRC fields. Highly interdisciplinary subfields for each NRC field are: biochemistry/biophysics, genetics, and ecology in the BH field, animal science in the AS field, physics, chemistry, computer science, and applied mathematics in the PM field, electrical engineering, oceanography, and nanoscience in the EG field. In terms of novelty decay, the EG, PM, AS, and BH fields are aging in that order.
Note that this study focuses on how to infer affinity between given fields, by employing predefined metadata. As scientific fields are evolving, it is very challenging to classify research fields and identify the associated field of an individual publication, which is beyond the scope of this paper. Nevertheless, clustering affinity network can provide a new aspect of classifying time-evolving fields in academia.
Overall, the way of interpreting dynamics offers a general applicability to a broad range of real-world diffusion scenarios by providing rich dynamics across subgroups of a population. One future work is to improve the framework with other supportive latent factors to recurring popularity in a complex system. Another direction is to define latent affinity as a time-varying function in order to explicitly model its evolving patterns and obtain more accurate results, based on more recent data collection.

Funding

This work was supported by the National Research Foundation of Korea(NRF) grant funded by the Korea government(MSIT) (No. 202000350001).

Conflicts of Interest

The author declare no conflict of interest. The funders had no role in the design of the study; in the collection, analyses, or interpretation of data; in the writing of the manuscript, or in the decision to publish the results.

Abbreviations

The following abbreviations are used in this manuscript:
APPAffinity Poisson Process
RPPReinforcement Poisson Process
STEMScience, technology, engineering, and mathematics
NRCNational Research Council
ASAgricultural Sciences
BHBiological and Health Sciences
EGEngineering
PMPhysical and Mathematical Sciences

Appendix A. Lognormal Distributions

The definition of a lognormal distribution is
p ( t ;   θ )   = 1 t σ 2 π exp ln   t     μ 2 2 σ 2 , t   >   0 ,
where θ   =   ( μ ,   σ ) , and the mean and sigma parameters, μ   >   0 , σ   >   0 .

Appendix A.1. Integral of Lognormal Distributions

Then, the integral of a lognormal distribution is
P ( t ;   θ ) = 0 t p ( s ;   θ ) d s   =   1 2 1   +   erf τ 2   =   Φ τ ,
where τ     ln   t     μ   / σ and Φ ( · ) denotes the cumulative distribution function of the standard normal distribution.
The partial derivatives of the integral of a lognormal distribution with respect to the parameters are
P ( t ;   θ ) μ   =   ϕ ( τ ) σ , P ( t ;   θ ) σ   =   τ ϕ ( τ ) σ ,
where ϕ ( · ) denotes the probability density function of the standard normal distribution.

Appendix A.2. Logarithm of Lognormal Distributions

The logarithm of the lognormal distribution is
ln p ( t ;   θ )   =   ln   2 π     ln   σ     ln   t     ln   t     μ 2 2 σ 2 .
Thus, its partial derivatives with respect to the parameters are
ln   p ( t ;   θ ) μ   =   τ σ , ln   p ( t ;   θ ) σ   =   τ 2     1 σ ,
where τ   =   ( ln   t     μ ) / σ .

Appendix B. Bayesian Inference

The parameter values of the APP model are estimated using Bayesian inference. Based on the model formulation in Section 3.2, the likelihood of observing paper citation histories are first calculated. Then, by imposing a conjugate prior, the posterior distribution of the latent affinity ξ f is computed. Accordingly, Figure 3 illustrates the corresponding graphical model of the APP model.
Likelihood Distribution. As illustrated in Figure 2b, an individual paper i’s cited time moments, grouped into each citing field f’s citations D i f , follows a Poisson process independently. Thus, the likelihood of observing all citation time moments D f of the cited field can be factorized as
p D f   |   ξ f = i = 1 I p D i f   |   ξ f = i = 1 I n = 1 N i f p t n f   |   t n 1 f , ξ f p T   |   t N i f f , ξ f ,
where t 0 f   =   0 denotes the publication time of the paper i.
In a nonhomogeneous Poisson process, the probability that a new event occurs after the previous event follows an exponential distribution as
p t n f   |   t n 1 f , ξ f   =   λ i f ( t n f ) exp t n 1 f t n f λ i f ( s ) d s ,
while the probability that no event occurs between t N i f f and T is
p T   |   t N i f f , ξ f   =   exp t N i f f T λ i f ( s ) d s .
By substituting Equations (A7) and (A8) into Equation (A6), the likelihood is rewritten as
p D f   |   ξ f =   i = 1 I n = 1 N i f λ i f ( t n f ) exp t n 1 f t n f λ i f ( t ) d t exp t N i f f T λ i f ( t ) d t =   i = 1 I exp n = 1 N i f t n 1 f t n f λ i f ( t ) d t     t N i f f T λ i f ( t ) d t n = 1 N i f λ i f ( t n f ) =   i = 1 I exp S i f n = 1 N i f λ i f ( t n f ) .
According to Equation (4), the exponent S i f is rewritten as
S i f =   n = 1 N i f t n 1 f t n f λ i f ( t ) d t   +   t N i f f T λ i f ( t ) d t =   n = 1 N i f t n 1 f t n f ξ f   ·   ( n 0   +   n     1 )   ·   p ( t ;   θ i f ) d t   +   t N i f f T ξ f   ·   ( n 0   +   N i f )   ·   p ( t ;   θ i f ) d t = ξ f 0 t 1 f n 0   ·   p ( t ;   θ i f ) d t   +   t 1 f t 2 f ( n 0   +   1 )   ·   p ( t ;   θ i f ) d t   +     +   t N i f f T ( n 0   +   N i f )   ·   p ( t ;   θ i f ) d t =   ξ f 0 t 1 f n 0   ·   p ( t ;   θ i f ) d t   +   0 t 2 f ( n 0   +   1 )   ·   p ( t ;   θ i f ) d t   +     +   0 T ( n 0   +   N i f ) · p ( t ;   θ i f ) d t   ξ f 0 t 1 f ( n 0   +   1 )   ·   p ( t ;   θ i f ) d t   +   0 t 2 f ( n 0   +   2 )   ·   p ( t ;   θ i f ) d t   +     +   0 t N i f f ( n 0   +   N i f )   ·   p ( t ;   θ i f ) d t =   ξ f ( n 0   +   N i f )   ·   P ( T ;   θ i f )     n = 1 N i f P ( t n f ;   θ i f )   =   ξ f M i f ,
where
M i f = n 0 + N i f · P T ; θ i f n = 1 N i f P t n f ; θ i f , P t n f ; θ i f = 0 t n f p s ; θ i f d s = Φ τ i f , τ i f = ln t n f μ i f / σ i f .
Here, Φ ( · ) denotes the cumulative distribution function of the standard normal distribution, and n 0 is the prior citations for each timeline.
Substituting Equation (A10) into Equation (A9) gives
p ( D f   |   ξ f ) = i = 1 I exp ξ f M i f n = 1 N i f ξ f · ( n 0 + n 1 ) · p ( t n f ; θ i f ) = ξ f i = 1 I N i f exp ξ f i = 1 I M i f i = 1 I n = 1 N i f ( n 0 + n 1 ) · p ( t n f ; θ i f ) .
Thus, the likelihood can be expressed as the form of a gamma distribution with respect to ξ f as
p D f   |   ξ f ξ f i = 1 I N i f exp ξ f i = 1 I M i f .
Conjugate Prior. Since the conjugate prior of a gamma distribution is also a gamma distribution, we set the prior distribution on ξ f as
p ( ξ f ;   α ,   β ) = β α Γ ( α ) ξ f α 1 exp β ξ f ,
where α > 0 and β > 0 are the shape and rate parameters, respectively.
Posterior Distribution. Based on Equations (A12) and (A13), the posterior distribution of ξ f is a gamma distribution,
p ξ f   |   D f = β α Γ ( α ) ξ f α 1 exp β ξ f ,
where α = α + i = 1 I N i f and β = β + i = 1 I M i f .
Therefore, the mean of the latent affinity ξ f , denoted by overlines, changes after observing the citation data as
ξ Prior f ¯ = α β , ξ Post f ¯ = α β = α + i = 1 I N i f β + i = 1 I M i f .
Note that the mode of a gamma distribution, denoted by hats, is not equal to the mean as
ξ Prior f ^ = α 1 β , ξ Post f ^ = α 1 β ,
when the shape parameters α ,   α 1 . Unless otherwise noted, the mode of the posterior distribution is used for the estimated value of field affinity ξ f .

Appendix C. Learning Parameters

We learn parameters given the training data using the gradient descent method. Note that for maximum likelihood estimation (ML), we treat the field affinity as another parameter (i.e., APP without a prior), while for maximum a posteriori (MAP) we impose a prior distribution and optimize its hyperparameters instead (i.e., APP with a prior).
APP without a prior. Without a prior distribution, the objective function to maximize is the log likelihood distribution of all the citation timestamps D of the cited field,
L ML = ln p ( D     ξ ) = f F ln p D f   |   ξ f .
Then, the partial derivatives for each parameter are
L ML ξ f = i = 1 I N i f ξ f M i f ,
L ML μ i f = 1 σ i f ξ f · n 0 + N i f · ϕ τ i f + n = 1 N i f τ n f ξ f · ϕ τ n f ,
L ML σ i f = 1 σ i f ξ f · n 0 + N i f · τ i f · ϕ τ i f + n = 1 N i f τ n f 2 ξ f · τ n f · ϕ τ n f N i f .
APP with a prior. In Bayesian estimation, we usually learn hyperparameters by maximizing the log marginal likelihood as
L MAP = ln p ( D ) = f F ln p D f   |   ξ f p ξ f d ξ f .
Substituting Equations (A6) and (A13) into Equation (A21) and taking partial derivatives with respect to hyperparameters gives
L MAP α = f F ψ 0 ( α ) ψ 0 ( α ) + ln β ln β ,
L MAP β = f F α β α β ,
where ψ 0 ( · ) denotes the digamma function, the logarithmic derivative of the gamma function.
Similarly, we take the partial derivatives with respect to θ i f as
L MAP μ i f = 1 σ i f α β n 0 + N i f ϕ τ i f + n = 1 N i f τ n f α β ϕ τ n f ,
L MAP σ i f = 1 σ i f α β n 0 + N i f τ i f ϕ τ i f + n = 1 N i f τ n f 2 α β τ n f ϕ τ n f N i f ,
where τ i f = ln T μ i f / σ i f , τ n f = ln t n f μ i f / σ i f , and ϕ ( · ) is the probability density function of the standard normal distribution. Note that n 0 is the prior citations for each timeline. Refer to Appendix D for details.

Appendix D. Partial Derivatives of Log Marginal Likelihood

Substitution of Equations (A6) and (A13) into Equation (A21) gives
L = f F ln i = 1 I n = 1 N i f ( n 0 + n 1 ) p ( t n f ; θ i f ) β α Γ ( α ) ξ f ( α 1 ) exp β ξ f d ξ f = f F ln i = 1 I n = 1 N i f ( n 0 + n 1 ) p ( t n f ; θ i f ) Γ ( α ) Γ ( α ) β α β α = f F ln Γ ( α ) ln Γ ( α ) + α ln β α ln β + i = 1 I n = 1 N i f ln ( n 0 + n 1 ) + ln p ( t n f ; θ i f ) ,
where the definition of α and β from Equation (A14) is used as
α = α + i = 1 I N i f , β = β + i = 1 I M i f .

Appendix D.1. Partial Derivatives with Respect to Hyperparameters

Recall that the derivative of the logarithm of the gamma function Γ ( z ) is the digamma function ψ 0 ( z ) as
d d z Γ ( z ) = Γ ( z ) ψ 0 ( z ) , ψ 0 ( z ) = Γ ( z ) Γ ( z ) = d d z ln Γ ( z ) .
With Equations (A27) and (A28), the partial derivative of L of Equation (A26) with respect to the hyperparameters α and β can be simply calculated as Equations (A22) and (A23).

Appendix D.2. Partial Derivatives with Respect to Aging Parameters

The partial derivatives of L of Equation (A26) with respect to the aging parameters θ i f are
L μ i f = α β M i f μ i f + n = 1 N i f ln p ( t n f ; θ i f ) μ i f ,
L σ i f = α β M i f σ i f + n = 1 N i f ln p ( t n f ; θ i f ) σ i f .
From the definition of M i f in Equation (A10) and the partial derivatives in Equation (A3),
M i f μ i f = 1 σ i f ( n 0 + N i f ) ϕ ( τ i f ) n = 1 N i f ϕ ( τ n f ) ,
M i f σ i f = 1 σ i f ( n 0 + N i f ) τ i f ϕ ( τ i f ) n = 1 N i f τ n f ϕ ( τ n f ) .
Substituting Equations (A5), (A31) and (A32) into Equations (A29) and (A30) produces Equations (A24) and (A25).

Appendix E. Experimental Results

Table A1 shows the keywords of citing subfields, which are one of the most used 300 keywords. They are collected from individual papers’ keyword records in the Web of Science data.
Table A1. For the selected subfields in Figure 7, example keywords are presented from the top 300 mostly used ones in a citing subfield. For each cited subfield, the top three citing subfields are selected, showing the highest affinities for that cited subfield, and they are listed in a descending order of affinities.
Cited NRC SubfieldCiting NRC SubfieldExample Common Keyword
Genetics & GenomicsBiochem/Biophysics & Structural Biologyacid, genome, amplification, ycleotide sequence, escherichia coli, enzyme, transcription factor, etc.
Ecology & Evolutionary Biologygrowth, selection, conservation, temperature, evolution, resistance, accumulation, etc.
Cell & Developmental Biologycell line, phenotype, embryo, p53, transformation, receptor, tumor, differentiation, induction, etc.
Computer SciencesPhysicsequation, simulation, flow, approximation, noise, generation, energy, interface, transition, etc.
Biochem/Biophysics & Structural Biologycell, program, domain, sequence, resolution, stability, plasma, ligand, conformation, etc.
Neuroscience & Neurobiologyinformation, neuron, network, sequence, recognition, movement, sensitivity, protein, etc.
Nanoscience & NanotechnologyChemistrypolymer, spectroscopy, crystal, spectra, morphology, protein, binding, oxygen, gold, etc.
Materials Science & Engineeringmolecular beam epitaxy, atomic force microscopy, chemical vapor deposition, photoluminescence, etc.
Electrical & Computer Engineeringfabrication, interface, array, sensor, biosensor, electrode, diode, wavelength, gaas, etc.

Appendix F. Metadata

We grouped 108 subject areas, provided by the Web of Science data, into higher level research areas, 37 subfields and 4 fields, by referring to the classifications of academic programs, conducted by the National Research Council (NRC) in 2011 [11].
Table A2. Metadata for diverse research areas in STEM fields. 108 subject areas are grouped into 37 NRC subfields and 4 NRC fields.
Subject Area (WOS)NRC SubfieldNRC Field
Agricult, Dairy & Animal SciAnimal SciencesAgricultural
Sciences
Fisheries
Reproductive Biology
Zoology
EntomologyEntomology
Food Science & TechnologyFood Science
ForestryForestry & Forest Sciences
Nutrition & DieteticsNutrition
AgronomyPlant Sciences
Horticulture
Plant Sciences
Biochem. Research MethodsBiochemistry, Biophysics, and
Structural Biology
Biological and
Health Sciences
Biochem. & Molecular Bio.
Biology
Biophysics
Med., Research & Exprmtl
Cardiac & Cardiovasclr Sys.Bio/Integrated Biomed Sci
Biotech. & Appl. Microbio.Biotechnology
Anatomy & MorphologyCell and Developmental Biology
Cell Biology
Developmental Biology
Oncology
Biodiversity ConservationEcology and Evolutionary Biology
Ecology
Environmental Sciences
Evolutionary Biology
Marine & Freshwater Biology
Genetics & HeredityGenetics and Genomics
ImmunologyImmunology and Infectious
Disease
Infectious Diseases
Pathology
Veterinary Sciences
Sport SciencesKinesiology
MicrobiologyMicrobiology
Virology
NeurosciencesNeuroscience and Neurobiology
Pharmacology & PharmacyPharmacology, Toxicology and
Environmental Health
Toxicology
Endocrinology & MetabolismPhysiology
Physiology
Table A3. Continued from Table A2.
Subject Area (WOS)NRC SubfieldNRC Field
Agricultural EngineeringBiomedical Engineering and
Bioengineering
Engineering
Engineering, Biomedical
Engineering, ChemicalChemical Engineering
Engineering, Environmental
Engineering, Petroleum
Imaging Sci & Photographic Technology
Constr. & Building Tech.Civil and Environmental
Engineering
Engineering, Civil
Engineering, Geological
Transportation Sci & Tech
Eng, Electrical & ElectronicElectrical& Computer Eng
Automation & Control SystemsEng. Science & Materials
Medical InformaticsInformation Science
Materials Science, BiomaterialsMaterials Science and Engineering
Materials Science, Ceramics
Materials Science, Characterization, Testing
Matrls Sci, Coatings & Films
Materials Sci, Composites
Matrls Sci, Multidisciplinary
Matrls Sc, Paper & Wood
Materials Science, Textiles
Metallurgy & Metallugcl Eng
Engineering, MechanicalMechanical Engineering
Engineering, Ocean
Nanosci & NanotechnologyNanosci & Nanotech
Nuclear Sci & TechnologyNuclear Engineering
Engineering, IndustrialOperations Research, Systems
Engineering and Industrial
Engineering
Engineering, Manufacturing
Opr Research & Mgmt Sci
Table A4. Continued from Table A3.
Subject Area (WOS)NRC SubfieldNRC Field
MathematicsApplied MathematicsPhysical and
Mathematical
Sciences
Mathematics, Applied
Math, Intrdisciplnry Applied
Astronomy & AstrophysicsAstrophysics and Astronomy
Chemistry, AnalyticalChemistry
Chemistry, Applied
Chem, Inorganic & Nuclear
Chemistry, Medicinal
Chemistry, Multidisciplinary
Chemistry, Organic
Chemistry, Physical
Electrochemistry
Polymer Science
Computer Science, AIComputer Sciences
Computer Sci, Cybernetics
Computer Sci, HW & Arch.
Computer Sci, Info. Systems
Computer Sci, Interdisc Appl
Computer Sci, SW Eng
Computer Sci, Thry & Mthds
Geochemistry & GeophysicsEarth Sciences
Geology
Geosci, Multidisciplinary
Soil Science
LimnologyOceanography, Atmospheric
Sciences and Meteorology
Meteorlgy & Atmospheric Sci
Oceanography
Water Resources
AcousticsPhysics
Optics
Physics, Applied
Phys, Atomic, Molclr&Chem
Physics, Condensed Matter
Physics, Fluids & Plasmas
Physics, Mathematical
Physics, Multidisciplinary
Physics, Nuclear
Physics, Particles & Fields
Statistics & ProbabilityStatistics and Probability

References

  1. Kim, M.; Paini, D.; Jurdak, R. Real-world diffusion dynamics based on point process approaches: A review. Artif. Intell. Rev. 2020, 53, 321–350. [Google Scholar]
  2. Farajtabar, M.; Wang, Y.; Gomez-Rodriguez, M.; Li, S.; Zha, H.; Song, L. Coevolve: A joint point process model for information diffusion and network co-evolution. In Proceedings of the Advances in Neural Information Processing Systems, Montreal, QC, Canada, 7–12 December 2015; pp. 1954–1962. [Google Scholar]
  3. Gao, S.; Ma, J.; Chen, Z. Modeling and Predicting Retweeting Dynamics on Microblogging Platforms. In Proceedings of the ACM International Conference on Web Search and Data Mining, Florence, Italy, 18–22 May 2015; pp. 107–116. [Google Scholar]
  4. Zhao, Q.; Erdogdu, M.A.; He, H.Y.; Rajaraman, A.; Leskovec, J. SEISMIC: A Self-Exciting Point Process Model for Predicting Tweet Popularity. In Proceedings of the ACM SIGKDD International Conference on Knowledge Discovery and Data Mining, Melbourne, Australia, 19–23 October 2015; pp. 1513–1522. [Google Scholar]
  5. Kim, M.; Xie, L.; Christen, P. Event diffusion patterns in social media. In Proceedings of the International Conference on Weblogs and Social Media, Dublin, Ireland, 4–7 June 2012; pp. 178–185. [Google Scholar]
  6. Shen, H.; Wang, D.; Song, C.; Barabási, A.L. Modeling and Predicting Popularity Dynamics via Reinforced Poisson Processes. In Proceedings of the AAAI Conference on Artificial Intelligence, Québec City, QC, Canada, 27–31 July 2014; pp. 291–297. [Google Scholar]
  7. Wang, D.; Song, C.; Barabási, A.L. Quantifying long-term scientific impact. Science 2013, 342, 127–132. [Google Scholar] [CrossRef] [PubMed] [Green Version]
  8. Kim, M.; Paini, D.; Jurdak, R. Modeling stochastic processes in disease spread across a heterogeneous social system. Proc. Natl. Acad. Sci. USA 2019, 116, 401–406. [Google Scholar] [CrossRef] [PubMed] [Green Version]
  9. Kim, M.; McFarland, D.A.; Leskovec, J. Modeling affinity based popularity dynamics. In Proceedings of the ACM on Conference on Information and Knowledge Management, Singapore, 6–10 November 2017; pp. 477–486. [Google Scholar]
  10. Web of Science. Available online: https://www.webofscience.com/.
  11. Ostriker, J.P.; Kuh, C.V.; Voytuk, J.A. A Data-Based Assessment of Research-Doctorate Programs in the United States; National Academies Press: Cambridge, MA, USA, 2011. [Google Scholar]
  12. Shen, H.W.; Barabási, A.L. Collective credit allocation in science. Proc. Natl. Acad. Sci. USA 2014, 111, 12325–12330. [Google Scholar] [CrossRef] [PubMed] [Green Version]
  13. Redner, S. Citation statistics from 110 years of physical review. Phys. Today 2005, 58, 49–54. [Google Scholar] [CrossRef] [Green Version]
  14. Sinatra, R.; Deville, P.; Szell, M.; Wang, D.; Barabási, A.L. A century of physics. Nat. Phys. 2015, 11, 791–796. [Google Scholar] [CrossRef]
  15. Wuchty, S.; Jones, B.F.; Uzzi, B. The increasing dominance of teams in production of knowledge. Science 2007, 316, 1036–1039. [Google Scholar] [CrossRef] [PubMed] [Green Version]
  16. Milojević, S. Modes of collaboration in modern science: Beyond power laws and preferential attachment. J. Assoc. Inf. Sci. Technol. 2010, 61, 1410–1423. [Google Scholar] [CrossRef] [Green Version]
  17. Powell, W.W.; White, D.R.; Koput, K.W.; Owen-Smith, J. Network dynamics and field evolution: The growth of interorganizational collaboration in the life sciences. Am. J. Sociol. 2005, 110, 1132–1205. [Google Scholar] [CrossRef] [Green Version]
  18. Jones, B.F.; Wuchty, S.; Uzzi, B. Multi-university research teams: Shifting impact, geography, and stratification in science. Science 2008, 322, 1259–1262. [Google Scholar] [CrossRef] [PubMed] [Green Version]
  19. Ver Steeg, G.; Galstyan, A. Information transfer in social media. In Proceedings of the International Conference on World Wide Web, Lyon, France, 16–20 April 2012; pp. 509–518. [Google Scholar]
  20. Kim, M.; Newth, D.; Christen, P. Macro-level information transfer in social media: Reflections of crowd phenomena. Neurocomputing 2016, 172, 84–99. [Google Scholar] [CrossRef]
  21. Kim, M.; Newth, D.; Christen, P. Modeling dynamics of diffusion across heterogeneous social networks: News diffusion in social media. Entropy 2013, 15, 4215–4242. [Google Scholar] [CrossRef] [Green Version]
  22. Myers, S.A.; Zhu, C.; Leskovec, J. Information diffusion and external influence in networks. In Proceedings of the ACM SIGKDD International Conference on Knowledge Discovery and Data Mining, Beijing, China, 12–16 August 2012; pp. 33–41. [Google Scholar]
  23. Kim, M.; Newth, D.; Christen, P. Uncovering diffusion in academic publications using model-driven and model-free approaches. In Proceedings of the 2014 IEEE Fourth International Conference on Big Data and Cloud Computing, Sydney, Australia, 3–5 December 2014; pp. 564–571. [Google Scholar]
  24. Wu, F.; Huberman, B.A. Novelty and collective attention. Proc. Natl. Acad. Sci. USA 2007, 104, 17599–17601. [Google Scholar] [CrossRef] [PubMed] [Green Version]
  25. Kim, M.; Newth, D.; Christen, P. Modeling Dynamics of Meta-Populations with a Probabilistic Approach: Global Diffusion in Social Media. In Proceedings of the International Conference on Information and Knowledge Management, San Francisco, CA, USA, 27 October–1 November 2013; pp. 489–498. [Google Scholar]
  26. Rodriguez, M.G.; Leskovec, J.; Schölkopf, B. Modeling Information Propagation with Survival Theory. In Proceedings of the International Conference on Machine Learning, Atlanta, GA, USA, 16–21 June 2013; pp. 666–674. [Google Scholar]
  27. Kouritzin, M.A.; Zeng, Y. Bayesian model selection via filtering for a class of micro-movement models of asset price. Int. J. Theor. Appl. Financ. 2005, 8, 97–121. [Google Scholar] [CrossRef]
  28. Kouritzin, M.A.; Zeng, Y. Weak convergence for a type of conditional expectation: Application to the inference for a class of asset price models. Nonlinear Anal. Methods Appl. 2005, 60, 231–239. [Google Scholar]
  29. Brémaud, P. Point Processes and Queues: Martingale Dynamics; Springer: New York, NY, USA, 1981; Volume 50. [Google Scholar]
  30. Iwata, T.; Shah, A.; Ghahramani, Z. Discovering latent influence in online social activities via shared cascade poisson processes. In Proceedings of the ACM SIGKDD International Conference on Knowledge Discovery and Data Mining, Chicago, IL, USA, 11–14 August 2013; pp. 266–274. [Google Scholar]
  31. Van Noorden, R. Interdisciplinary research by the numbers. Nature 2015, 525, 306–307. [Google Scholar] [CrossRef] [PubMed]
  32. Cinlar, E. Introduction to Stochastic Processes; Courier Corporation: North Chelmsford, MA, USA, 2013. [Google Scholar]
  33. Eck, N.J.v.; Waltman, L. How to normalize cooccurrence data? An analysis of some well-known similarity measures. J. Assoc. Inf. Sci. Technol. 2009, 60, 1635–1651. [Google Scholar] [CrossRef] [Green Version]
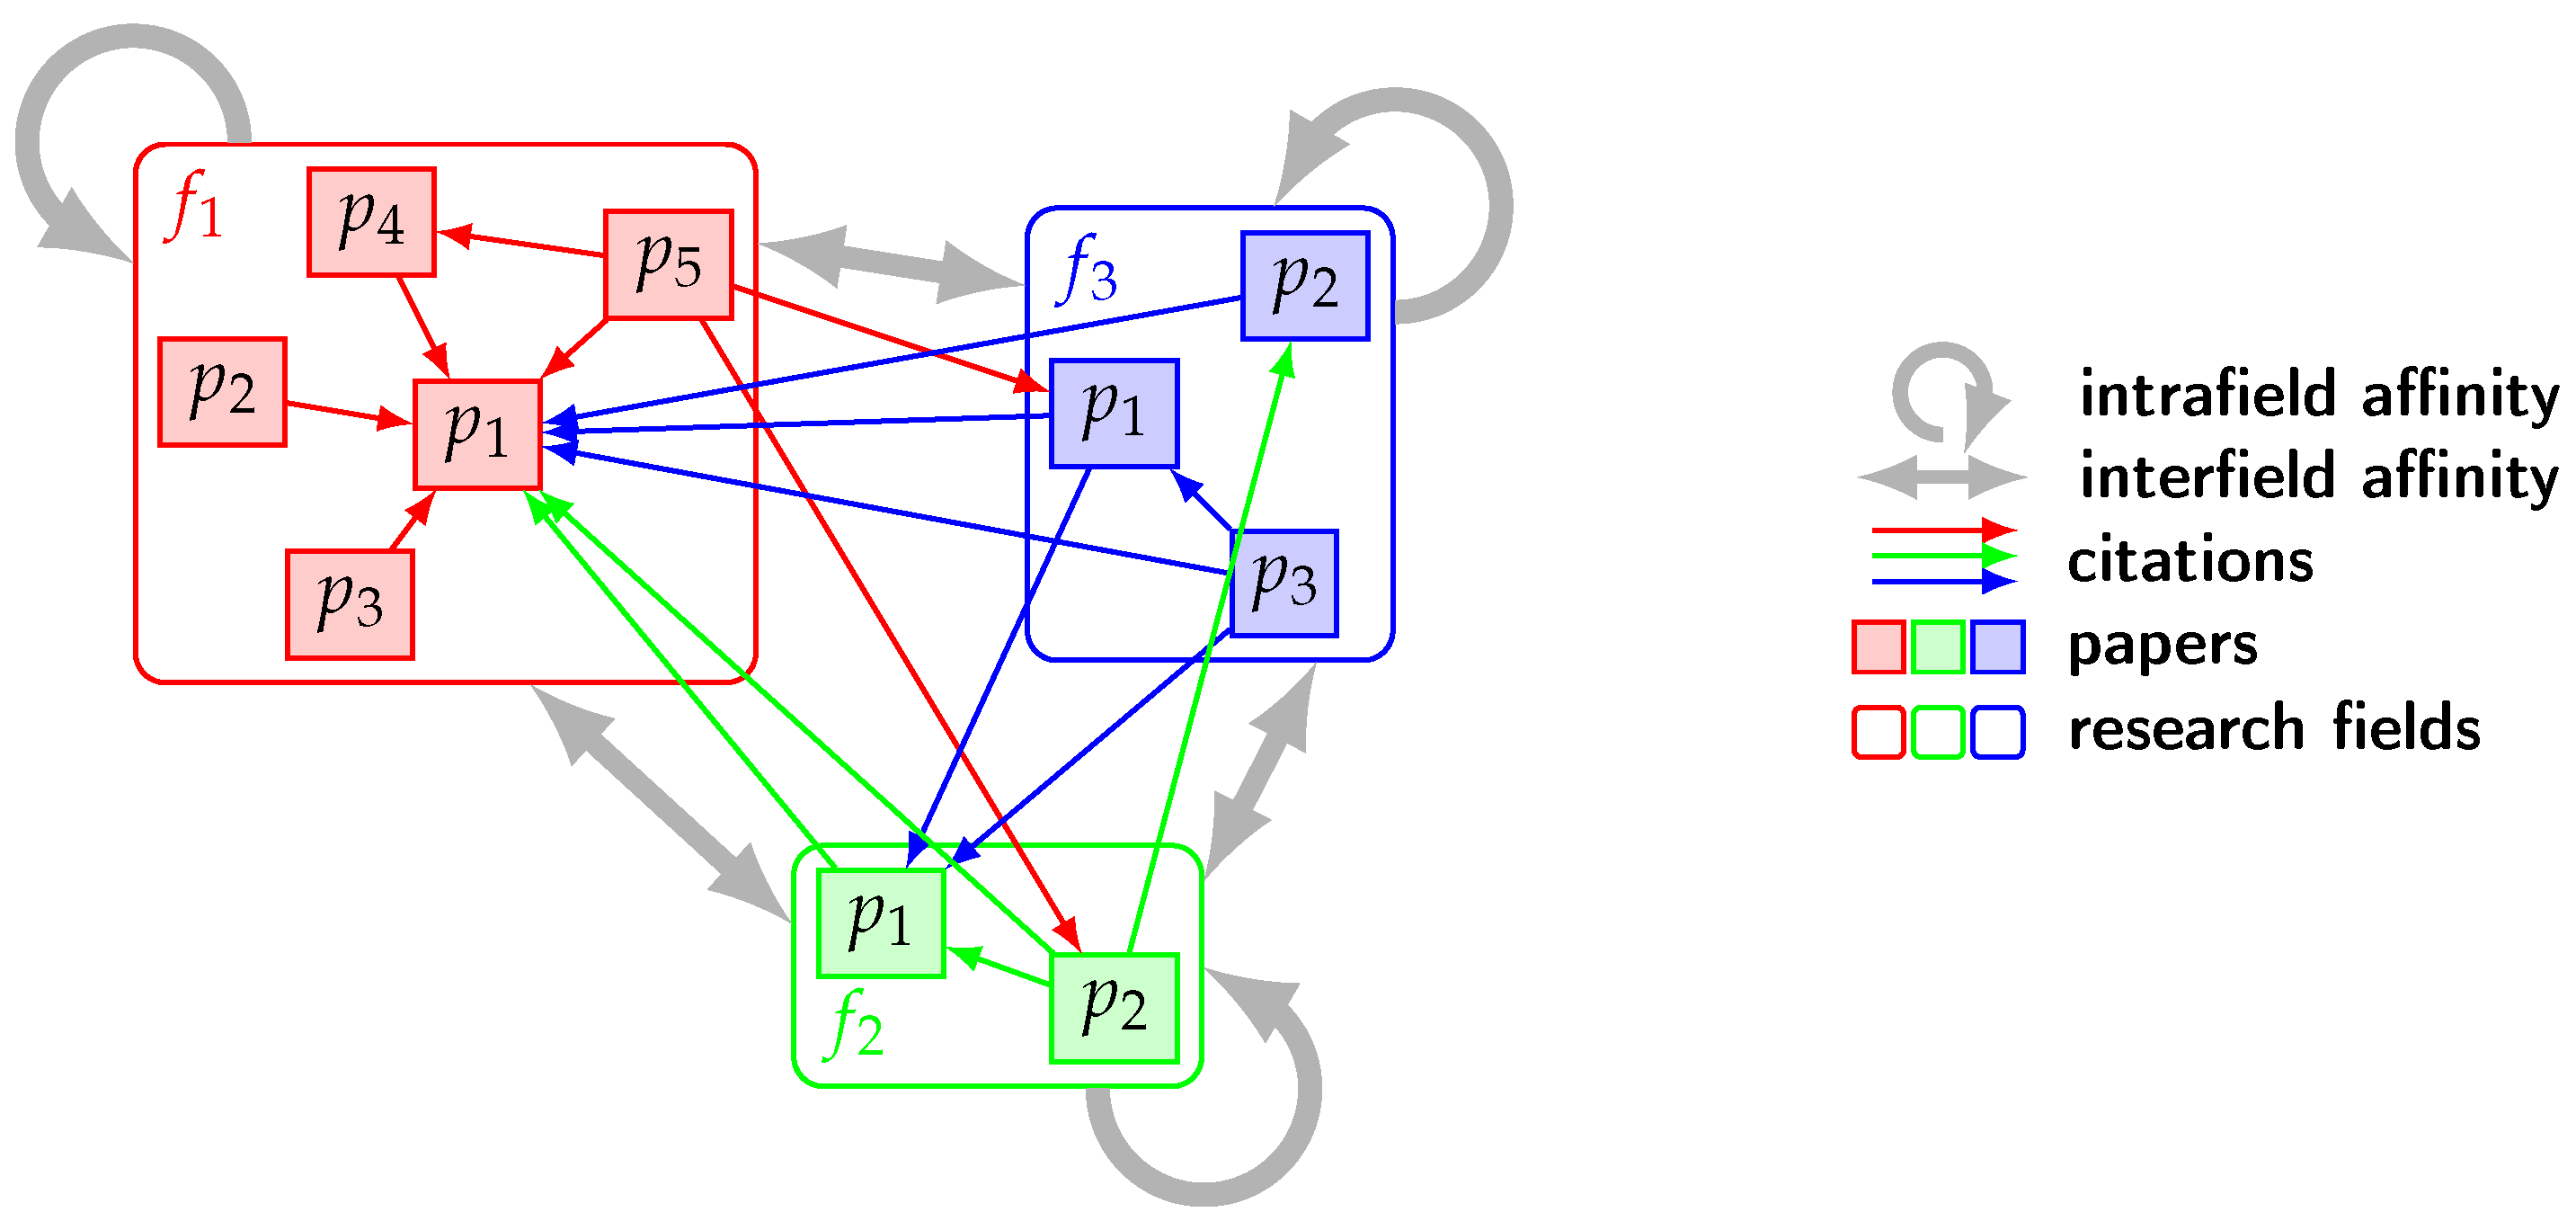
Figure 1. Conceptual diagram: interdisciplinary citations of papers (color-filled squares), influenced by latent affinities (thick grey arrows) between various research fields (outlined rectangles) in science. Self-looping arrows represent intrafield affinities, while straight arrows denote interfield affinities. Thin colored arrows describe citations from source to sink papers.
Applsci 10 05846 g001
Figure 2. Citations across different fields. (a) Each square p i represents the i-th paper in its field (specified at top and color-coded). The paper p 1 in the cited field f 1 receives citations from multiple citing fields ( f 1 , f 2 and f 3 ) over time. Here, t n ( n = 1 , . . . , 9 ) denotes the publication time of the n-th citing paper. (b) The citations are decomposed into different timelines according to the citing fields. As the superposition of Poisson processes is also a Poisson process, this is a generalization of the citation arrival process in (a) by considering interdisciplinary citation flow.
Applsci 10 05846 g002
Figure 3. Graphical model of the Affinity Poisson Process. The citation timestamps t n f of paper i receiving from the citing field f depend on the affinity ξ f of the citing field f toward the cited field, and the lognormal aging effect of paper i in the citing field f is parameterized with μ i f and σ i f . Latent affinity ξ f has hyperparameters, α and β . Empty circles represent unknown random variables, a solid circle denotes observed data, and dark dots indicate parameters. Note that the only graphical model of the cited field is presented.
Applsci 10 05846 g003
Figure 4. Experimental results with real data. Comparisons of prediction errors in MAPE between the Affinity Poisson Process (APP) and two baseline models (APP without a prior and RPP (Reinforcement Poisson Process)) (a) by increasing the length of training years and (b) by varying the test years based on 10 year citation histories. (c) The distributions of real (black) and predicted (red) number of citations of individual journals with the APP.
Applsci 10 05846 g004
Figure 5. Example results from predicting interdisciplinary citation volumes of individual journals with the APP. In each plot, predicted citation volumes are separated by citing NRC subfields. Each cited journal’s NRC subfield is respectively (a) Biochem/Biophysics & Structural Biology, (b) Cell & Developmental Biology, and (c) Immunology & Infectious Disease. Prediction tests are conducted for next 10 years (2002–2011) after training the model using the first 10 year citation histories (1992–2001) since each journal’s publication year (1992).
Applsci 10 05846 g005
Figure 6. Affinity map with network and density of 37 NRC subfields using estimated accumulated affinities and interdisciplinarity for different publication years: 1991, 1993, 1995, 1997, and 2000. Networks in the first column are clustered based on the normalized cut, where each node and link indicate a subfield and affinity. The distance between two nodes reflects the strength of affinity (closer distance for stronger affinity). Density maps in the second column present interdisciplinarity, where nodes with higher interdisciplinarity and density are highlighted in red.
Applsci 10 05846 g006aApplsci 10 05846 g006b
Figure 7. Keyword distributions of the highly interdisciplinary subfields from density maps in 1991, 1995, and 2000 in Figure 6. Keyword colors represent clusters based on co-occurrences.
Applsci 10 05846 g007
Figure 8. Varied novelty decay between NRC fields. Each plot indicates the averaged lognormal decay of each year’s publications from 1991 to 2000. Publication years are color coded from red to blue spectrum in chronological order.
Applsci 10 05846 g008aApplsci 10 05846 g008b
Figure 9. Overall affinity maps, (a) network and (b) density, and (c) aging effect (averaged lognormal decay), for all publication years from 1991 to 2000.
Applsci 10 05846 g009
Table 1. Notation.
Table 1. Notation.
Sym.Descriptions
F set of all research fields in science
f cited research field of the cited paper, f cited     F (usually ommited for brevity)
fresearch field of the citing paper, f     F
Itotal number of papers in the cited field
ii-th paper in the cited field, i   =   1 ,   ,   I
N i f citation count of paper i, received from the citing field f
t n f n-th citation timestamp of paper i, received from the citing field f, n   =   1 ,   ,   N i f
D i f citation timestamps of paper i, received from f such that D i f   =   { t n f     n   =   1 ,   ,   N i f }
D f citation timestamps of the cited field, received from f such that D f   =   { D i f     i   =   1 ,   ,   I }
D all citation timestamps of the cited field such that D   =   { D f     f     F }
λ i f ( t ) citation intensity of paper i at time t for the citations received from the citing field f
λ i ( t ) citation intensity of paper i at time t such that λ i ( t )   =   f F λ i f ( t )
ξ f affinity of the citing field f towards the cited field
c i f ( t ) citation count of paper i, received from the citing field f up to time t
c i ( t ) citation count of paper i in the cited field up to time t such that c i ( t )   =   f F c i f ( t )
p i f ( t ) aging effect of paper i in the citing field f after time t since its publication
θ i f lognormal distribution parameters θ i f   =   ( μ i f ,   σ i f ) such that p i f ( t )   =   Lognormal ( t ;   μ i f ,   σ i f )
Table 2. Data description. STEM field publications are selected during the first decade of a data period from 1991 to 2011. Detailed classifications of 108 subjects into NRC (sub)fields are presented in Table A2, Table A3 and Table A4 in Appendix F.
NRC Field#Subfield#Subject#Journal#Paper#Citation
Agricultural Sci611104128,685518,434
Bio & Health Sci1229362832,8054,201,683
Engineering1129145228,397943,834
Phys & Math Sci839267537,6581,914,953
Total371088781,727,5457,578,904