1. Introduction
The actual focus on resource-saving construction creates new demands on building materials. As a result, concrete components, for example, are becoming increasingly lightweight and slender, e.g., [
1,
2,
3]. Ultra-high performance concretes (UHPC) for reinforced concrete construction have been developed to increase material efficiency. Their material behaviour under static exposure is comparatively well known. In addition to static loads, structural elements of bridges or wind turbines must also withstand system-induced vibrations. Therefore, several researchers have recently intensified their investigations into the fatigue behaviour of UHPC, see e.g., [
4,
5,
6,
7,
8,
9,
10].
There are different recommendations for the determination of fatigue strength and Wöhler curves, e.g., [
11] in Germany. To create Wöhler curves for concrete, pressure-swell fatigue tests are generally carried out. High frequencies are used so that the tests allow many load changes in a short time. In comparison to normal strength concrete, however, in the case of UHPC and high performance concrete (HPC) the temperature of the material increases. The fact that the material can heat up when fatigue tests are performed on concrete has already been observed repeatedly, for example as one of the first by Assimacopoulos et al. (1959) [
12]. Especially for HPC, UHPC, or high strength, fine-grained mortars, heating was observed and partly investigated more closely [
13,
14,
15,
16,
17,
18,
19,
20]. In order to increase the state of knowledge concerning this phenomenon, it was systematically investigated mainly for UHPC in our own research project to find the main influencing parameters. The aim of the project is to understand the heating mechanisms in such a way that the negative effect on the number of load cycles can be taken into account retrospectively and thus, in a future standardization of the material, UHPC will not be underestimated in terms of fatigue strength. The first results have already been presented, e.g., in [
21,
22,
23,
24]. This article deals with the heating and the release of temperature during pressure-swell fatigue tests. The basis of this approach was the results presented in [
24], which could not all be sufficiently explained at that time. The new results should help to find out how the grade of damage influences the temperature development. For this purpose:
tests on temperature release on cylindrical specimens with and without pre-damage were carried out,
the heating under fatigue loading on samples with and without pre-damage was studied,
and thermally insulated cylinders were tested to compare the results with tests under normal conditions to find out whether the maximum absolute temperature or the gradient within the cross section is decisive.
Findings on the cooling-off behaviour, the heating behaviour, and their influence on the reachable number of load cycles are presented.
3. Results
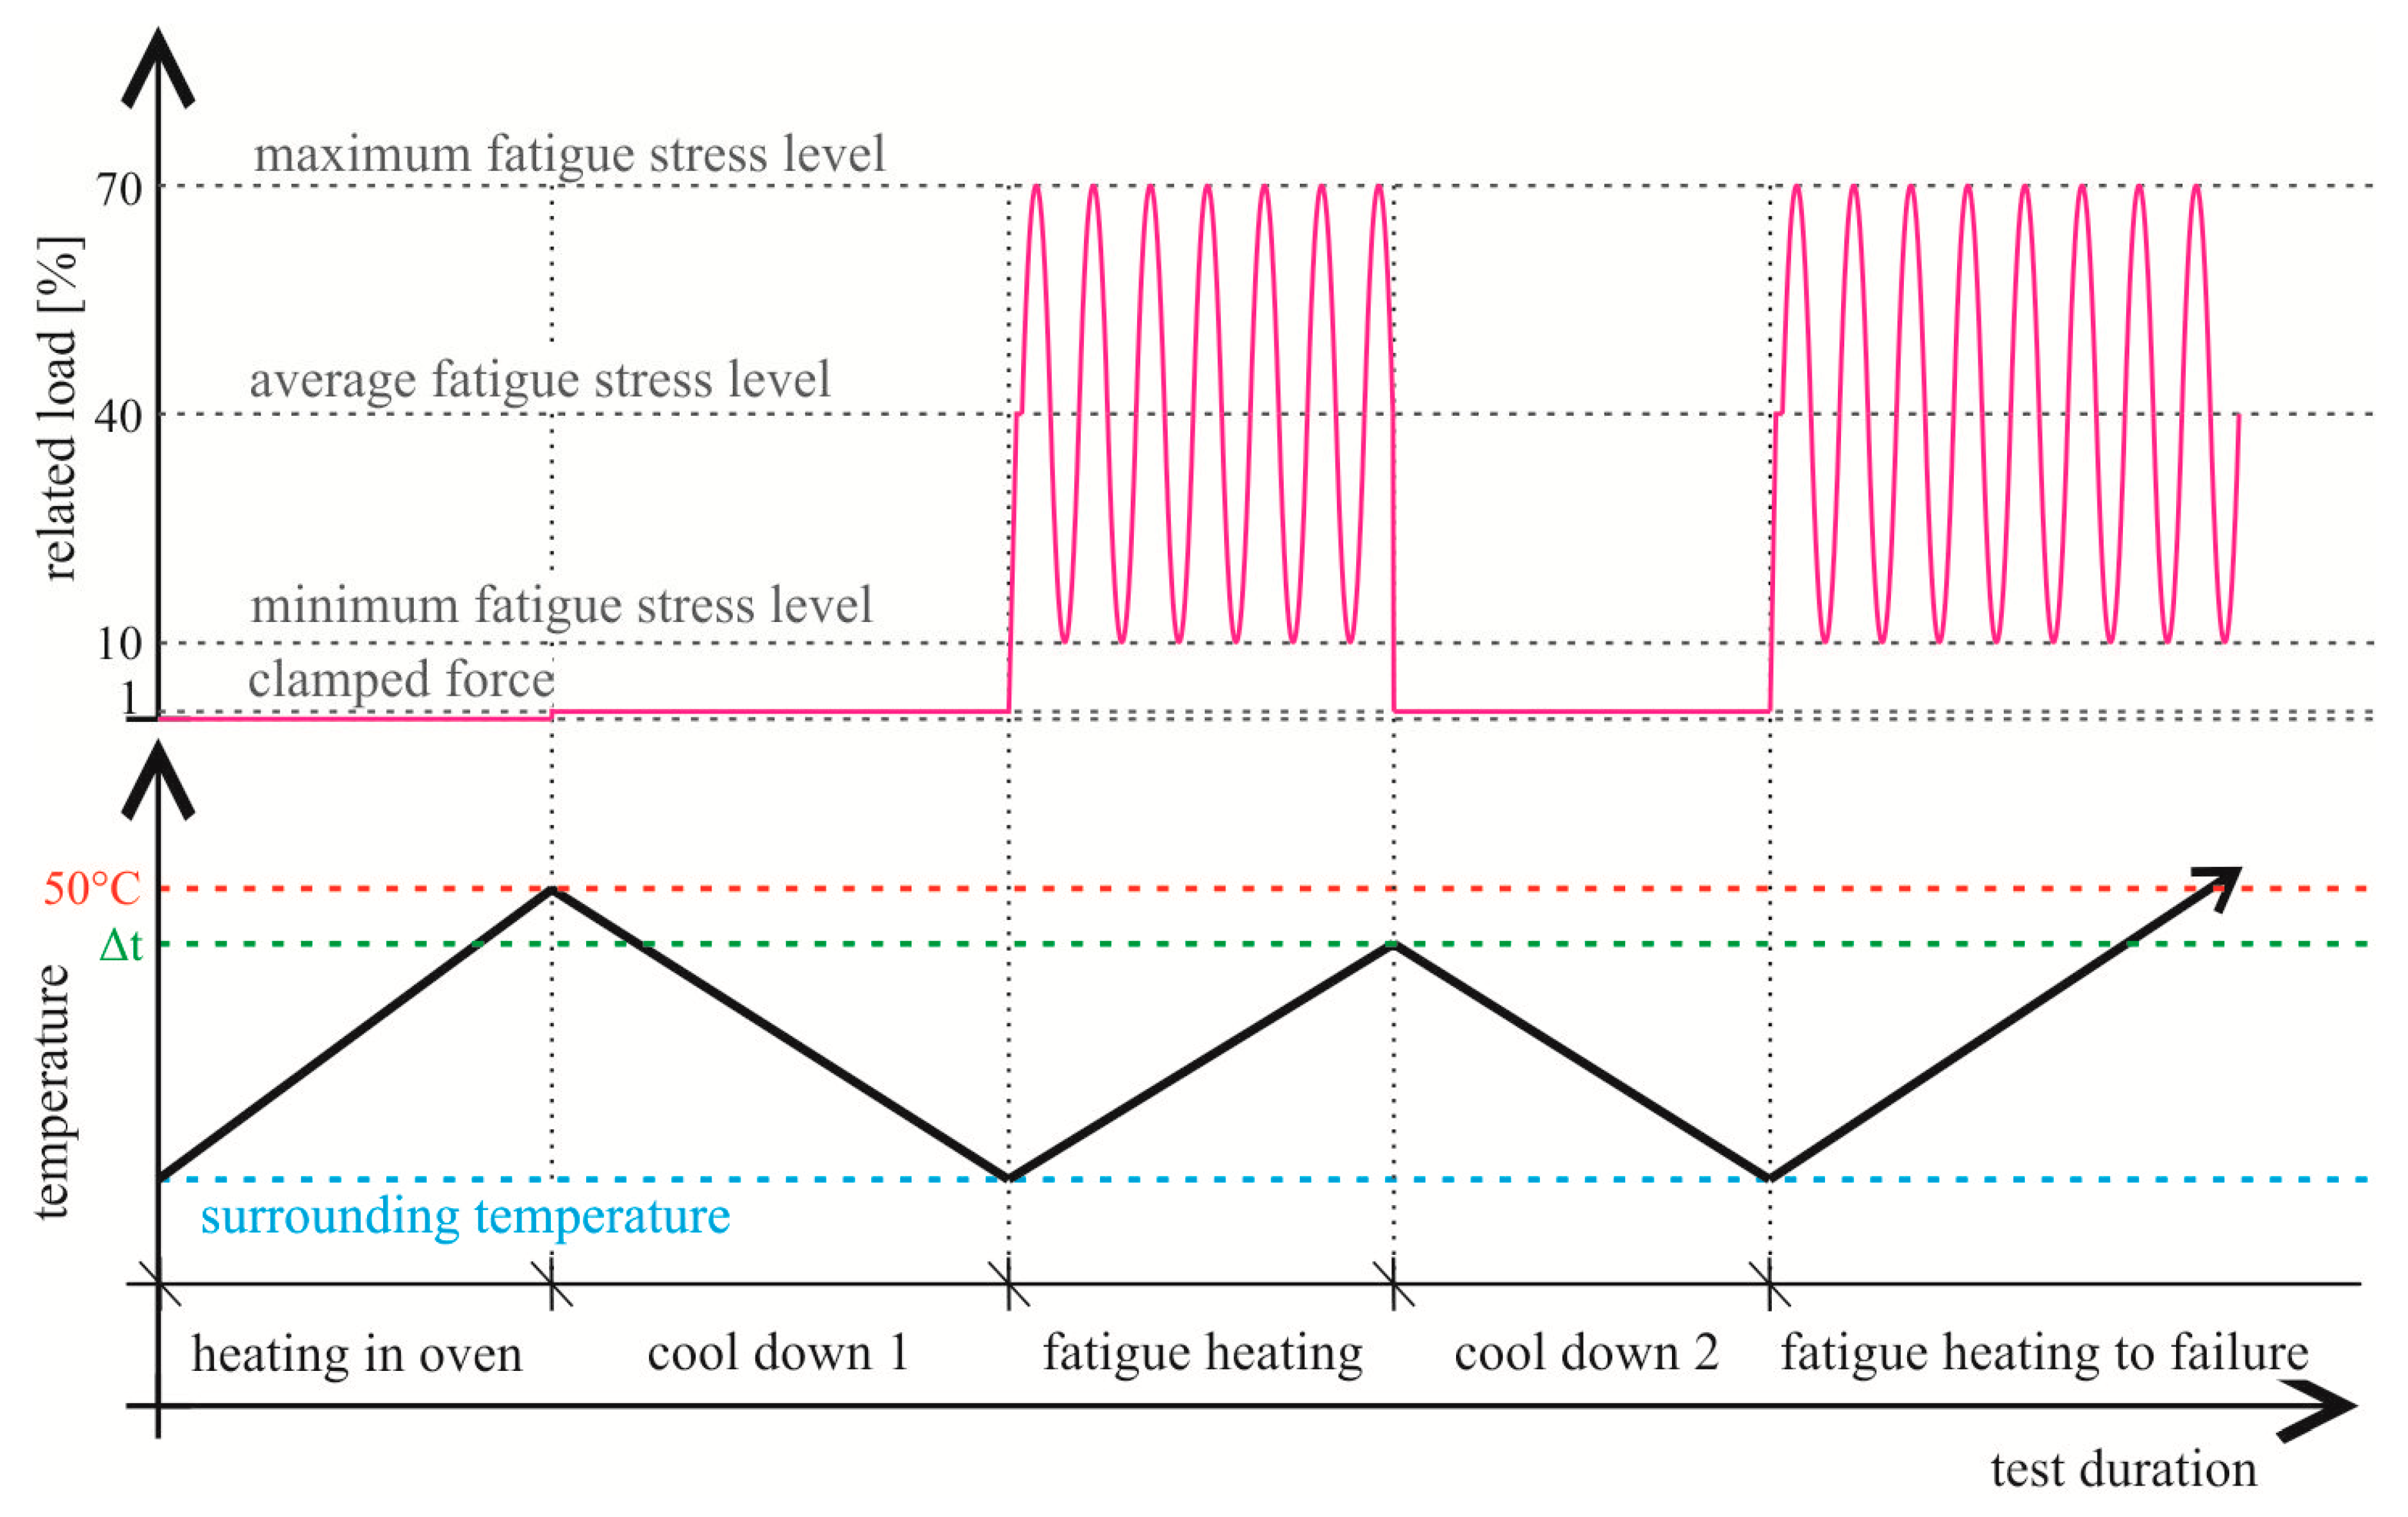
3.1. Temperature Decrease During Dwell Time in the Testing Machine
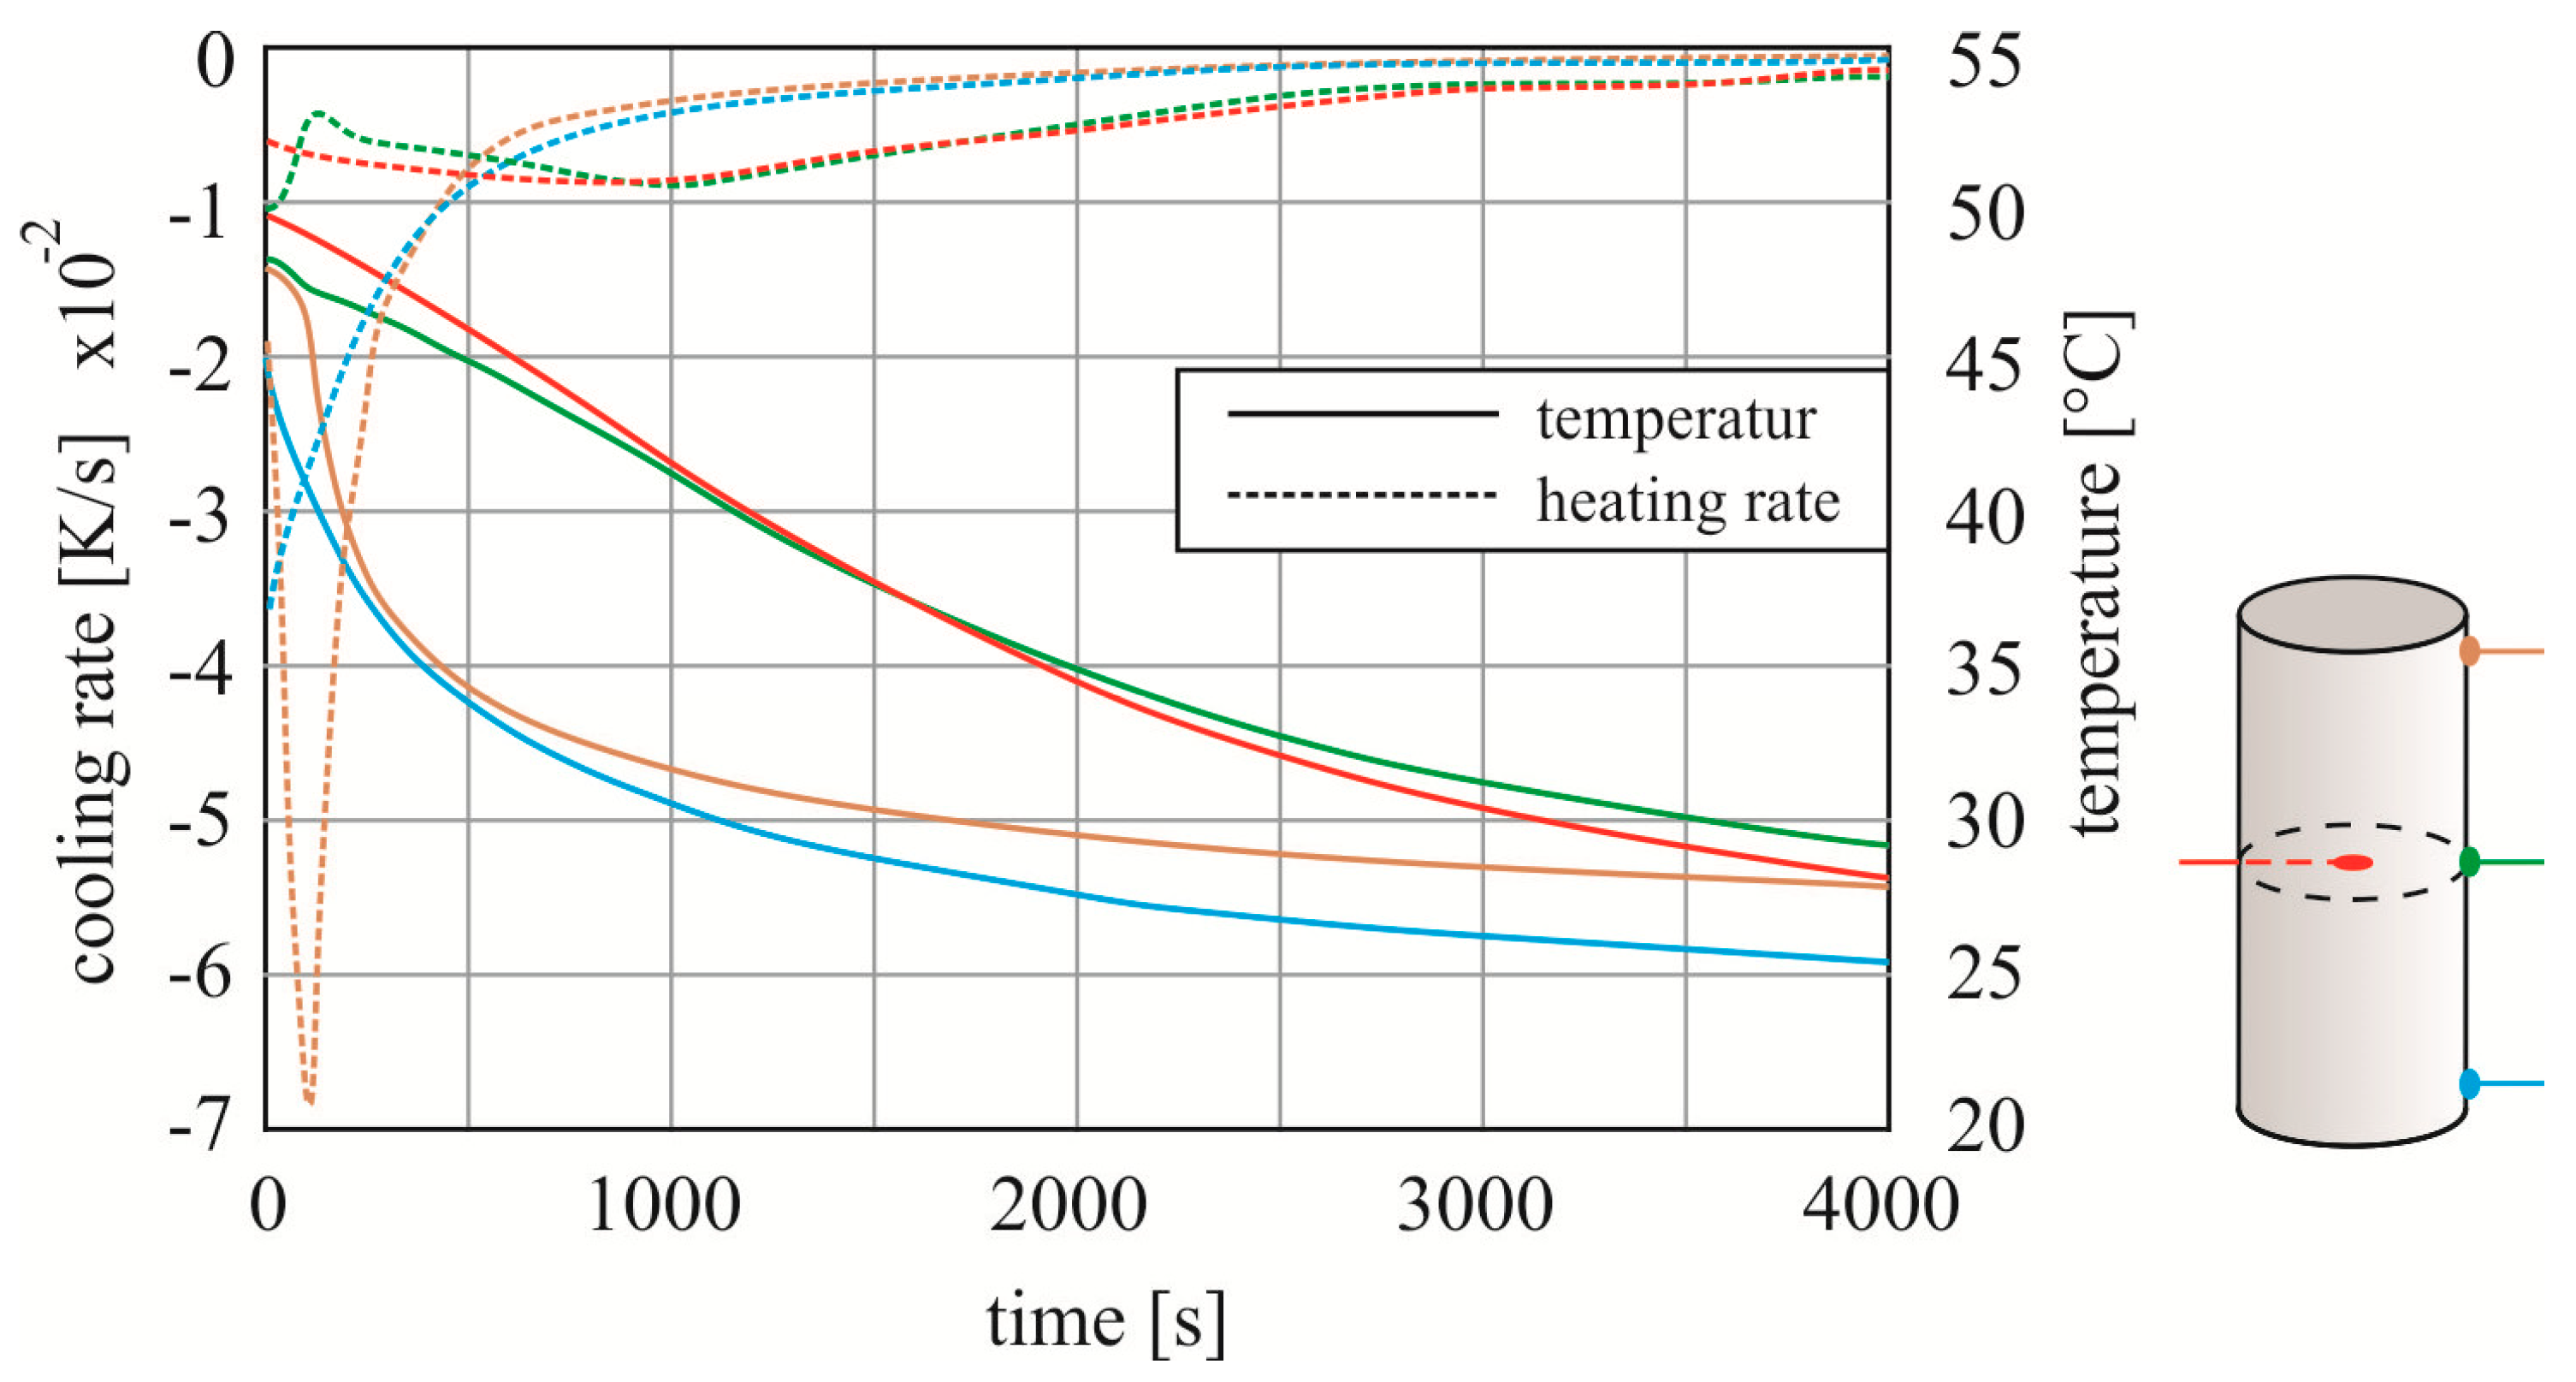
After heating of the specimens PK 1T to PK 3T, they were placed directly into the testing machine. The measuring equipment was connected so that the cooling down could be recorded. The diagram in
Figure 5 shows the temperature curves at all four measuring points of one specimen (right y-axis) and the associated cooling rate (left y-axis) over time. The temperature rate was calculated using the derivative of the temperature curves. For the colour assignment of graphs and sensors, compare with the sketch of the test specimen on the right.
The differences of the sample temperatures to 50 °C at the start of the recording can be explained by the test procedure. The measurement started as soon as the specimen was clamped in the machine under minimum load. The lower side (blue sensor) of the concrete cylinder stood on the metal loading plate from the beginning of placement into the machine and showed therefore the highest temperature loss until the start of measurement. In contrast, the surface in the middle and at the top of the cylinder cooled down to a similar extent until the calotte was fully in contact with the upper surface. The measurement inside the concrete shows only a small difference to 50 °C due to the greatest distance to the outside environment until the start of measurement, and therefore also the highest starting value.
The curves clearly show that the temperature reduction is strongest directly at the beginning of the recording near the load introduction plates which are made of steel. So they dissipate the temperature much faster than the ambient air. After about 10 min, the temperatures at the top and the bottom were already 10 K lower than in the middle. Due to the significantly lower absolute temperature, the discharge speed also decreased now and became lower than that for the sensors in the middle. This can be confirmed by the data from [
20], according to which the absolute temperature has a decisive influence on the thermal conductivity of concrete. Another interesting aspect of the recorded data is that in all tests the cooling of the inside of the test specimen was faster than the surface cooling in the same cross-section even at the same absolute temperatures. One explanatory approach is that the steel load introduction plates affect the heat dissipation from the centre of the sample, even if they are three times as far from the centre of the sample as the nearest sample surface. In order to check whether the faster cooling inside the test specimen is really caused by the metal plates, the test on PK 4T was carried out with insulating plates.
Figure 6a shows the temperature development of the test specimen when it was clamped between two Styrofoam insulating boards.
Because the sample PK 4T was clamped in the test machine a bit faster than the PK 2T after heating, the temperatures at the beginning of the measurement were very similar. For PK 4T, the temperature could only be derived via the surrounding atmosphere. The curves are very similar for all sensors. Especially between the measuring points at half height and at the top and the bottom, the difference is no longer as large as under standard test conditions. The lower cooling speed inside at the beginning of measurement results from the further distance to the surface.
Diagram 6b shows in detail the speed of temperature release, displayed via the cooling rate, from PK 2T to allow the comparison with PK 4T. The time required for cooling is significantly higher in the insulated test, as rapid release over metal surfaces is prevented. While the PK 4T achieves a higher cooling rate at the beginning, this is also due to the higher absolute temperature. If we compare the rate at same temperatures, we see that, at 40 °C, for example, the cooling rate under standard conditions is 0.75 × 10⁻² K/s and with insulation only 0.55 × 10⁻² K/s.
3.2. Temperature Decrease with and without Previous Fatigue Damage
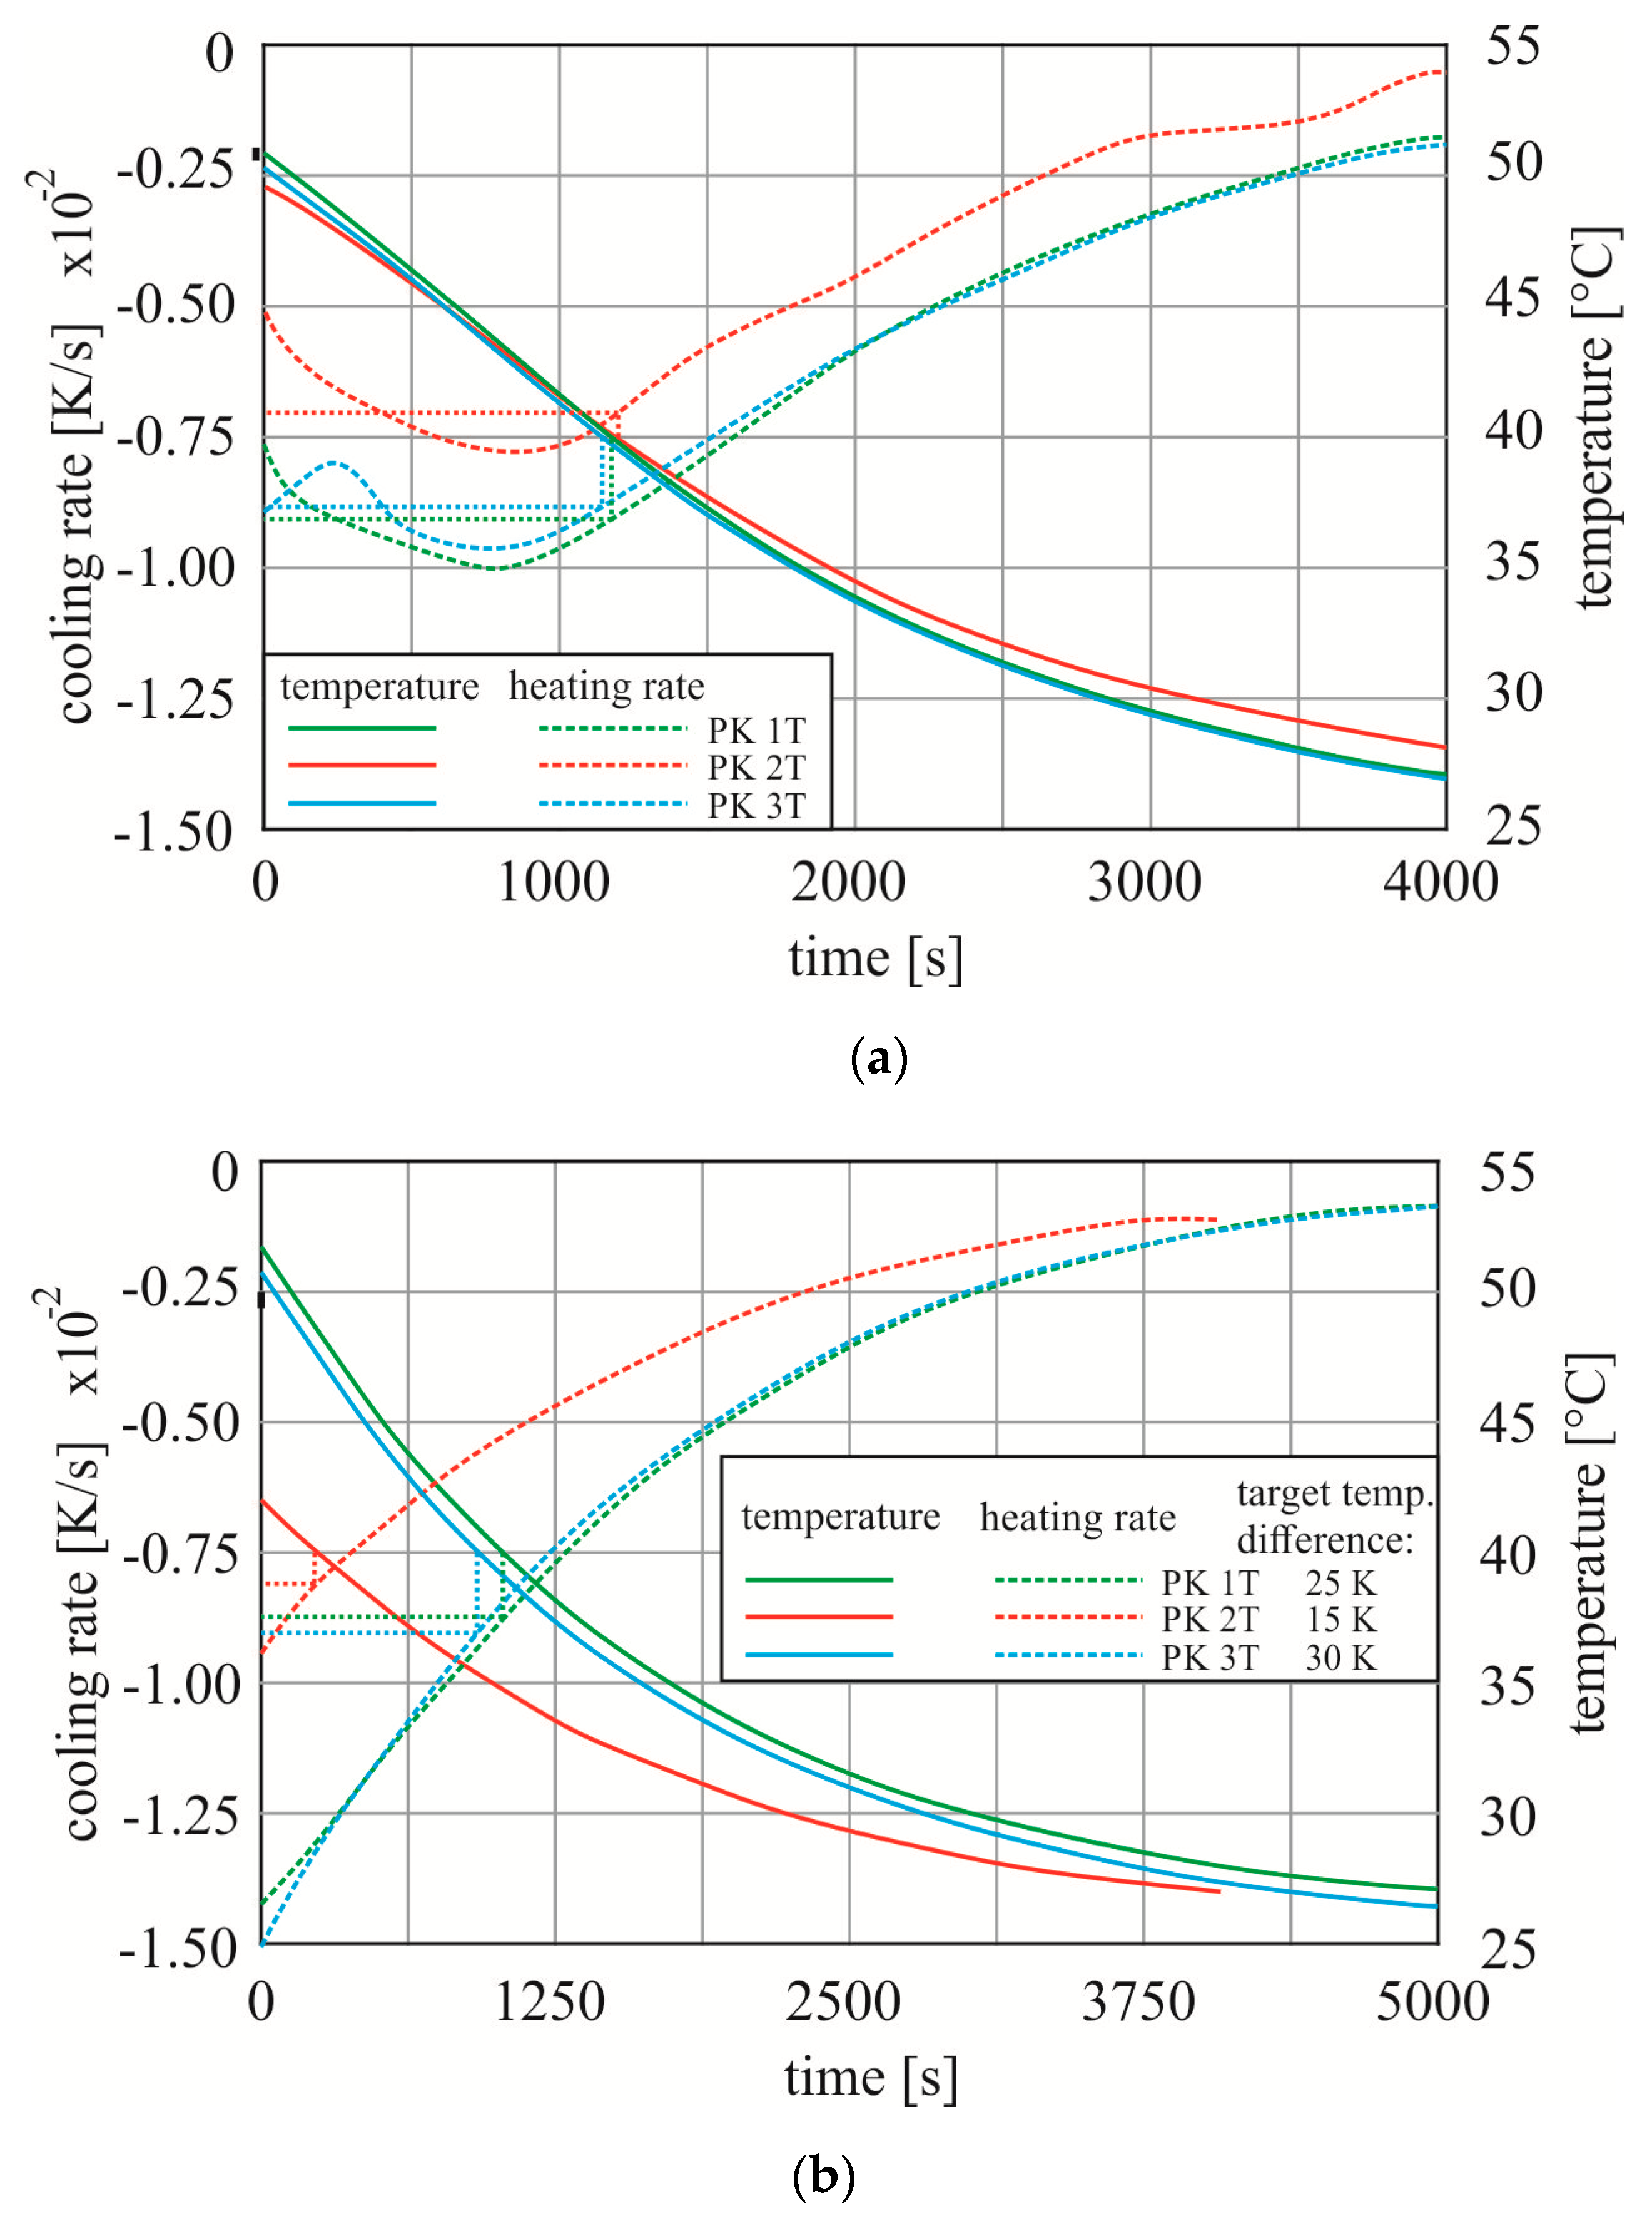
As explained under point 2.1., one aim of the investigations was to find out whether fatigue damage changes the temperature release capacity, i.e., also the thermal diffusivity of UHPC. For this purpose, the test specimens PK 1T to PK 3T were subjected to cyclic loading after cooling in the testing machine. The loading was continued until a target temperature (15, 25, or 30 °C, compare
Table 1) was approximately reached. The generation of different temperatures required different numbers of load changes before the next stop and cooling. Thus, a different degree of pre-damage was ensured. In
Figure 7, the upper diagram shows cooling without pre-damage for all three samples and the lower diagram shows cooling after cyclic loading. Again, both the absolute temperatures and the heating rates are shown. All displayed data were recorded by the sensors inside the specimen. Due to the long time required for the entire sample to cool down completely, the tests were stopped in very small ranges of the cooling rate.
The curves for PK 1T and PK 3T in
Figure 7a show a very similar character, both in terms of heating rate and temperature. The cooling rates increase up to about 800 s in each sample. After reaching a maximum value, all curves dropped to the same extent in all experiments until the ambient temperature was reached.
In
Figure 7b, the temperature curves between the test specimens differ according as planned. As listed in
Table 1, the target temperature at the start of the second cooling was deliberately chosen differently. A remark to cylinder PK 3T: During the cyclic loading, only a temperature difference of 28.5 K was achieved instead of the intended 30 K. Up to +28.5 K, there were considerably more load changes required than for the other samples. So, the test was stopped a bit earlier than planned because of the highly estimated risk of failure. For our investigation, the comparison of the temperature rates between the first and second cooling is decisive above all, not between the individual samples. The maximum cooling rates achieved were higher for samples with cyclic pre-damage. However, it must be taken into account that from the beginning there was already a difference between the internal and external temperature in the second cooling and thus the delay as in the first diagram does not occur. When heating up in the oven, the temperature in the core is lowest, which is exactly the opposite of the temperature gradient in the cross section when heating up due to fatigue load [
21]. In addition, the fastest cooling rates were achieved at different absolute temperatures in the two scenarios. In order to eliminate the influence of temperature on thermal conductivity when comparing the results, the cooling speed for each test was determined at the same absolute temperature for the first and second cooling, as shown in the diagrams by the dotted lines for an absolute temperature of 40 °C as an example.
Table 3 shows the values for each sample at 40 °C and at 30 °C.
At 40 °C, inside the test specimen, only the PK 2T shows a clear change between the first and second cooling: The release rate after the cyclic loading was higher. In the PK 1T and PK 3T tests with approximately the same maximum heating, on the other hand, the values remained almost constant, where the values were slightly higher once for the first and once for the second cooling. In this regard it should be noted that these test specimens without significant changes were subjected considerably longer to cyclic loading than PK 2T.
At 30 °C, PK 2T still shows a faster cooling rate after pre-damage due to cyclic loading than after heating in the oven. This is in contrast to the other two specimens PK 1T and PK 3T, which gave off heat more slowly after fatigue heating than after oven heating. The comparison at 30 °C shows larger deviations between the cooling of specimen with and without cyclic pre-damage. However, it should be noted that, for this observation horizon, the test specimen temperature of PK 1T and PK 2T was only just under 3 K below the ambient temperature, and for PK 3T it was 6.5 K, such that external influences are more pronounced, since the cooling rate decreases as the sample temperature nears that of the surrounding air. For PK 2 T, it should also be noted that the ambient temperature was 3 K lower during the first cooling than during the second cooling.
Overall, no systematic change in heat dissipation could be detected due to previous damage. Thus, for a theoretical representation of the heating process, the concrete temperature and not the number of load cycles seems to be decisive for the thermal conductivity.
3.3. Temperature Increase, Heating Rate and Number of Load Cycles with and without Fatigue Damage
In addition to the temperature release capacity, the tests can also be used to assess the change in temperature increases due to a previous damage, since all three tests after the second cooling were loaded with the same load as during the first fatigue heating up until failure.
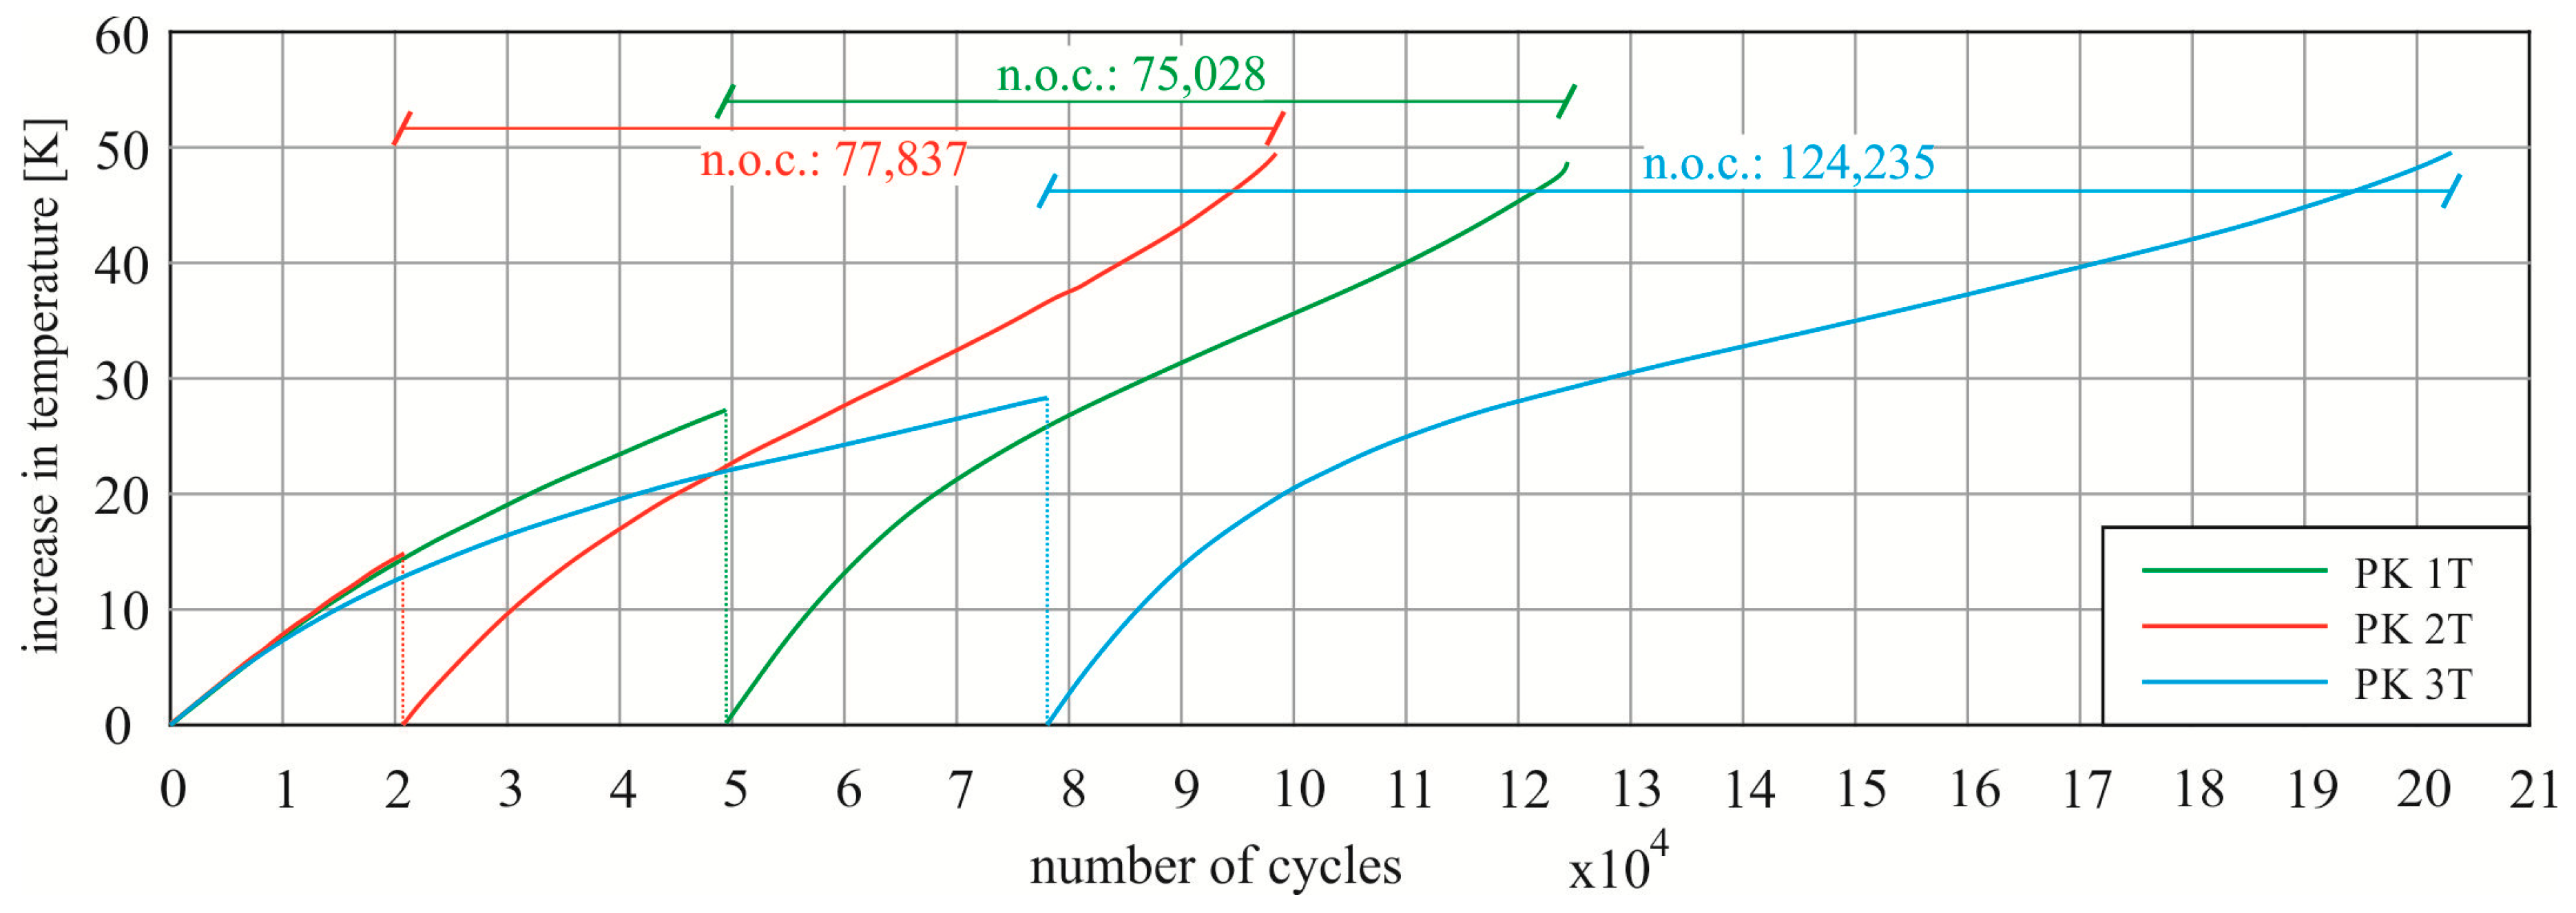
Figure 8 shows the recorded temperature curves in the centre of the test specimens for each of the three tests. The diagram does not show the absolute temperatures, but the differences to the initial values plotted in relation to the number of load cycles (n.o.c.) instead of at the time, in order to be able to show the cooling minimized.
The first cyclic warming shows a strong agreement especially in the two tests on PK 1T and PK 2T. The third specimen shows a slower temperature rise. The temperature reached in its centre was only 1.3 K higher than for PK 1T, but the required number of load cycles was almost 30,000 higher. This is probably due to the scattering of concrete strengths. The loading regime is defined in advance on the basis of 3 compression tests, so a deviation distorts the true relative loads and thus has a considerable influence on the scatter of tests [
10,
29]. Such deviations are typical for fatigue tests on concrete and could already be shown in [
24].
However, the focus is on the second heating due to the cyclical load. The tests each achieved a temperature difference just below 50 K until failure. The scatter between the tests is below 1 K. The curves of PK 1T and PK 2T show a strong agreement as with the first load. This is also evident when considering the number of load cycles from the second loading to failure. On the other hand, the 28,500 cycle difference before the load was relieved did not influence the reached number of cycles after the restart. PK 3T continues to show a flatter course. The temperature difference achieved corresponds to the other tests, except that with 124,235 load cycles after unloading, about 1.6 times more load cycles were required. This is particularly remarkable, since the previous load was also clearly the longest for PK 3T. In total, the number of load cycles achieved results in 98.559 for PK 2T, 124,477 for PK 1 T and 202,057 for PK 3T and therefore an order which matches the duration of the first cyclic load. However, no influence of the first load on the second one can be seen. The second fatigue cycling achieves an average of 92,367 load cycles, which, considering the scatter in the small test quantity, is approximately in the range of the average of cyclic test on specimens without pre-loading. For this purpose, the average value 82,915 from [
24] is taken as a comparison value, where the same concrete was tested under the same test and loading conditions. The calculated expected value for a load according to the Wöhler curve after fib Model Code 2010 [
30] is about 146,000 load cycles. This is only achieved in the summation of cycles in the PK 3T. If all the load cycles mentioned are considered, the results make it clear that temperature has the decisive influence for premature failure.
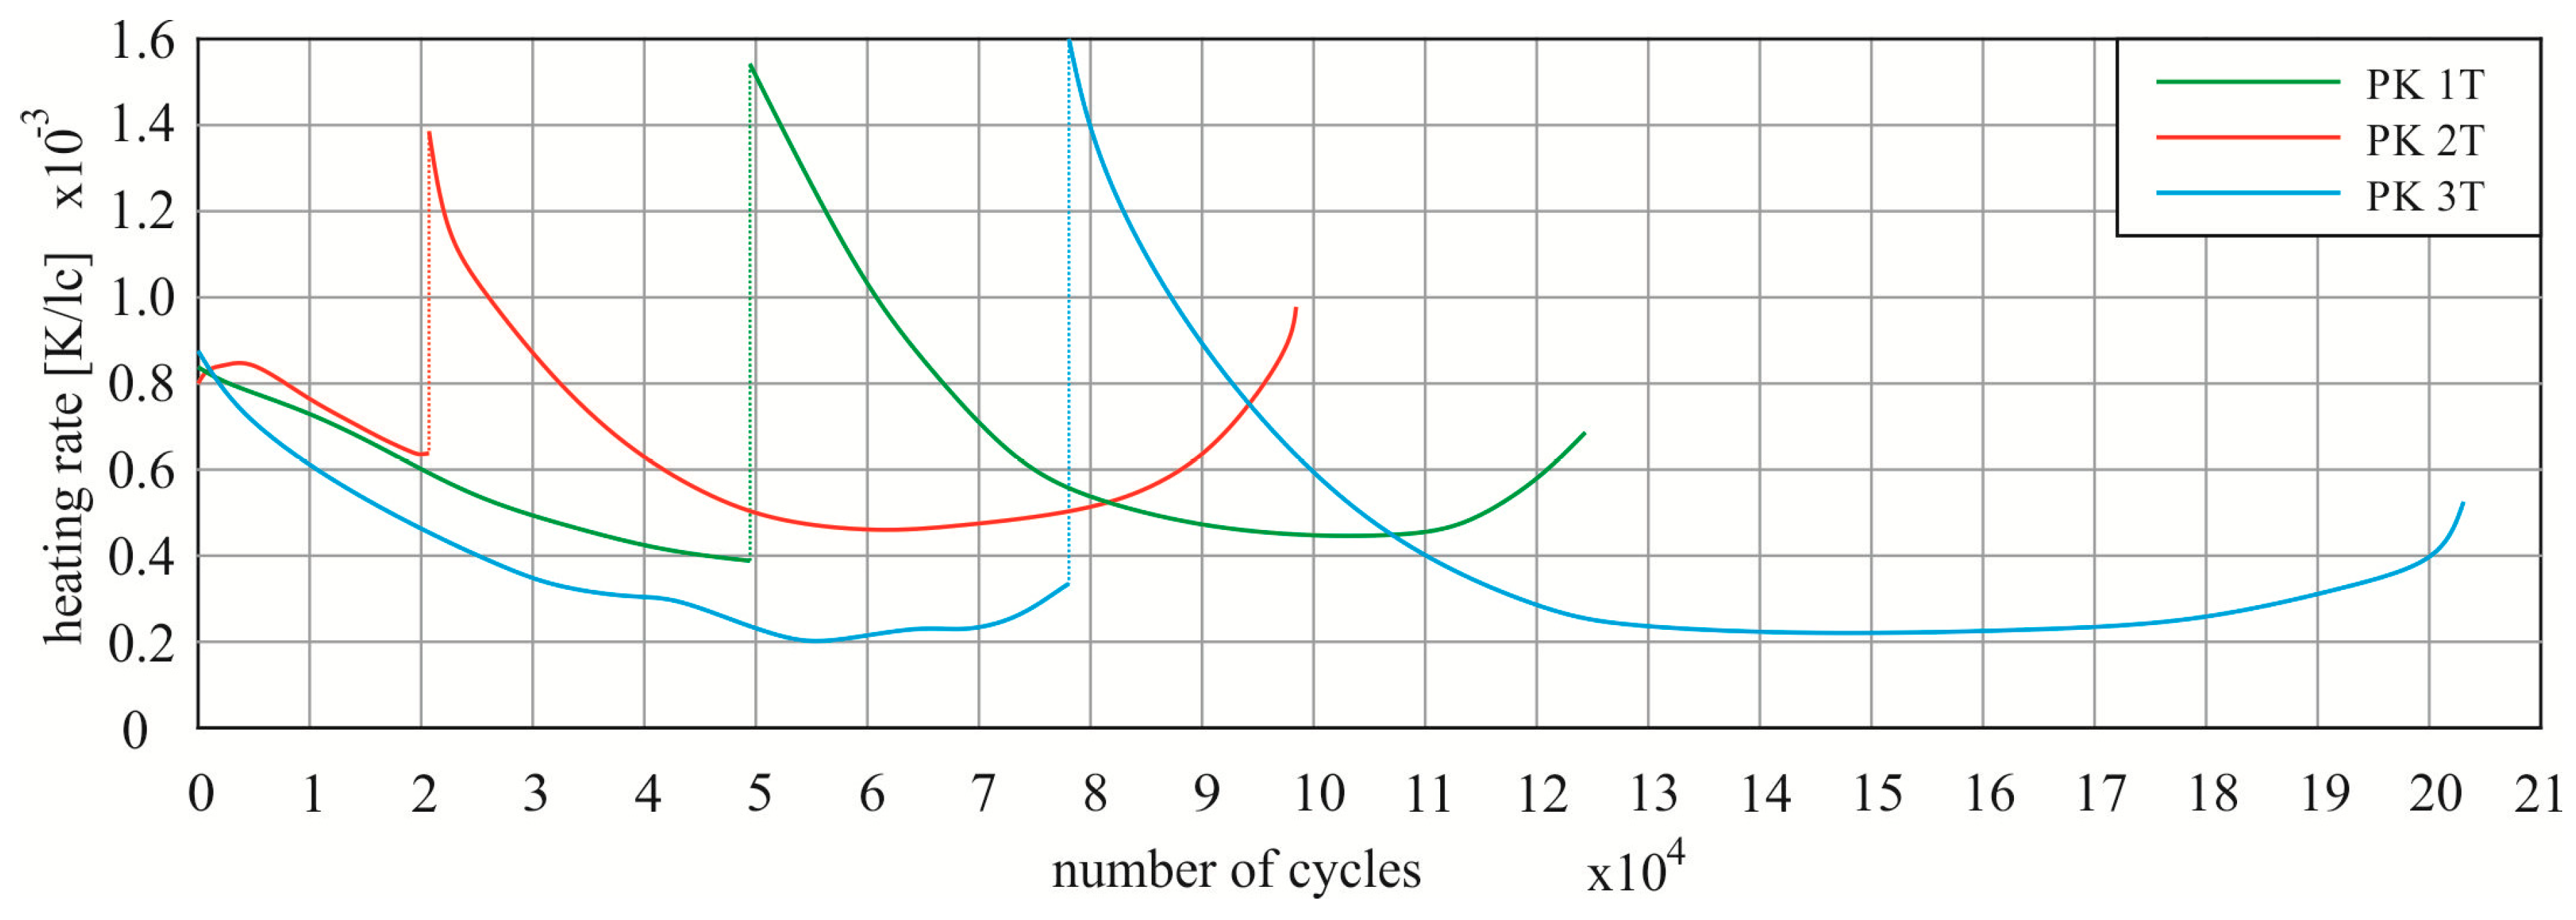
During the two cyclic loading periods, it is also evident when comparing the heating rate curves. These are plotted in
Figure 9, also using the number of load cycles on the x-axis.
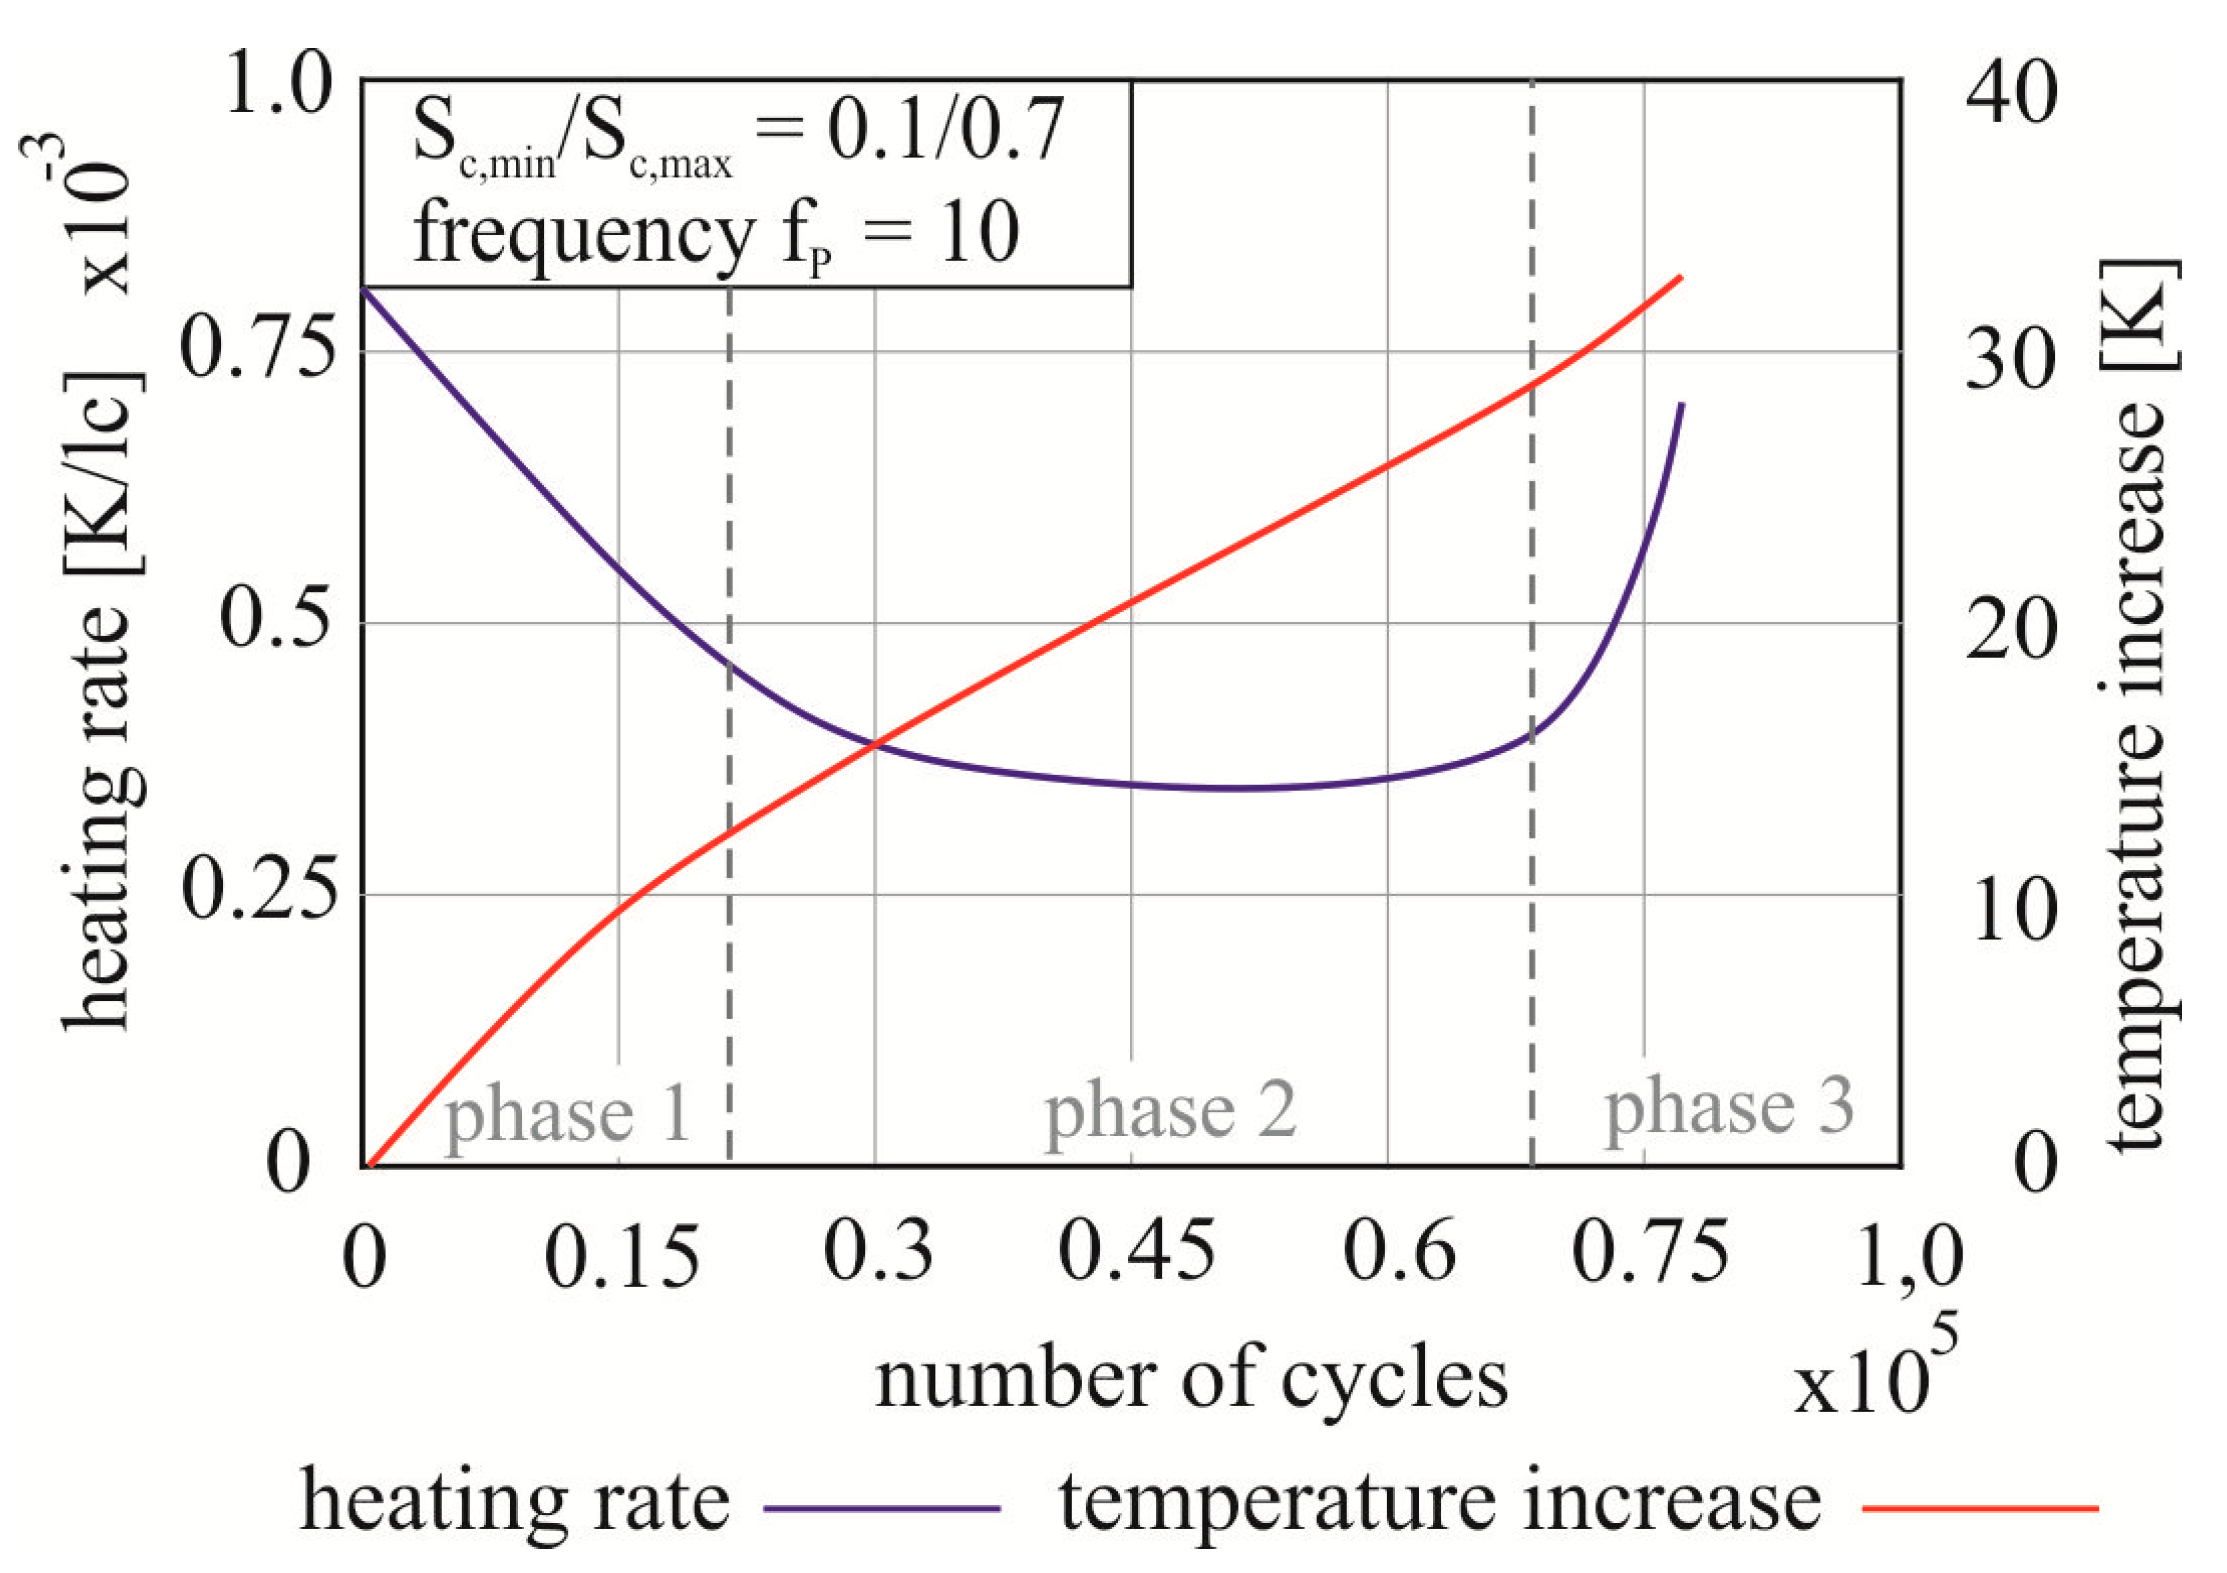
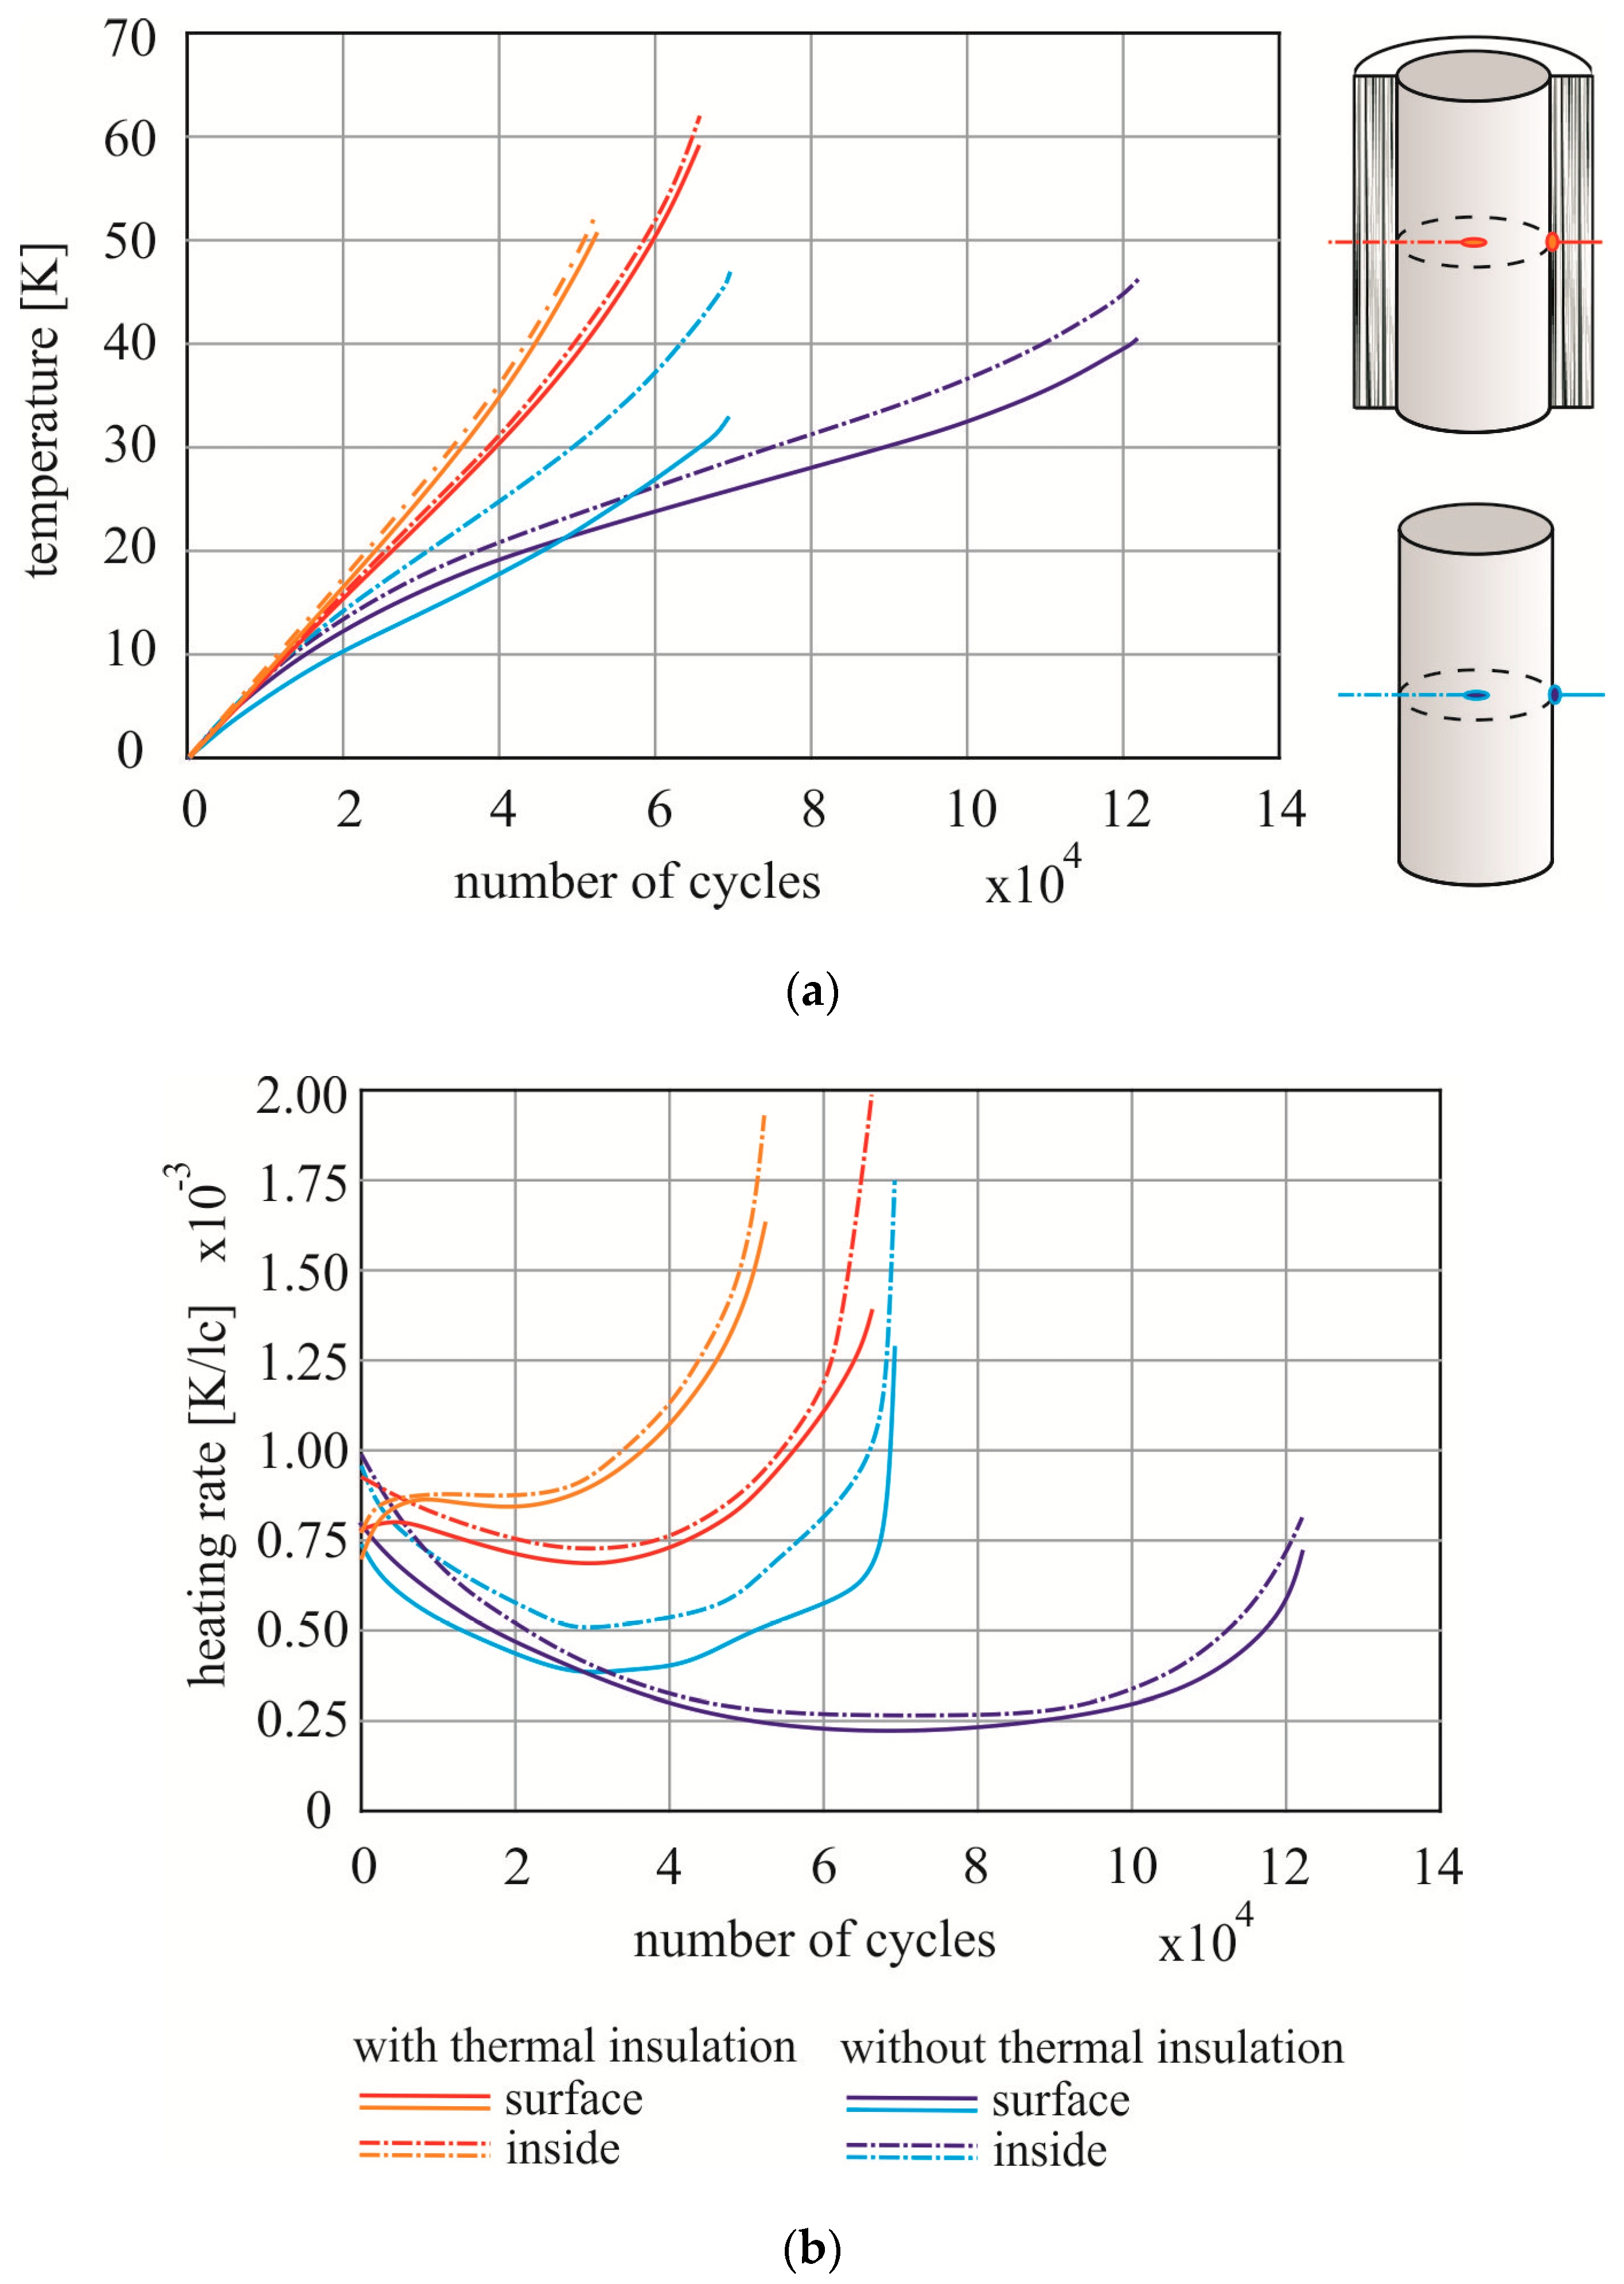
The characteristics of the heating rate during the second cyclic load correspond to those already described in [
24] for the same configuration without preload, as can be seen in
Figure 1. For a frequency of 10 Hz, the strongest increase was in most cases registered at the beginning of the test.
The courses of the first cyclic load are quasi not completed and represent only a part of the whole curve. Where PK 1T and PK 2T are still within the range of the decreasing rate, a beginning increase in the heating rate can already be seen at PK 3T. This is a characteristic for an approaching failure in all tests from [
24] as well as in the curves of the second fatigue loading shown here.
The temperature rate at the beginning of the first load corresponds to that shown in
Figure 1 with values between 0.80 to 0.87 × 10
−3 K/lc. Although a new batch of concrete has been produced, this load configuration always seems to achieve similar heating rates. According to the blue curve in
Figure 8, the speed drops faster with PK 3T, so that the heating progresses more slowly. After the specimens have been stopped and cooled and a new cyclic loading has been applied, a clear jump in the rise curves can be seen. The start values for all three attempts are clearly above the start value of the first fatigue loading. Looking at the individual curves, it is also noticeable that with increasing preload the maximum rate increases for the second load. A preload therefore seems to have a clear influence on the heat generation.
Table 4 enables the comparison of the maximum heating rates during the first and the second cyclic loading phase and the corresponding value of the tests from [
24], as shown in
Figure 1.
Particularly between PK 1T and PK 2T, which brought very precise agreement in all evaluations, it is shown that, with longer cyclical preloading, the increase in the temperature rate also increases with renewed fatigue loading. PK 3T achieves the greatest jump, but this is in the same range as PK 2T with a significantly longer preload. Overall, however, it can be seen that the temperature increase at the first loading agrees well between the tests, but that a renewed loading after cooling causes a significantly higher heating rate.
3.4. Specimen with Thermal Insulation
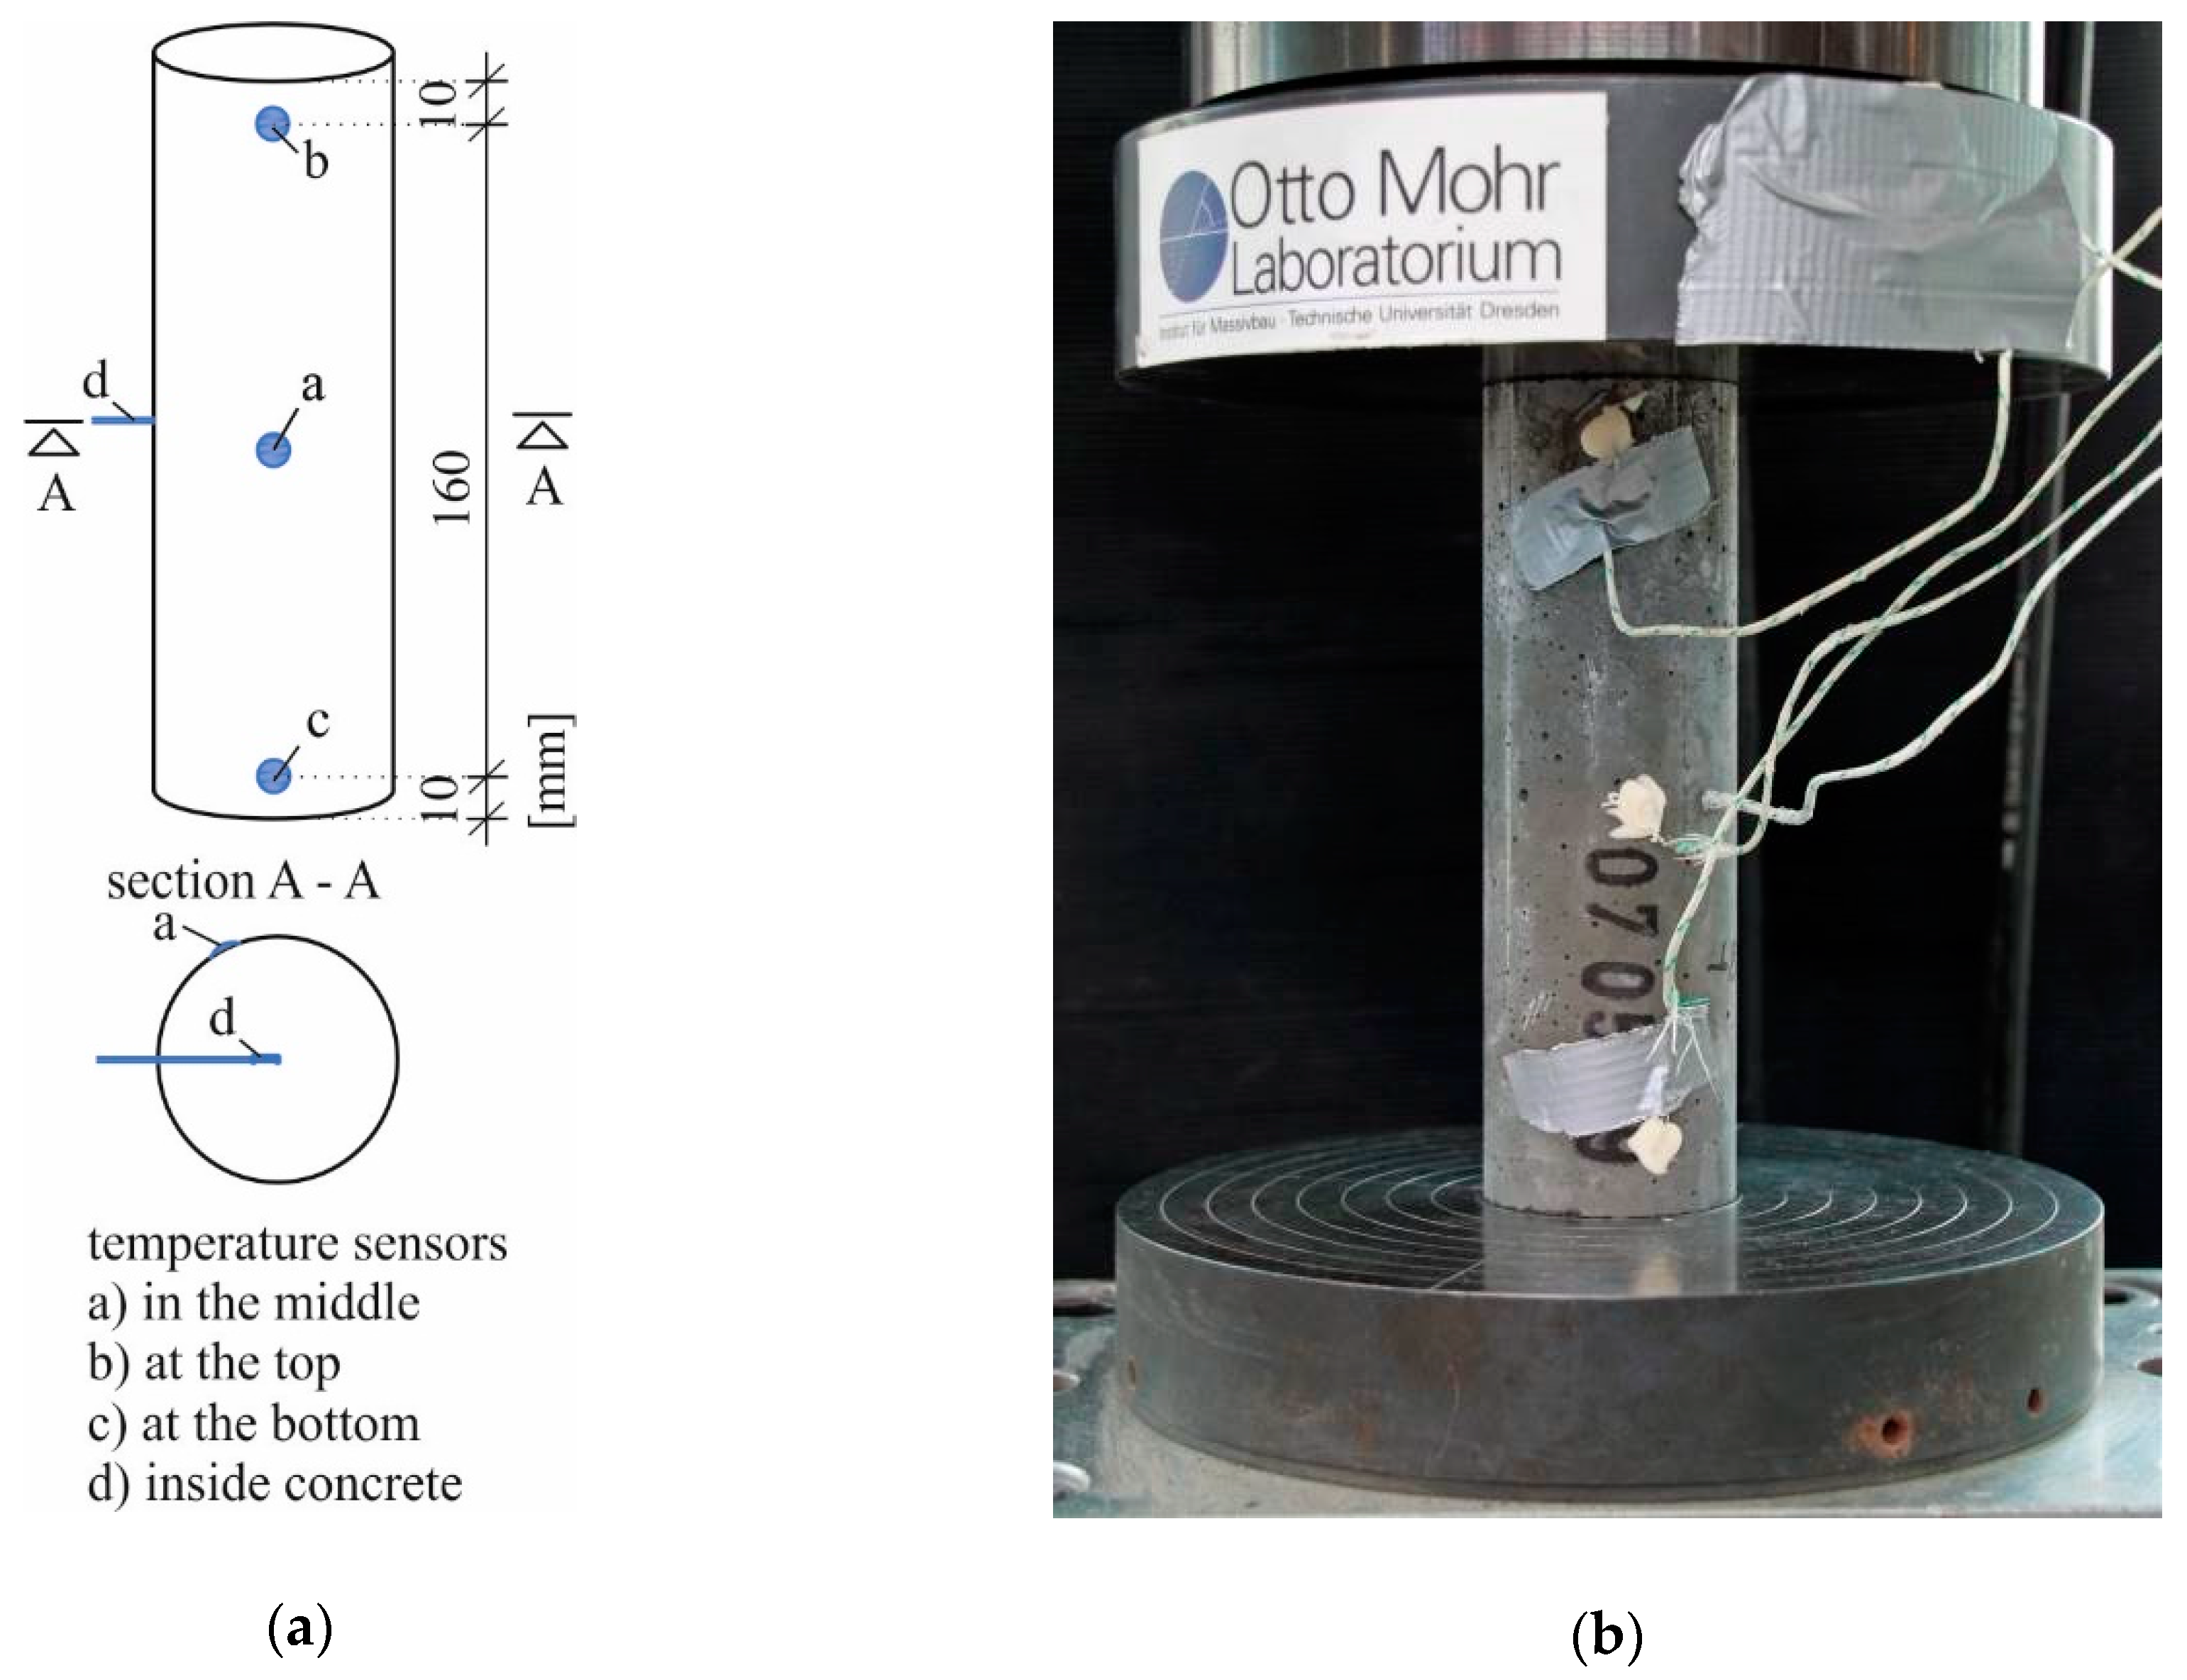
In [
15], two possible effects of temperature on early failure of high-strength grouted concrete were presented, which may also apply to UHPC. On the one hand, for all specimens with temperature sensors in the concrete (such as
Figure 3a), which showed a temperature increase until failure, an increasing difference between the internal and external temperature was determined in [
22,
24] in analogy to [
15]. This gradient can cause constraint stresses and change the force flow through the specimen so that the effectively loaded area becomes smaller and the real related upper stress increases. A further effect can be the reduction of the static compressive strength with increasing temperature [
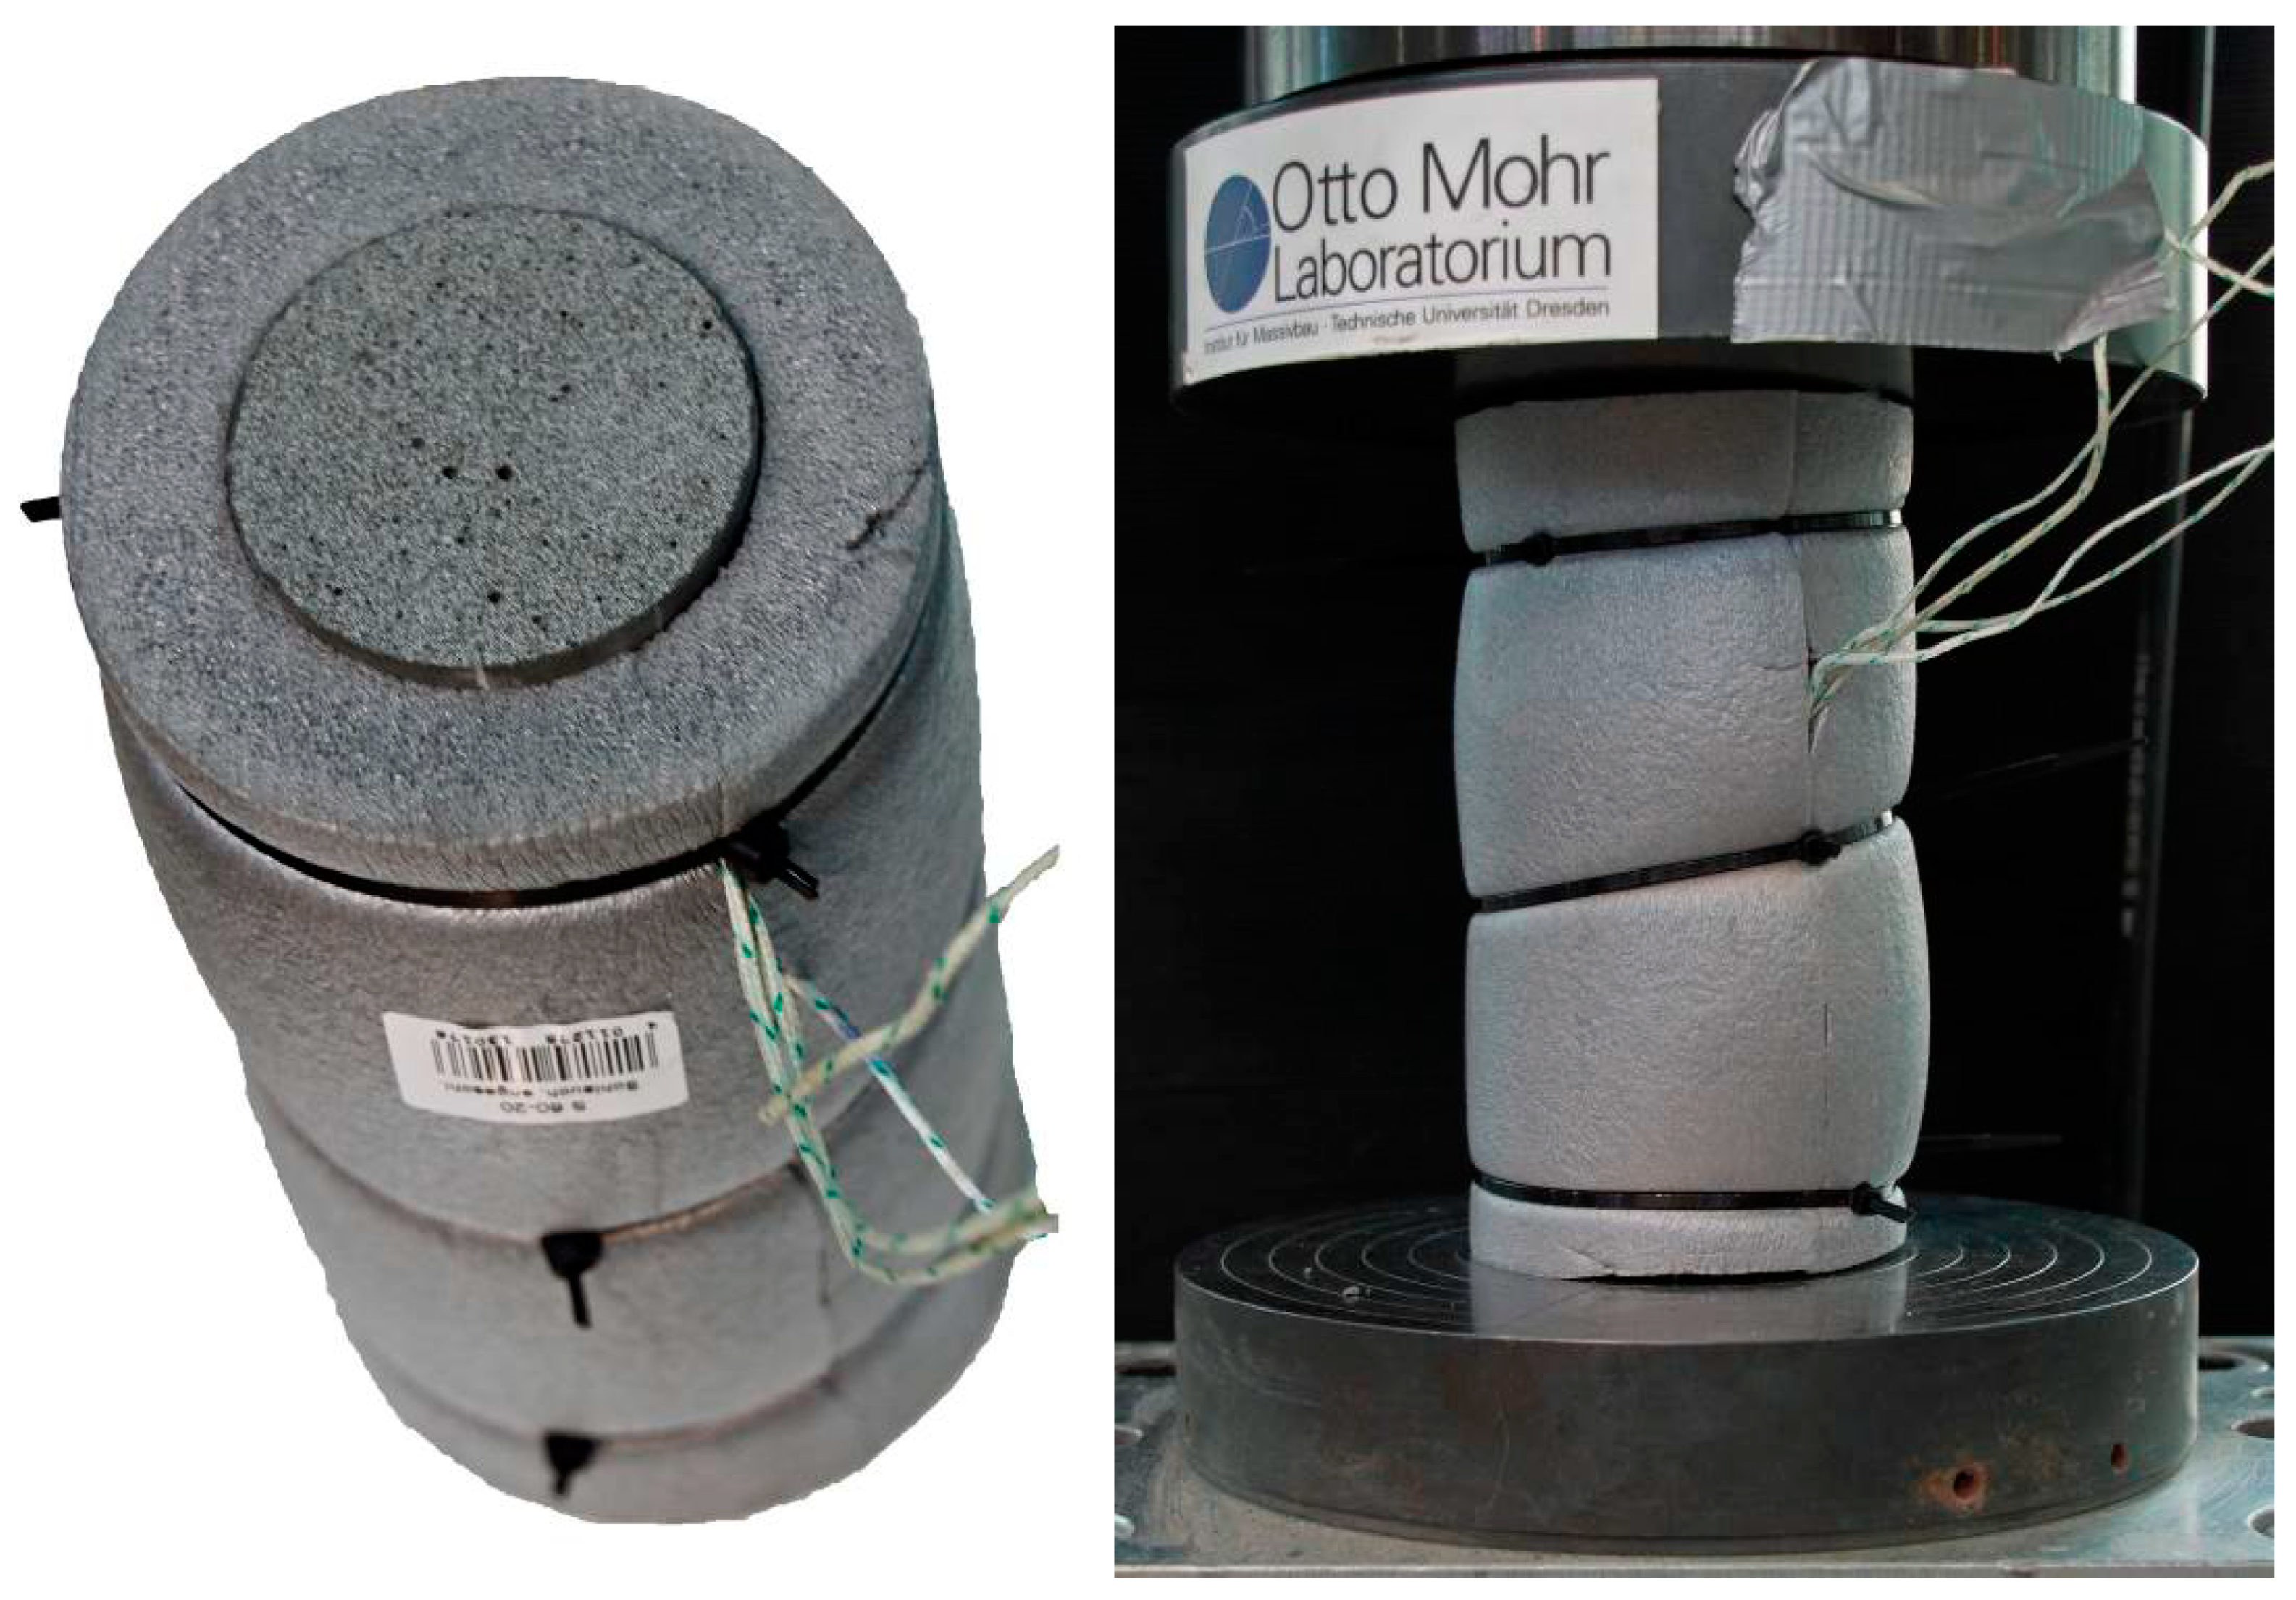
31]. Insulated tests were carried out to verify the hypotheses. The aim was to minimize the temperature gradient in the cross-section through a casing with an insulation pipe. The insulated and non-insulated test specimens are shown in
Figure 3 and
Figure 4.
Figure 10 shows the temperature curves (10(a)) and the heating rate (10(b)) for the different specimen preparations.
The uninsulated samples PK 5T and PK 6T both show a growing temperature gradient over the duration of the experiment (
Figure 10a). These gradients differ in their size. In the test shown in light blue, the difference reaches a value of 12 K over the cross-section. In the test shown in purple, this difference is only half as large, at a maximum of 6 K. Almost as large as the relative difference of the gradients is also the difference of the number of load cycles achieved until failure. At the small gradient, 122,095 load cycles, and at the large gradient, only 69,370 load cycles were achieved. Thus an influence of the gradient seems plausible.
In the insulated attempts (PK 7TI and PK 8TI), the goal of a significantly reduced gradient was achieved. Only shortly before failure differences of once 2 K and once 4 K were measured. However, a higher number of load cycles than in the uninsulated tests was not achieved as expected. The samples failed after 66,186 resp. 52,462 load cycles even earlier. The gradient can therefore not be the sole main influencing factor. In addition to the changed differences, the insulated samples also showed a stronger temperature increase. Thus, the temperatures reached inside and on the surface were higher than in the non-insulated tests. In the centre of the test specimen, at around 55 K, about 10 K more were achieved, and at the surface, at around 52.5 K, the difference was even nearly 15 K. These results indicate that it is mainly the maximum temperature reached in the test specimen that has an influence on the test specimen failure.
The differences in the temperature curves can also be seen in
Figure 10b. On the one hand, the insulated tests show good agreement for the heating rate inside and outside and, on the other hand, the curves are different from the uninsulated curves. The starting values of the cooling speed of all four tests lie between 0.75 × 10
−3 K/lc and 1.00 × 10
−3 K/lc and thus in a corresponding range. Compared to PK 5T, for PK 6T and the samples in [
24], however, no significant drop in the rate is evident. This is only minimal before the inside and outside heating rate increases exponentially until failure. Immediately before failure, the rate doubled in both tests with insulation. The prevention of temperature release via the environment thus has a strong influence on the course of the temperature rate and thus the temperature curves, despite a possible release via the steel calotte.
4. Summary, Conclusion and Outlook
In the first part of the presentation of the results, the experiments on temperature release are presented, in which the test specimens were only slightly fixed in the test setup until they were completely cooled down, after having been heated in an oven. It was shown that the temperature is released mainly via the surfaces of the steel load introduction plates. Thus, the reduction of the temperature in the centre of the concrete cylinders was faster than the reduction at the surface. When the heat was prevented from dissipating via the steel, homogeneous cooling occurred at all measuring points, but this now lasted twice as long as when cooling via steel and ambient air.
The investigation of pre-damage influences by cyclic loading on the temperature release was carried out by heating via fatigue loading and renewed cooling under the same boundary conditions. Load cycle numbers of approx. 25%, 60%, and 90% of the mean load cycles from [
24] under the same load parameters showed an influence on cooling only when the initial values of −0.94 × 10
−2 K/s to −1.50 × 10
−2 K/s were considered. This influence can be attributed to the changed thermal conductivity of concrete at different temperatures [
20]. When comparing the temperature rates before and after loading and taking into account the different pre-damages, no systematic influence could be found if the comparison was carried out at the same absolute temperatures.
The same experiments were used to investigate the influence of pre-damage on heat generation. In principle, all tests showed a significant increase in the heating rate after the cyclic preloading compared to the rate at the first loading. However, the pre-damage had no visible influence on the number of load cycles achieved. In comparison, the same maximum temperature difference of almost 50 K was noticed in all tests. The second loads remained, as the results in [
22,
24], below the expected value according to fib Model Code 2010 [
30] under this load configuration. This confirms the results in [
22,
24] that the temperature is essentially related to premature failure.
The verification of the assumption of temperature gradients in the cross section as an essential influencing factor was confirmed by comparing tests with different measured differences between inside and outside temperature. However, the reduction of the difference due to insulation showed that the gradient is not the only decisive factor. Insulation causes a reduced release capability via the environment, a minimized gradient and thus a faster and higher absolute temperature in UHPC. The samples with insulation failed faster than the non-insulated ones. The reason for this is considered to be the influence of temperature increase on the compressive strength of concrete. According to [
31], a reduction for HPC was found with increasing temperature. If the strength is also reduced for UHPC, the related concrete stress would increase over the duration of the test. This would result in a faster damage accumulation and cause an earlier failure.
A comparison of all test results of this test program shows that under the different test conditions, the failure temperatures inside the test specimen are all in similar ranges: 55 K for the insulated samples PK 7TI/8TI, 49 K for the samples PK 1T–3T (second fatigue loading after thermal pre-loading by heating in a furnace and by a first cyclic loading) and 45 K for the cylinders PK 5T/6T (single cyclical exposure without insulation). Under the parameter configuration investigated here, a type of failure temperature can be assumed for the used UHPC.
If the results of the temperature release tests are related to the tests with and without insulation, assumptions can be made about the influence of cooling on the heating process. Although the temperature is also clearly dissipated via the steel plates, a temperature reduction via the ambient atmosphere already changes the heating rate significantly. The reduction of the speed of the temperature increase after the start is in the range of 0.5 to 0.75 × 10
−2 K/s in the uninsulated tests (PK 5T/6T). In contrast, in the tests with insulation around the samples (PK 7T/8T) the maximum reduction was 0.2 × 10
−2 K/s (compare
Figure 10b). To show that the cooling of the PK 4T with insulation between sample and loading plate represents the difference between the heatings with and without insulation around the specimen, a comparison can be made between, for example, PK 7TI (yellow curve in
Figure 10) and PK 5T (light blue curve in
Figure 10). The test specimen, which is insulated on the surface, shows virtually no reduction in the temperature rate along its entire length. The test specimen without insulation reaches the minimum temperature rate with a heating of approx. 19 K. Compared to the start, the heating rate has been reduced by 0.48 × 10
−2 K/s. If the ambient temperature of 22 °C is added to the 19 K, the absolute temperature of PK 5T at the time of slowest heating is obtained. Finally, this temperature can be used to read the temperature rate lost over the surface in
Figure 6a. This is approximately 0.5 × 10
−2 K/s. It can therefore be seen that the cooling rate of PK 4T describes the difference between PK 5T and PK 7TI well. This may only be a first example, but taking into account the increasing thermal diffusivity of the concrete as the temperature rises (compare [
20]), it can be assumed that the reduction in the rate of increase in uninsulated tests is mainly due to the increase in cooling.
In summary, the following main conclusions can be made from the results of the presented test series:
During heating in the fatigue tests, the temperature is released most strongly via the load introduction plates.
The pre-damage has no significant influence on the cooling rate of the specimens.
A cyclical pre-damage leads to a faster temperature increase with a new cyclical load.
In addition to the temperature gradient in the cross-section, the absolute temperature has a strong influence on the early failure.
With the above-mentioned main statements and the conclusions drawn concerning the relationships between heating, cooling, and damage influences, approaches were found with which the heating description in the fatigue test can be better understood. It is a further step to classify the heating phenomenon as a specific problem of the test technology. In order to get closer to the project aim, additional cooling experiments in the testing machine with insulated samples are planned, so that the proportion of the heat dissipation via the steel plates can also be considered separately. Knowledge of the temperature release capacity in tests up to 100 °C would also make it possible to add temperature-related heat released to the heating rate curves and to represent the realistically generated temperature at the heating speeds then reached. Furthermore, an extensive investigation of the concrete compressive strength of HPC and UHPC under the influence of temperatures in the range of the achieved test temperatures is currently being carried out.


