Article

Failure Warning at the End of Service-Life of Lead–Acid Batteries for Backup Applications

1
College of Electrical Engineering, Zhejiang University, Hangzhou 310027, China
2
Zhejiang Narada Power Source Co., Ltd., Hangzhou 310030, China
*
Author to whom correspondence should be addressed.
Appl. Sci. 2020, 10(17), 5760; https://doi.org/10.3390/app10175760
Submission received: 12 July 2020 / Revised: 9 August 2020 / Accepted: 19 August 2020 / Published: 20 August 2020
(This article belongs to the Section Electrical, Electronics and Communications Engineering)

Abstract

:

Featured Application

Battery management system design on failure warning at the end of remaining useful life.

Abstract

The prediction of remaining useful life is an important function of battery management systems. Existing research typically focused on factors that determine the quantity of the remaining useful capacity, and are able to determine the remaining useful capacity several years before battery failure to counter hysteresis of variables of lead–acid batteries. These techniques are not suitable at the end of service-life for backup batteries. This paper proposes a linear-superposition–voltage-aging model with three improvements. First, the estimation of the deep-discharge of the proposed voltage model does not require the remaining useful capacity. Second, the internal resistance of the deep-discharge is predicted from the contacting resistance of electrochemical impedance spectroscopy. Third, a morphology correction factor of internal resistance is about to saturate at the end of battery service-life. The model accurately forecasts battery failure at the end of service-life in two groups of accelerated-aging experiments. The proposed method in this paper focuses on the factors that determine quality of remaining useful capacity to counter hysteresis of variables of lead–acid batteries and judge battery failure at the end of service-life.

1. Introduction

Lead–acid batteries are widely accepted across industries, and commonly used as clean-energy storage, in automotive vehicles, and as standby and emergency power supplies [1,2]. The estimation of remaining service-life is an important output of battery management systems (BMS) [3,4] and failure warning of BMS is direct instruction for battery replacement. Nonlinear electrical passive load samplings and intensive deep-discharge recycles, in vehicle and photovoltaic systems, are not applied in backup application. Only periodical deep-discharges and active samplings of electrochemical impedance spectroscopy (EIS) are allowed in backup applications.
The remaining useful capacity can be directly calculated in deep-discharge curves using the voltage model [5,6]. However, in typical voltage models, such as Shepherd [7], CIEMAT [8,9] and Monegon [10], the remaining useful capacity itself is one of the parameters. The interpretation of polynomials and nonlinear functions of deep-discharge curves needs brute-force numeric efforts, including generic [11,12,13] and artificial neural-network [14] intelligent algorithms. The remaining useful capacity can also be directly calculated with floating service time by the linear Kalman filter, but the turning point from stability to deterioration is required [15,16]. Moreover, intensive deep-discharge recycles are carried out to accumulate empirical data and provide typical coefficients for aging model [6].
The remaining and loss capacity are modeled to calculate the remaining useful capacity of lead–acid batteries. Remaining capacity is modeled by physical–chemical governing differential equations of lead–acid battery [4,17]. Loss capacity is modeled by various Ah throughput during specific operations deviating from the standard conditions [18,19]. The loss-capacity model basically consists of the voltage and aging model. The voltage model is decomposed into static and transient electrical equivalent circuits [19]. The aging model includes corrosion, gassing, acid stratification phenomena [18,19] and degradation of active material [20,21] equations.
The initial value of the parameters, sampling of terminal electrical variables and filtering of aging rates are core items of the (remaining and loss) capacity model. The initial value of the parameters are generally determined according to manufacturers’ datasheet [19] or calculated from an intelligent algorithm [4]. The terminal electrical variables of multiple states of charge are passively sampled from regular operation, such as in automobile and photovoltaic systems [3,4]. However, the sampling frequency should be high enough to achieve a nonlinear filtering effect. Active sampling of electrochemical impedance spectroscopy is alternative for long-term floating service backup batteries [22,23]. Recently, switch-mode power supply has been integrated with electrochemical impedance spectroscopy functions [24], and contacting resistance is a basic inspection item [25]. The parameters of the aging model are generally nonlinear and monotonic.
However, the aging rates of these parameters fluctuate during service life. In order to suppress fluctuations, researchers have proposed nonlinear filtering techniques such as particle filter [3], Kalman filter [26] and Bayesian approach [27]. In ideal theory, the physical and electrochemical variables of lead–acid batteries continue to increase (decrease) in the direction of deterioration during service life operation. However, battery variables fluctuate during aging tests and field operations. Some fluctuation is so much in the counter deterioration direction that a hysteresis phenomenon appears. Hysteresis includes two parts: the beginning part is that variables significantly change or hold up in the opposite direction of degradation; the following part is that variables rapidly change in the positive direction of degradation. The main reason for hysteresis is the nature of complicated nonlinear system dynamics of lead–acid batteries [28].
Nonlinear filters accurately predict remaining useful life about 4–5 years before end of service-life [3,29]. This counters a battery’s hysteresis, but these results are too far in the future to be useful for battery replacement in practice. Prediction generally assumes that aging rates are continuous during the remaining years. Nonlinear hysteresis of the remaining capacity brings fluctuations and uncertainty of battery-replacement decision when approaching the end of service-life. If some aging parameters will soon saturate near the end of service-life, aging models can alert of impending battery failure according to the saturation to counter terminal hysteresis characteristics. In this paper, the morphology correction factor has similar saturation characteristic.
As early as 1970s, researchers have [30,31] proposed that a basic characteristic of lead–acid batteries is that the main reaction surface area of porous electrodes clearly reduces with a decrease of charge state. This feature is parameterized by a morphology correction factor that has been gradually developed by recent literatures [32,33]. Variation of main reaction surface area of porous electrode is greater under the deep lower state of charge than under middle or the full state of charge. The morphology correction factor of porous electrodes clearly significantly increases charge-transfer resistance under deep lower state of charge. According to the Tafel law, under middle- or full-state of charge, charge-transfer resistance reduces with increased discharge current. Based on morphologic correction phenomena and the Tafel law of porous electrodes, this paper improves the linear-aging model.
This paper proposes a linear superposition-voltage aging model to analyze and predict deep-discharging curves for lead–acid batteries. The linear-aging model is focused on backup battery failure at the end of service-life. First, the model reduces circuit order by replacing the two charge-transfer and one contacting resistances with only one internal resistance, according to the morphology-correction phenomenon. Second, the model obtains initial value of the morphology correction factor through interactive analysis between an equivalent (Thevenin) circuit and a mathematical (CIEMAT) model. Third, the model predicts the internal resistance of deep-discharge from the contacting resistance of EIS. Fourth, the model estimates battery failure mainly according to saturation of the morphology correction factor. Accelerated aging experiments show that the proposed model is effective in deep-discharging curve analysis and accurate for backup battery failure warning-failure warnings.
This paper is organized as follows: in Section 2, a linear-superposition–voltage-aging model based on morphology-correction phenomenon of internal resistance are demonstrated; in Section 3, fitting errors of deep-discharge curves and battery-failure warnings of accelerated aging tests are presented and discussed. Physical and chemical meanings of various Parameters in following sections are summarized in Table A1 of Appendix A.

2. Linear Superposition-Voltage Aging Model

2.1. Morphology Correction Factor of Battery Internal Resistance

Figure 1a is a typical DC-equivalent circuit model of a lead–acid battery [32,33]. The open-circuit voltage ( V OCP ) is the initial voltage of electrolyte bulk capacitor ( c bulk ). The charge-transfer resistances ( R ct , pd   R ct , nd ) of discharge are functions of the electrode utilization coefficients (EUC) and morphology correction factors ( ξ ) [32,33]. In Equation (1), EUC is the remaining state of charge (SOC), subtracted from unit one. The Q i is capacity of discharge and AHo is rated design capacity (560 Ah). The ξ is power index of EUC in Equations (2) and (3). Both r ct , p and r ct , n are charge-transfer resistances of the full state of charge and are calculated according to Tafel law [34].
This paper proposes that battery contacting resistance ( R C ) and internal resistance ( R Ω ) also appear as morphology correction phenomena. Equation (4) represents the discharging surface area ( a e , d ) [35,36] of the electrode surface area ( a e ). The a e , d is physical contact area between the charge-transfer and contacting resistances. The discharge current passes through the contacting resistance with the same area ( a e , d ). Hence, the morphology-correction phenomenon appears on contacting resistance and is the physical basis upon which existing research [22] estimates battery state of charge by contacting resistance. In Equation (5), r C is contacting resistance of the full state of charge.
Internal resistance consists of contacting and charge-transfer resistances in series connection. Both contacting and charge-transfer resistances lead internal resistance with morphology correction phenomena as per Equation (6). The r Ω is internal resistance of the full state of charge and is defined as the sum of the contacting and charge-transfer resistances of the full state of charge. Reference electrode is necessary to check morphology correction factor of individual electrode, but reference electrode is not available in commercial lead–acid batteries. Equation (6) roughly defines a morphology correction factor ( ξ Ω ). According to the morphology-correction phenomenon, the proposed Thevenin model replaces two charge-transfer resistances and one contacting resistance with one internal resistance to reduce the circuit order. The proposed Thevenin model is presented in Equation (7) and Figure 1b. The V ti is battery terminal voltage of SOCi and I is the discharging current.
EUC i   =   1 SOC i   =   Q i Ah o ,   i   =   0 , 1 , 2 , j .
R ct , pd   =   r ct , p 1 EUC i ξ p
R ct , nd   =   r ct , n 1 EUC i ξ n
a e , d   =   a e ( 1 EUC i ξ )
R C   =   r C 1 EUC i ξ C
R Ω   =   r Ω 1 EUC i ξ Ω ,   r Ω   =   r C   +   r ct , p   +   r ct , n
V ti = V OCP   Ah o EUC i c bulk I ( r Ω 1 EUC i ξ Ω )

2.2. Analysis of Deep-Discharge Curve by Linear Superposition

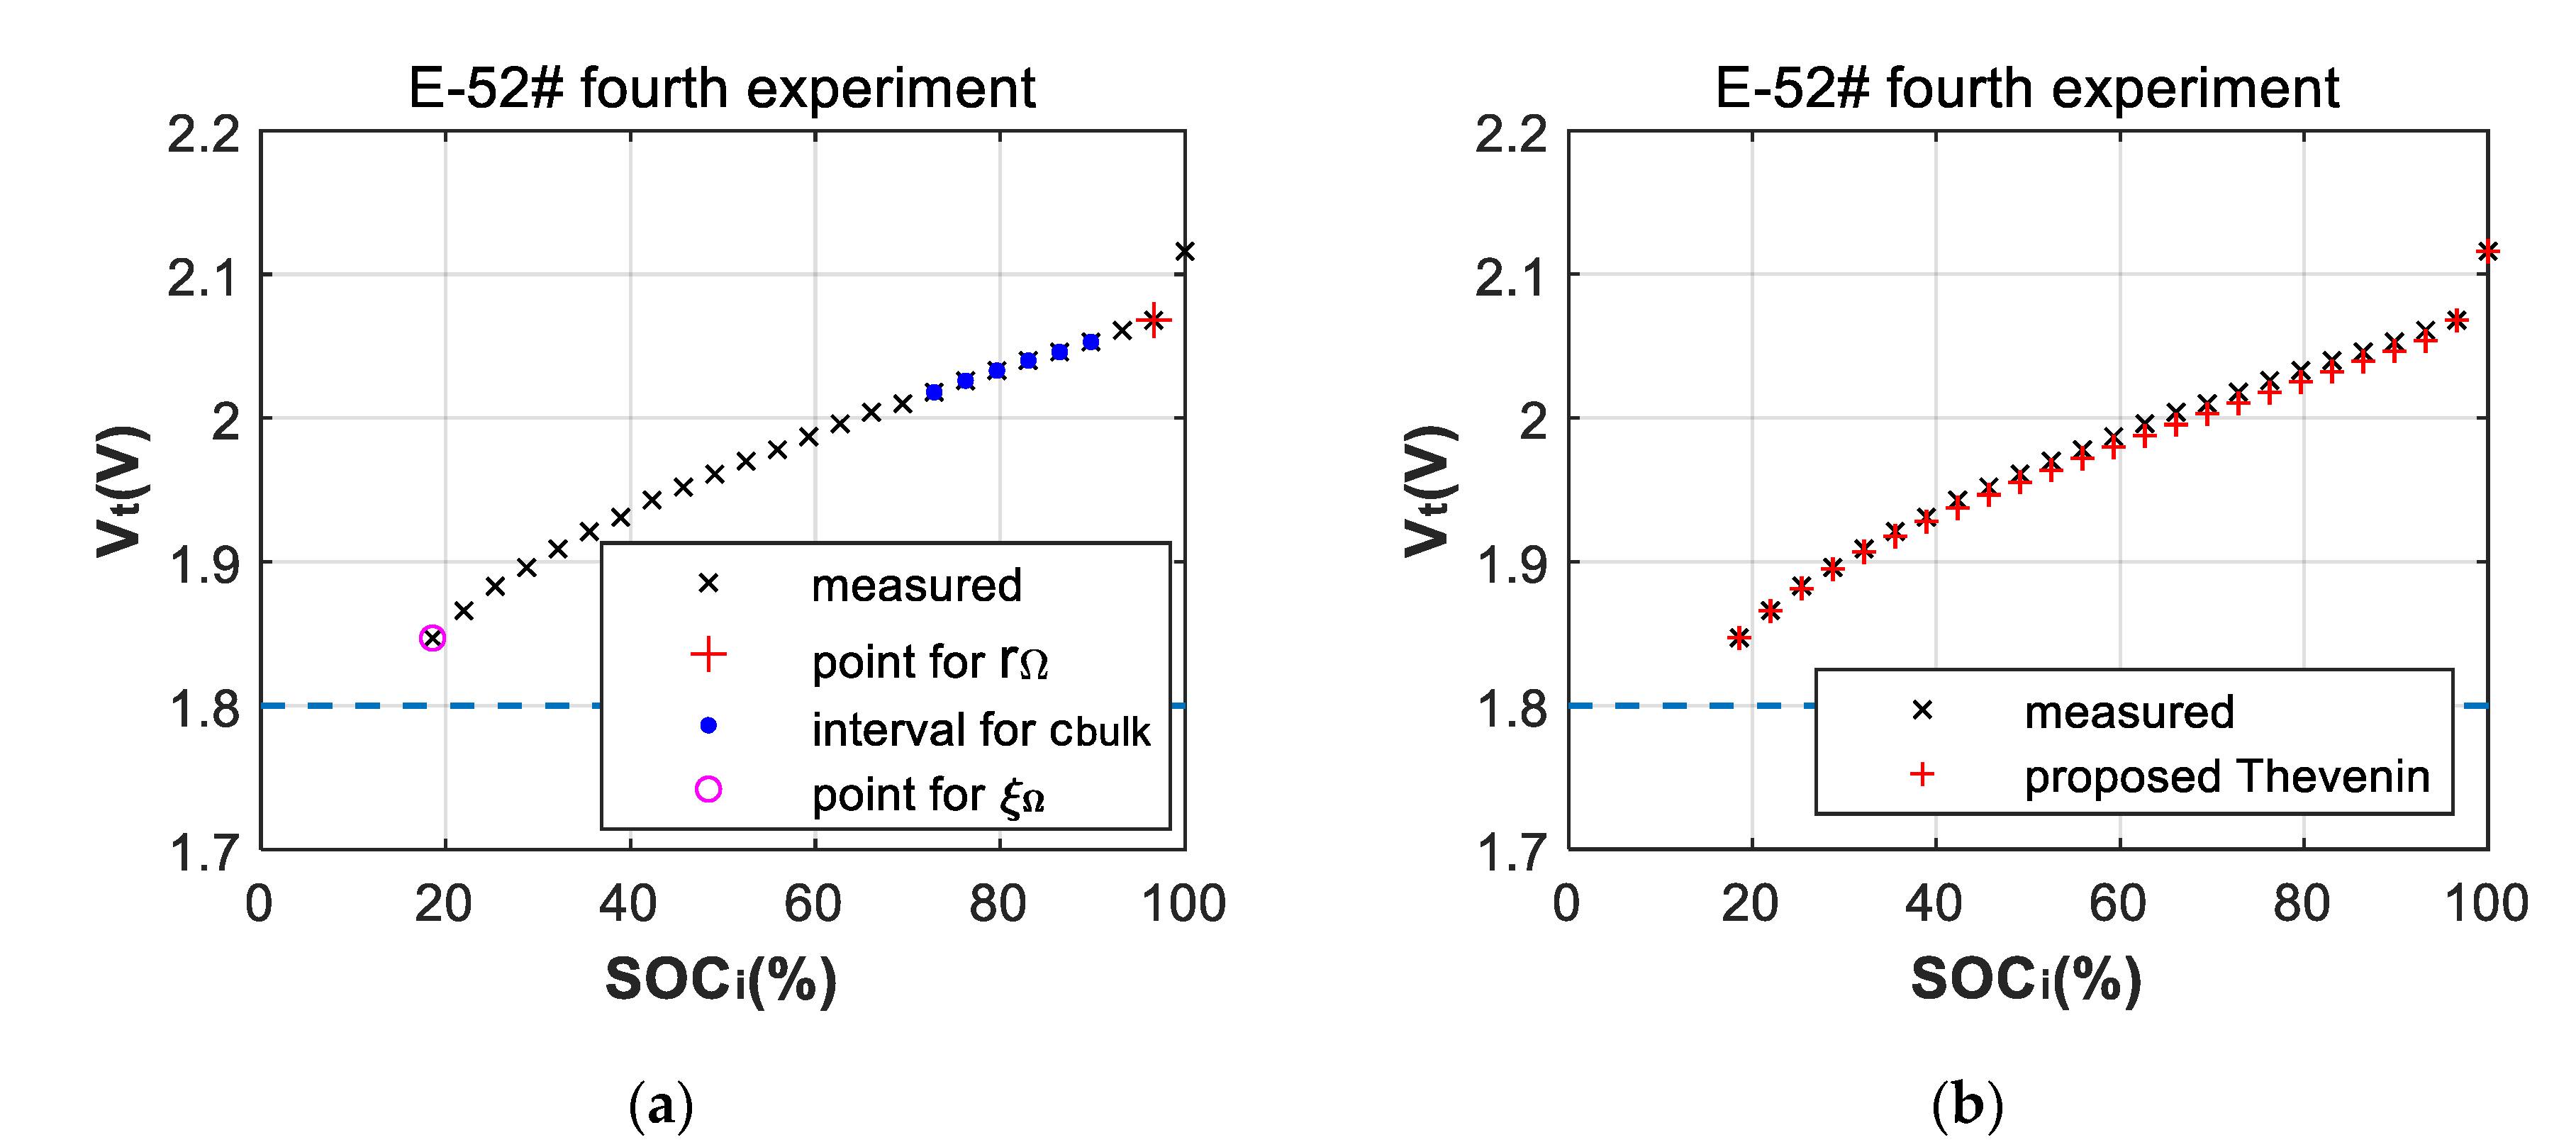
The principle of linear superposition was used to sequentially calculate parameters of the Thevenin circuit model. First, the open-circuit voltage was read from the terminal ports before discharge as per Equation (8). Second, r Ω was calculated at the first discharge point as per Equation (9). Third, c bulk was averaged among the electrode utilization coefficient interval of [0.1, 0.3] as per Equation (10). In Equation (10), internal resistance was approximated with r Ω and influence of morphology correction was ignored. Fourth, while terminal voltage ( V tj ) was approaching the end of the voltage (1.80 V), ξ Ω was calculated by Equation (11). If there were many samples around 1.80 V, ξ Ω could be calculated by least square method. Figure 2a marks points cited by above algorithm. In the figure of the deep-discharge curve, the horizontal axis is the rated state of charge and the vertical axis is the terminal voltage. Figure 2b plots the fitting curve of the proposed Thevenin model.
V OCP   =   c bulk ( t 0 )
r Ω     r Ω 1 EUC 1 ξ Ω | EUC     0   =   V OCP     V t 1 I | Q     0
c bulk   =   1 ( l m ) i = m l Ah o EUC i V OCP     V ti     Ir Ω ,   EUC m   =   0.1 ,   EUC L   =   0.3
ξ Ω   =   ln ( 1     Ir Ω V OCP     V tj     Q j c bulk ) ln EUC j ,   lim V tj   =   1.80   V

2.3. Interactive Analysis of Internal Resistance of Discontinuous Current

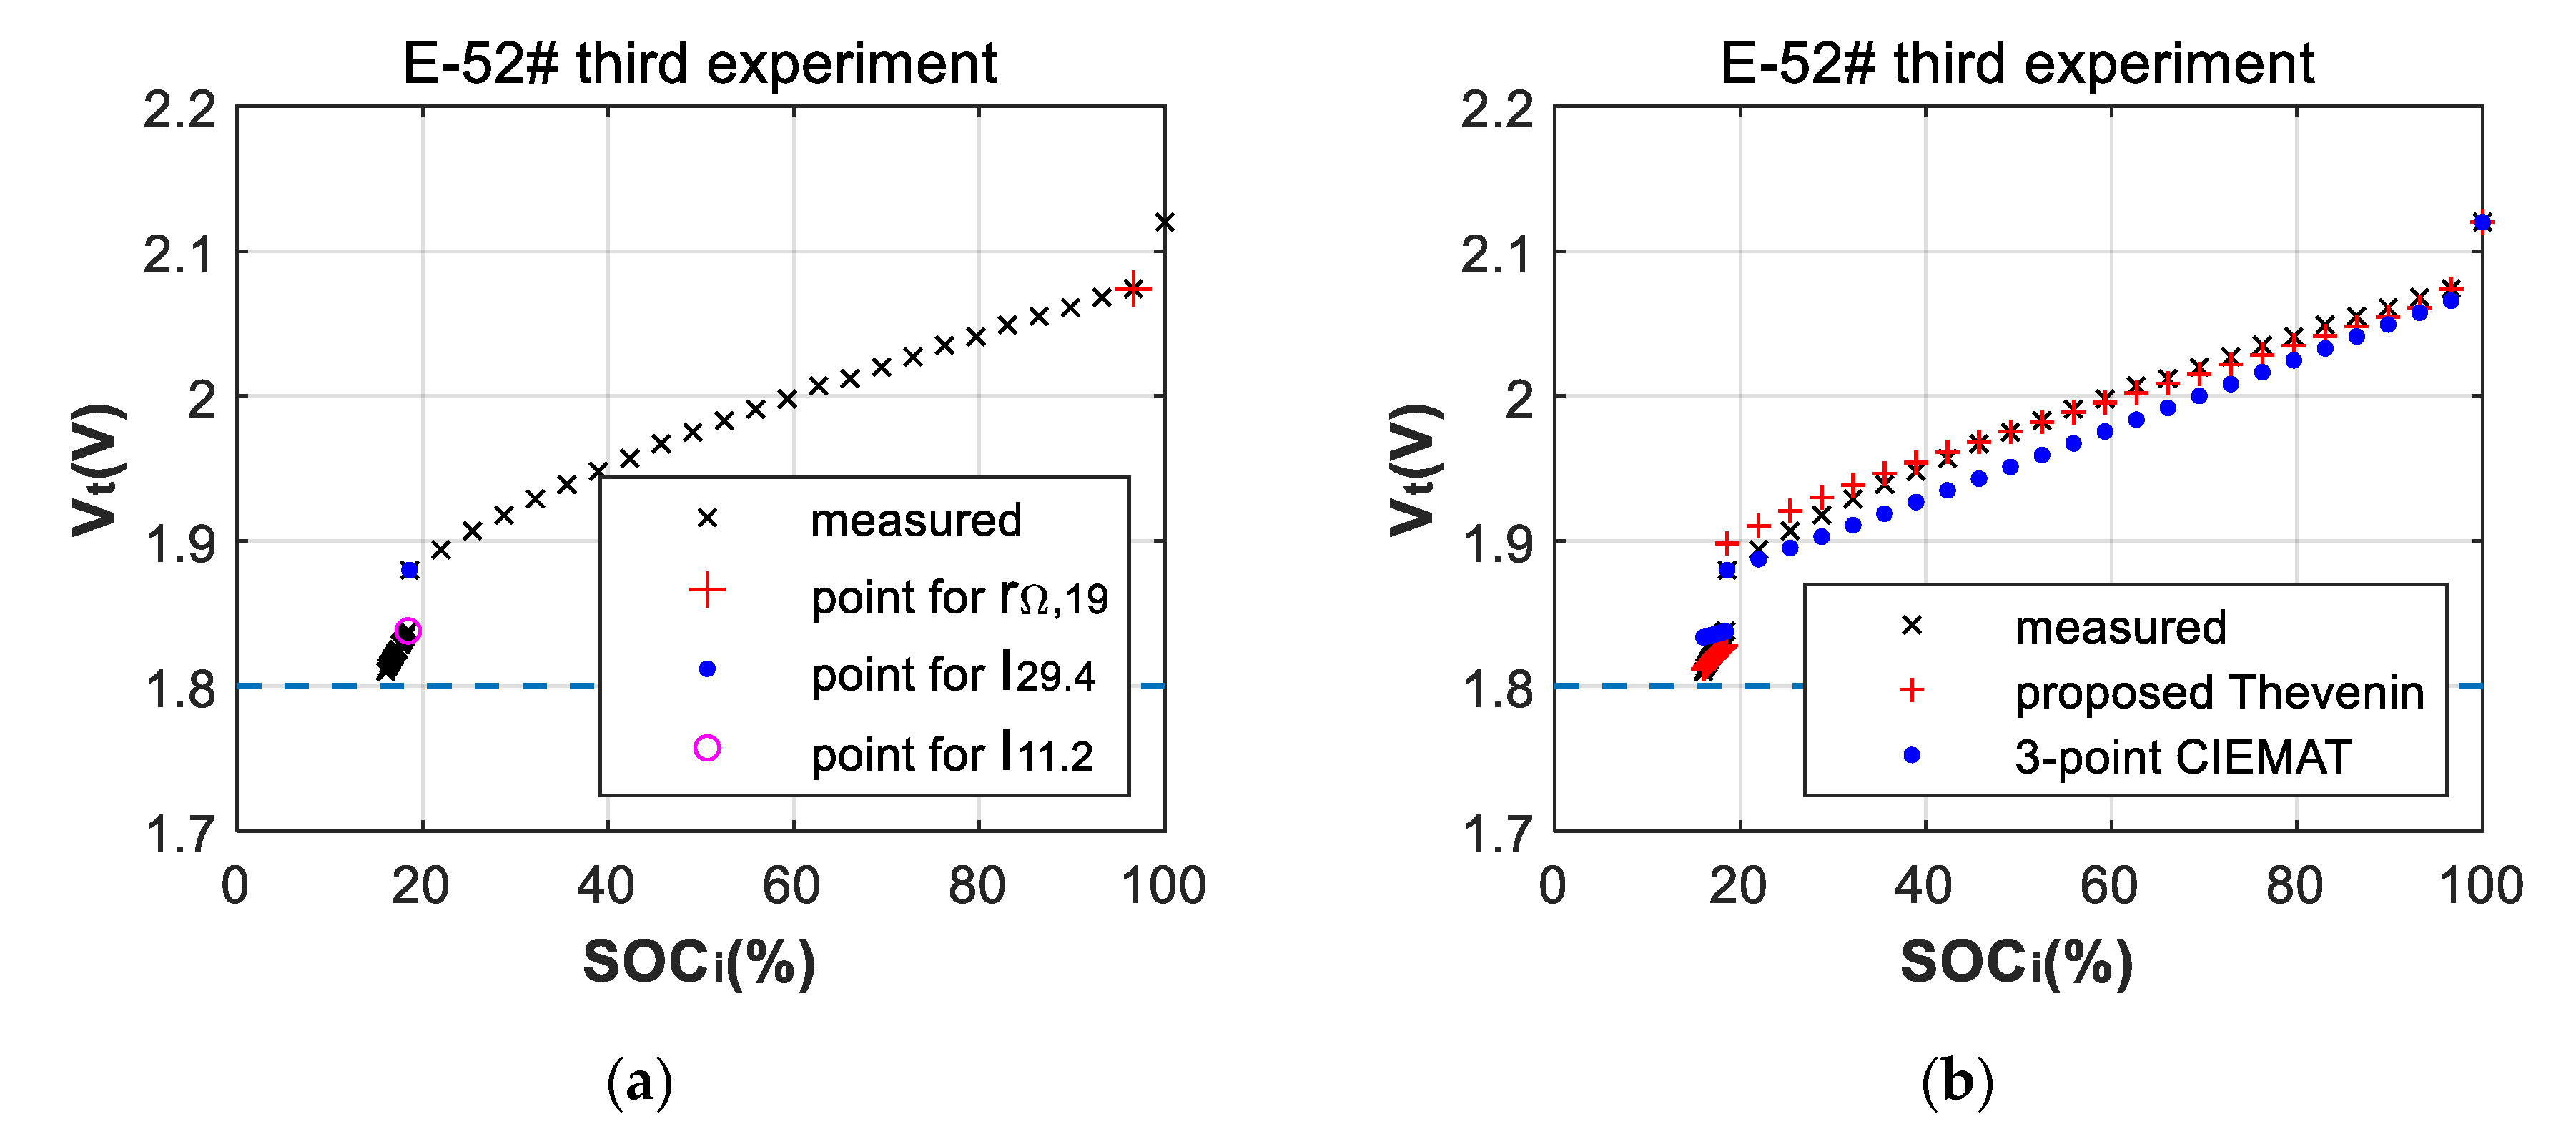
In the proposed Thevenin model, r Ω depends on rated load discharge current (19 A). However, discharge current abruptly changes from 19 A to 50 A in some experiments, such as Figure 3a. The charge-transfer resistance decreases due to Tafel law [34]. Contacting resistance increases with current density increasement. At the beginning of deep-discharge, r Ω , 19 of 19 A discharge current is extracted. At the end of discharging curve, r Ω , 50 of 50 A discharge current is hard to be extracted from Thevenin model.
The CIEMAT model can extract r Ω , 50 of 50-A discharge current. The parameters of the original CIEMAT model are fixed [8,9] as per Equation (12). This study proposes to loosen four parameters (VOCP, a1, a2 and a3) of CIEMAT model as per Equation (13). Deep-discharge experiments were carried out at room temperature, so that ∆T is ignored. Equations (14) to (15) were identical to original CIEMAT model [8,9]. The C is remaining useful capacity. The I10 discharges rated battery capacity (C10 = 560 Ah) for 10 h.
Equations (16) and (17) are terminal voltages before and after discontinuous current ( I 11.2 = 50   A ,   I 29.4 = 19   A ). These two equations and Equation (18) are combined as a set of linear equations to calculate parameters (a1, a2 and a3). With a1, a2 and a3, CIEMAT model extracts r Ω , 50 as per Equation (19). We bring r Ω , 50 back into Equation (11) to calculate morphology correction factor. Figure 3a marks the points cited by above algorithm. Figure 3b plots fitting curve of proposed Thevenin and 3-point CIEMAT models.
V ti   =   ( 2.085 0.12 Q i C ) I C 10 ( 4 1 + I 1 / 3 + 0.27 ( 1 Q i / C T ) 1.5 + 0.02 ) ( 1 0.007 T )
V ti   =   ( V OCP a 1 Q i C ) I C 10 ( a 2 1 + I 1 / 3 + a 3 ( 1 Q i / C T ) 1.5 + 0.02 )
C = C T 1 + 0.67 ( I 29.4 I 10 ) 0.9
C T   =   1.67 C 10
V tm   =   ( V OCP a 1 Q n C ) I 29.4 C 10 ( a 2 1 + I 29.4 1 / 3   +   a 3 ( 1 Q n / C T ) 1.5 + 0.02 )
V t ( m + 1 )   =   ( V OCP a 1 Q ( n + 1 ) C ) I 11.2 C 10 ( a 2 1 + I 11.2 1 / 3   +   a 3 ( 1 Q ( n + 1 ) / C T ) 1.5 + 0.02 )
r Ω , 19     V OCP   V t 1 I 29.4 | Q 0     1 C 10 ( a 2 1 + I 29.4 1 3 + a 3 + 0.02 )
r Ω , 50     V OCP   V t 1 I 11.2 | Q 0     1 C 10 ( a 2 1 + I 11.2 1 3 + a 3 + 0.02 )

2.4. Linear Aging Filter of Internal Resistance Based on Contacting Resistance of EIS

The AC current of EIS was 5 A (rms) and the DC current of deep-discharge was 19 A. With the current density increasing from the EIS to deep-discharge, the charge-transfer resistance decreased according to Tafel law [34]. Tafel law was not active for contacting resistance, so that contacting resistance increased with current. Under the full state of charge, the increasing contacting resistance (rc) was more significant than the variation of charge-transfer resistance ( r ct , p , r ct , n ). The contacting resistance usually nonlinearly increased with battery corrosion [37]. The internal resistance also nonlinearly increased with battery corrosion [18]. The ratio ( α k ) between contacting ( r C , k ) and internal resistances ( r Ω , k ) is the linearized by least square method in Equation (20).
α k   =   [ r C , 1 r C , k ] \ [ r Ω , 1 r Ω , k ]
At least two sets of initial measurements were required to start the algorithm. The linear Kalman filter algorithm [16] was executed after each accelerated aging cycle. Implementation involves following steps:
Step 1. Initialization:
In Equation (21), α2 is the linear ratio between contacting and internal resistances of the beginning two measurements. In Equation (22), α1 is the linear ratio between contacting and internal resistances of the first measurement. In Equation (23), r ^ Ω , 1 and r ^ Ω , 2 are estimated internal resistances. In Equation (24), P 2 is the error covariance of estimation. In Equation (25), M Ω is the covariance matrix of measurement errors. In Equation (26), H Ω is the transformation matrix between measurement and state vector. The [ r Ω , k α k ] is state vector and [ r ^ Ω , 2 α ^ 2 ] is initializing as [ r Ω , 2 α 2 ] . In Equation (27), K 2 is the Kalman gain. In Equation (28), P 2 is the error covariance for updated estimation:
α 2   =   [ r C , 1 r C , 2 ] \ [ r Ω , 1 r Ω , 2 ]
α 1   =   r C , 1 \ r Ω , 1
[ r ^ Ω , 1 r ^ Ω , 2 ]   =   [ r C , 1 r C , 2 ] α 2
P 2   =   [ E { ( r Ω , 1 r ^ Ω , 1 ) 2 + ( r Ω , 2 r ^ Ω , 2 ) 2 } 0 0 E { ( α 2 α 2 + α 1 2 ) 2 } ]
M Ω   =   [ ( 10 5 ) 2 0 0 ( 10 1 ) 2 ]
H Ω   =   [ 1 0 0 1 ]
K 2   =   P 2 H Ω T [ H Ω P 2 H Ω T + M Ω ] 1
P 2   =   [ I K 2 H Ω ] P 2
Step 2. EIS Sampling and state prediction:
After EIS sampling, a new contacting resistance r C , k is obtained. In Equation (29), r C , k is the incremental contacting resistance. In Equation (30), Φ Ω , k is the state transition matrix. In Equation (31), r ^ Ω , k is prediction of aging internal resistance at the moment of EIS sampling, a ^ k is the same as a ^ ( k 1 ) . In Equation (32), P k is the error covariance for following estimation. In Equation (33), K k is updated before jumping to Step 3.
r C , k = r C , k r C , ( k 1 )
Φ Ω , k = [ 1 0 r C , k 1 ]
[ r ^ Ω , k α ^ k ] = Φ Ω , k [ r ^ Ω , ( k 1 ) α ^ ( k 1 ) ]
P k = Φ Ω , k P ( k 1 ) Φ Ω , k T
K k = P k H Ω T [ H Ω P k H Ω T + M Ω ] 1
Step 3. Updating the estimation with measurement of the deep-discharge:
After measurement of the deep-discharge, r Ω , k and α k is calculated in Equation (20). In Equation (34), state vector estimation ( r ^ Ω , k and α ^ k ) is updated with measurement ( r Ω , k and α k ). In Equation (35), P k is updated before jumping back to Step 2.
[ r ^ Ω , k α ^ k ] = [ r ^ Ω , k α ^ k ] + K k [ [ r Ω , k α k ] H Ω [ r ^ Ω , k α ^ k ] ]
P k = [ I K k H Ω ] P k
Step 4. Increment (k + 1) and go back to Step 2.
Until battery failure, the algorithm returns to Step 2. In this paper, the sampling interval between k and (k + 1) is limited by period of accelerated aging. However, in future applications, the sampling of EIS can be shorter than the deep-discharge counterpart.

2.5. Linear Aging Filter of Parameters to Counter Hysteresis

The accelerating aging is periodic and consistent in experiments. If the measured parameters ( V OCP , c bulk , ξ Ω ) appear hysteresis, then the aging rates are adjusted according to the higher value of the two beginning points in Equation (36). This guarantees the prediction to decrease at average rates. If the measured parameters ( V OCP , c bulk , ξ Ω ) do not appear hysteresis, the aging rates are adjusted according to the last value as a starting point in Equation (37). This guarantees the prediction to decline at the latest rates. Two aging rates are compared in Equation (38); the lower one is to be used in prediction:
x k   =   β k , 1 ( k o ) + x o ,   x o   =   max { x 1 , x 2 } ,   o   =   1   or   2 .
x k   =   β k , 2 · 1 + x ( k 1 )
β k   =   min { β k , 1 ,   β k , 2 }
Step 1. Initialization:
The initial value of the parameters ( V OCP , c bulk , ξ Ω ) requires three measurements because of bias points in Equations (36) and (37).
In Equation (39), β 3 is the linear aging rate between continuous three accelerated experiments, x o , 3 is bias point according to least square method. In Equation (40), β 2 is the linear aging rate between the beginning two accelerated experiments, x o , 2 is bias point according to least square method. In Equation (41), x ^ 1 , x ^ 2 and x ^ 3 are estimations of the parameters. In Equation (42), P 3 is the error covariance of estimation. In Equation (43), M x is the covariance matrix of measurement error. In Equation (44), H x is the transformation matrix between measurement and state vector. The [ x k β k ] is state vector and [ x ^ 3 β ^ 3 ] is initializing as [ x ^ 3 β 3 ] . In Equation (45), K 3 is the Kalman gain. In Equation (46), P 3 is the error covariance for updated estimation.
[ β 3 x o , 3 ]   = [ 1 2 3 1 1 1 ] \ [ x 1 x 2 x 3 ]
[ β 2 x o , 2 ]   = [ 1 2 1 1 ] \ [ x 1 x 2 ]
[ x ^ 1 x ^ 2 x ^ 3 ] = [ 1 2 3 1 1 1 ] [ β 3 x o , 3 ]
P x , 3 = [ E { ( x 1 x ^ 1 ) 2 + ( x 2 x ^ 2 ) 2 + ( x 3 x ^ 3 ) 2 } 0 0 E { ( β 3 β 3 + β 2 2 ) 2 } ]
M V OCP = [ ( 10 3 ) 2 0 0 ( 10 4 ) 2 ] ,   M c bulk = [ ( 10 4 ) 2 0 0 ( 10 2 ) 2 ] ,   M ξ Ω = [ ( 10 1 ) 2 0 0 ( 10 2 ) 2 ]
H x = [ 1 0 0 1 ]
K x , 3 = P x , 3 H x T [ H x P x , 3 H x T + M x ] 1
P 3 = [ I K 3 H x ] P 3
Step 2. State prediction:
In Equation (47), Φ x , k is the state transition matrix, to pass incremental aging round. In Equation (48), x ^ k is prediction of aging parameter at the moments of the next deep-discharge measurement, β ^ k is the same as β ^ ( k 1 ) . In Equation (49), P k is the error covariance for following estimation. In Equation (50), K k is updated before jumping to Step 3.
In Equation (51), prediction parameters ( V ^ OCP , k , c ^ bulk , k , ξ ^ Ω , k and r ^ Ω , k ) are applied to approximate E U ^ C j , k by table look-up method. E U ^ C j , k corresponds to the end of terminal voltage (1.80 V). If E U ^ C j , k is below 80%, filter loop is halted, and the battery is removed out of stack. The battery’s state of health can be further verified by deep-discharge and EIS:
Φ x , k   =   [ 1 0 1 1 ]
[ x ^ k β ^ k ]   =   Φ x , k [ x ^ ( k 1 ) β ^ ( k 1 ) ]
P x , k   =   Φ x , k P x , ( k 1 ) Φ x , k T
K x , k   =   P x , k H x T [ H x P x , k H x T + M x ] 1
1.80   =   V ^ OCP , k     Ah o E U ^ C j , k c ^ bulk , k     I 29.4 ( r ^ Ω , k 1 E U ^ C j , k ξ ^ Ω , k )
Step 3. Updating estimation with measurement of deep-discharge:
After measurement of deep-discharge, x k and β k is calculated in Equation (52). In Equation (53), state vector estimation ( x ^ k and β ^ k ) is updated with measurement ( x k and β k ). In Equation (54), P k is updated before jumping back to Step 2.
β k   =   min { x k x o k o , x k x ( k 1 ) 1 }
[ x ^ k β ^ k ]   =   [ x ^ k β ^ k ] + K k [ [ x k β k ] H x [ x ^ k β ^ k ] ]
P x , k   =   [ I K x , k H x ] P x , k
Step 4. Increment (k + 1) and go back to Step 2.
Until battery failure, algorithm returns to Step 2. In filtering loop, sampling interval between k and (k + 1) is limited by accelerated aging period.

2.6. Linear Aging Model of Quantity of Remaining Useful Capacity

As a comparison, the prediction of quantity of remaining useful capacity was modeled the same as variables in Section 2.5. In Equation (55), M capacity is the covariance matrix of measurement error. In Equation (56), H capacity is the transformation matrix between measurement and state vector:
M capacity   = [ 1 2 0 0 1 2 ]
H capacity = [ 1 0 0 1 ]

3. Results and Discussion

3.1. Accelerated Aging Experiments

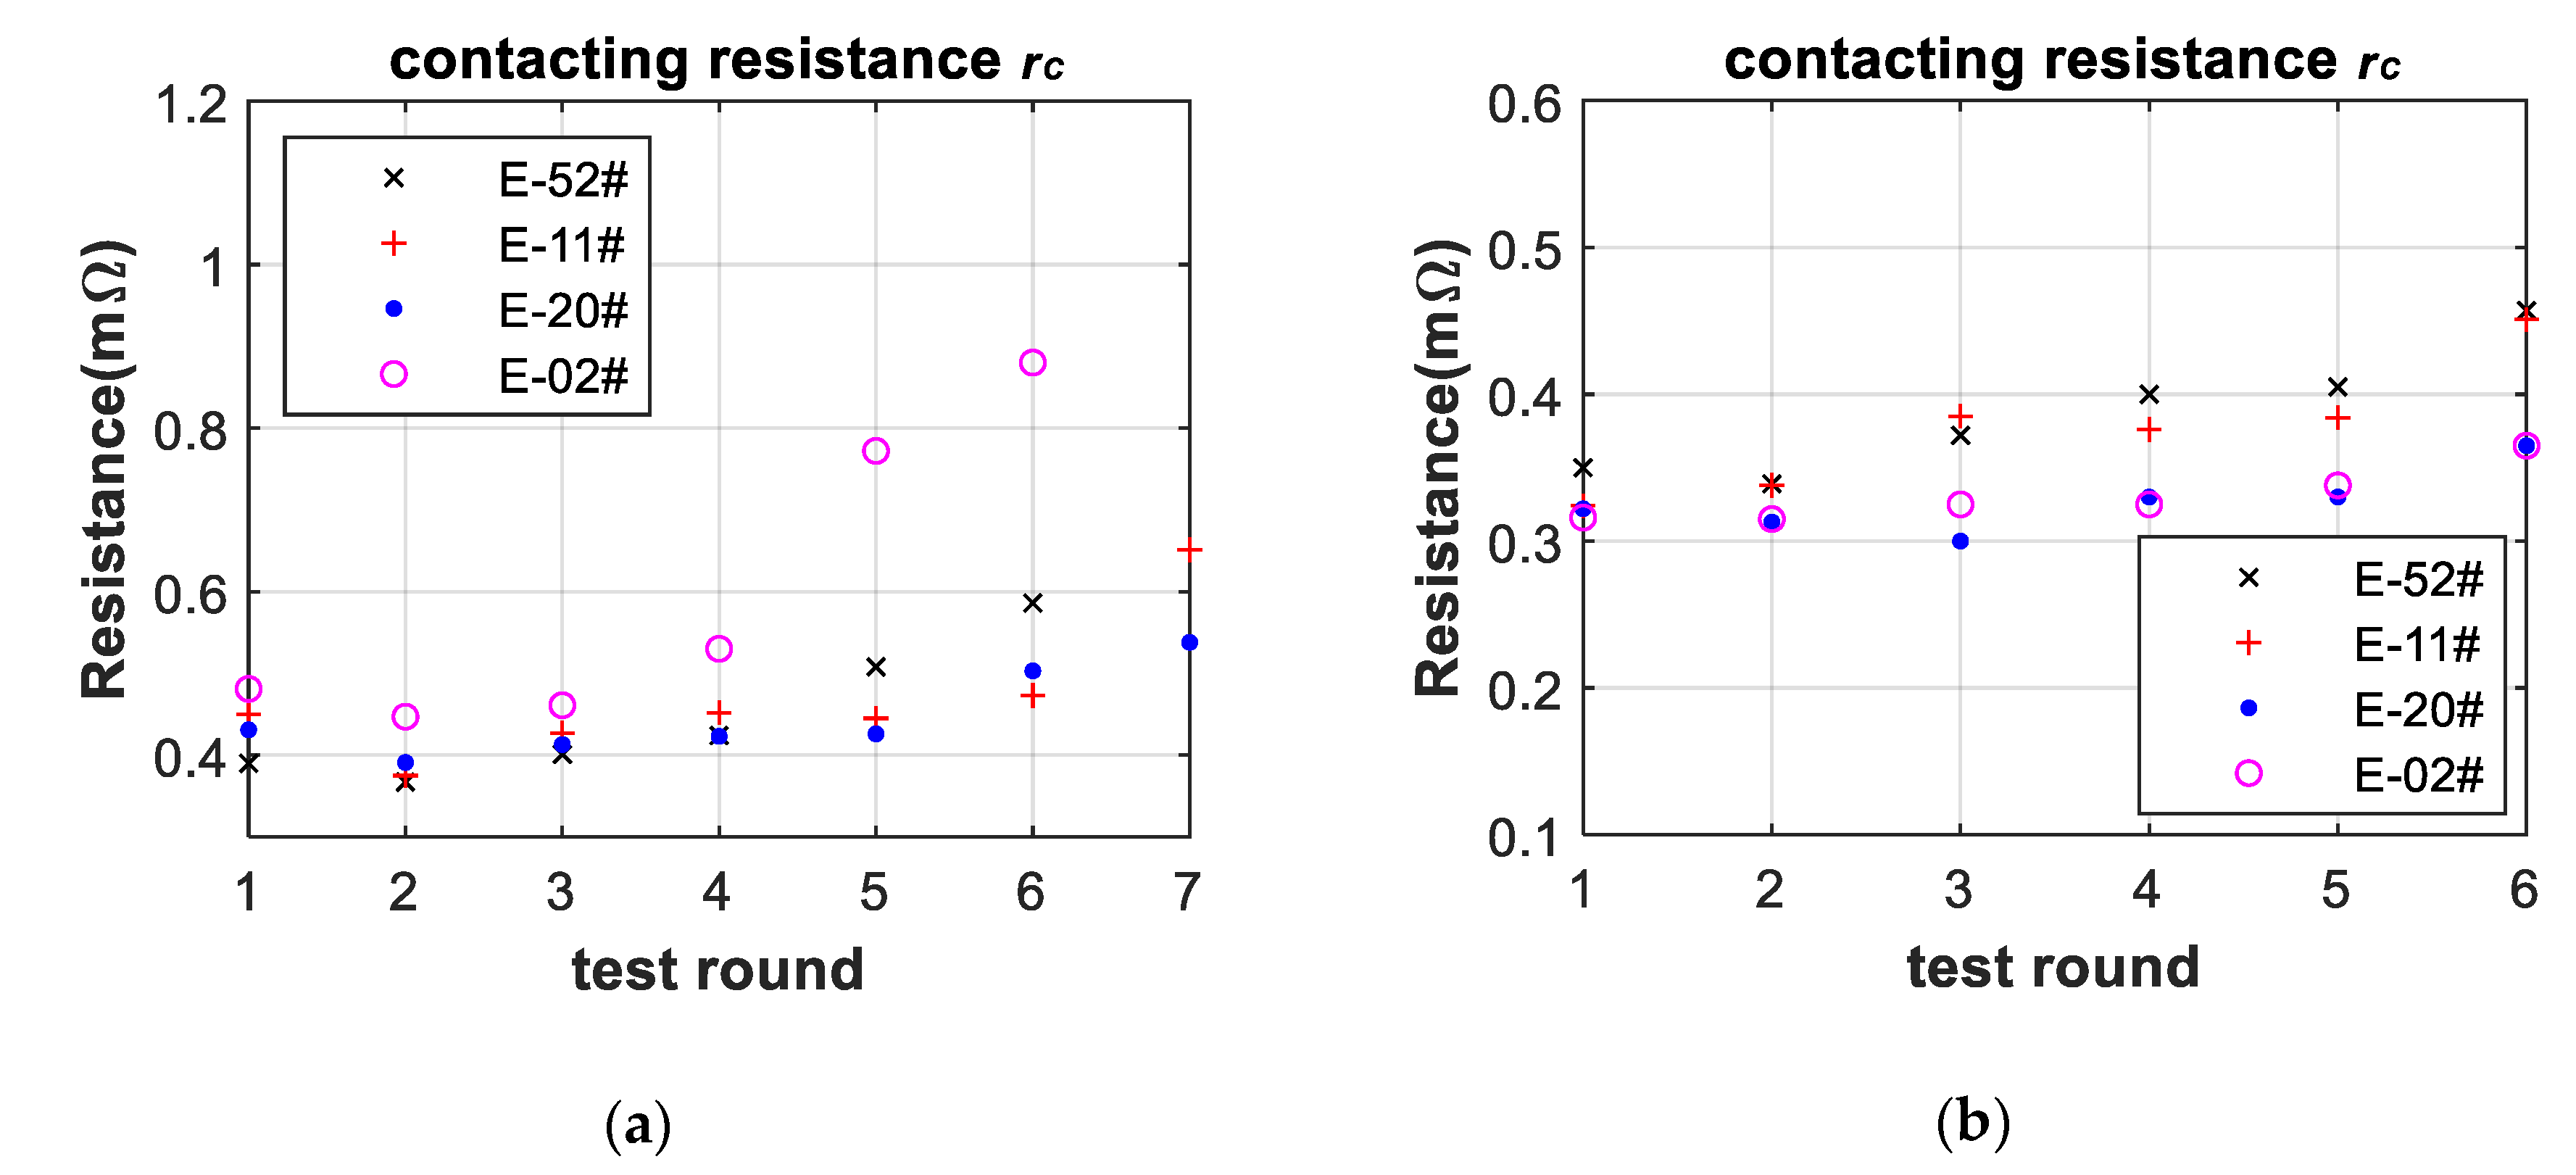
Four parallel samples were float-charged at 70 °C for nearly seven months. Moreover, another four parallel samples were float-charged at 55 °C for nearly six months. After float charging in a high-temperature chamber for one month, all samples were deep-discharged for the remaining capacity and recharged back. More than 24 h later after recharging, all cells were individually sampled by EIS for contacting resistances of the full state of charge. Contacting resistances of parallel samples are presented in Figure 4.

3.2. Fitting Errors of Deep-Discharge Curves of 70 °C Aging Experiments

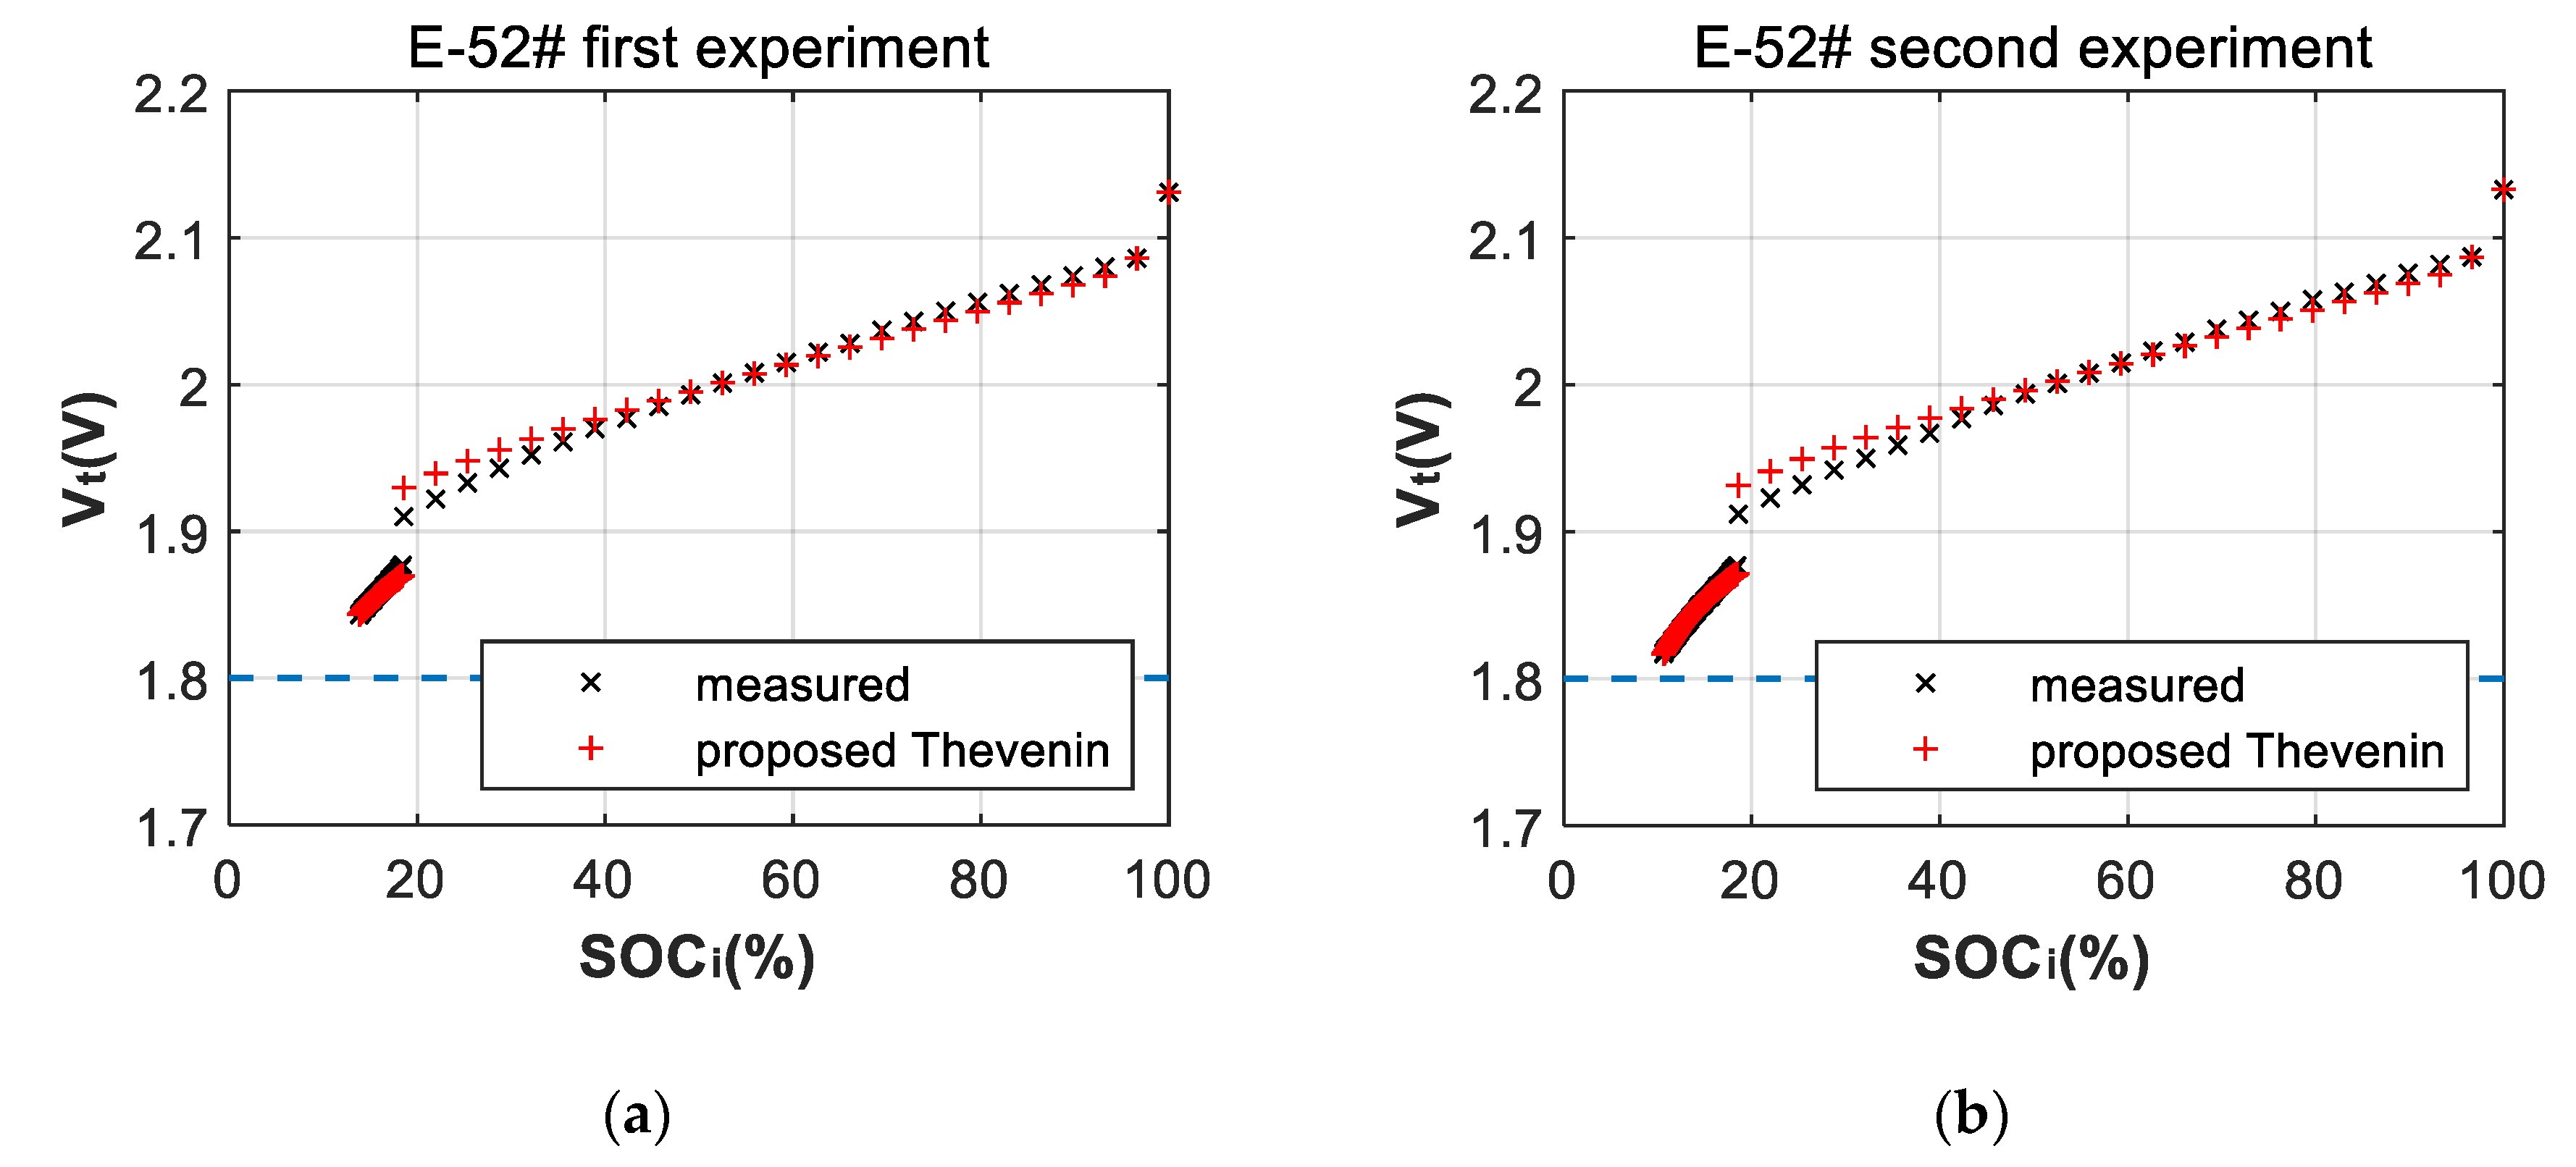
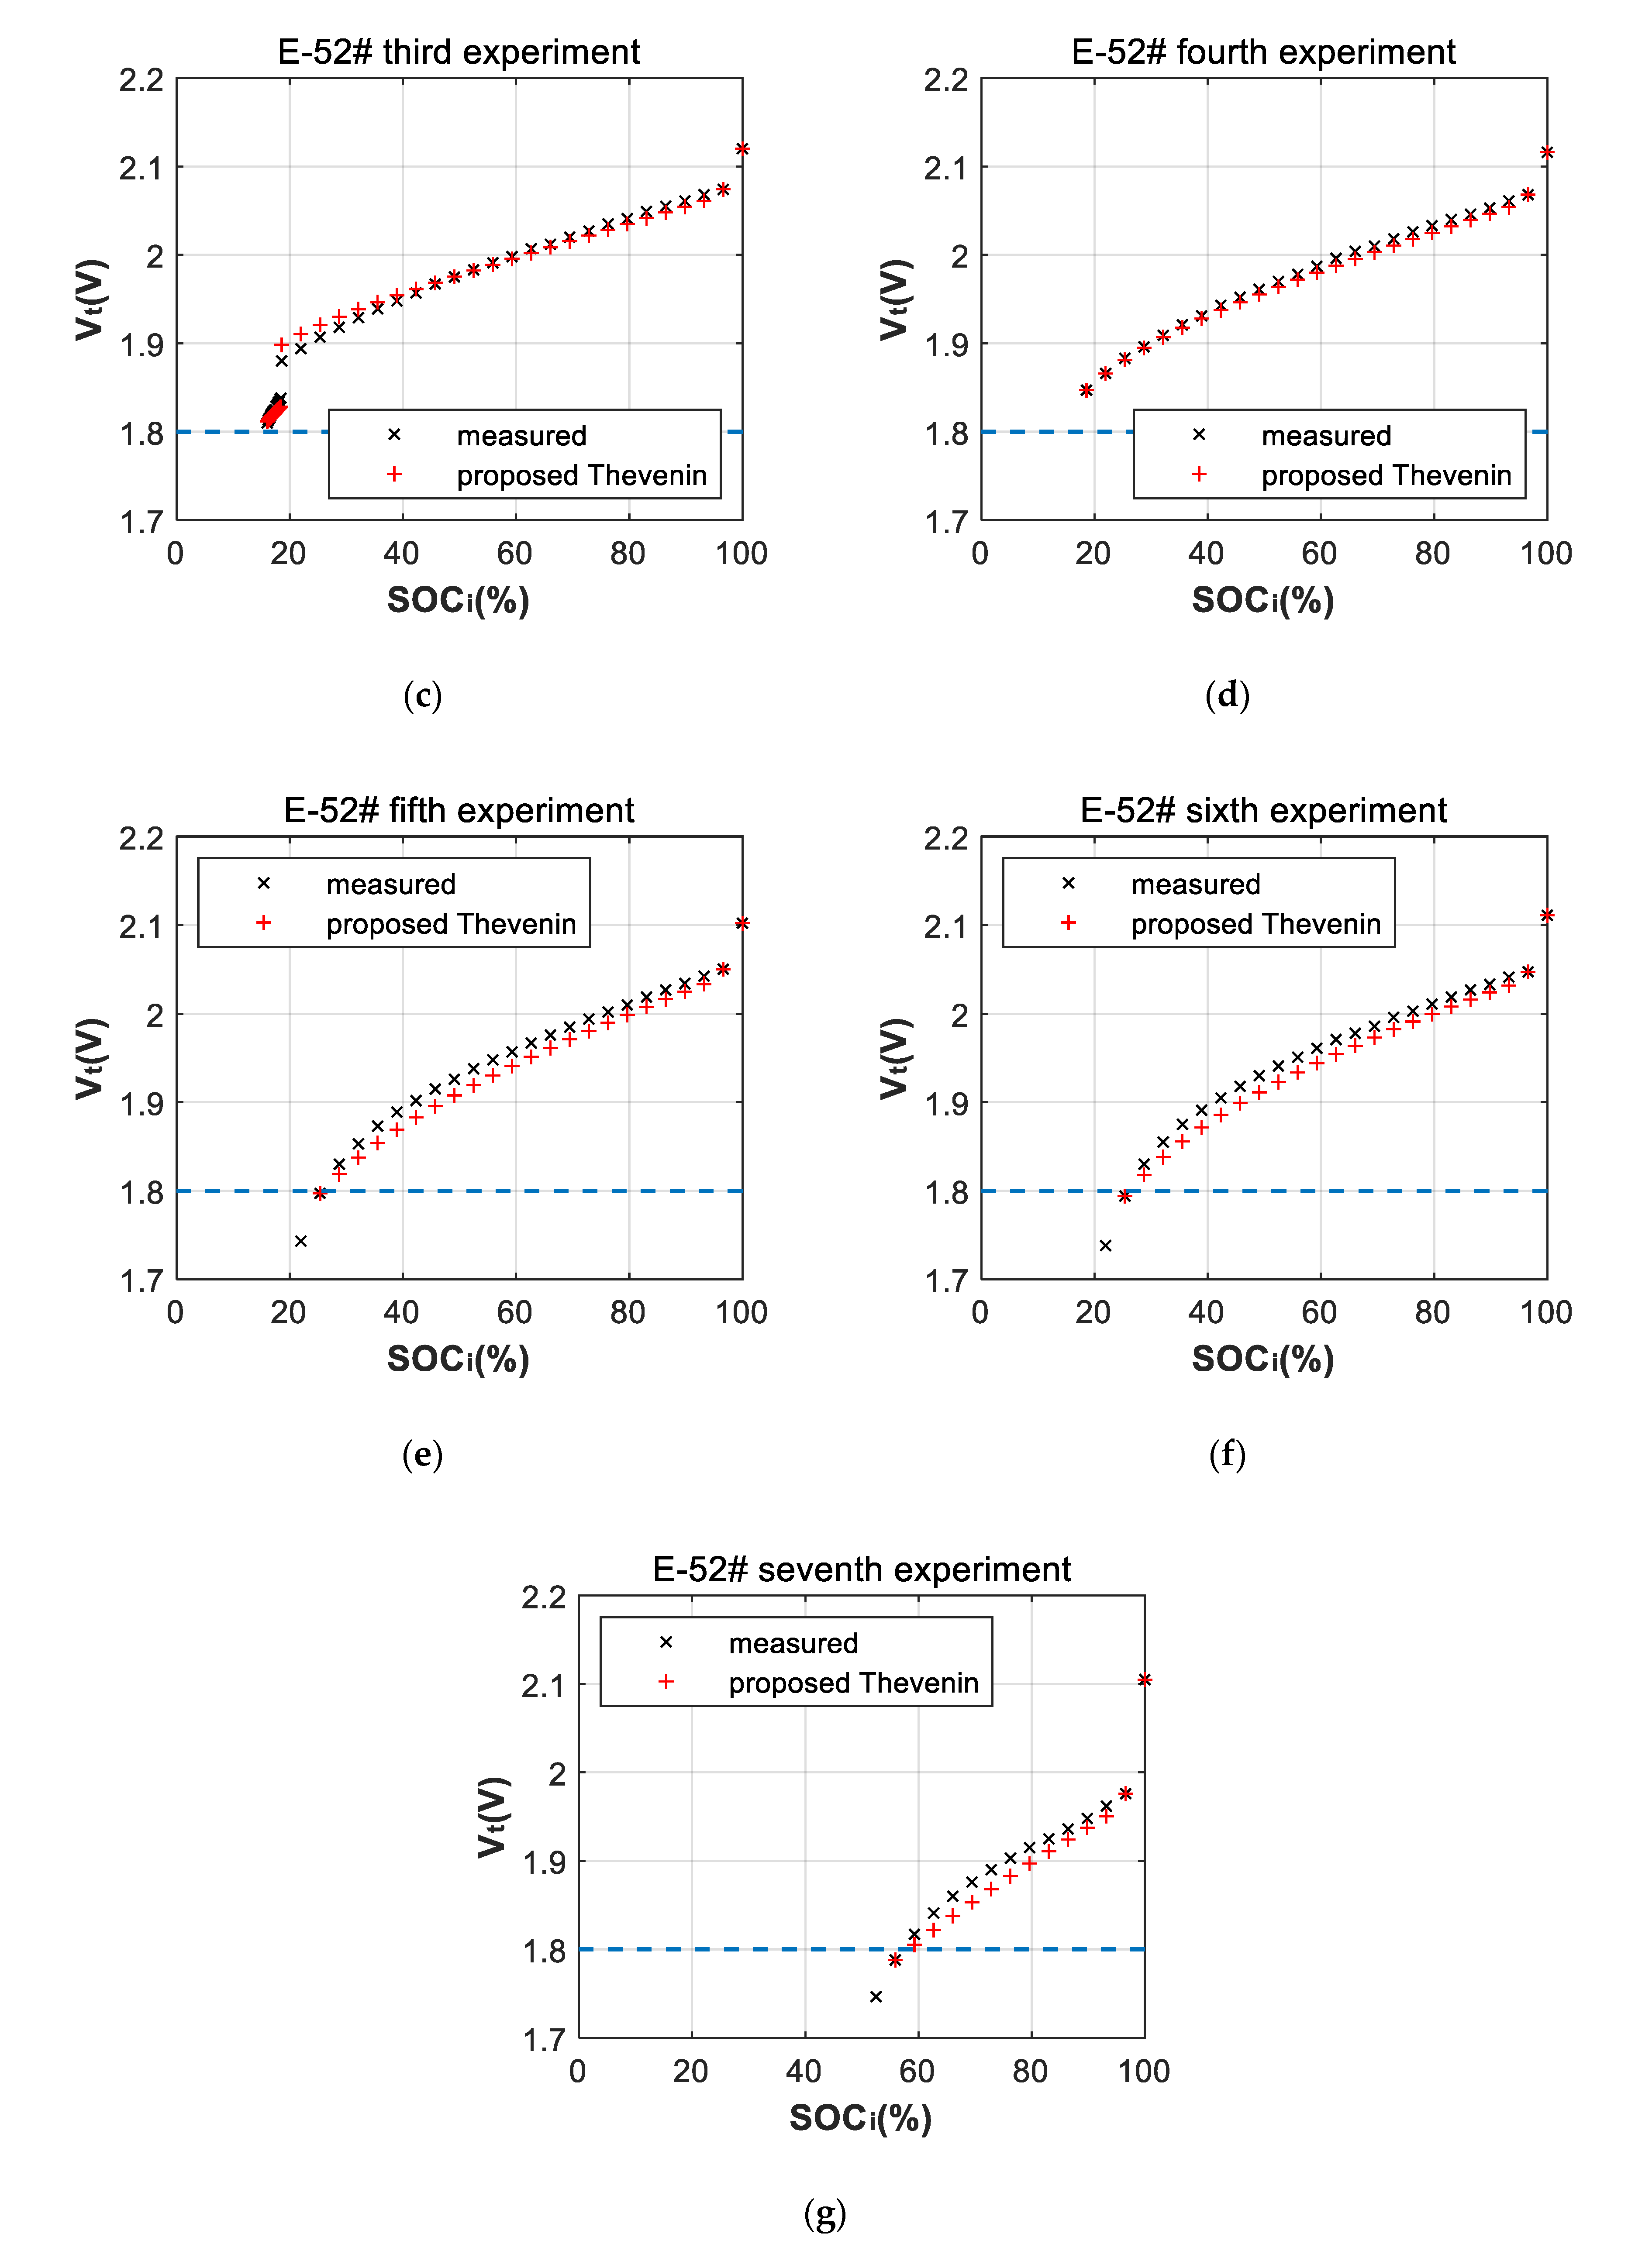
Due to space limitations, only discharge curves of No. E-52# cell is shown in Figure 5.
The mean biased error (MBE), root mean square error (RMSE) and correlation coefficient ( R 2 ) are shown in Table 1. Fitting effect proves that internal resistance has morphology-correction phenomenon. Capacity of seventh experiment of cell E-02# is only 38 Ah, and only three measurement points are above 1.80 V. Hence, data of this experiment is not shown in Table 1.

3.3. Battery-Failure Warning Results of the Proposed Linear Aging Model

Measurements and estimations of (quality and quantity) the remaining useful capacity of parallel samples are shown in Figure 6. Approximately 450 Ah as 80% of the rated design capacity (560 Ah) was set up as a red line of battery failure for the linear-aging model.
Hysteresis of measurement of the remaining capacity near 400 Ah appeared in the fifth and sixth tests of E-52#. The fifth and sixth tests of E-02# near 210 Ah also showed hysteresis. The value of the remaining capacity of E-20# continuously reduced during aging experiments.
During fifth to seventh tests, measurement of remaining useful capacity of E-11# around 450 Ah showed hysteresis. Prediction of quantity of the remaining capacity was according to model in Section 2.6. Prediction of the fifth test was very close to measured value which was above red line. The model carried out the sixth prediction and determined battery failure; however, the capacity verification confirmed that the measured remaining capacity was still above red line. The model adjusted its prediction of the seventh test with a result of 458 Ah. However, at this round, the measured remaining capacity (418 Ah) was below the red line. The model of Section 2.6 continuously showed a false alarm at the sixth test and missing the alarm at the seventh alarm. The missing alarm was a serious error of class-1E nuclear backup batteries. The hysteresis of the remaining useful capacity—especially at the end of battery service life—was an obvious difficult problem for the typical aging model.
The proposed linear-aging model accurately predicted the battery failures of E-52#, E-20# and E-02#. There were no false alarms at the fourth test, and no missing alarms at the fifth test. The proposed linear-aging model continued to present failure warnings for E-11# from the fifth to the seventh tests. E-11# presented saturation of the morphology correction factor from the fifth test. The proposed linear-aging model successfully predicted this saturation and the failure warning of E-11# at the fifth test was an effective alarm of the quality of the remaining capacity. This alarm should not be judged as a false alarm, although measurement of the remaining capacity was slightly more than the red line. The red line of measurement of the remaining capacity was average and was individually different.
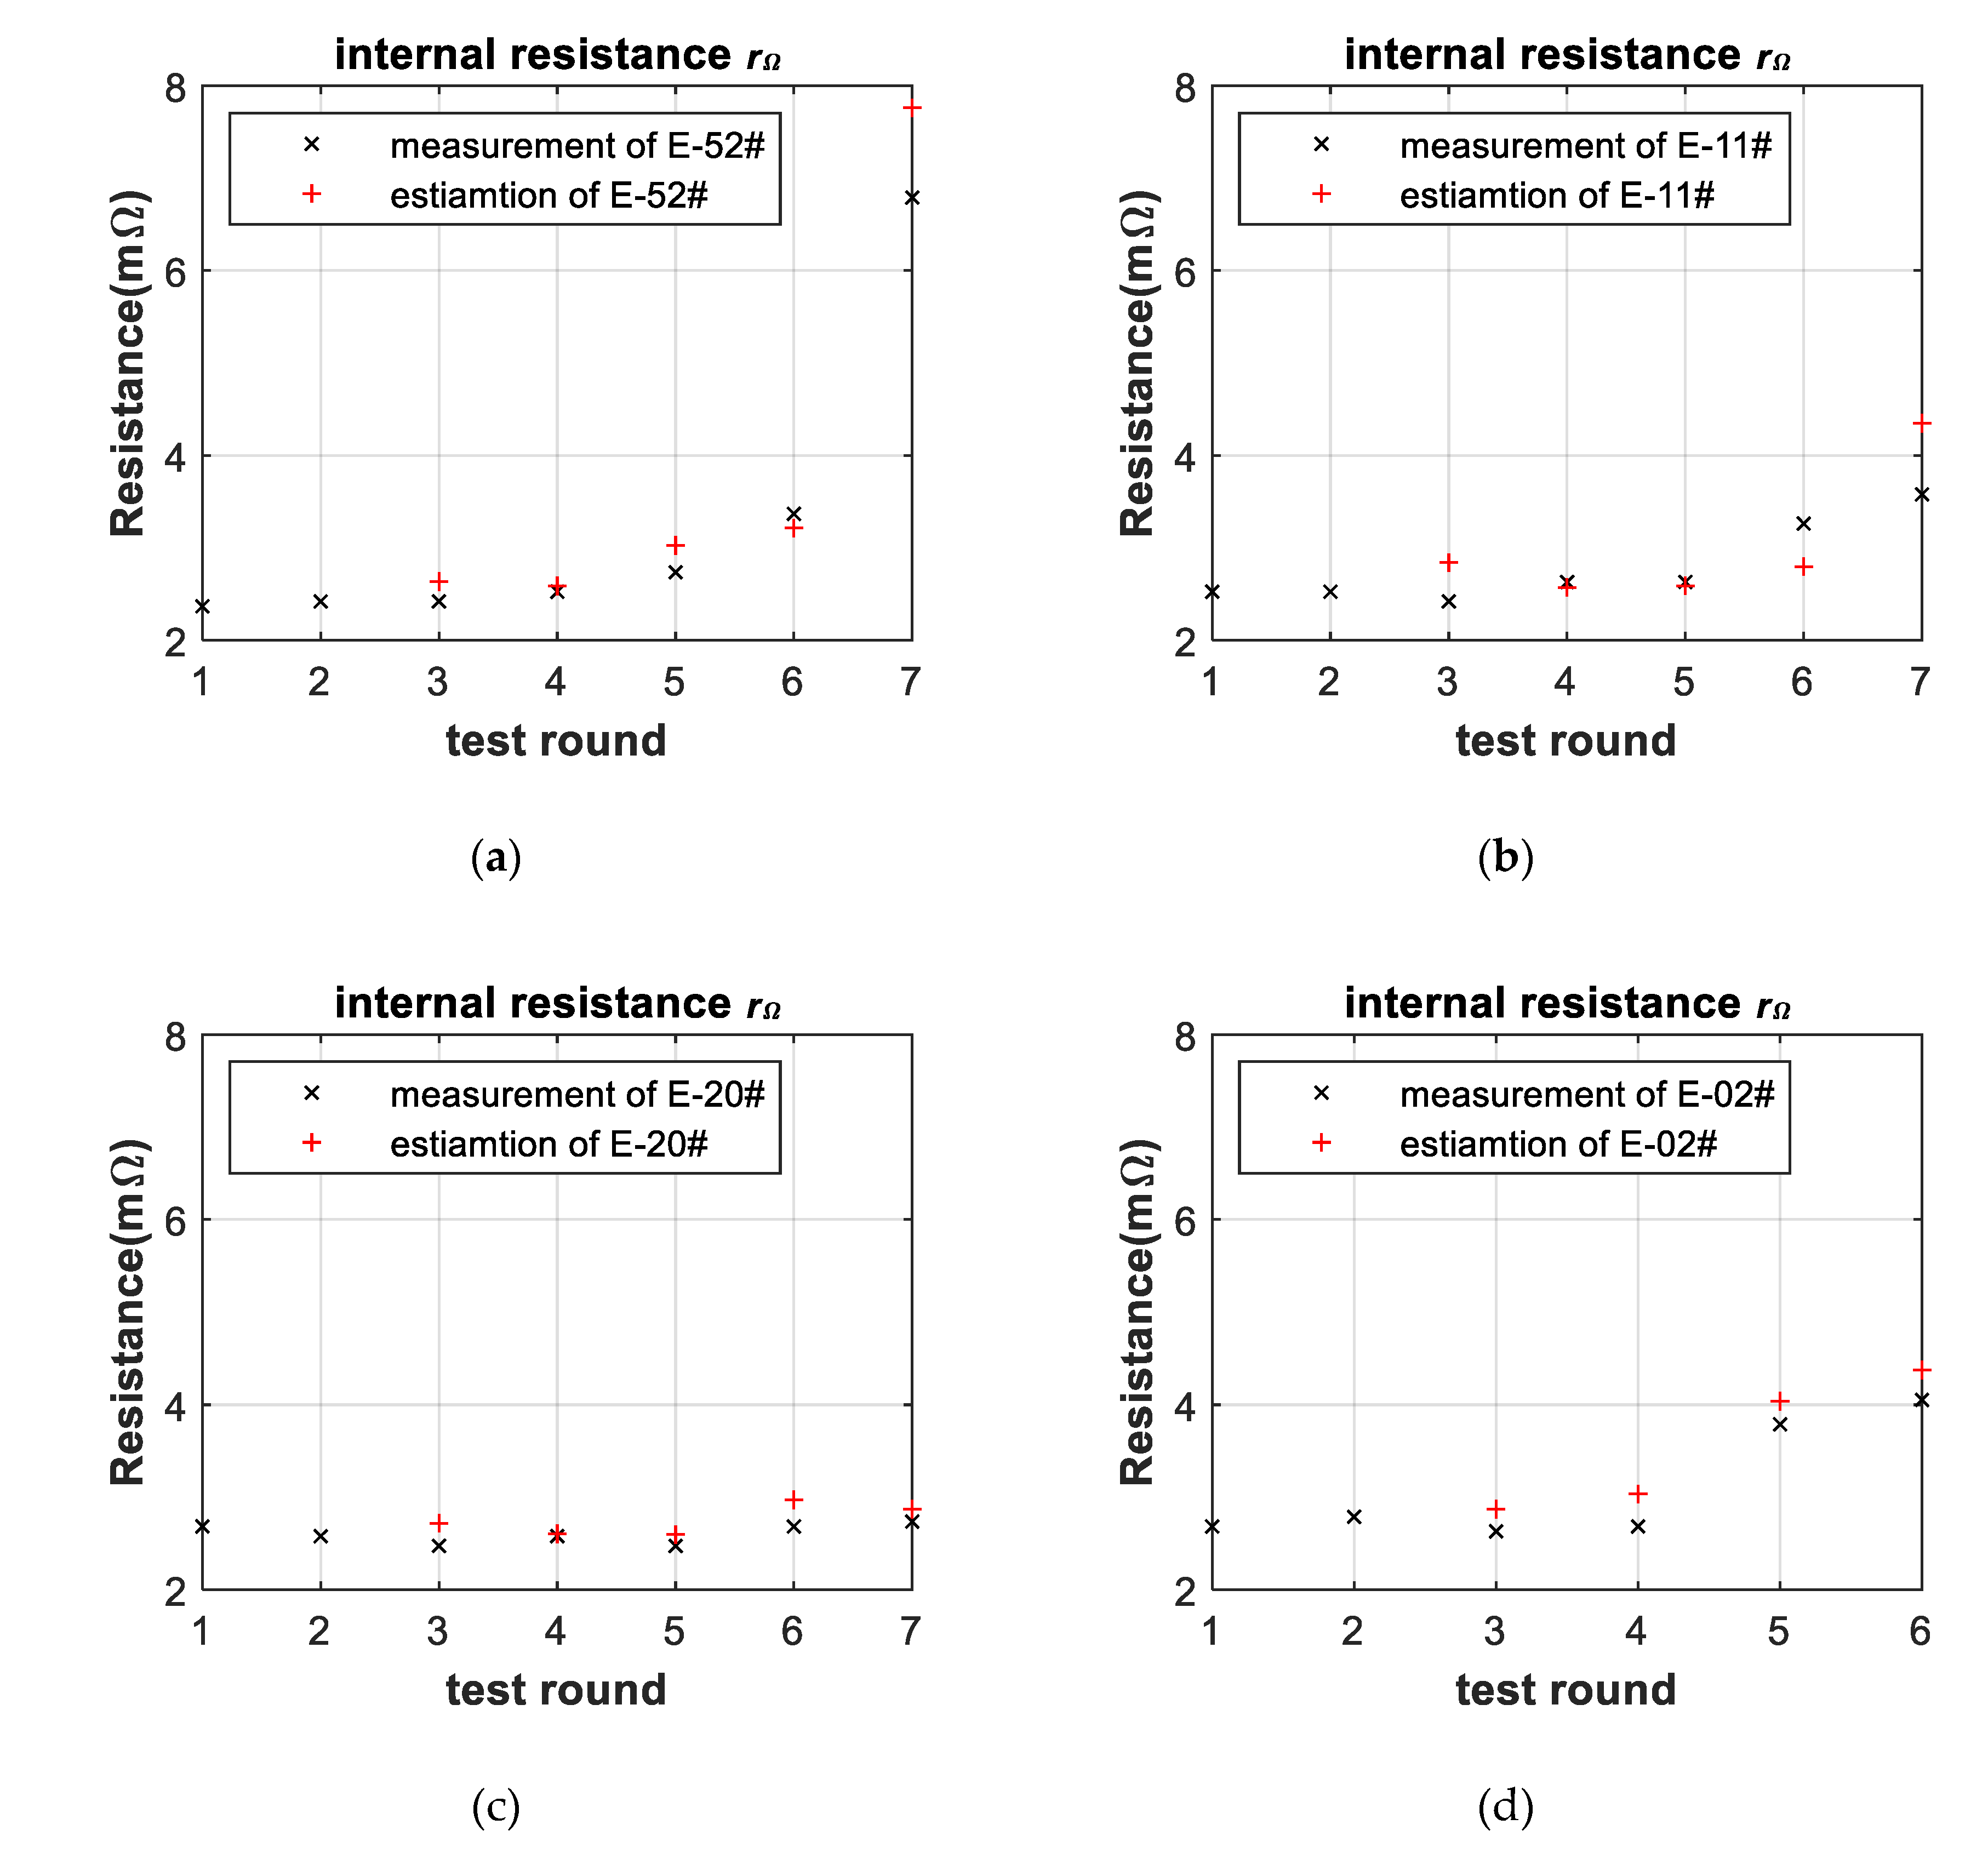
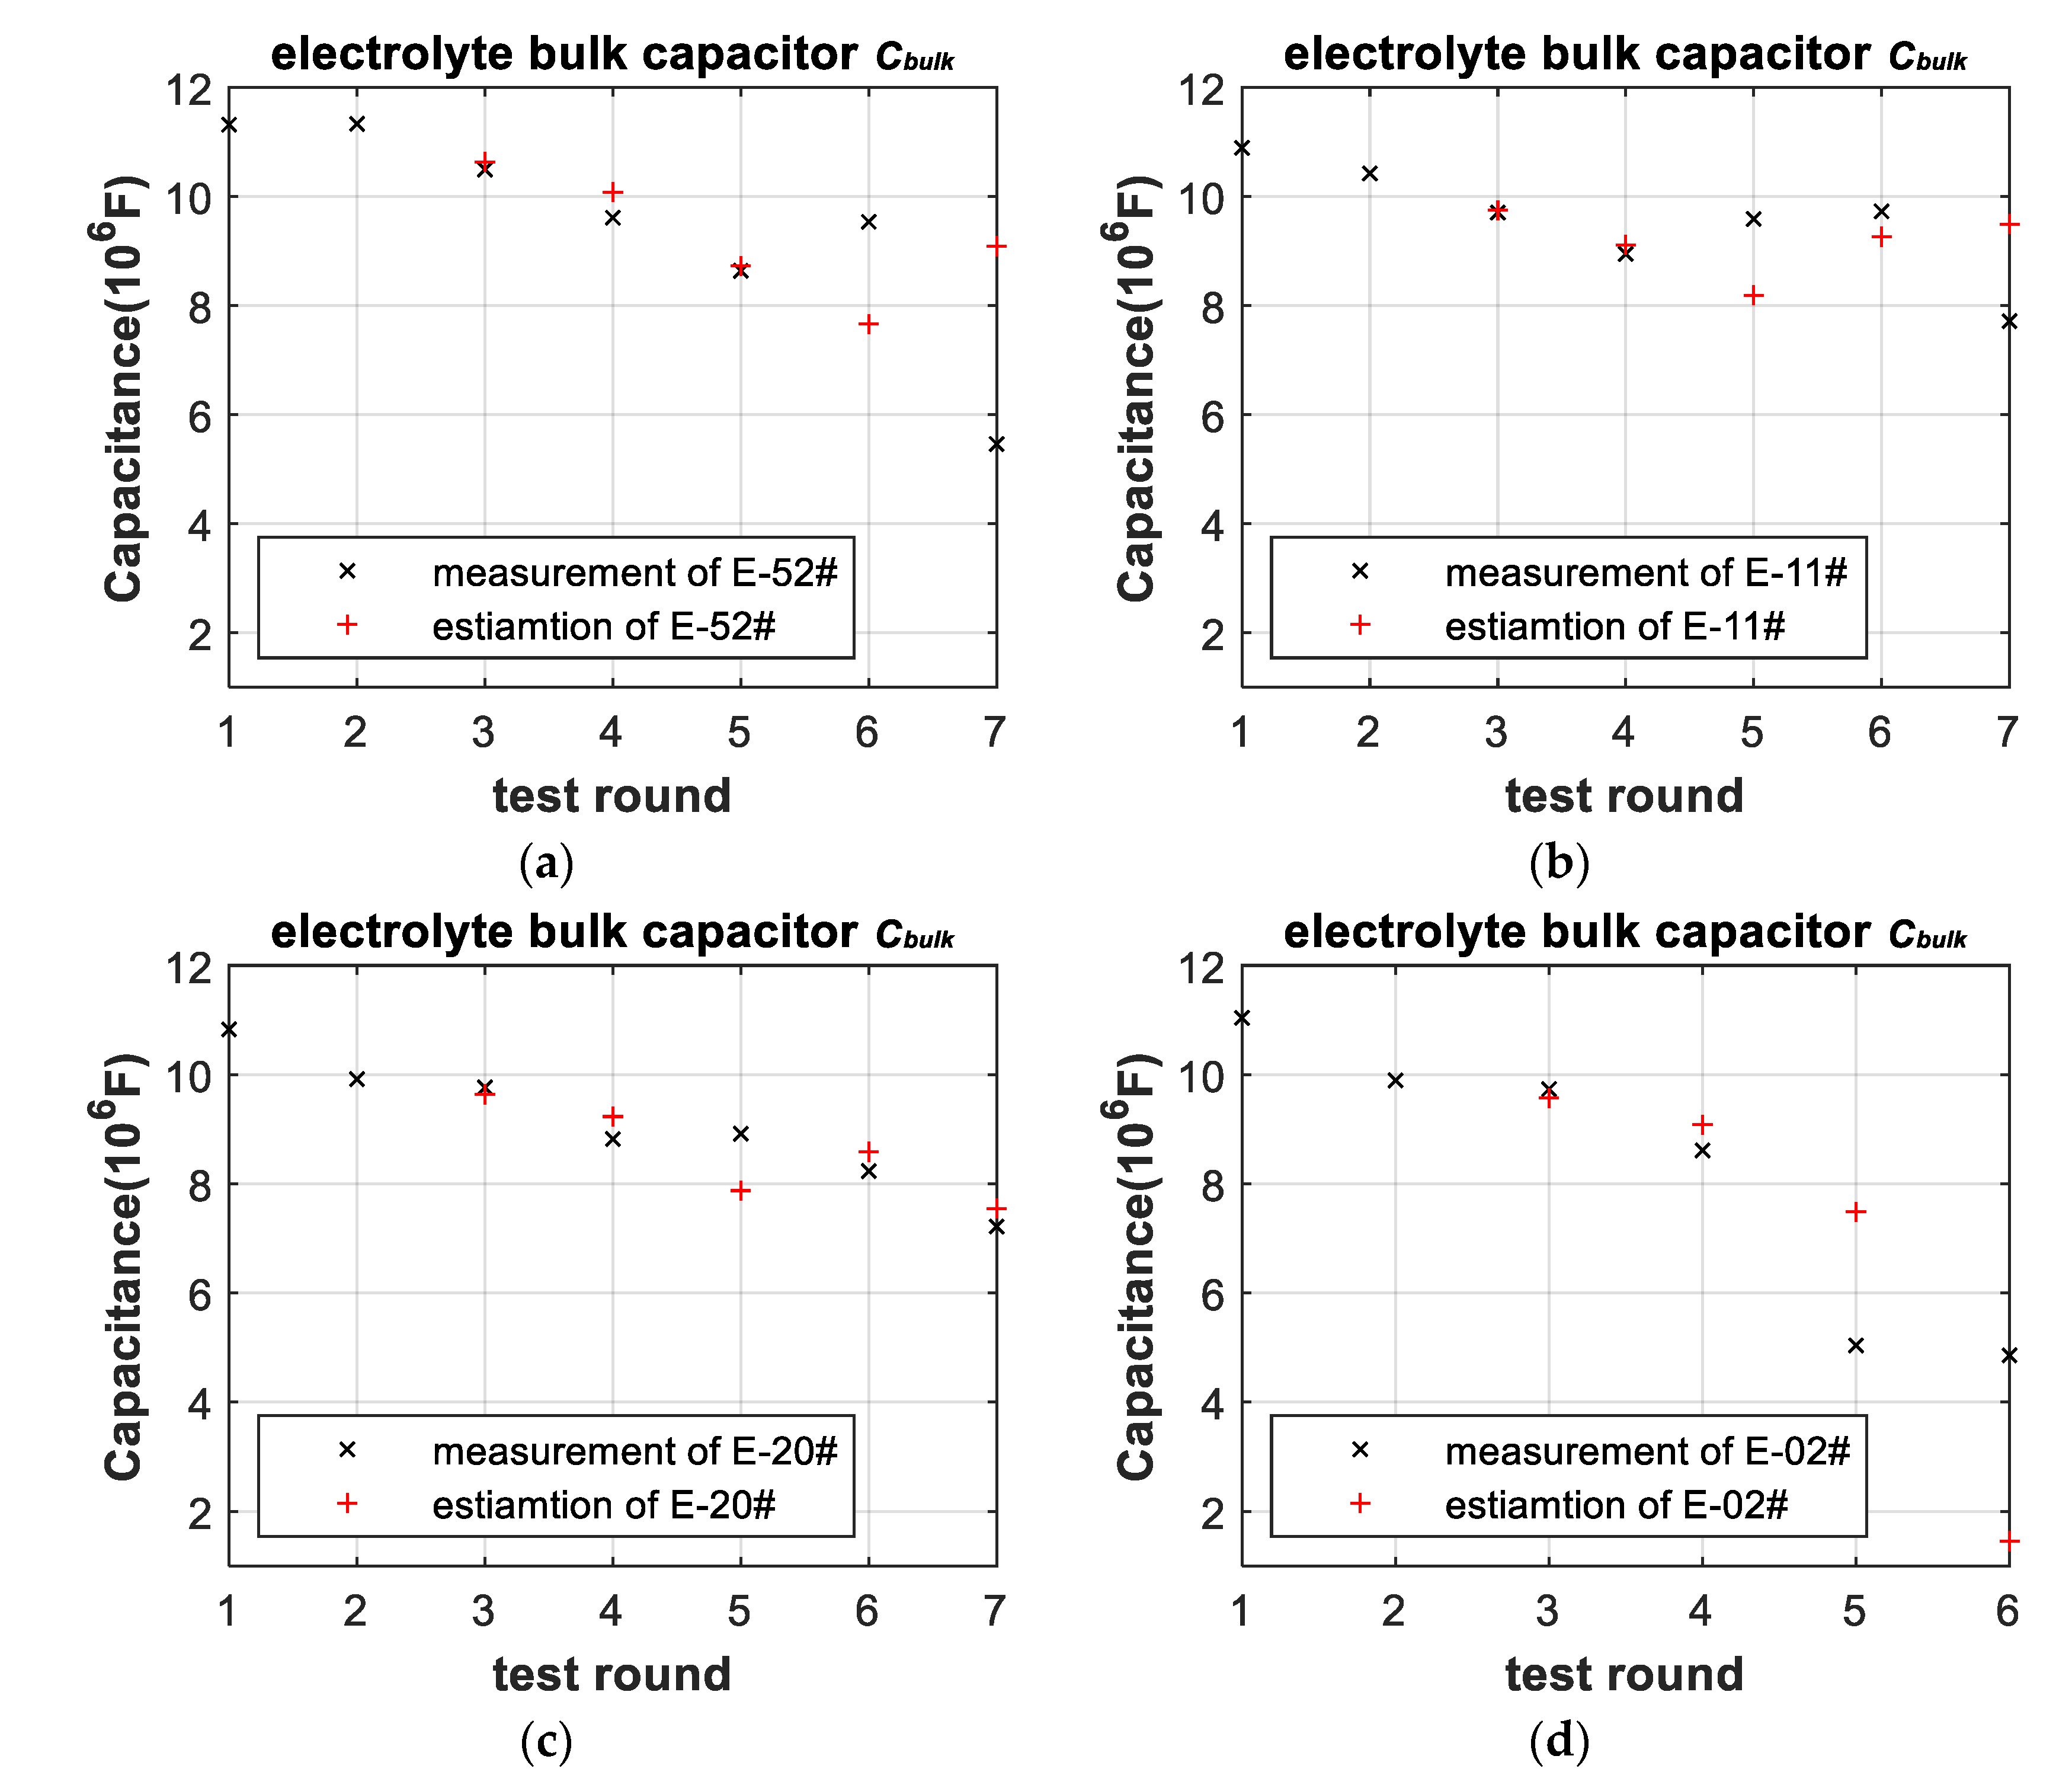
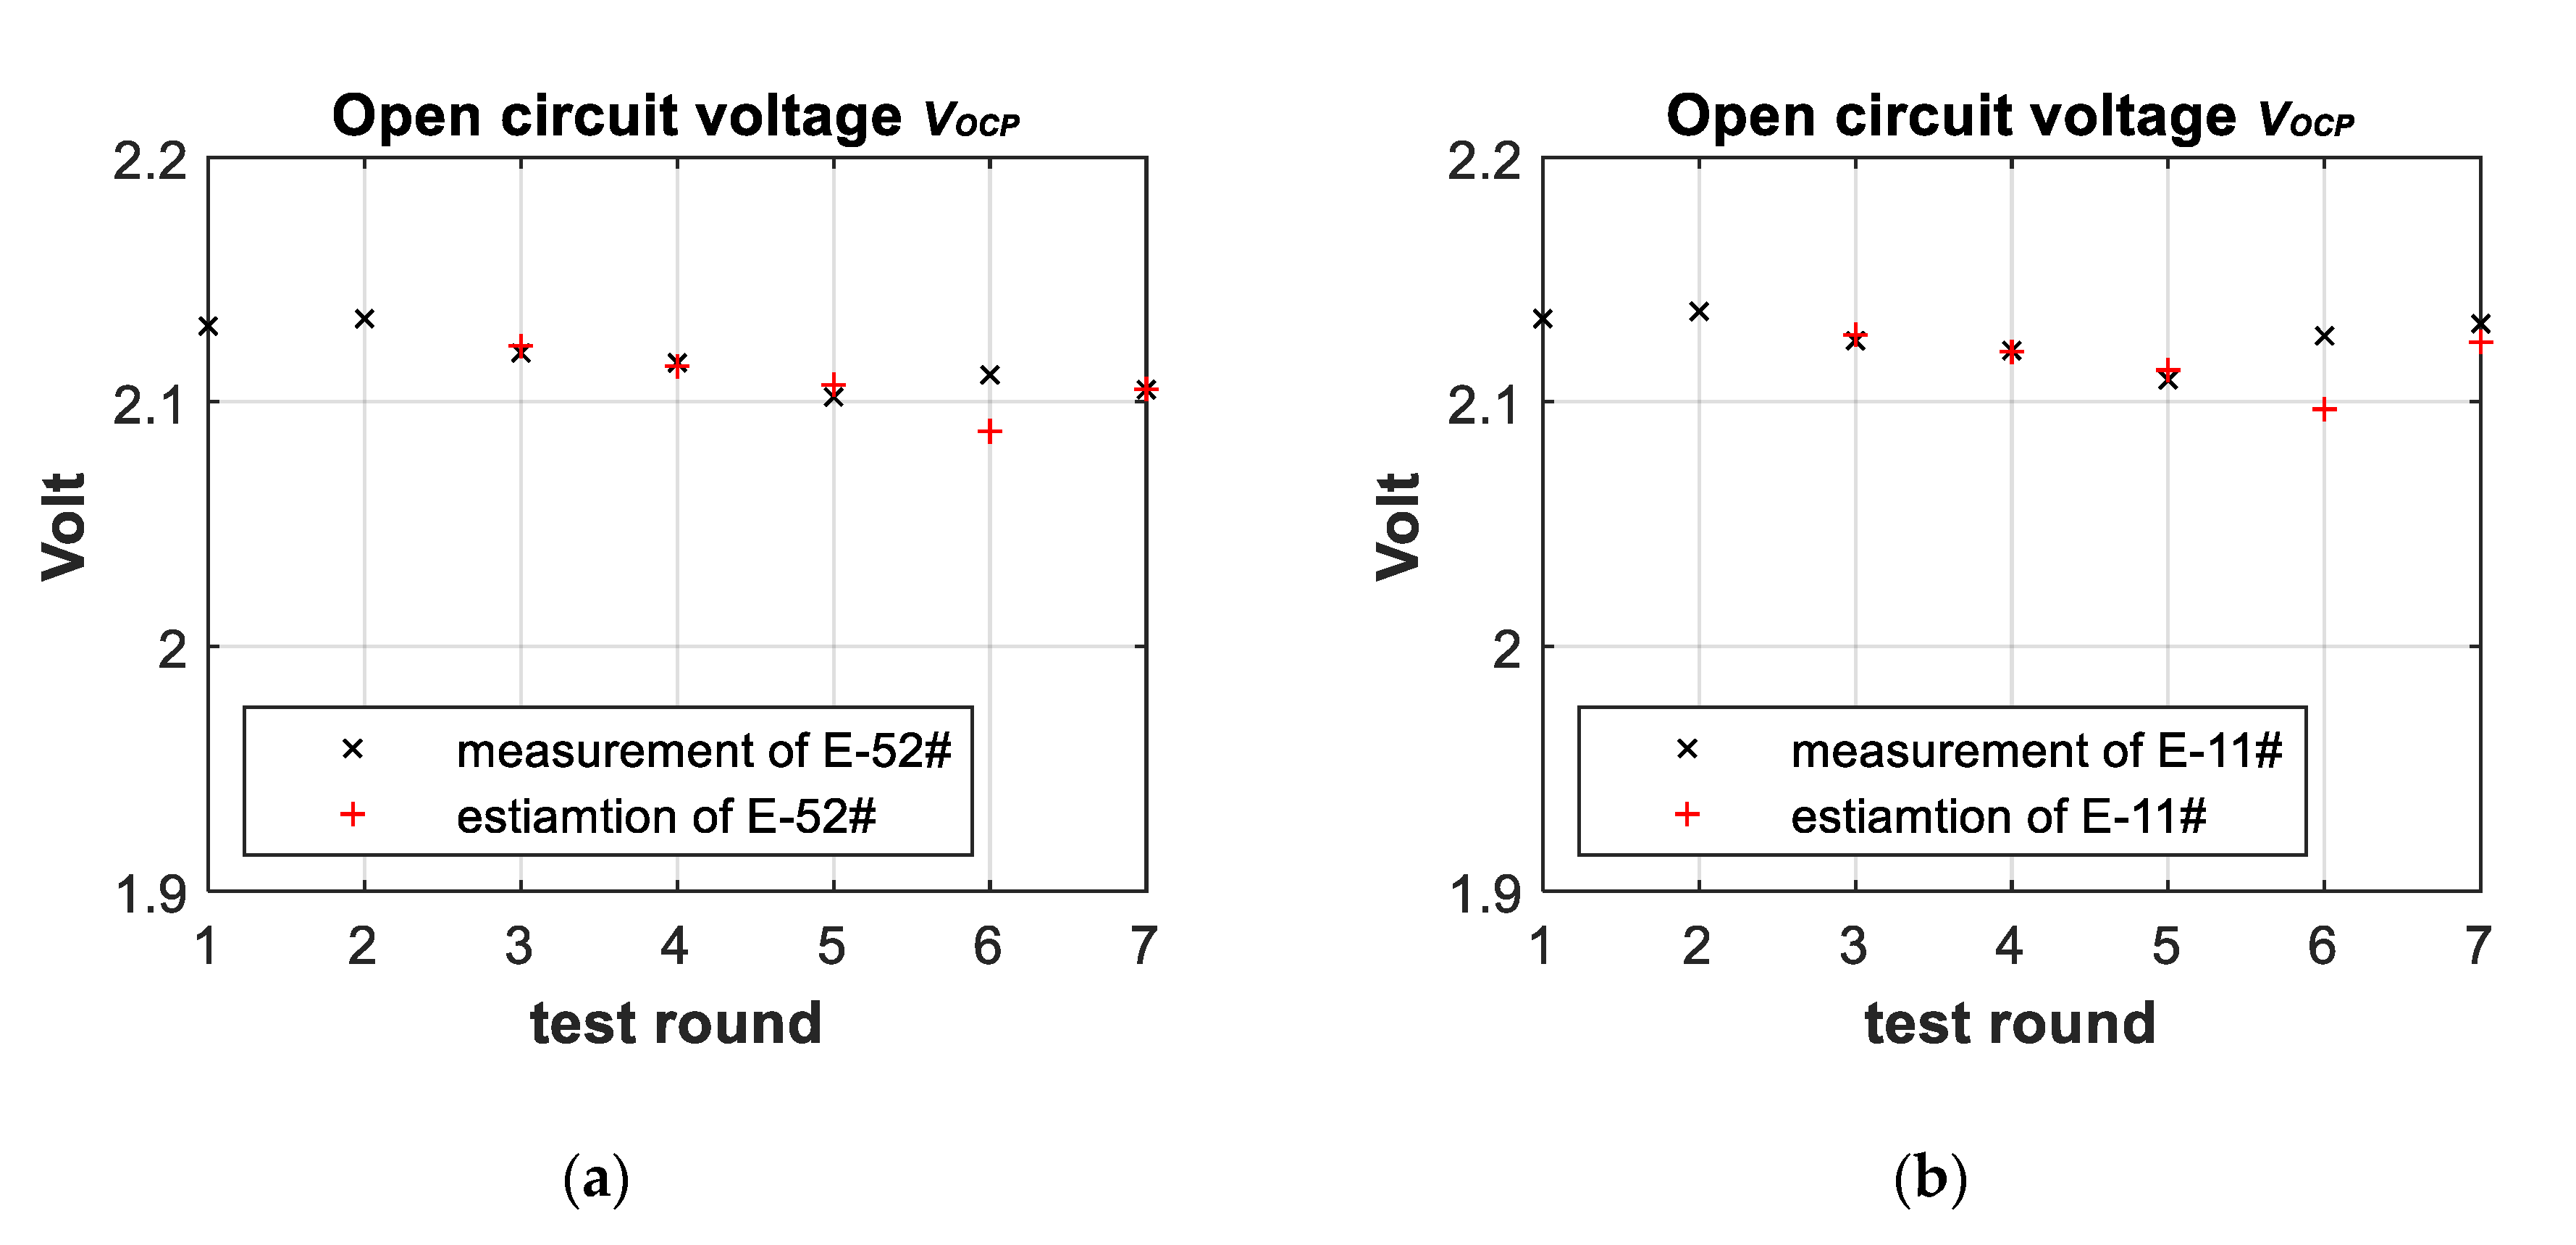
The parameters of measurements from deep-discharge and estimations from linear-aging model are plotted in Figure 7, Figure 8, Figure 9 and Figure 10.
The internal resistances predicted from contacting resistances of EIS did not show delays in Figure 7. The fitting errors of the internal resistances are shown in Table 2.
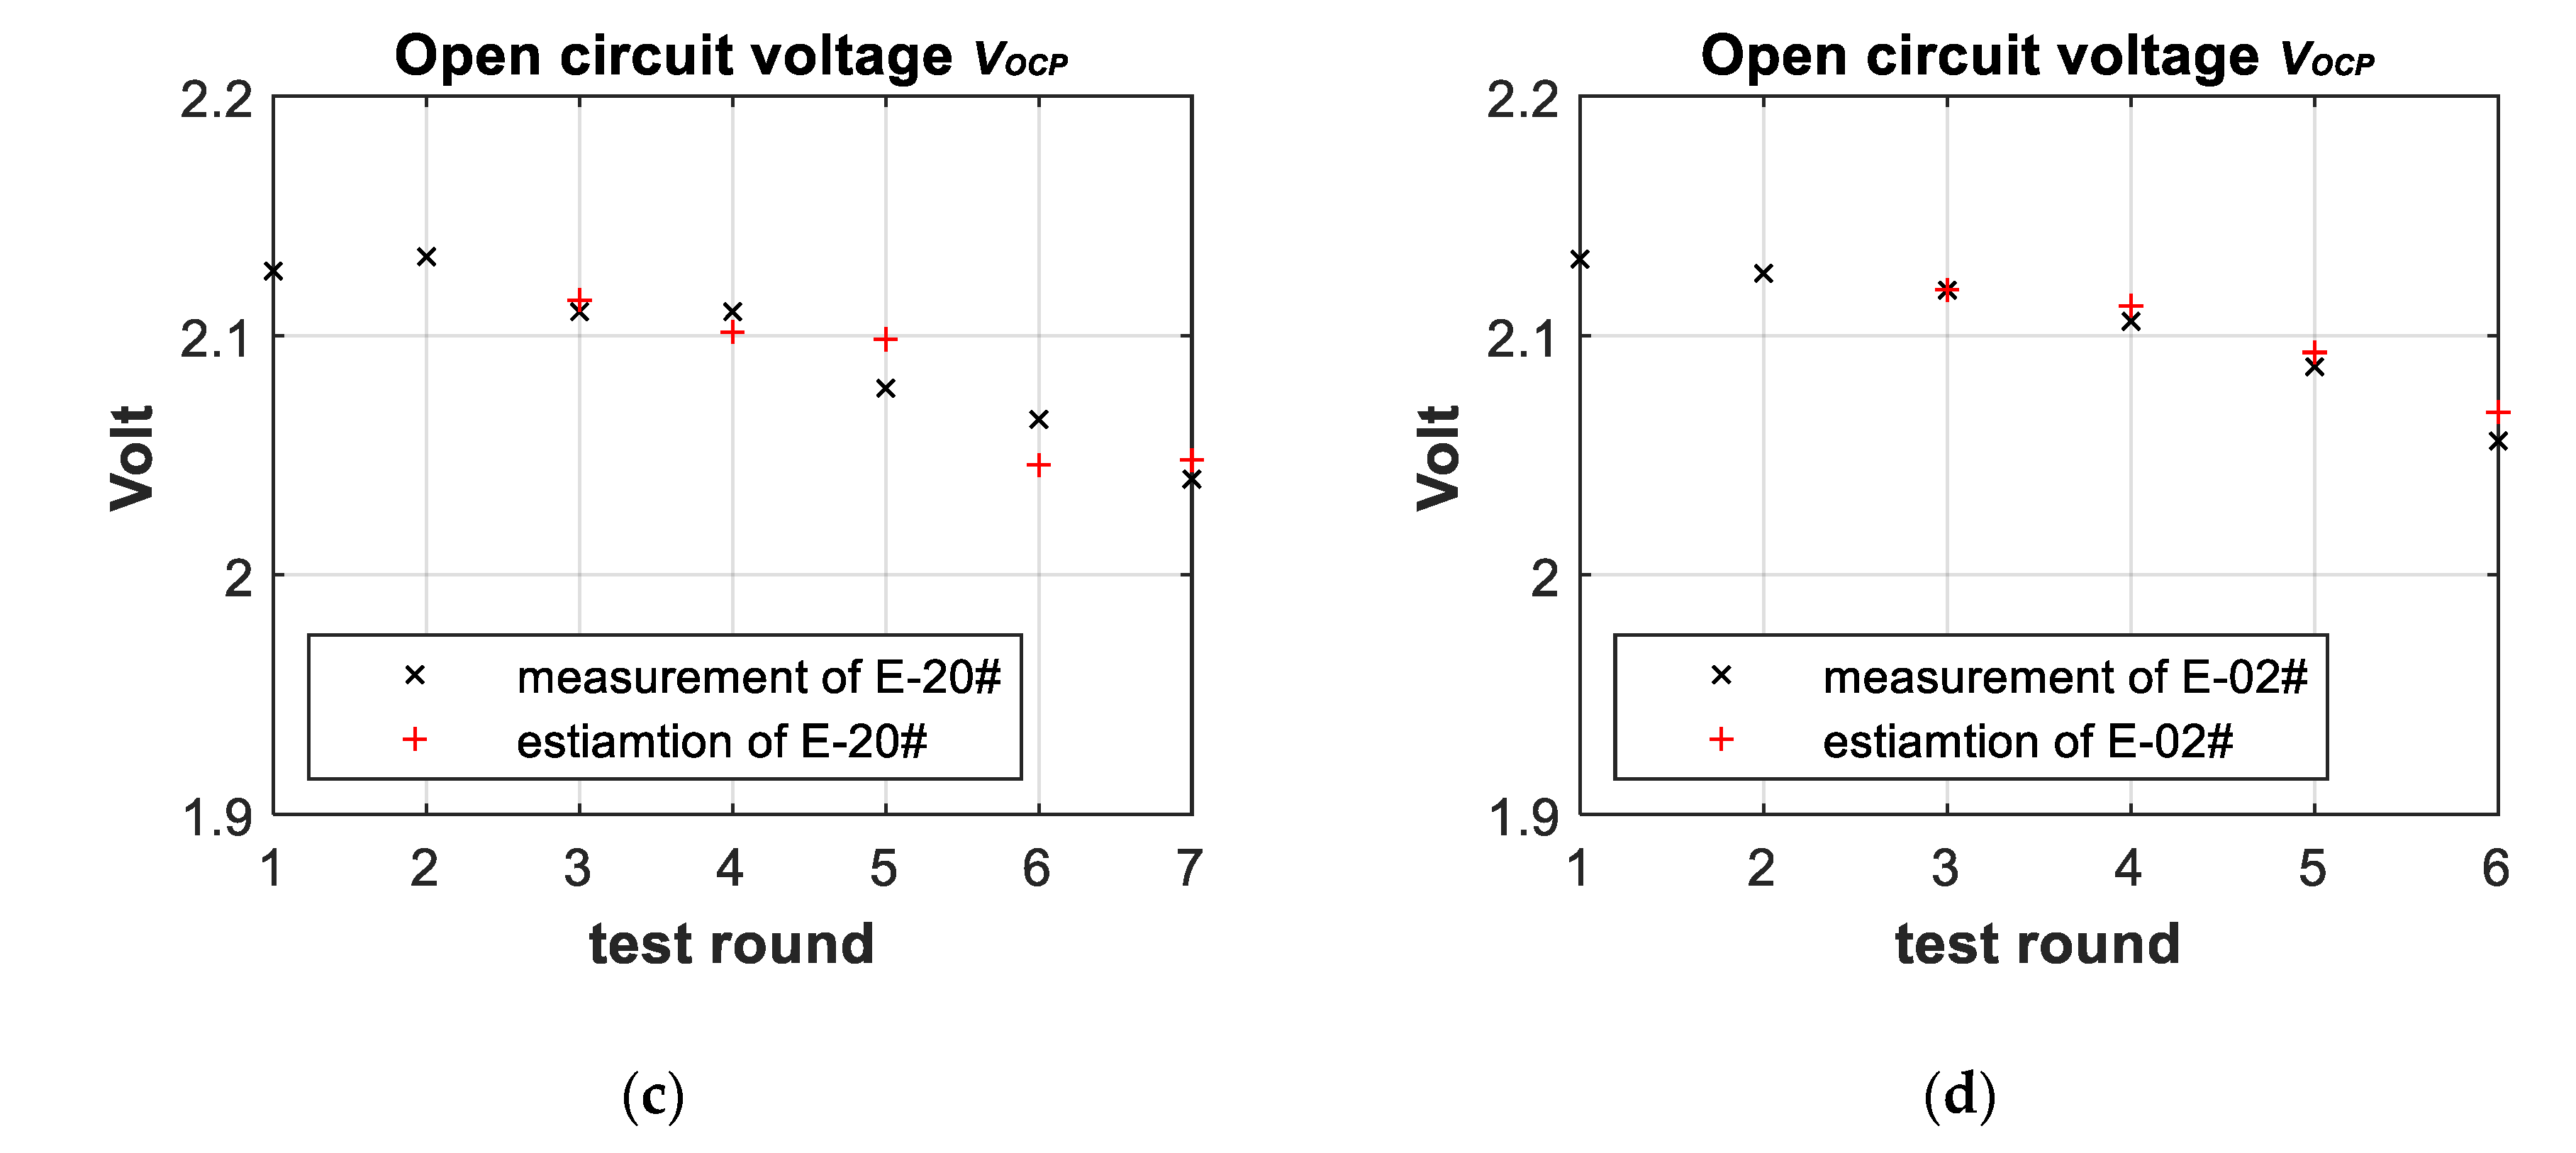
In Figure 8, open-circuit voltages of E-20# and E-02# typically decreased along aging. the open-circuit voltage of E-52# fluctuated during tests. The open-circuit voltage of E-11# showed hysteresis among the sixth and seventh experiments.
In Figure 9, electrolyte bulk capacitance of E-20# typically decreased with aging. The electrolyte bulk capacitance of E-52# showed typical hysteresis during the fifth to seventh tests. The capacitance first increased at sixth test, then sharply reduced at the seventh test. The electrolyte bulk capacitance of E-11# showed hysteresis from the fifth to seventh tests. The electrolyte bulk capacitance of E-02# also showed minor hysteresis at the last two experiments.
Predictions of electrolyte bulk capacitors and open-circuit voltages clearly showed a delay of one aging cycle in Figure 8 and Figure 9.
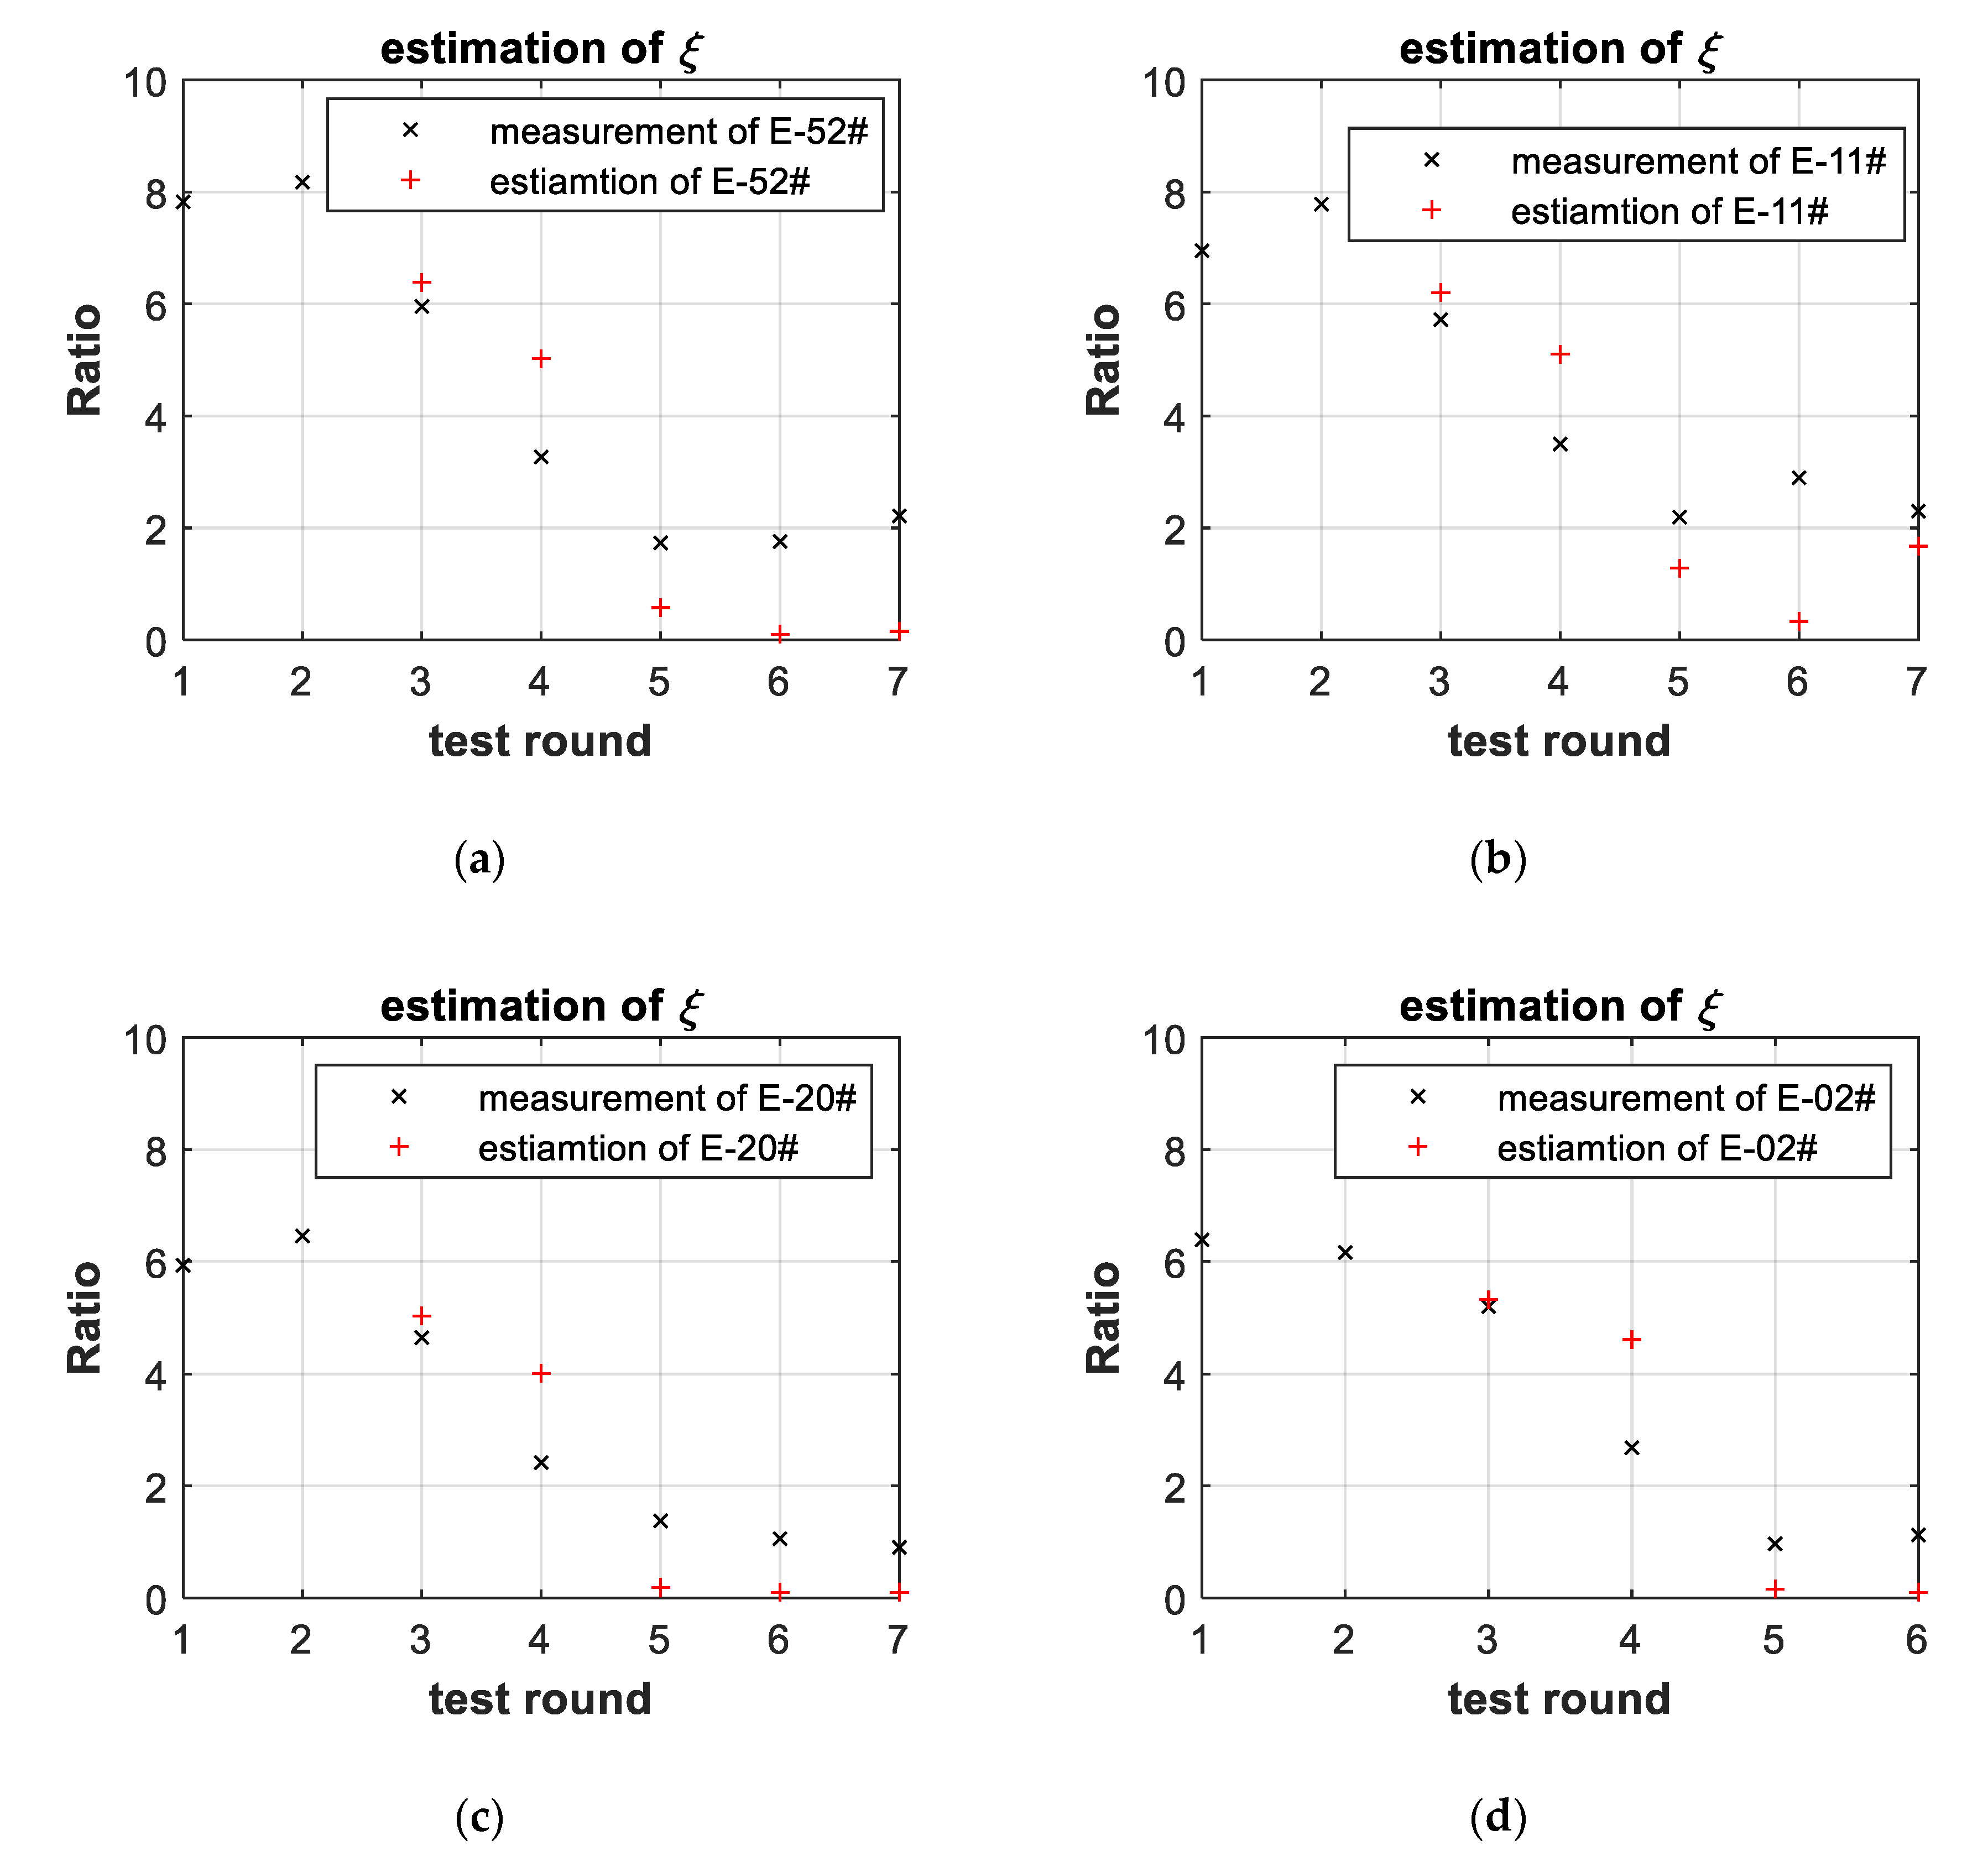
It was difficult to accurately estimate the quantity of the remaining capacity of battery with the delay predictions of the parameters. The accuracy of the linear-aging model in determining battery failure depends on the inaccuracy of the prediction of the remaining capacity. The worst case aging rates were an active overshoot for the linear model to catch up saturation of the morphology correction factor. All predictions of the morphology correction factor were below 2.0 after saturation in Figure 10. The morphology correction factor was extracted by fitting deep-discharge curves. When a healthy battery terminal was approaching the end voltage (1.80 V), the internal resistance of 1.80 V was generally three times the resistance as that of the full state of charge. While the morphology correction factor was saturating, the internal resistance of 1.80 V was generally as twice the resistance of the full state of charge. This illustrates that the electrical characteristic of battery terminal was soft at the end of service-life.
Because of saturation phenomenon, delay of predictions of the morphology correction factor are not dominant in Figure 10. The worst-case algorithm of aging rates guarantees that missing alarm do not continue. If missing alarm of the remaining capacity happens at the beginning of saturation, then next prediction of the morphology correction factor is smaller than measurement. If prediction of the morphology correction factor is minus, algorithm replaces minus value with 0.1 in Equation (50) and Figure 10.
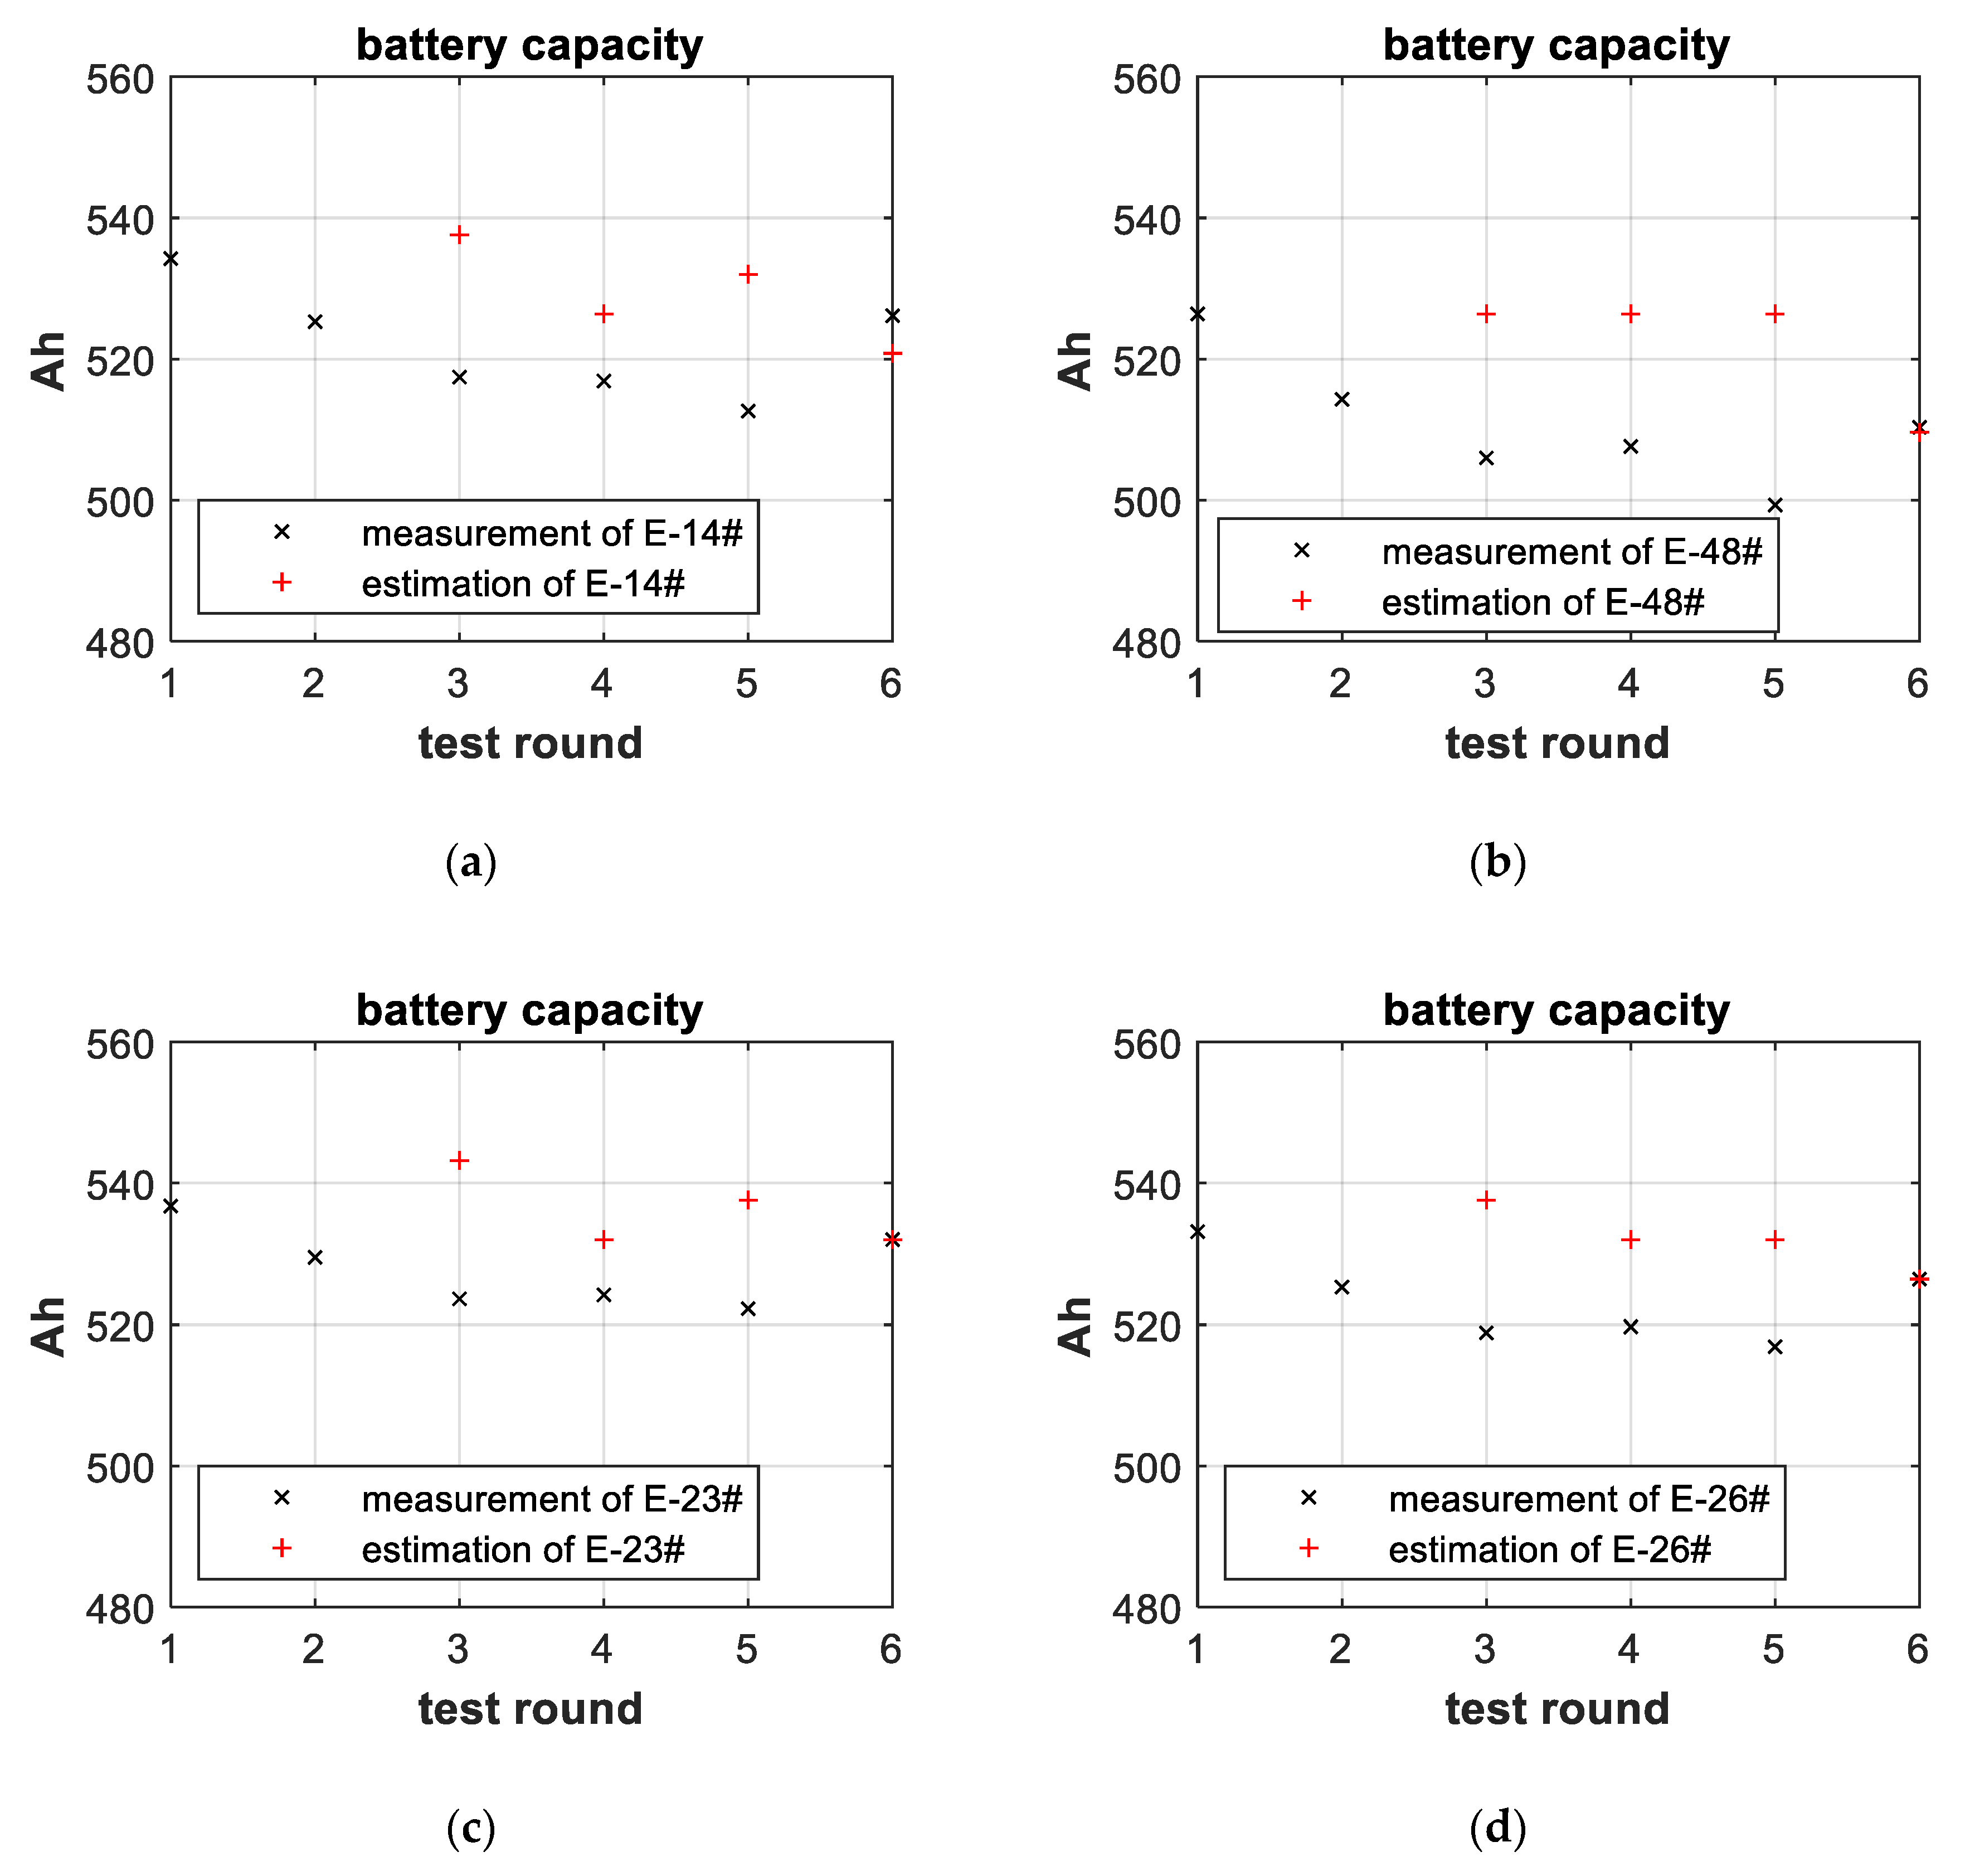
Increasing frequency of sampling is a direct way to reduce parameter prediction delays. The aging effect of one month is less in 55 °C tests than in 70 °C tests. Predictions of the remaining capacity are shown in Figure 11; the fitting errors are list in Table 3. The errors between predictions and measurements gradually decrease in Figure 11. The remaining useful capacity of the parallel samples also presents bathtub curve of hysteresis in Figure 11.
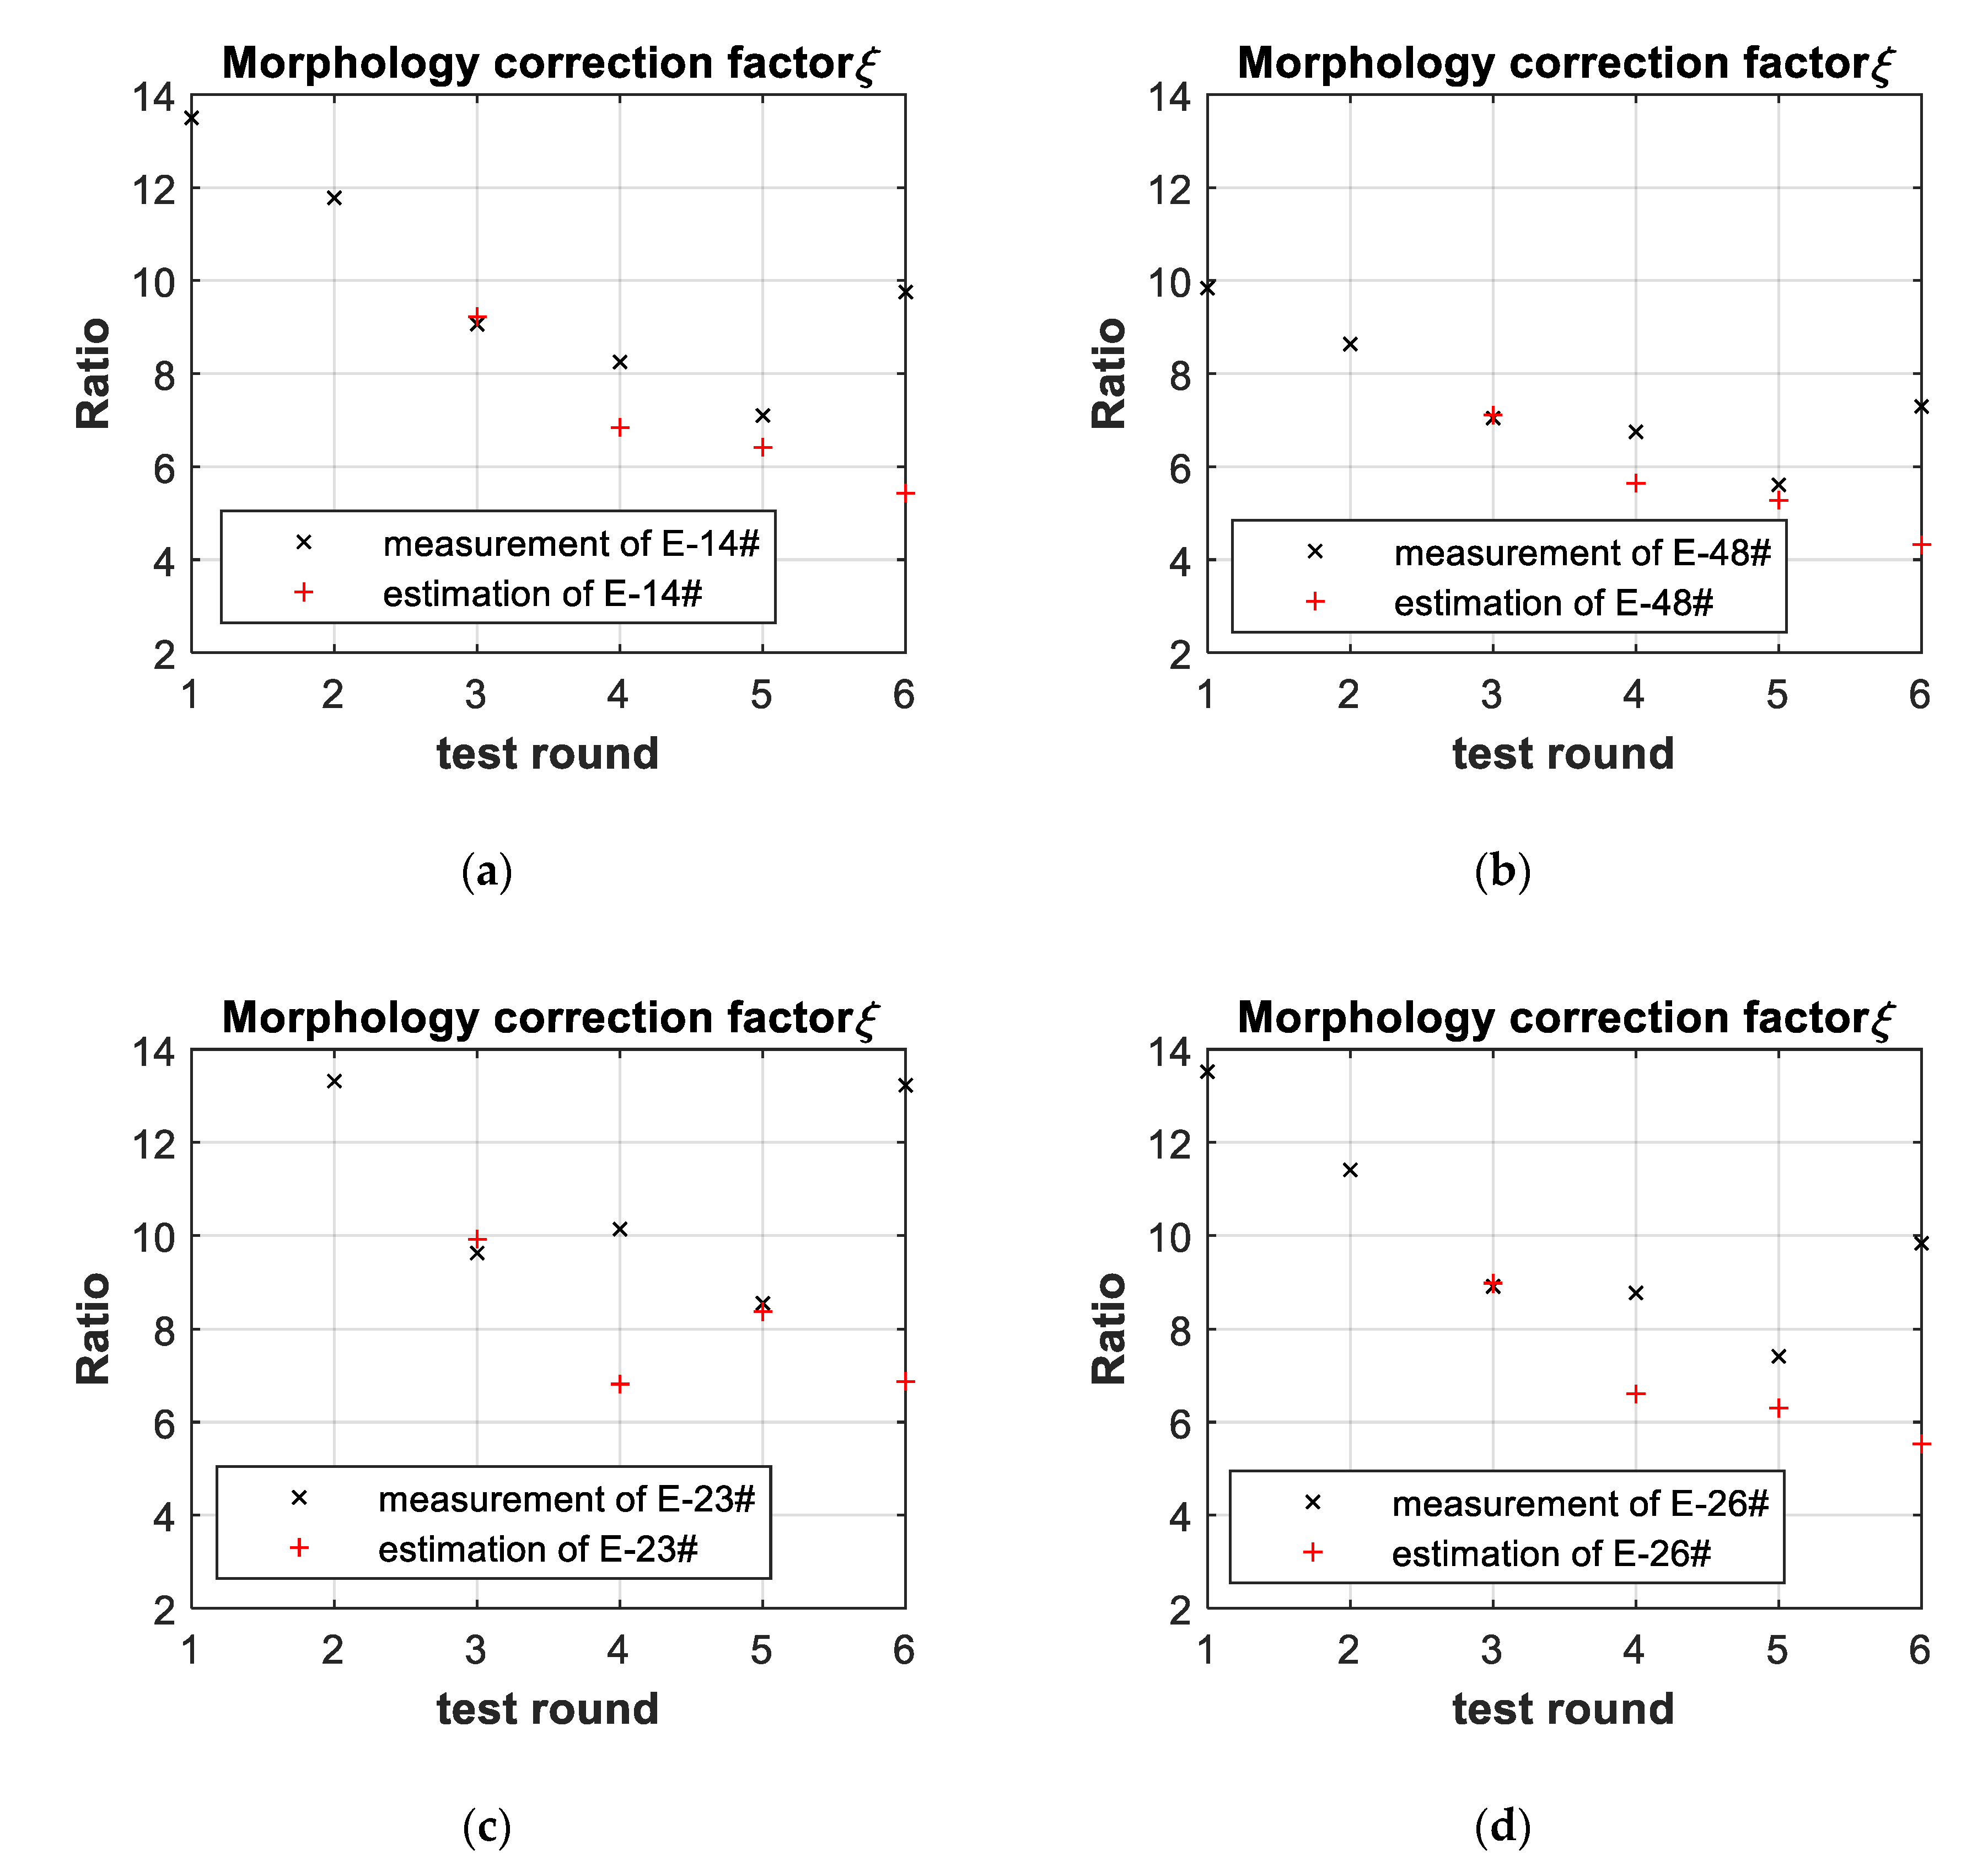
In practice, it was difficult to determine threshold of saturation of the morphology correction factor. In Figure 10, saturation values of the morphology correction factors are individually different. Therefore, comparison with the red line (450 Ah) of the remaining capacity was still necessary. The advantage of this treatment could counter hysteresis of the morphology correction factor instead of saturation, as shown in Figure 12. The proposed linear-aging model do not have false alarm in 55 °C tests in Figure 11.

4. Conclusions

The red line of the quantity of the remaining capacity is often different among batteries; the same red line ignores differentiation. The red line of the quality of the remaining capacity can be unified, such as by the saturation characteristic of the morphology correction factor. The saturation of the morphology correction factor at the end of service-life proposed in this paper is more suitable for battery failure decision, although the remaining useful capacity of an individual cell (E-11#) may above average alarm threshold. State-of-the-art approaches focus on factors that determine quantity of remaining useful capacity and determine remaining useful capacity before several years far away from battery failure to counter hysteresis of lead–acid battery. The proposed model in this paper focuses on factors which determine quality of remaining useful capacity and model battery failure at the end of service-life to counter hysteresis of lead–acid battery.
The linear-superposition–voltage-aging model proposed in this paper directly predicts internal resistances by contacting resistances from EIS. This method is particularly suitable for long-term floating service backup applications and for continuous prediction of remaining useful capacity between deep-discharging tests. While frequency of deep-discharging tests is increased, error of prediction is reduced. The linear-superposition–voltage-aging model can be extended to other batteries for prediction of remaining useful capacity.
Interactive analysis of nonlinear element is an alternative to avoid limitations brought by numeric calculations. Advantages of equivalent circuit and mathematical models are combined by interactively analysis. Generally, equivalent circuit model is more intuitive to extract parameters by local linear superposition; and mathematical model is more flexible to extract parameters by global linear equations.

Author Contributions

Conceptualization, W.W., W.Y., W.C. and Z.L.; data curation, W.W., W.Y., W.C. and D.C.; formal analysis, W.W., W.Y., W.C., D.C. and Z.L.; funding acquisition, W.Y. and Z.L.; investigation, W.W., W.Y. and Z.L.; methodology, W.W., W.Y., W.C. and Z.L.; project administration, W.Y., W.C., D.C. and Z.L.; resources, W.Y., W.C., D.C. and Z.L.; software, W.W. and W.Y.; supervision, W.Y. and Z.L.; validation, W.W., W.C. and D.C.; visualization, W.W., W.C. and D.C.; writing–original draft, W.W., W.Y. and Z.L.; writing–review and editing, W.W., W.Y. and Z.L. All authors have read and agreed to the published version of the manuscript.

Funding

The research presented within this study was supported by the National Natural Science Foundation of China under grants (51677168) and the National Major Science and Technology Projects of China under grants (2017ZX06002009).

Acknowledgments

Thanks to Cheng Cheng, Hanchuan Huang and XueXue Li, from Zhejiang Narada Power Source Co., Ltd., for helpful discussions and experimental configuration.

Conflicts of Interest

The authors declare no conflict of interest. The funders had no role in the design of the study; in the collection, analyses or interpretation of data; in the writing of the manuscript or in the decision to publish the results.

Appendix A

Table A1. The physical and chemical meanings of variables and abbreviations.
ItemElementsPhysical Meanings
1 V OCP Initial voltage of electrolyte bulk capacitor
2 c bulk Electrolyte bulk capacitor
3 R ct , pd Charge-transfer resistances of discharging of positive electrode
4 R ct , nd Charge-transfer resistances of discharging of negative electrode
5EUCElectrode utilization coefficient
6 ξ Morphology correction factor
7SOCState of charge
8 Q i Capacity of discharging
9 Ah o Rated design capacity (560 Ah)
10 r ct , p Charge-transfer resistances of the full state of charge of positive electrode
11 r ct , n Charge-transfer resistances of the full state of charge of negative electrode
12 R C Contacting resistance
13 R Ω Battery internal resistance
14 a e , d Discharging surface area
15 a e Electrode surface area
16 r C Contacting resistance of the full state of charge
17 r Ω Internal resistance of the full state of charge
18 ξ Ω Morphology correction factor of internal resistance
19 V ti Terminal voltage of soc i
20 I Discharging current
21 ξ p Morphology correction factor of positive electrode
22 ξ n Morphology correction factor of negative electrode
23 EUC i Electrode utilization coefficient of soc i
24 V tj Terminal voltage approaching to the end of voltage (1.80 v)
25 t 0 Initial time moment of deep-discharge
26 V t 1 Terminal voltage of the beginning of deep-discharge
27 EUC 1 Electrode utilization coefficient of the beginning of discharge
28   EUC m Electrode utilization coefficient as equal as 0.1
29   EUC L Electrode utilization coefficient as equal as 0.3
30 r Ω , 19 Internal resistance related to 19 a discharge current
31 r Ω , 50 Internal resistance related to 50 a discharge current
32 T Temperature variation
33 I 10 Current for discharging rated battery capacity (560 Ah) for 10 h
34 C 10 Capacity of discharging under i 10
35 I 11.2 50-A current for discharging rated battery capacity (560 Ah) for 11.2 h
36 I 29.4 19-A current for discharging rated battery capacity (560 Ah) for 29.4 h
37 C Capacity of discharging under i
38 C T Limit Capacity when the discharge Current tends to zero
39 a 1 Parameters of CIEMAT model
40 a 2 Parameters of CIEMAT model
41 a 3 Parameters of CIEMAT model
42 Q n Capacity of discharging before current discontinuous
43 Q ( n + 1 ) Capacity of discharging after current discontinuous
44 α k Ratio between contacting and internal resistances at k-round aging test
45 r C , k Contacting resistance of EIS at k-round aging test.
46 r Ω , k Internal resistance of deep-discharge at k-round aging test
47 r ^ Ω , k estimation of internal resistance of deep-discharge after k-round aging test
48 α ^ k Estimation of ratio after k-round deep-discharge
49 P k Error covariance of estimation at k-round aging test
50 M Ω Covariance matrix of measurement errors
51 H Ω Transformation matrix between measurement and state vector
52 K k Kalman gain at k-round aging test
53 E { x } Expected value of variable x
54 P k Error covariance for updated estimation at k-round aging test
55 r C , k Incremental contacting resistance between k-round and (k-1)-round aging test
56 Φ Ω , k State transition matrix
57 r ^ Ω , k Prediction of internal resistance at k-round EIS sampling
58 a ^ k Prediction of ratio at k-round EIS sampling
59 x k Measured parameters ( v ocp , c bulk , ξ ω ) at k-round aging test
60 β k , 1 Aging rates adjusted according to parameters’ highest value
61 β k , 2 Aging rates adjusted according to parameters’ last value
62 x o Parameters’ historical highest value
63 β k Aging rates of the parameters
64 M x Covariance matrix of measurement errors of the parameter x
65 H x Transformation matrix between measurement and state vector of the parameter x
66 Φ x , k State transition matrix of the parameter x
67 x ^ k Estimation of the parameter after k-round deep-discharge
68 x ^ k Prediction of aging parameter of k-round aging test
69 β ^ k Prediction of aging rates of parameters of k-round aging test
70 β ^ k Estimation of aging rates of parameters after k-round aging test
71 E U ^ C j , k Electrode utilization coefficient corresponding to the end of terminal voltage (1.80 v) at k-round aging test

References

  1. Ballantyne, A.D.; Hallett, J.P.; Riley, D.J.; Shah, N.; Payne, D.J. Lead acid battery recycling for the twenty-first century. R. Soc. Open Sci. 2018, 5, 171368. [Google Scholar] [CrossRef] [Green Version]
  2. Matteson, S.; Williams, E. Residual learning rates in lead-acid batteries: Effects on emerging technologies. Energy Policy 2015, 85, 71–79. [Google Scholar] [CrossRef]
  3. Zhang, Y.L.; Du, X.Y.; Salman, M. Battery state estimation with a self-evolving electrochemical ageing model. Int. J. Electr. Power Energy Syst. 2017, 85, 178–189. [Google Scholar] [CrossRef]
  4. Lyu, C.; Lai, Q.Z.; Ge, T.F.; Yu, H.H.; Wang, L.X.; Ma, N. A Lead-acid battery’s remaining useful life prediction by using electrochemical model in the particle filtering framework. Energy 2017, 120, 975–984. [Google Scholar] [CrossRef]
  5. Ren, D.S.; Lu, L.G.; Shen, P.; Feng, X.N.; Han, X.B.; Ouyang, M.G. Battery remaining discharge energy estimation based on prediction of future operating conditions. J. Energy Storage 2019, 25, 100836. [Google Scholar] [CrossRef]
  6. Lu, J.D.; Wei, L.F.; Pour, M.M.; Mekonnen, Y.; Sarwat, A.I. Modeling discharge characteristics for predicting battery remaining life. In Proceedings of the IEEE Transportation Electrification Conference and Expo, Chicago, IL, USA, 22–24 June 2017. [Google Scholar] [CrossRef]
  7. Shepherd, C.M. Design of primary and secondary cells: II. An equation describing battery discharge. J. Electrochem. Soc. 1965, 112, 657–664. [Google Scholar] [CrossRef]
  8. Copetti, J.B.; Chenlo, F. Lead/acid batteries for photovoltaic applications. test results and modeling. J. Power Sour. 1994, 47, 109–118. [Google Scholar] [CrossRef]
  9. Achaibou, N.; Haddadi, M.; Malek, A. Modeling of lead acid batteries in PV Systems. Energy Procedia 2012, 18, 538–544. [Google Scholar] [CrossRef] [Green Version]
  10. Achaibou, N.; Haddadi, M.; Malek, A. Lead acid batteries simulation including experimental validation. J. Power Sour. 2008, 185, 1484–1491. [Google Scholar] [CrossRef]
  11. Degla, A.; Chikh, M.; Chouder, A.; Bouchafaa, F. Comparison study and parameter identification of three battery models for an off-grid photovoltaic system. Int. J. Green Energy 2019, 16, 299–308. [Google Scholar] [CrossRef]
  12. Blaifi, S.; Moulahoum, S.; Colak, I.; Merrouche, W. An enhanced dynamic model of battery using genetic algorithm suitable for photovoltaic applications. Appl. Energy 2016, 169, 888–898. [Google Scholar] [CrossRef]
  13. Thirugnanam, K.; Joy, T.P.E.R.; Singh, M.; Kumar, P. Mathematical modeling of Li-Ion battery using genetic algorithm approach for V2G applications. IEEE Trans. Energy Convers. 2014, 29, 332–343. [Google Scholar] [CrossRef]
  14. Haddad, R.J.; El-Shahat, A.; Kalaani, Y. Lead acid battery modeling for PV applications. J. Electr. Eng. 2015, 15, 17–24. [Google Scholar]
  15. Burgess, W.L. An analysis of float service life test data of VRLA batteries. J. Power Sour. 1998, 75, 28–35. [Google Scholar] [CrossRef]
  16. Burgess, W.L. Valve regulated lead acid battery float service life estimation using a Kalman Filter. J. Power Sour. 2009, 191, 16–21. [Google Scholar] [CrossRef]
  17. Sauer, D.U.; Wenzl, H. Comparison of different approaches for lifetime prediction of electrochemical systems—Using lead-acid batteries as example. J. Power Sour. 2008, 176, 534–546. [Google Scholar] [CrossRef]
  18. Schiffer, J.; Sauer, D.U.; Bindner, H.; Cronin, T.; Lundsager, P.; Kaiser, R. Model prediction for ranking lead-acid batteries according to expected lifetime in renewable energy systems and autonomous power-supply systems. J. Power Sour. 2007, 168, 66–78. [Google Scholar] [CrossRef]
  19. Pilatowicz, G.; Budde-Meiwes, H.; Schulte, D.; Kowal, J.; Zhang, Y.; Du, X.; Salman, M.; Gonzales, D.; Alden, J.; Sauer, D.U. Simulation of SLI lead-acid batteries for SoC, aging and cranking capability prediction in automotive applications. J. Electrochem. Soc. 2012, 159, A1410–A1419. [Google Scholar] [CrossRef]
  20. Franke, M.; Kowal, J. Empirical sulfation model for valve-regulated lead-acid batteries under cycling operation. J. Power Sour. 2018, 380, 76–82. [Google Scholar] [CrossRef]
  21. Bashir, N.; Sardar, H.S.; Nasir, M.; Hassan, N.U.; Khan, H.A. Lifetime maximization of lead-acid batteries in small scale UPS and distributed generation systems. In Proceedings of the IEEE Manchester PowerTech, Manchester, UK, 18–22 June 2017. [Google Scholar] [CrossRef]
  22. Kwiecien, M.; Huck, M.; Badeda, J.; Zorer, C.; Komut, K.; Yu, Q.; Sauer, D.U. Variation of impedance in lead-acid batteries in the presence of acid stratification. Appl. Sci. 2018, 8, 1018. [Google Scholar] [CrossRef] [Green Version]
  23. Kwiecien, M.; Badeda, J.; Huck, M.; Komut, K.; Duman, D.; Sauer, D.U. Determination of SoH of lead-acid batteries by electrochemical impedance spectroscopy. Appl. Sci. 2018, 8, 873. [Google Scholar] [CrossRef] [Green Version]
  24. Qahouq, J.A.A.; Xia, Z.Y. Single-perturbation-cycle online battery impedance spectrum measurement method with closed-loop control of power converter. IEEE Trans. Ind. Electr. 2017, 64, 7019–7029. [Google Scholar] [CrossRef]
  25. Lee, Y.D.; Park, S.Y.; Han, S.B. Online embedded impedance measurement using high-power battery charger. IEEE Trans. Ind. Appl. 2015, 51, 498–508. [Google Scholar] [CrossRef]
  26. Son, J.B.; Zhou, S.Y.; Sankavaram, C.; Du, X.Y.; Zhang, Y.L. Remaining useful life prediction based on noisy condition monitoring signals using constrained Kalman Filter. Reliab. Eng. Syst. Saf. 2016, 152, 38–50. [Google Scholar] [CrossRef] [Green Version]
  27. Bhalaji, N.; Rimi, C. Remaining Useful Life (RUL) estimation of lead acid battery using bayesian approach. J. Electr. Eng. Autom. 2020, 2, 25–34. [Google Scholar] [CrossRef]
  28. Nazghelichi, T.; Torabi, F.; Esfahanian, V. Non-dimensional analysis of electrochemical governing equations of lead-acid batteries. J. Energy Storage 2020, 27, 101120. [Google Scholar] [CrossRef]
  29. Lopez, B.D.; Lujano-Rojas, J.M.; Bernal-Agustin, J.L. Comparison of different lead–acid battery lifetime prediction models for use in simulation of stand-alone photovoltaic systems. Appl. Energy 2014, 115, 242–253. [Google Scholar] [CrossRef]
  30. Tiedemann, W. Forty years of porous electrode theory with battery applications. ECS Trans. 2008, 16, 23–37. [Google Scholar] [CrossRef]
  31. Newman, J.; Tiedemann, W. Porous-electrode theory with battery applications. AlChE J. 1975, 21, 25–41. [Google Scholar] [CrossRef] [Green Version]
  32. Srinivasan, V.; Wang, G.Q.; Wang, C.Y. mathematical modeling of current-interrupt and pulse operation of valve-regulated lead acid cells. J. Electrochem. Soc. 2003, 150, A316–A325. [Google Scholar] [CrossRef] [Green Version]
  33. Berndt, D.; Teutsch, U. Float charging of valve-regulated lead-acid batteries: A balancing act between secondary reactions. J. Electrochem. Soc. 1996, 143, 790. [Google Scholar] [CrossRef]
  34. Karden, E. Using Low-Frequency Impedance Spectroscopy for Characterization, Monitoring, and Modeling of Industrial Batteries. Ph.D. Thesis, RWTH Aachen University, Aachen, Germany, December 2001; pp. 13–24. [Google Scholar]
  35. Shi, Y. Modeling, Real-Time Degradation Identification, and Remediation of Pb-acid Batteries. Ph.D. Thesis, The Pennsylvania State University, University Park, PA, USA, December 2013; p. 73. [Google Scholar]
  36. Wang, W.B.; Yao, W.X.; Chen, W.; Chen, D.; Lu, Z.Y. characteristic charge transfer resistance of electrodes on lead-acid batteries. J. Electrochem. Soc. 2020, 167, 040515. [Google Scholar] [CrossRef]
  37. Brik, K.; Ammar, F.B. Causal tree analysis of depth degradation of the lead acid battery. J. Power Sour. 2013, 228, 39–46. [Google Scholar] [CrossRef]
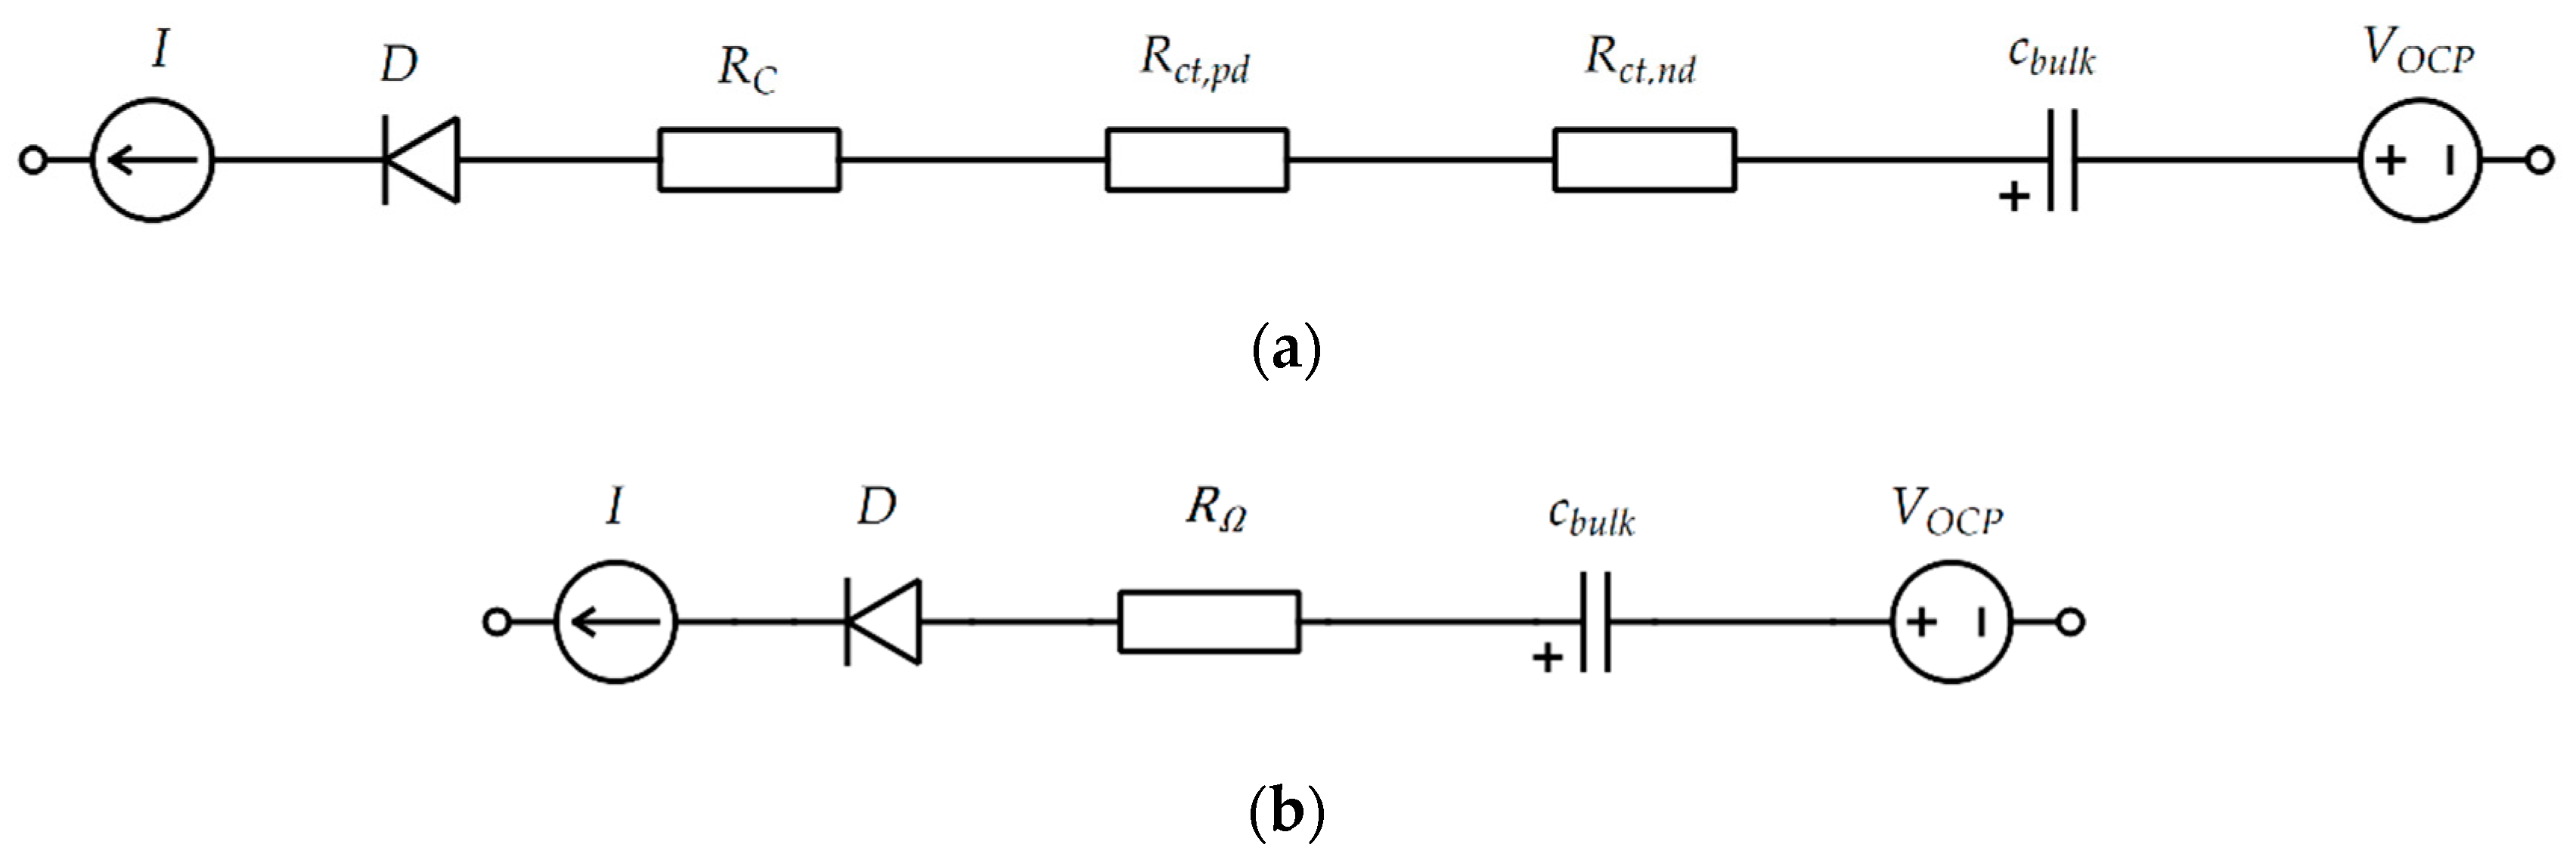
Figure 1. Equivalent discharge circuit models. (a) Typical DC-equivalent circuit model; (b) proposed Thevenin model.
Applsci 10 05760 g001
Figure 2. Deep-discharge curves of cell E-52# at the fourth experiment. (a) Measured points cited by algorithm; (b) fitting curve of proposed Thevenin model.
Applsci 10 05760 g002
Figure 3. Deep-discharge curves of cell E-52# at the third experiment. (a) Measured points cited by algorithm; (b) fitting curves of proposed Thevenin and CIEMAT models.
Applsci 10 05760 g003
Figure 4. Contacting resistances of parallel samples in aging experiments. (a) Measurements of contacting resistances of 70 °C tests; (b) measurements of contacting resistances of 55 °C tests.
Applsci 10 05760 g004
Figure 5. Deep-discharge curves of E-52# in 70 °C aging experiments. (a) First test; (b) second test; (c) third test; (d) fourth test; (e) fifth test; (f) sixth test; (g) seventh test.
Applsci 10 05760 g005aApplsci 10 05760 g005b
Figure 6. Battery capacities of parallel samples in 70 °C aging experiments. (a) E-52#; (b) E-11#; (c) E-20#; (d) E-02#.
Applsci 10 05760 g006
Figure 7. Internal resistances (rΩ) of parallel samples in 70 °C aging experiments. (a) E-52#; (b) E-11#; (c) E-20#; (d) E-02#.
Applsci 10 05760 g007
Figure 8. Electrolyte bulk capacitors (cbulk) of parallel samples in 70 °C aging experiments. (a) E-52#; (b) E-11#; (c) E-20#; (d) E-02#.
Applsci 10 05760 g008
Figure 9. Open-circuit voltages (VOCP) of parallel samples in 70 °C aging experiments. (a) E-52#; (b) E-11#; (c) E-20#; (d) E-02#.
Applsci 10 05760 g009aApplsci 10 05760 g009b
Figure 10. Morphology correction factors (ξ) of parallel samples in 70 °C aging experiments. (a) E-52#; (b) E-11#; (c) E-20#; (d) E-02#.
Applsci 10 05760 g010
Figure 11. Battery capacities of parallel samples in 55 °C aging experiments. (a) E-14#; (b) E-48#; (c) E-23#; (d) E-26#.
Applsci 10 05760 g011
Figure 12. Morphology correction factors (ξ) of parallel samples in 55 °C aging experiments. (a) E-14#; (b) E-48#; (c) E-23#; (d) E-26#.
Applsci 10 05760 g012
Table 1. Fitting errors of proposed Thevenin model.
Cell R 2 MBE RMSE
E-52# 01st0.9976−0.00040.0059
E-52# 02nd0.99770.00100.0058
E-52# 03rd0.9971−0.00060.0073
E-52# 04th0.9992−0.00490.0058
E-52# 05th0.9974−0.01280.0141
E-52# 06th0.9975−0.01290.0142
E-52# 07th0.9956−0.01310.0154
E-11# 01st0.9977−0.00190.0065
E-11# 02nd0.9981−0.00280.0062
E-11# 03rd0.9983−0.00310.0067
E-11# 04th0.9992−0.00620.0068
E-11# 05th0.9992−0.00770.0082
E-11# 06th0.9994−0.00480.0057
E-11# 07th0.9985−0.01090.0119
E-20# 01st0.9974−0.00370.0084
E-20# 02nd0.99560.00320.0117
E-20# 03rd0.99750.00590.0134
E-20# 04th0.9984−0.00960.0105
E-20# 05th0.9953−0.01440.0160
E-20# 06th0.9895−0.02060.0234
E-20# 07th0.9854−0.02190.0251
E-02# 01st0.9974−0.00260.0077
E-02# 02nd0.99500.00680.0159
E-02# 03rd0.99800.00510.0120
E-02# 04th0.9986−0.01000.0109
E-02# 05th0.9848−0.02330.0271
E-02# 06th0.9857−0.02090.0247
R2: correlation coefficient; MBE: mean biased error; RMSE: root mean square error.
Table 2. Fitting errors of estimations of internal resistances of proposed aging model.
Cell MBE RMSE
E-52#0.28 × 10−30.47 × 10−3
E-11#0.12 × 10−30.45 × 10−3
E-20#0.16 × 10−30.19 × 10−3
E-02#0.29 × 10−30.30 × 10−3
Table 3. Fitting errors of estimations of batteries capacity of proposed aging model.
Cell MBE RMSE
E-14#10.9315.01
E-48#16.4019.40
E-23#10.7113.07
E-26#11.5513.53