Article

Enhancing U-Net with Spatial-Channel Attention Gate for Abnormal Tissue Segmentation in Medical Imaging

Department of Electronics and Computer Engineering, Chonnam National University, 77 Yongbong-ro, Gwangju 61186, Korea
*
Author to whom correspondence should be addressed.
Appl. Sci. 2020, 10(17), 5729; https://doi.org/10.3390/app10175729
Submission received: 20 May 2020 / Revised: 13 August 2020 / Accepted: 17 August 2020 / Published: 19 August 2020

Abstract

:
In recent years, deep learning has dominated medical image segmentation. Encoder-decoder architectures, such as U-Net, can be used in state-of-the-art models with powerful designs that are achieved by implementing skip connections that propagate local information from an encoder path to a decoder path to retrieve detailed spatial information lost by pooling operations. Despite their effectiveness for segmentation, these naïve skip connections still have some disadvantages. First, multi-scale skip connections tend to use unnecessary information and computational sources, where likable low-level encoder features are repeatedly used at multiple scales. Second, the contextual information of the low-level encoder feature is insufficient, leading to poor performance for pixel-wise recognition when concatenating with the corresponding high-level decoder feature. In this study, we propose a novel spatial-channel attention gate that addresses the limitations of plain skip connections. This can be easily integrated into an encoder-decoder network to effectively improve the performance of the image segmentation task. Comprehensive results reveal that our spatial-channel attention gate remarkably enhances the segmentation capability of the U-Net architecture with a minimal computational overhead added. The experimental results show that our proposed method outperforms the conventional deep networks in term of Dice score, which achieves 71.72%.

1. Introduction

Semantic image segmentation is one of the most desirable and difficult tasks to analyze medical images. Segmenting a target object in a medical image is important to diagnose and treat various diseases. In clinical practice, manual annotation is still popular for analyzing medical images, but there are some disadvantages, including that it is a time-consuming process that is easily prone to errors. Therefore, precise, faithful, and automatic segmentation is mandatory for improving clinical workflows and supporting quick decision-making for patient treatments.
Recently, deep learning approaches, such as convolutional neural networks (CNNs), have been used to obtain an advanced performance in image classification and segmentation [1,2,3,4,5,6]. These networks are composed of layers that can learn the understructure of the information from the data with multiple levels. Deep learning approaches can save time and effort by effectively extracting features by themselves since the features that compose these layers are learned from the data and do not need to be designed by a human. CNNs have achieved promising results in medical analyses including for brain tumor segmentation [7], liver tumor segmentation [8], pancreas segmentation [9], and in computer-aided diagnostic applications [10].
For medical image segmentation, an encoder-decoder architecture network, such as U-Net, is a popular choice [11]. These networks are commonly composed of a downsampling sub-network that captures the high-level features of the images and an upsampling sub-network that rebuilds a pixel-wise segmentation from these high-level features. By using skip connections at multiple scales, they can produce dense predictions in multi-levels. However, despite their strong power of representation, the use of skip connections tends to use redundant information in likable low-level encoder features in a multi-scale approach. Furthermore, the contextual information of the encoder feature at the beginning of the network is insufficient, leading to poor performance for pixel-wise recognition when concatenating with the corresponding high-level decoder feature map.
To overcome such above problems, we propose the spatial-channel attention gate (scAG), a novel framework that resolves the weakness of plain skip connection in the segmentation task. It introduces an attention mechanism to emphasize meaningful information along the channel dimension and spatial dimension of the features that are beneficial for segmentation. Specifically, we integrate two-component attention gates into the skip connections of the encoder feature and the corresponding decoder feature of the U-Net model. One is a spatial attention gate (sAG) and the other is a channel attention gate (cAG). By incorporating scAG into a standard encoder-decoder U-Net, the intermediate feature maps from the downsampling path are supposed to be more efficiently utilized to solve the segmentation tasks. sAG automatically concentrates on the region of interest, while cAG automatically learns the representation meaning of the region without additional supervision. The encoder-decoder architecture integrated scAG can be trained end-to-end in a similar way as popular CNNs models. Comprehensive experiments with various medical datasets prove that scAG provides promising results in segmentation tasks.
In this research, we tackle the limitations of the U-Net architecture in medical image segmentation. Our contributions are described, as follows:
(1)
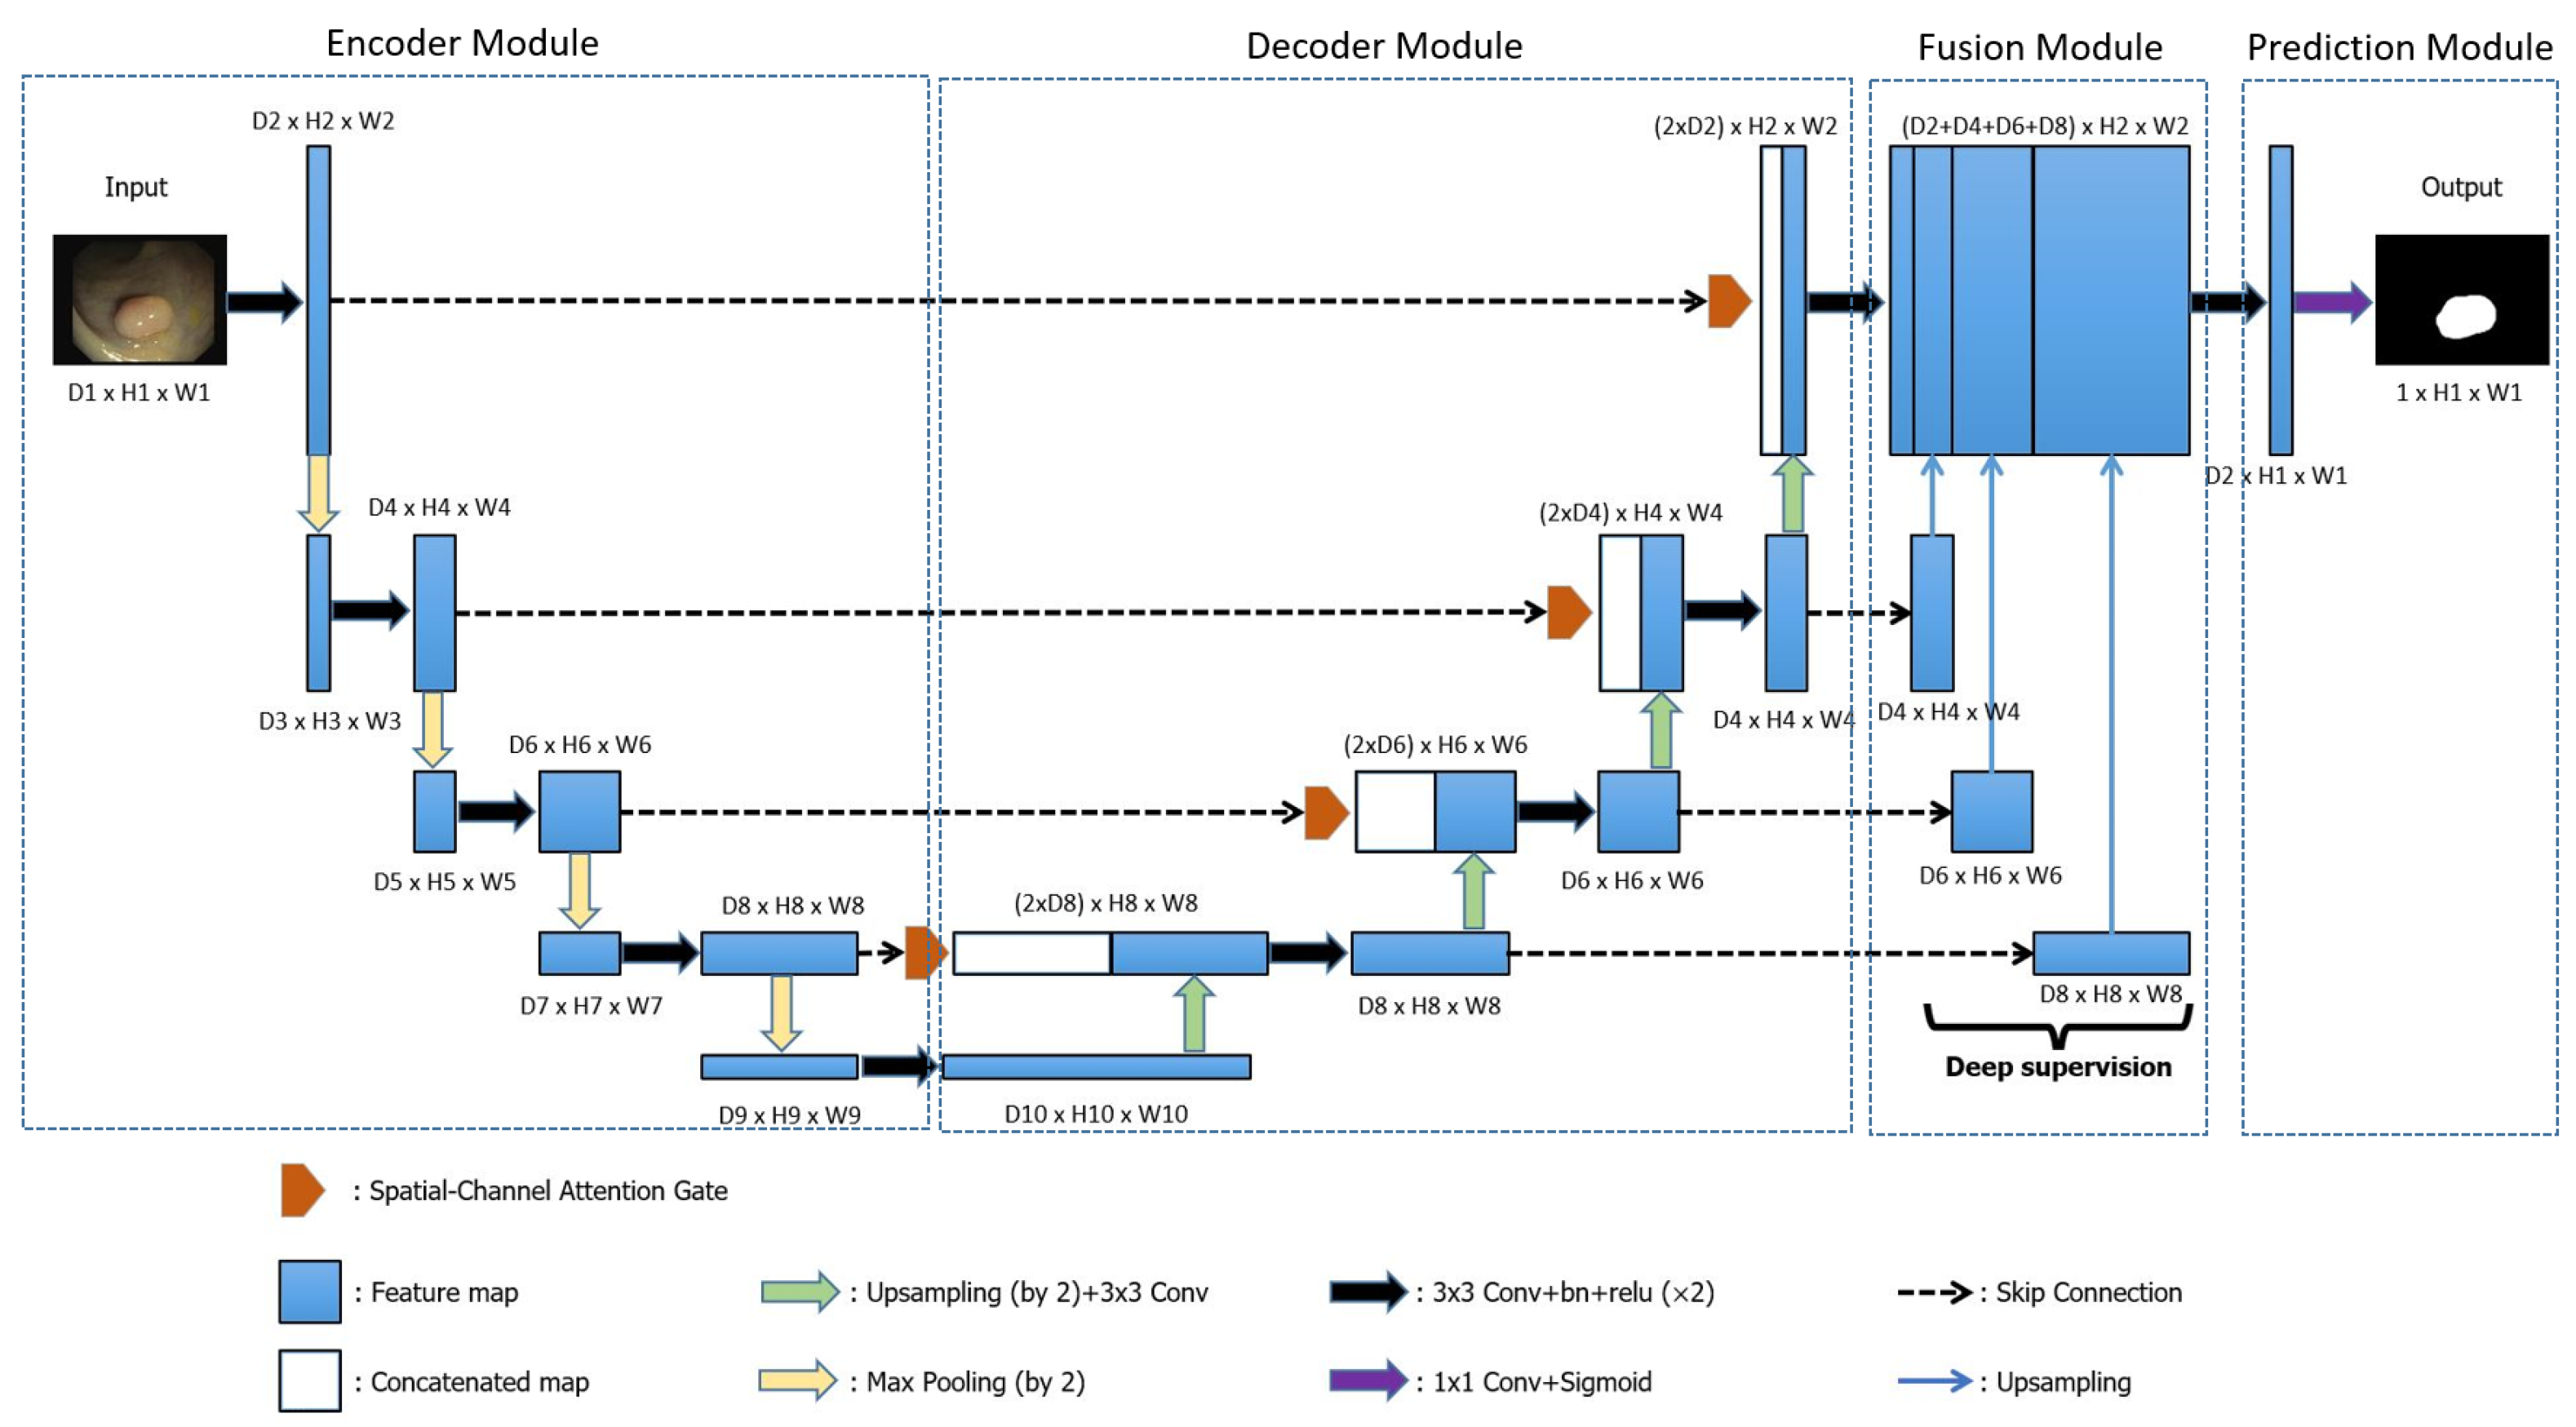
We attempt to explore the advantages and disadvantages of the popular encoder-decoder U-Net architecture. We then propose a novel spatial-channel attention gate (scAG) while using attention mechanisms to reduce the weakness while maximizing the advantages of using skip connections.
(2)
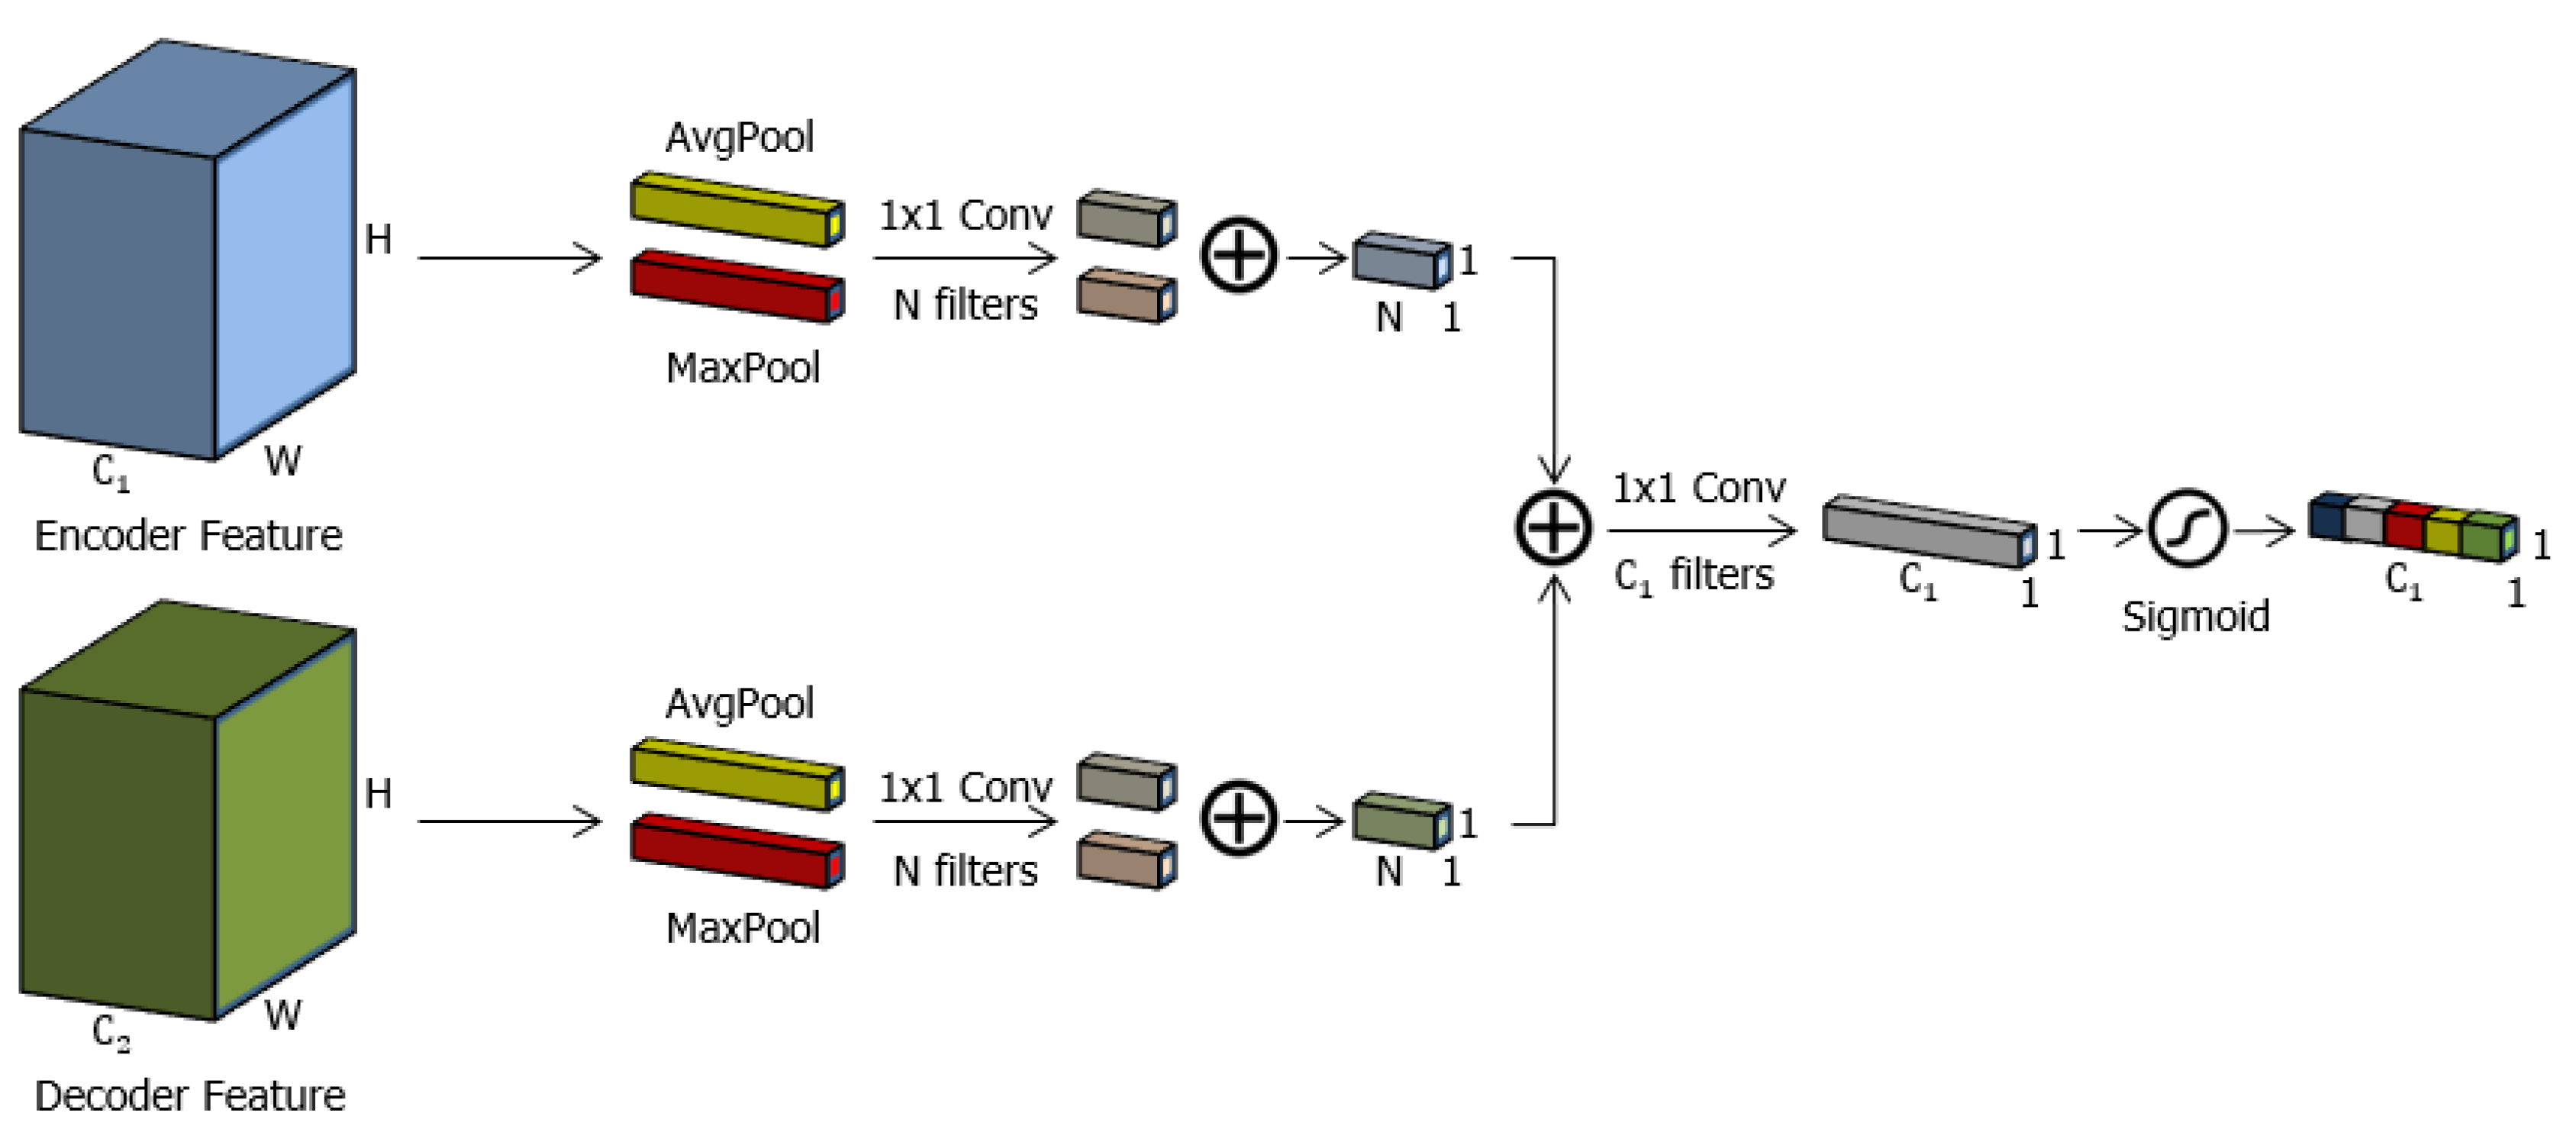
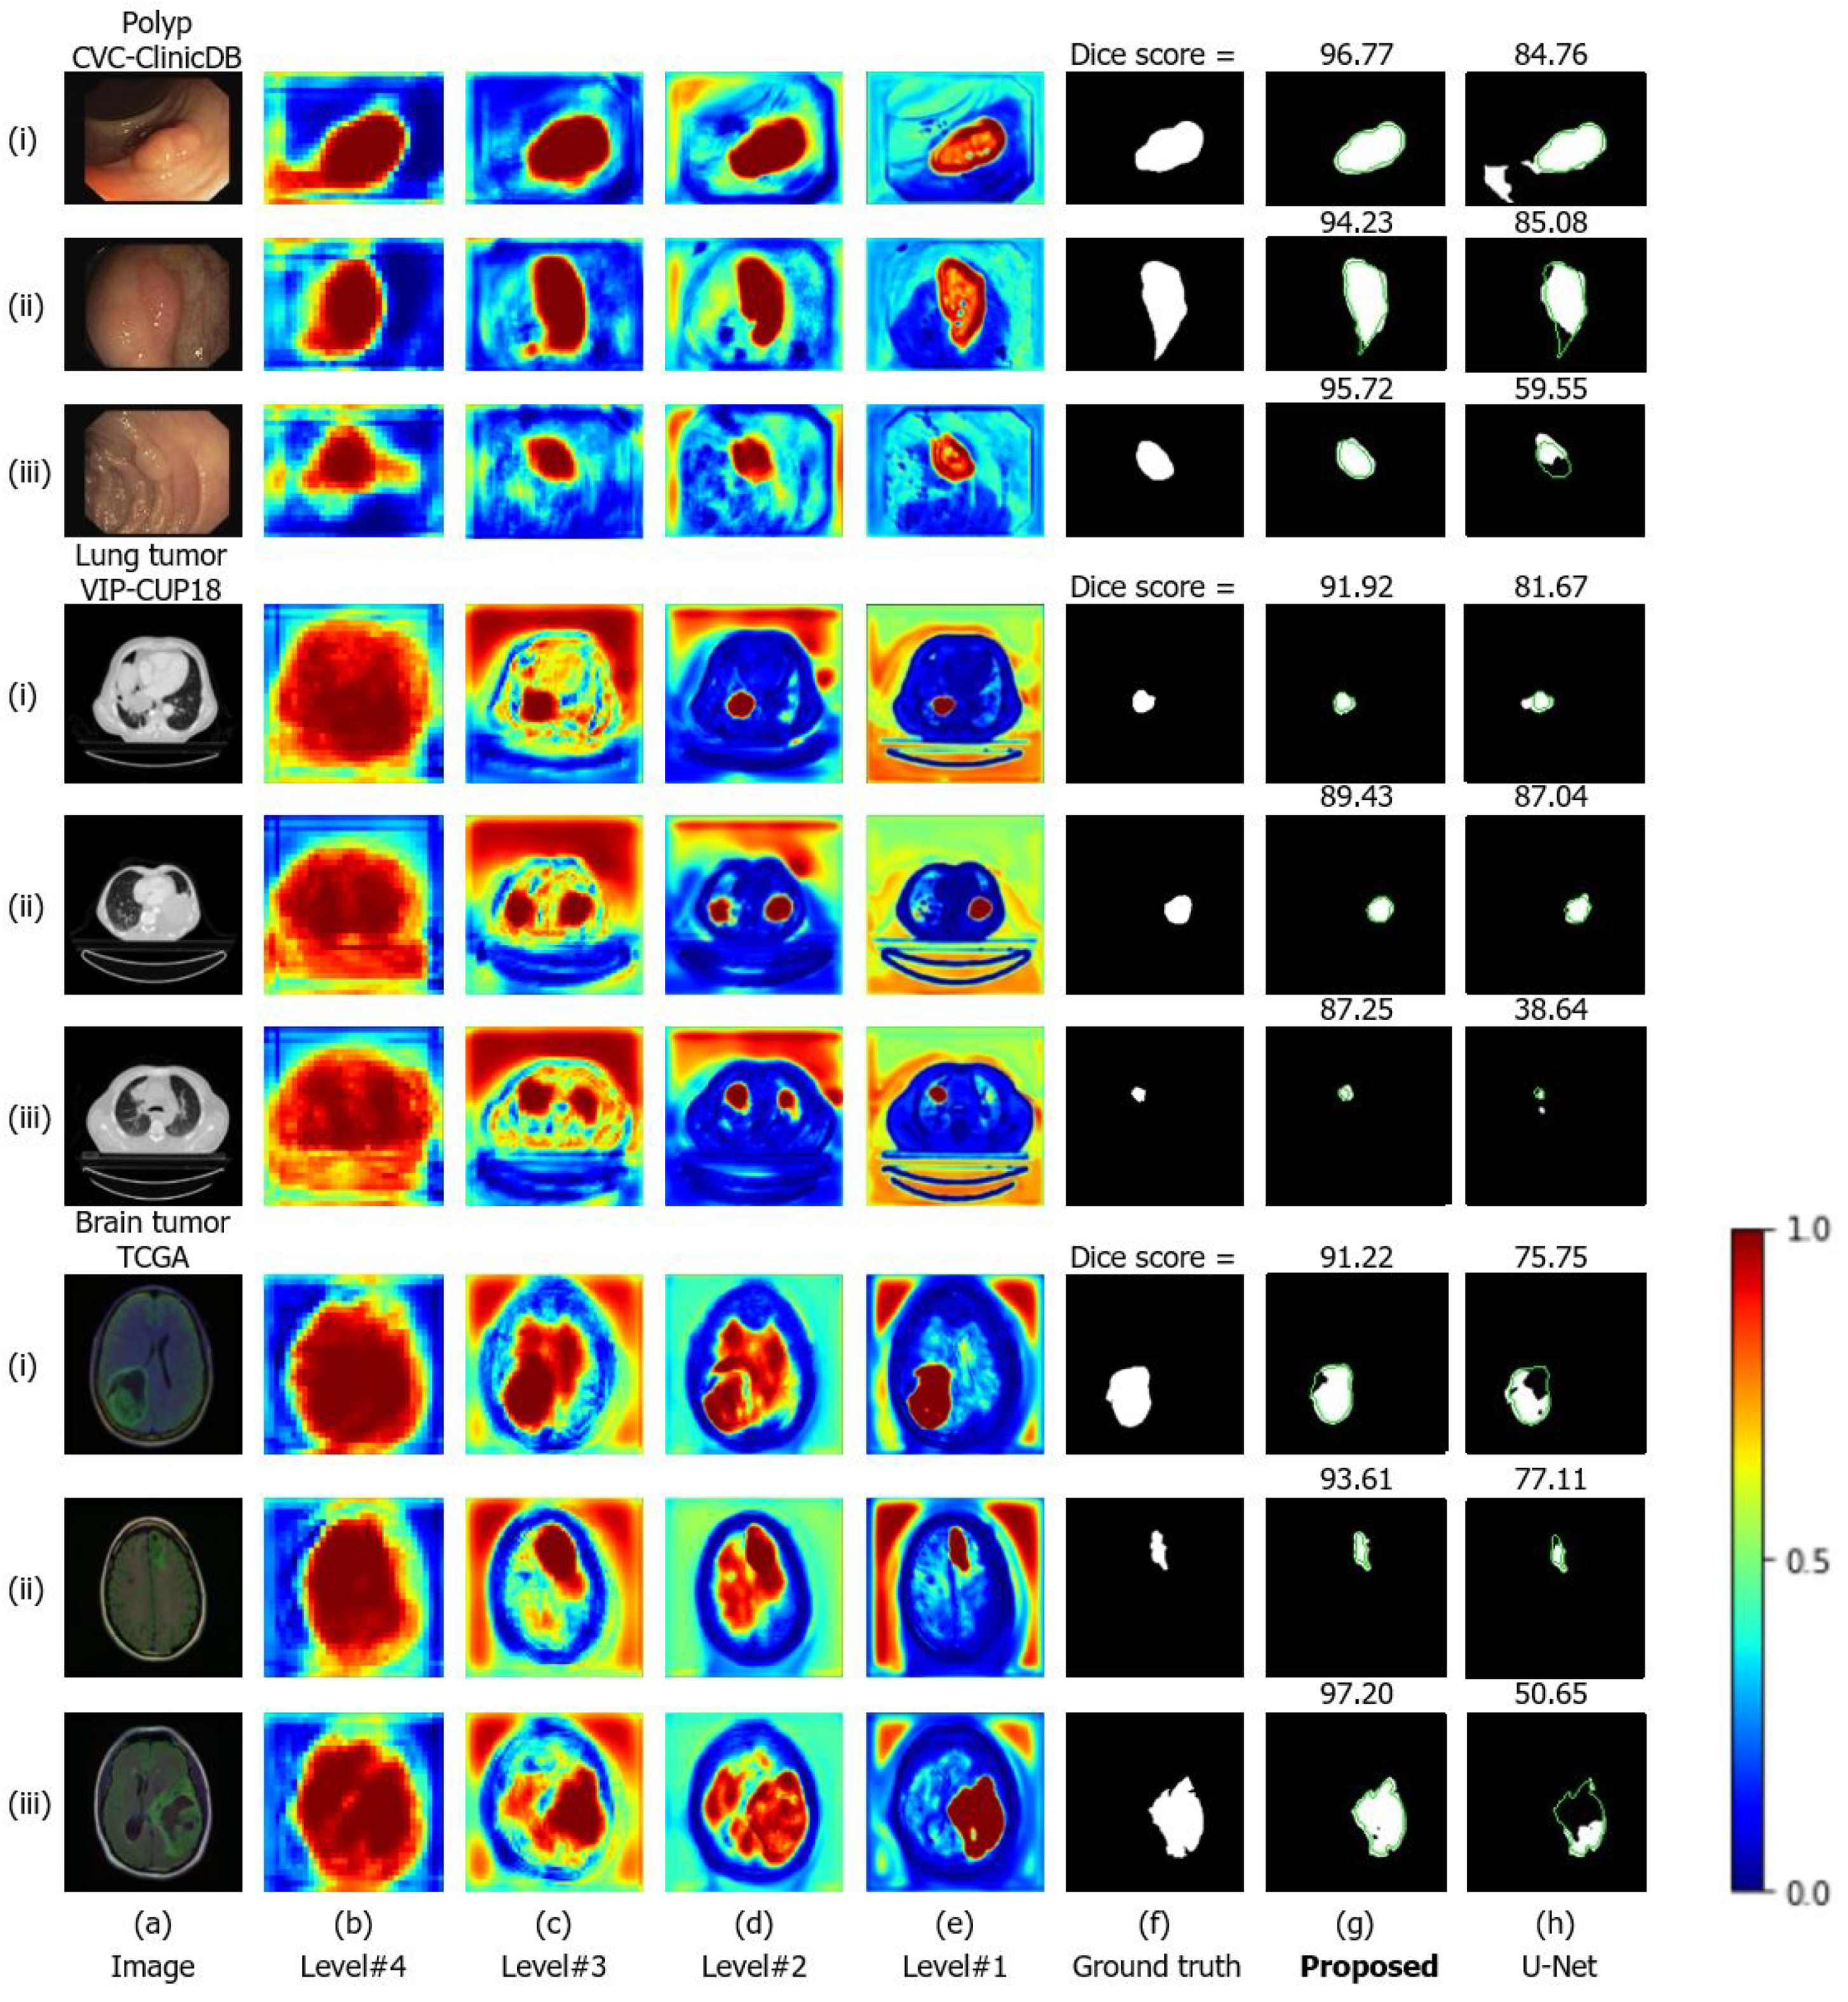
The proposed scAG combines two components: the spatial attention gate (sAG) and channel attention gate (cAG). sAG automatically concentrates on ’where’ is the region of interest while cAG automatically learns ’what’ is the meaningful representation of the given feature. It significantly suppresses the drawbacks of the plain skip connections in U-Net models, thus improving the segmentation results.
(3)
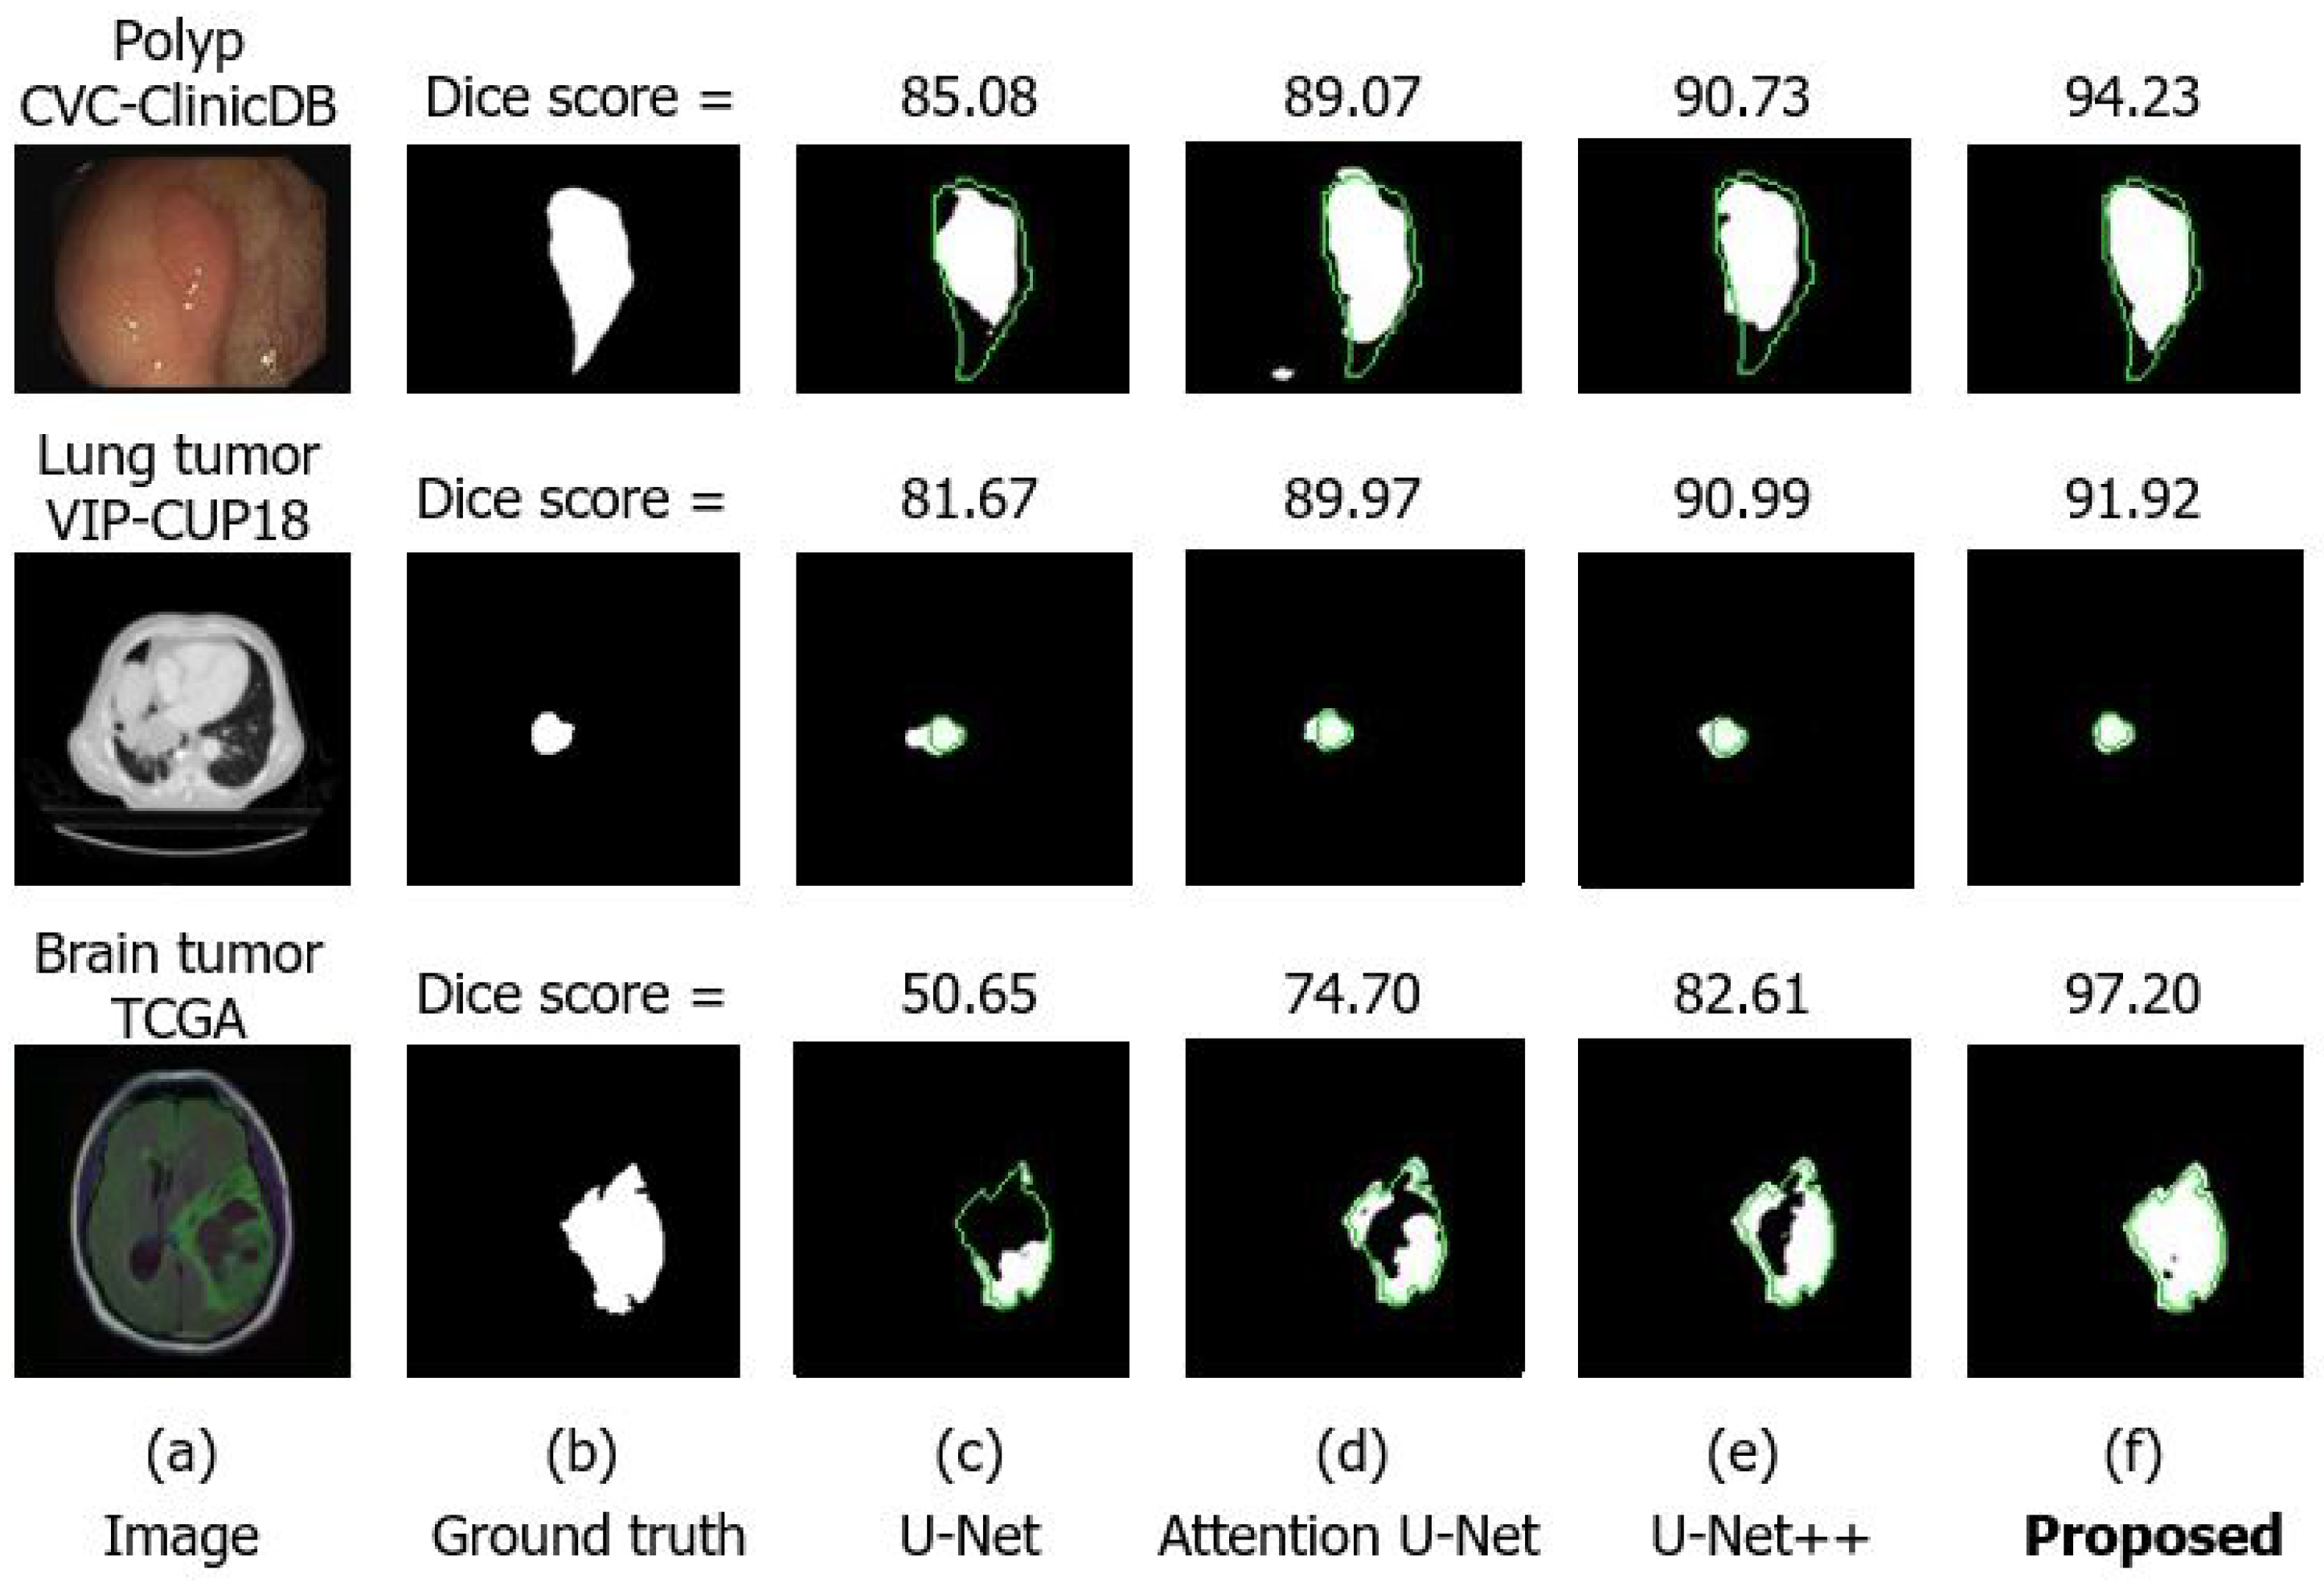
Our proposed method achieves superior results when compared with reference state-of-the-art methods on three types of medical images.
The remainder of the paper is organized, as follows. In Section 2, we provide an overview of the segmentation models and some related literature using the attention mechanism. Section 3 represents our proposed scAG. Section 4 describes the datasets and comprehensive experiments to demonstrate the potential power of our scAG. The conclusion is finally presented in Section 5.

2. Related Works

2.1. Segmentation Model

A common task in medical image analysis is to detect and segment pathological regions that are present in the image. In recent research, CNNs have been successfully applied to automatically segment two-dimensional (2D) and three-dimensional (3D) biological data [11,12,13,14]. U-Net uses an encoder-decoder architecture and it is one of the most popular networks for segmentation [11]. The U-Net network has become a popular for segmentation of medical images due to its multi-scale skip connections and learnable up-convolution layer. The valuable addition of U-Net is the introduction of skip connections that concatenate the encoder features with the corresponding decoder features for further successful calculations. By combining the location information from the encoder path and contextual information from the decoder path, general information that is obtained is necessary to achieve a good segmentation map, thus increasing the performance of the networks.
Based on this idea, some extension networks have been proposed to better deal with semantic segmentation problems. In [15,16], the authors presented a powerful architecture called U-Net++ in which encoder and decoder sub-networks are connected through a series of nested and dense skip pathways. This network has been demonstrated to be effective when compared to a standard U-Net but it involves a massively computational costs due to the large number of intermediate convolutions. In [17,18], the authors proposed Attention U-Net to leverage salient regions in medical images. Through an integrated attention gate, Attention U-Net can automatically focus on relevant regions for the segmentation tasks. However, Attention U-Net lacks focus of the semantic concepts where there is still a large semantic gap between the encoder and the decoder feature map. It does not have deep supervision module. Thus, it cannot capture different level features at decoder path. Therefore, we try to propose a method that can be useful in an encoder-decoder U-Net architecture.

2.2. Attention and Gating Mechanism

Several recent attempts have been made using attention mechanisms to increase the capabilities of CNNs in various vision tasks, including classification [19], detection [20], segmentation [21], image captioning [22], and visual question answering [23]. Attention mechanisms guide the model to emphasize the most salient features, avoiding useless features that are beneficial for specific tasks. Wang et al. [19] proposed a Residual Attention Network using non-local self-attention mechanisms to capture long-range dependencies. Hu et al. [24] introduced the Squeeze-and-Excitation method that uses global average pooling to compute the channel-wise attention to highlight useful channels, outperforming other methods in ILSVRC 2017 image classification. Woo et al. [25] present attractive research, called Convolutional Block Attention Module (CBAM), a self-attention method to aggregate spatial and channel information for effective feature refinement.
For specific semantic segmentation tasks using an encoder-decoder network, there are interesting studies that can incorporate attention to improve the capabilities of the network. Jo et al. [17,18] proposed attention gate modules (AG) that are incorporated into the skip connections of the encoder-decoder network, using the information of the decoder feature to better guide information to the encoder feature. Li et al. [21] proposed a Global Attention Upsample (GAU) method that performs global average pooling of the high-level features from the decoder path to supply contextual information to introduce the corresponding encoder to recognize context details. AG is designed to focus on spatial information, but it lacks channel information, while GAU is designed to concentrate on the channel concept, but does not care about the spatial concept. Therefore, we propose a method that can take both useful spatial and channel information to address these limitations.

3. Proposed Method

In this section, we introduce an overview of our proposed spatial-channel attention gate method (scAG). We then describe the two components, the spatial attention gate (sAG) and channel attention gate (cAG), which respectively focus on the information from the spatial and channel dimensions. Finally, we describe the aggregation of both for further refinement.

3.1. Overview and Motivation

The core idea of U-Net is to gradually fuse high semantic but coarse spatial decoder feature maps with the corresponding low semantic but fine spatial encoder feature maps. It provides location information from the encoder path to the decoder path in an attempt to recover the details of the spatial information that are lost by the max pooling operation.
However, the working mechanism for U-Net still exhibits limitations and needs further investigation. First, multi-scale skip connections tend to use unnecessary information and computational sources where likable low-level encoder features are repeatedly used at multiple scales. When considering that low-level encoder features have rich spatial details, if the fusion mechanism can concentrate on the salient spatial region of the encoder feature, the network can recover fined-grained detail from the semantic results. Second, contextual information from the encoder feature is insufficient, leading to poor performance for pixel-wise recognition when concatenating the corresponding high-level decoder features. Because there are different semantic gaps between low-level encoder feature and the corresponding high-level decoder features, concatenating the two incompatible features will adversely affect the prediction procedures. The fusion between the encoder and decoder features could be more effective by increasing more semantic information into the low-level encoder features.
Inspired through the above observations, we propose a novel spatial-channel attention gate (scAG) that aims to overcome the drawbacks of the working mechanism of U-Net. Our proposed model consists of four modules: encoder module, decoder module, fusion module and prediction module as shown in Figure 1. The input image is directly fed into the encoder module. The decoder features are generated by multiplying the encoder features with spatial-channel attention gate (scAG) and then concatenating with the corresponding decoder features. All of the decoder features are fused and then put into prediction module to predict abnormal tissue. scAG can adaptively boost location information and semantic information in the naive skip connection, leading to better segmentation results. The proposed scAG includes two types of attention modules that address the following aspects. (1) To guide the model to focus more on the spatial, detailed structure of an important region, we propose the spatial attention gate (sAG), and (2) to increase the contextual information into the low-level encoder feature, decreasing the semantic gap between the encoder and decoder features, we suggest the channel attention gate (cAG).
Our proposed scAG stands in contrast to plain skip connections that lead to a combination of incompatible feature maps. Instead of a direct feed-forward of the low-level encoder feature to the corresponding high-level decoder feature, we propose scAG to be integrated into the skip connection, as illustrated in Figure 1. The scAG can obtain information from both the encoder and decoder feature maps to generate attention values that will be multiplied with encoder features to refine them before fusing with the corresponding decoder features.
Given the features from the encoder and the corresponding features from the decoder, which have sizes of F e R C 1 × H × W and F d R C 2 × H × W , respectively, where C 1 , C 2 denote the number of channels and H, W correspond to height and weight of the feature map. scAG will construct a spatial attention map M s R 1 × H × W and channel attention map M c R C 1 × 1 × 1 , as depicted in Figure 2 and Figure 3. The progress of refining the encoder features (Figure 4) can be summarized as:
F e = F e M s ( F e , F d ) M c ( F e , F d )
where ⊗ denotes element-wise multiplication, and the spatial attention map M s , and channel attention map M c are copied along the channel dimension and spatial dimension, respectively, resulting in the same sizes as the input feature map. The details of the channel and spatial attention gate are as follows.

3.2. Spatial Attention Gate (sAG)

Naïve skip connections [11] just concatenate the encoder and decoder features, so it is a waste computational resources and redundant information is produced, since the model cannot recognize where an object is located. Because the encoder feature has rich location information, it is better to focus on salient region that are beneficial to find the location of the object and determine the target structure of the object. The proposed sAG aims to provide insight into ’where’ is an important region to predict and segment an object. The spatial attention map is constructed based on the interrelation between the spatial information that focuses on the salient regions.
As illustrated in Figure 2, the spatial attention map is a combination of spatial information from both encoder and decoder features. To compute the spatial attention map in each encoder and decoder feature, we first apply average pooling, max pooling, and 1 × 1 convolution through the channel dimension and then concatenate them to construct a capable feature representation. Applying the average pooling and max pooling through the channel dimension, inspired by [25], and applying a 1 × 1 convolution, inspired by [26,27], are effective to represent the important information. We then apply a convolution layer on the concatenated features to produce a spatial attention map M s ( F ) R 1 × H × W that highlights the salient region. The above process is applied for each encoder and decoder feature separately. Finally, we summarize the spatial attention map from the encoder feature and decoder feature to compute the final spatial attention map. The detailed operations are shown below.
We aggregate information along the channel dimension of each encoder and decoder feature by utilizing pooling and a 1 × 1 convolution operation. F a v g s R 1 × H × W , F m a x s R 1 × H × W , and F 1 × 1 s R 1 × H × W denote the map generated from average pooling, max pooling and 1 × 1 convolution, respectively. Those generated maps are concatenated, and then a convolution is applied with a large kernel size 7 × 7 (a large kernel size is effective to capture long-range contextual information [25]) to generate the spatial attention map. M s e ( F e ) and M s d ( F d ) denote the generated spatial attention maps of the encoder and decoder features, respectively. The final spatial attention map M s ( F e , F d ) is calculated by applying a sigmoid function on the summation of M s e ( F e ) and M s d ( F d ) .
M s e ( F e ) = F 1 7 × 7 ( [ A v g P o o l ( F e ) , M a x P o o l ( F e ) , F 1 1 × 1 ( F e ) ] ) = F 1 7 × 7 ( [ ( F e ) a v g s , ( F e ) m a x s , ( F e ) 1 × 1 s ] )
M s d ( F d ) = F 1 7 × 7 ( [ A v g P o o l ( F d ) , M a x P o o l ( F d ) , F 1 1 × 1 ( F d ) ] ) = F 1 7 × 7 ( [ ( F d ) a v g s , ( F d ) m a x s , ( F d ) 1 × 1 s ] )
M s ( F e , F d ) = σ ( M s e ( F e ) + M s d ( F d ) )
where f b a × a denotes the b filters of the a × a convolution, and σ indicates the sigmoid function.

3.3. Channel Attention Gate (cAG)

Although the low-level encoder features are rich in detailed spatial information, they still lack semantic information. Due to this large gap in semantic concepts, a naive fusion of low-level encoder and high-level decoder features adversely affects the prediction procedure. A natural way to overcome this problem is to include more semantic concepts into low-level features, thus fusing becomes more effective. cAG is proposed in order to support ’what’ is meaningful given an input feature. The channel attention map is constructed based on interdependencies between the channels of the convolutional features, which focus on meaningful discrimination of the features [28].
The channel attention map is a combination of channel information from both the encoder and decoder features, as illustrated in Figure 3. The low-level encoder feature itself includes poor semantic information while the high-level decoder feature contains rich semantic information that can be used to support a low-level encoder feature to capture semantic dependencies. Therefore, improving the contextual information of the low-level encoder feature makes it easier to ensure effectual fusion. First, in each encoder and decoder feature, we squeeze spatial features by utilizing average pooling and max pooling simultaneously, as inspired by [25]. Second, we apply N 1 × 1 convolutions on the squeezed feature, where each 1 × 1 convolution has a role of capturing the dependencies of the channels to generate the squeeze channel attention map. In our method, N is assigned the value equal to 1 / 16 of C 1 , which is the number of channels of the encoder feature, to reduce the parameter overhead. Finally, we apply C 1 1 × 1 convolutions on the summarized encoder squeeze channel attention map and decoder squeeze channel attention map to construct the final attention map. The detailed operations are described below.
We aggregate information along spatial dimension of each encoder and decoder feature map by using the pooling operation. F a v g c R C × 1 × 1 and F m a x c R C × 1 × 1 denote the map generated from average pooling and max pooling, respectively. Those generated maps are then forwarded to the shared N 1 × 1 convolutions to produce a squeeze channel attention map. After the shared N 1 × 1 convolution operation, we combine the output attention by applying element-wise summation. M c e ( F e ) and M c d ( F d ) denote the generated squeeze channel attention map of the encoder and decoder features, respectively. The summation of M c e ( F e ) and M c d ( F d ) was forwarded to C 1 1 × 1 convolutions, and then a sigmoid function is applied in order to obtain the final channel attention map M c ( F e , F d ) . In short, the channel attention map is computed as:
M c e ( F e ) = F N 1 × 1 ( A v g P o o l ( F e ) ) + F N 1 × 1 ( M a x P o o l ( F e ) ) = F N 1 × 1 ( ( F e ) a v g c ) + F N 1 × 1 ( ( F e ) m a x c )
M c d ( F d ) = F N 1 × 1 ( A v g P o o l ( F d ) ) + F N 1 × 1 ( M a x P o o l ( F d ) ) = F N 1 × 1 ( ( F d ) a v g c ) + F N 1 × 1 ( ( F d ) m a x c )
M c ( F e , F d ) = σ ( F C 1 1 × 1 ( M c e ( F e ) + M c d ( F d ) ) )

3.4. Spatial-Channel Attention Gate (scAG)

sAG and cAG are complementary, where sAG focuses on spatial concepts and cAG concentrates on channel concepts. Therefore, in order to take full advantage of both attention gates, we multiply the input feature with a spatial attention map and channel attention map to construct the final refined features. The refined features are then incorporated with decoder features for further calculation. Figure 4 depicts the combination of the information from the two attention gates.

4. Experimental Results and Discussion

4.1. Datasets

The effectiveness of our proposed method is evaluated with comprehensive experiments that were conducted on three medical datasets, as depicted in Table 1. Some examples of three dataset are shown in Figure 5. The comprehensive results reveal that our scAG can effectively increase the segmentation performance though an added small fraction for the model complexity.

4.1.1. Colonoscopy Images (CVC-ClinicDB)

We have used a colonoscopy image CVC-ClinicDB [29] dataset for our experiments. This dataset contains 612 polyp images and the corresponding ground-truth images are taken from 29 colonoscopy videos. The images are resized to 256 × 192 pixels from the original 384 × 288 pixels, which is convenient in terms of computational resources.

4.1.2. Lung Tumor Images (VIP-CUP18)

The lung tumor image dataset is provided by the 2018 IEEE Video and Image Processing Cup (VIP-CUP18) [30]. It includes computed tomography (CT) scans of 300 patients with a varying number of slices for each patient, where each slice is manually annotated by a radiation oncologist. Because the data are provided in the DICOM format, we have to convert the DICOM file from voxels to world-coordinates and then normalize the data to generate 512 × 512 pixel images. Only slices containing tumors have been examined with a total of 5204 images. This dataset was resized to 256 × 256 pixels due to limitations in the computational resources.

4.1.3. Brain Tumor Images (TCGA)

The brain tumor image dataset contains brain magnetic resonance imaging (MRI) together with manual fluid-attenuated inversion recovery (FLAIR) abnormality segmentation masks. The images were obtained from The Cancer Imaging Archive (TCIA). They correspond to 110 patients included in The Cancer Genome Atlas (TCGA) lower-grade glioma collection with at least FLAIR sequence and genomic cluster data available [31]. This dataset contains 1373 brain images with a resolution of 256 × 256 pixels.

4.2. Network Architecture

In our experiments, we conducted experiments with the standard U-Net. The U-Net model includes four blocks of the encoder path, one bottleneck layer, four blocks of the decoder path, and a classification layer at the end of the network. Each block had a sequence of two 3 × 3 convolutional operations with a batch-norm layer and ReLU activation following. At the end of the network, a 1 × 1 convolution operation with sigmoid activation is applied in order to generate the final segmentation map. The filter numbers of the encoder and decoder layer are 32, 64, 128, 256, and that for the bottleneck layer, is 512.
Figure 1 describes how to integrate our proposed scAG to the baseline U-Net. Similar to the works in [32,33], we utilize deep supervision [34] that allows for more direct back propagation to the hidden layers for faster convergence and better accuracy. Using deep supervision forces the attention map at the intermediate features to be eagerly discriminative at each specific level, thus improving the performance of the model.

4.3. Training and Implementation

The experiments are implemented using the Pytorch framework. All of the models were optimized via the Adam optimizer [35] with a learning rate of 0.0001 , batch size of 8. The datasets are splited into two set: training set and validation set with the ratio of 8:2. The Dice overlap coefficient was adopted as a regional loss function [12]. The Dice score is not only a measure of how many positives are found, but it also penalizes for the false positives, similar to precision. Thus, it is more similar to precision than accuracy. The only difference is the denominator, where the true positives are replaced by the total number of positives. The Dice score is also penalizing for the false positives. We did not incorporate any transfer learning or use any data augmentation in order present a fair evaluation. Furthermore, the average results from 5-fold cross-validation were used as the overall performance of our proposed method. The models are trained until they cannot achieve further improvement. In this research, we adopt the Dice similarity coefficient, Precision, and Recall as evaluation metrics to validate the effectiveness of the proposed method. Three metrics described in the formulas:
D i c e s c o r e = 2 × | X Y | | X | + | Y |
where ∩ denotes the intersection operator, X and Y are the predicted segmented and ground-truth, respectively.
P r e c i s i o n = T P T P + F P
R e c a l l = T P T P + F N
where TP is score of identifying ground truth pixels exactly, FP is score of failing in identifying ground truth pixels, and FN is score of failing in identifying background pixels into ground truth pixels.

4.4. Experimental Results

We conducted comprehensive experiments in order to evaluate scAG using the three datasets described above. We also investigate the combination of a spatial-channel attention gate as well as to separate each attention gate. We further compare the performance of our scAG for self-attention methods as well as attention gate methods in medical segmentation tasks.

4.4.1. Ablation Studies

In this subsection, we experimentally show the effectiveness of our design choice. We utilize the CVC-ClinicDB dataset to train and compare the performance of variants of channel attention and spatial attention. We sequentially combine the spatial and channel modules. We only change the reduction ratio of channel attention module, the size of kernel and the 2D descriptor of spatial attention module.
Channel attention: we utilize both of pooling methods ( max-pooling and average pooling) to share information. Subsequently, we apply standard 1 × 1 convolution to reduce the number of channel. Finally, we add both of them to yield the channel attention module. We compare the effectiveness of the reduction ratio that conducts on three ratios: 16, 8, and 2.
Table 2 shows the experimental results. We observe that the dice score and recall score achieve best performance on ratio of 16 as compared to other ratios. In this experiment, we concentrate on Dice metric so that we choose ratio of 16 for getting best performance on Dice score.
Spatial attention: to generate a 2D spatial attention map, we first apply a convolution layer that encodes information obtained from raw feature map. Subsequently, we utilize max-pooling, average pooling, or standard 1 × 1 convolution. Finally, we use Sigmoid function to normalize the spatial map. We compare the effectiveness of a kernel size that conducts on four kernel sizes: 7, 5, and 3. In addition, we also investigate on concatenating or using only one of three modules: max-pooling, average-pooling, and 1 × 1 convolution.
Experimental results with different ratios are shown in Table 3. I find that the combination of pooling modules and standard 1 × 1 convolution achieves better performance. Max-pooling extracts the most salient information, average-pooling encodes global statistics softly, and 1 × 1 convolution slightly improves accuracy in the context of deep axis. Additionally, we also observe that the dice score and recall score of kernel size of 7 are higher than other kernel sizes. Inclusion, we use the joint of all three modules and a convolution with kernel size of 7 to generate spatial attention map.

4.4.2. Comparison with Other U-Net Architectures

We evaluate our proposed method with state-of-the-art U-Net architectures in semantic segmentation tasks, such as Attention U-Net [17,18] and U-Net++ [15,16]. For experiments on the CVC-ClinicDB dataset, the baseline U-Net yields a dice coefficient of 65.93%. In Table 4, Attention U-Net and U-Net++ achieve accuracy of 67.57% and 68.89%, respectively. Our proposed scAG boosts performance to 73.31%, which increases an approximately seven-point gap when compared to the standard U-Net model though adding small parameters, as shown in Table 4. Besides, for the lung tumor dataset provided by VIP-CUP, our proposed scAG shows a dice coefficient of 56.26% and also outperforms the Attention U-Net and U-Net++ with a performance of 53.15% and 54.66%, respectively. For the brain dataset from TCGA, our proposed scAG still surpasses Attention U-Net and U-Net++ with a dice score of 85.83%. Attention U-Net was designed using the attention gate model, which is beneficial for locating the target object, but lacks focus on different semantic information between the encoder and decoder features. U-Net++ was proposed by redesigning the dense skip connection to alleviate the gap semantic between the encoder and decoder features, and it thus offers better segmentation results. By capturing useful information from both spatial and channel information using scAG, our proposed U-Net outperforms other state-of-the-art U-Net architectures.
In Table 5, the inference time is presented between other U-Net architectures and our proposed. These models were trained and tested on Intel i7-4790 CPU and Nvidia GTX 1070 GPU. The GPU handled procedures related to CNN. The latency of our proposal takes more than 2.3 times, 1.5 times, and 1.2 times compared to U-net, Attention U-net and U-net++ architecture, respectively. Although the scAG takes more time to extract rich location information of objects and semantic information, it is not considerable to be utilized for real-time segmentation systems. There is a trade-off between speed and accuracy, better speed is lower accuracy, and vice versa.
Representative results are also depicted in Figure 6. For example, in polyp segmentation, U-Net manages to segment the polyp with a low-level performance with a poor shape of the segmentation. By focusing on salient regions, the shape result of the Attention U-Net looks better, but it still is not good enough. By using the dense skip connection at different scales, U-Net++ has created rough boundaries of the segmentation. Our proposed method generates superior result with a reasonable shape similar to the ground truth. With a small tumor of the lung dataset, U-Net fails to predict the fine shape of the tumor. Although Attention U-Net and U-Net++ have a competitive Dice score of 89.97%, 90.99% as compared to 91.92% of our proposed method, their segmentation results still have worse shapes than ours when comparing with ground truth. For the brain example of the TCGA dataset, standard U-Net seems to poorly under-segment the tumor. Attention U-Net though has a good shape in its prediction, but it still lacks semantic information to fully predict tumor. The predicted result is almost identical to the ground truth by enhancing the feature representation using scAG.

4.4.3. Combining the Spatial and Channel Attention Gate

We investigate the combined strategy of sAG and cAG. We present results on the CVC-ClinicDB dataset for polyp segmentation. Table 6 reported the performance of separate attention gates and combined attention gates and the number of parameters in the models. Remarkably, by integrating our proposed method to the baseline U-Net, the model complexity increases a very small fraction with only 0.22% of the parameters more. We observe that all attention gate methods boost the segmentation performance when integrated into the standard U-Net. The inclusion of sAG improves the performance over the baseline U-Net model, and integrating cAG is even more effective. The aggregation of both produces the best results when combining both sAG and cAG (i.e., our scAG).
Figure 7 shows empirical results to identify the contribution of sAG and cAG. We can observe that sAG helps the model to better localize and refine the structure of the target object, but it still lacks semantic information. In contrast, cAG boosts the semantic concepts, but fails to refine the shape of the object. However, combining both provides the advantages of these behaviors and produces superior results.

4.4.4. Self-Attention for the Encoder Feature Map

We also investigate the effects of self-attention only on the low-level encoder feature itself. We conducted an experiment with the CVC-ClinicDB dataset. Table 7 reports the Dice coefficient for self-attention on the encoder feature map and our scAG, which obtains information for both the encoder and decoder feature map. We observe that only self-attention in the encoder feature can improve the performance over a classical skip connection in U-Net, but our scAG is even more effective. An explanation of the superior performance of scAG is its ability to seize useful information from the high-level decoder feature in order to guide the low-level encoder feature, while self-attention only on the encoder feature cannot exhibit effective performance due to poor information in the low-level encoder itself.

4.4.5. Comparison with Other Attention Gate Methods

We further compare scAG to state-of-the-art attention gates in segmentation task. We conducted experiments on the CVC-ClinicDB to evaluate the effectiveness of scAG. Our method is compared to the Attention Gate (AG) [17,18] and Global Attention Upsample (GAU) [21]. The results of the experiment are depicted in Table 8. We can see that scAG outperforms other approaches with a dominant advantage. The baseline U-Net yields a dice coefficient of 65.93%. With the integration of AG and GAU, an accuracy of 67.59%, 68.59% is respectively achieved. Our scAG boosts the performance to 71.72%, which is an increase of an approximately five-point gap as compared to the standard U-Net model. The AG is designed to focus on spatial information, but it lacks channel information while GAU is designed to concentrate on the channel concept, but it does not care about spatial concepts. On the other hand, our scAG caputres both spatial and channel information, thus achieving superior results.

4.5. Visualization of the Attention Gate

We further provide an illustration through a visualization of our scAG to obtain a deeply intuitive understanding of its efficacy in addition to showing quantitative results that demonstrate the effectiveness of our proposed method. For convenience, we assume that the U-Net model has four levels, where the first level corresponds to the first encoder feature and the last decoder feature whereas the last level corresponds to the last encoder feature and the first decoder feature.
For cAG, it is difficult to produce a direct, explicit picture of the channel attention map. Therefore, we take some of the attended channels that are emphasized by cAG to see how much semantic information they contain. In Figure 8, we depict the channel of the encoder feature map that is emphasized by cAG. At each level, the left-side columns show the attended channel that has more emphasis while the right-side columns illustrate the attended channel that is less emphasized by cAG. As we can see, the channel with greater emphasis contains more semantic information than the other channel. For example, in the brain tumor TCGA dataset, we select the attended channel emphasized by cAG at all four levels, where the left-side columns (c,e,g,i) depict the channels with more emphasis that have a higher attention value of nearly one, while the right-side columns (d,f,g,k) show channels with less emphasis that have a lower attention value of nearly 0. As we can see, channels #9, #1, #68, #92 contain more noticeable semantic information of the ’tumor’ class while channels #7, #38, #55, #44 contain worse semantic information. The encoder features enhanced by sAG now include more semantic concepts and, thus, fusing with the decoder features becomes more effective.
For the sAG, we focus on the spatial attention map at all four levels. Figure 9 shows the spatial attention map from level #1 to level #4, which is multiplied with the corresponding encoder feature maps for further calculation. As we can see for the spatial attention map at level #4, where the spatial attention map depicts the general, coarse-grained details of the salient region to have a low resolution. As we gradually go to a higher resolution, the spatial attention map becomes more specific and fine-grained to emphasize the salient region of the target object. For example, look at row (i) of the polyp image of the CVC-ClinicDB dataset, we draw the spatial attention map created by sAG at all four levels. At level #4, where the feature maps have the coarse spatial information, sAG can only focus on the general, coarse-grained salient region of polyp in the features. However, when going up on a level where have higher resolution feature maps, the spatial attention map becomes more clear. At level #1, sAG can now concentrate on specific, fined-grained polyp regions. By focusing on the most salient region of interest on the encoder features, where each has rich spatial information, the network can predict the details of the segmentation results.
In order to have the best view of the spatial attention map as well as the segmentation results of our scAG, we provide an illustration in Figure 9. For example on CVC-ClinicDB, standard U-Net seems to over-segment the polyps (row (i), column (g)). Our proposed method segments the polyps much better, close to the ground truth (row (i), column (h)). On row (ii) of the VIP-CUP18 dataset, although the Dice score for both standard U-Net and our proposed method are quite similar (87.04% versus 89.43%), the predicted tumor masks are very different (columns (g,h)). The predicted masks from our method are similar in shape with the ground truth while U-Net tends to produce irregularities along the boundaries. For the TCGA dataset, at a small tumor figure on row (ii), our proposed method can produce a sharp tumor mask as compared to U-Net, which fails to make a sharp prediction (columns (g),(h)). Thanks to the powerful ability of our scAG, the proposed U-Net obtains superior results as compared to the standard U-Net, as shown in Figure 9g,h.

4.6. Statistical Analysis of Variance on Dice Score, Precision and Recall Metrics

We use the ANOVA tool to analyze whether there are any statistically significant differences between the means of two or more methods at each evalutation metrics. We use one-way ANOVA to compare two methods. The standard hypothesis for one-way ANOVA, used to compare two methods, are null and alternative. The null hypothesis is that the two means are equal. The alternative hypothesis is that the two means are unequal. If the p-value from output of ANOVA tool is less than the significant level, we can reject the null hypothesis. In other words, our sample data provide strong enough evidence to conclude that the means are not equal. We show the statistical analysis of Dice score, Precision, and Recall metrics on TCGA, CVC-ClinicDB, and VIP-CUP18 datasets in Table 9.
Table 9 presents the conduction of p-value analysis on Dice score, Precision, and Recall metrics for the three dataset CVC-ClinicDC, TCGA, and VIP-CUP18. The term “Deep UNet-scAG: UNet” represents the comparison between the proposed Deep UNet-scAG model and the traditional UNet model, “Deep UNet-scAG: Attention UNet” represents the comparison between the proposed Deep UNet-scAG model and the attention UNet model, and “Deep UNet-scAG: UNet++” represents the comparison between the proposed Deep UNet-scAG model and the UNet++ model. In the table, all of the comparisons have p-value < 0.05 for TCGA dataset related to Precision metric, indicating that the proposed model and conventional models have statistical significance; it means that the proposed model performs better than other three models on TCGA dataset in terms of Precision. Moreover, the ”Deep UNet-scAG: Attention UNet” has p-value < 0.05 for VIP-CUP18 dataset related to Precision metric, indicating that the proposed Deep UNet-scAG model performs better on VIP-CUP18 dataset in term of Precision.

5. Conclusions

In this paper, we proposed a novel attention gate in order to overcome the limitations of the encoder- decoder U-Net architecture. Our spatial-channel attention gate can be easily incorporated into popular U-Net architectures while minimizing the computational cost and remarkably increasing the power of the model. By taking advantage of the information on the encoder and decoder features, our proposed attention gate can capture meaningful information of the “where” and “what” for segmentation. Comprehensive experiments show that the proposed method significantly improves the segmentation results by adding very few parameters. We also expect that the proposed spatial-channel attention gate will be extensively used in deep learning, which is a vital approach for medical image analysis.

Author Contributions

Conceptualization, T.L.B.K., D.-P.D., N.-H.H., H.-J.Y. and E.-T.B.; Funding acquisition, S.-H.K.; Investigation, T.L.B.K.; Methodology, T.L.B.K.; Project administration, S.-H.K. and G.L.; Supervision, H.-J.Y.; Validation, T.L.B.K.; Writing—original draft, T.L.B.K.; Writing—review and editing, T.L.B.K., D.-P.D., N.-H.H., H.-J.Y., E.-T.B. and S.B.Y. All authors have read and agreed to the published version of the manuscript.

Funding

This work was supported by the National Research Foundation of Korea (NRF) grant funded by the Korean government (MSIT) (NRF-2020R1A2B5B01002085) and the Bio and Medical Technology Development Program of the National Research Foundation (NRF) grant funded by the Korean government (MSIT) (NRF-2019M3E5D1A02067961).

Conflicts of Interest

The authors declare no conflict of interest.

References

  1. Long, J.; Shelhamer, E.; Darrell, T. Fully convolutional networks for semantic segmentation. In Proceedings of the IEEE Conference on Computer Vision and Pattern Recognition, Boston, MA, USA, 7–12 June 2015; pp. 3431–3440. [Google Scholar]
  2. He, K.; Zhang, X.; Ren, S.; Sun, J. Deep Residual Learning for Image Recognition. In Proceedings of the IEEE Conference on Computer Vision and Pattern Recognition, Las Vegas, NV, USA, 27–30 June 2016; pp. 770–778. [Google Scholar]
  3. Simonyan, K.; Zisserman, A. Very deep convolutional networks for large-scale image recognition. In Proceedings of the International Conference on Learning Representations, San Diego, CA, USA, 7–9 May 2015. [Google Scholar]
  4. Badrinarayanan, V.; Kendall, A.; Cipolla, R. SegNet: A Deep Convolutional Encoder-Decoder Architecture for Image Segmentation. IEEE Trans. Pattern Anal. Mach. Intell. 2017, 39, 2481–2495. [Google Scholar] [CrossRef] [PubMed]
  5. Tanzi, L.; Vezzetti, E.; Moreno, R.; Moos, S. X-ray Bone Fracture Classification Using Deep Learning: A Baseline for Designing a Reliable Approach. Appl. Sci. 2020, 10, 1507. [Google Scholar] [CrossRef] [Green Version]
  6. Gribaudo, M.; Moos, S.; Piazzolla, P.; Porpiglia, F.; Vezzetti, E.; Violante, M.G. Enhancing Spatial Navigation in Robot-Assisted Surgery: An Application. In International Conference on Design, Simulation, Manufacturing: The Innovation Exchange; Springer: Cham, Switzerland, 2019; pp. 95–105. [Google Scholar]
  7. Havaei, M.; Davy, A.; Warde-Farley, D.; Biard, A.; Courville, A.; Bengio, Y.; Pal, C.; Jodoin, P.M.; Larochelle, H. Brain Tumor Segmentation with Deep Neural Networks. Med. Image Anal. 2017, 35, 18–31. [Google Scholar] [CrossRef] [PubMed] [Green Version]
  8. Li, W.; Jia, F.; Hu, Q. Automatic Segmentation of Liver Tumor in CT Images with Deep Convolutional Neural Networks. J. Comput. Commun. 2015, 3, 146–151. [Google Scholar] [CrossRef] [Green Version]
  9. Roth, H.R.; Lu, L.; Farag, A.; Shin, H.C.; Liu, J.; Turkbey, E.B.; Summers, R.M. DeepOrgan: Multi-level Deep Convolutional Networks for Automated Pancreas Segmentation. In Proceedings of the IEEE International Conference on Medical Image Computing and Computer-Assisted Intervention, Munich, Germany, 5–9 October 2015; pp. 556–564. [Google Scholar]
  10. Shin, H.C.; Roth, H.R.; Gao, M.; Lu, L.; Xu, Z.; Nogues, I.; Yao, J.; Mollura, D.; Summers, R.M. Deep Convolutional Neural Networks for Computer-Aided Detection: CNN Architectures, Dataset Characteristics and Transfer Learning. IEEE Trans. Med. Imaging 2016, 35, 1285–1298. [Google Scholar] [CrossRef] [PubMed] [Green Version]
  11. Ronneberger, O.; Fischer, P.; Brox, T.L. U-net: Convolutional networks for biomedical image segmentation. In Proceedings of the IEEE International Conference on Medical Image Computing and Computer-Assisted Intervention, Munich, Germany, 5–9 October 2015; pp. 234–241. [Google Scholar]
  12. Milletari, F.; Navab, N.; Ahmadi, S.A. V-net: Fully convolutional neural networks for volumetric medical image segmentation. In Proceedings of the International Conference on 3D Vision, Stanford, CA, USA, 25–28 October 2016; pp. 565–571. [Google Scholar]
  13. Çiçek, Ö.; Abdulkadir, A.; Lienkamp, S.; Brox, T.; Ronneberger, O. 3d u-net: Learning dense volumetric segmentation from sparse annotation. In Proceedings of the IEEE International Conference on Medical Image Computing and Computer-Assisted Intervention, Athens, Greece, 17–21 October 2016; pp. 424–432. [Google Scholar]
  14. Ben-Cohen, A.; Diamant, I.; Klang, E.; Amitai, M.; Greenspan, H. Fully convolutional network for liver segmentation and lesions detection. In Proceedings of the International Workshop on Deep Learning in Medical Image Analysis, Athens, Greece, 21 October 2016; pp. 77–85. [Google Scholar]
  15. Zhou, Z.; Siddiquee, M.M.R.; Tajbakhsh, N.; Liang, J. UNet++: A Nested U-Net Architecture for Medical Image Segmentation. In Proceedings of the International Workshop on Deep Learning in Medical Image Analysis, Granada, Spain, 20 September 2018; pp. 3–11. [Google Scholar]
  16. Zhou, Z.; Siddiquee, M.M.R.; Tajbakhsh, N.; Liang, J. UNet++: Redesigning Skip Connections to Exploit Multiscale Features in Image Segmentation. IEEE Trans. Med. Imaging 2019, 39, 1856–1867. [Google Scholar] [CrossRef] [PubMed] [Green Version]
  17. Oktay, O.; Schlemper, J.; Folgoc, L.L.; Lee, M.; Heinrich, M.; Misawa, K.; Mori, K.; McDonagh, S.; Hammerla, N.Y.; Kainz, B.; et al. Attention U-Net: Learning Where to Look for the Pancreas. In Proceedings of the International Conference on Medical Imaging with Deep Learning, Amsterdam, The Netherlands, 4–6 July 2018. [Google Scholar]
  18. Schlemper, J.; Oktay, O.; Schaap, M.; Heinrich, M.; Kainz, B.; Glocker, B.; Rueckert, D. Attention gated networks: Learning to leverage salient regions in medical images. Med. Image Anal. 2019, 53, 197–207. [Google Scholar] [CrossRef] [PubMed]
  19. Wang, F.; Jiang, M.; Qian, C.; Yang, S.; Li, C.; Zhang, H.; Wang, X.; Tang, X. Residual attention network for image classification. In Proceedings of the IEEE Conference on Computer Vision and Pattern Recognition, Honolulu, HI, USA, 21–26 July 2017; pp. 6450–6458. [Google Scholar]
  20. Li, H.; Liu, Y.; Ouyang, W.; Wang, X. Zoom out-and-in network with map attention decision for region proposal and object detection. Int. J. Comput. Vis. 2019, 127, 225–238. [Google Scholar] [CrossRef] [Green Version]
  21. Li, H.; Xiong, P.; An, J.; Wang, L. Pyramid Attention Network for Semantic Segmentation. In Proceedings of the British Machine Vision Conference, Northumbria, UK, 3–6 September 2018. [Google Scholar]
  22. Pedersoli, M.; Lucas, T.; Schmid, C.; Verbeek, J. Areas of attention for image captioning. In Proceedings of the IEEE Conference on Computer Vision and Pattern Recognition, Honolulu, Hawaii, USA, 21–26 July 2017; pp. 1251–1259. [Google Scholar]
  23. Yang, Z.; He, X.; Gao, J.; Deng, L.; Smola, A. Stacked attention networks for image question answering. In Proceedings of the IEEE Conference on Computer Vision and Pattern Recognition, Las Vegas, NV, USA, 27–30 June 2016; pp. 21–29. [Google Scholar]
  24. Hu, J.; Shen, L.; Sun, G. Squeeze-and-excitation networks. In Proceedings of the IEEE Conference on Computer Vision and Pattern Recognition, Salt Lake City, UT, USA, 18–22 June 2018; pp. 7132–7141. [Google Scholar]
  25. Woo, S.; Park, J.; Lee, J.Y.; Kweon, I.S. CBAM: Convolutional block attention module. In Proceedings of the European Conference on Computer Vision, Munich, Germany, 8–14 September 2018; pp. 3–19. [Google Scholar]
  26. Roy, A.G.; Navab, N.; Wachinger, C. Concurrent Spatial and Channel ‘Squeeze & Excitation’ in Fully Convolutional Networks. In Proceedings of the IEEE International Conference on Medical Image Computing and Computer-Assisted Intervention, Granada, Spain, 16–20 September 2018; pp. 421–429. [Google Scholar]
  27. Roy, A.G.; Navab, N.; Wachinger, C. Recalibrating Fully Convolutional Networks With Spatial and Channel “Squeeze and Excitation” Blocks. IEEE Trans. Med. Imaging 2018, 38, 540–549. [Google Scholar] [CrossRef] [PubMed]
  28. Zeiler, M.D.; Fergus, R. Visualizing and understanding convolutional networks. In Proceedings of the European Conference on Computer Vision, Zurich, Switzerland, 6–12 September 2014; pp. 818–833. [Google Scholar]
  29. Bernal, J.; Sánchez, F.J.; Fernández-Esparrach, G.; Gil, D.; Rodríguez, C.; Vilariño, F. WM-DOVA maps for accurate polyp highlighting in colonoscopy: Validation vs. saliency maps from physicians. Comput. Med. Imaging Graph. 2015, 43, 99–111. [Google Scholar] [CrossRef] [PubMed]
  30. 2018 IEEE Signal Processing Society Video and Image Processing (VIP) Cup. Available online: https://users.encs.concordia.ca/~i-sip/2018VIP-Cup/index.html (accessed on 19 May 2020).
  31. Buda, M.; Saha, A.; Mazurowski, M.A. Association of genomic subtypes of lower-grade gliomas with shape features automatically extracted by a deep learning algorithm. Comput. Biol. Med. 2019, 109, 218–225. [Google Scholar] [CrossRef] [PubMed] [Green Version]
  32. Mehta, R.; Sivaswamy, J. M-net: A convolutional neural network for deep brain structure segmentation. Proceedings of IEEE International Symposium on Biomedical Imaging, Melbourne, Australia, 18–21 April 2017; pp. 437–440. [Google Scholar]
  33. Wong, K.C.L.; Moradi, M.; Tang, H.; Syeda-Mahmood, T. 3D Segmentation with Exponential Logarithmic Loss for Highly Unbalanced Object Sizes. In Proceedings of the IEEE International Conference on Medical Image Computing and Computer-Assisted Intervention, Granada, Spain, 16–20 September 2018; pp. 612–619. [Google Scholar]
  34. Lee, C.Y.; Xie, S.; Gallagher, P.; Zhang, Z.; Tu, Z. Deeply-supervised nets. In Proceedings of the Eighteenth International Conference on Artificial Intelligence and Statistics, San Diego, CA, USA, 9–12 May 2015; pp. 562–570. [Google Scholar]
  35. Kingma, D.P.; Ba, J. A method for stochastic optimization. In Proceedings of the International Conference on Learning Representations, San Diego, CA, USA, 7–9 May 2015. [Google Scholar]
Figure 1. Proposed U-Net model using Spatial-Channel Attention Gate and Deep supervision.
Applsci 10 05729 g001
Figure 2. Diagram of the Spatial Attention Gate (sAG).
Applsci 10 05729 g002
Figure 3. Diagram of the Channel Attention Gate (cAG).
Applsci 10 05729 g003
Figure 4. Process of refining the input feature.
Applsci 10 05729 g004
Figure 5. Example of images and ground truth images from three dataset.
Applsci 10 05729 g005
Figure 6. Representative results from three datasets by using different U-Net architectures.
Applsci 10 05729 g006
Figure 7. Example results by using separate attention gate.
Applsci 10 05729 g007
Figure 8. Channel feature map emphasized by the Channel Attention Gate (cAG).
Applsci 10 05729 g008
Figure 9. Spatial attention map created by the Spatial Attention Gate (sAG).
Applsci 10 05729 g009
Table 1. Overview of the datasets.
DatasetApplicationNo. of ImagesInput ResolutionModality
CVC-ClinicDB [29]Polyp612 256 × 192 Endoscopy
VIP-CUP18 [30]Lung tumor5204 256 × 256 CT
TCGA [31]Brain tumor1373 256 × 256 MRI
Table 2. Comparison of different channel methods on CVC-ClinicDB dataset (best results marked bold).
ModelDice Score (%)Precistion (%)Recall (%)
U-Net + spatial + channel (ratio = 16) 71.72 ± 6.81 69.81 ± 8.97 74.21 ± 4.56
U-Net + spatial + channel (ratio = 8) 70.55 ± 4.98 70.44 ± 6.29 73.04 ± 5.52
U-Net + spatial + channel (ratio = 2) 70.76 ± 5.98 70.05 ± 9.76 73.97 ± 3.80
Table 3. Comparison of different spatial methods on CVC-ClinicDB dataset (best results marked bold).
ModelDice Score (%)Precistion (%)Recall (%)
U-Net + spatial (avg-max) + channel 70.18 ± 4.63 71.52 ± 8.66 72.04 ± 3.13
U-Net + spatial (1 × 1 conv) + channel 70.15 ± 5.49 67.62 ± 8.21 73.94 ± 4.84
U-Net + spatial (avg-max-conv) + channel 71.72 ± 6.81 69.81 ± 8.97 74.21 ± 4.56
U-Net + spatial (k = 7) + channel 71.72 ± 6.81 69.81 ± 8.97 74.21 ± 4.56
U-Net + spatial (k = 5) + channel 70.47 ± 5.12 70.05 ± 7.32 73.35 ± 5.14
U-Net + spatial (k = 3) + channel 70.94 ± 6.20 71.06 ± 10.00 73.31 ± 3.94
Table 4. Experimental results on three datasets (best results marked bold).
ModelDeep SupervisionDatasetDice Score (%)Precision (%)Recall (%)
CVC-ClinicDB 65.93 ± 6.34 61.49 ± 7.30 70.00 ± 6.62
U-Net [11]×VIP-CUP18 52.47 ± 3.83 48.14 ± 6.45 54.44 ± 3.40
TCGA 83.52 ± 1.61 77.79 ± 2.90 83.44 ± 2.30
CVC-ClinicDB 67.57 ± 6.47 64.03 ± 7.13 71.68 ± 5.96
Attention U-Net [17,18]×VIP-CUP18 53.15 ± 3.21 47.52 ± 3.24 54.75 ± 4.03
TCGA 83.88 ± 1.72 78.42 ± 2.91 82.27 ± 2.61
CVC-ClinicDB 68.89 ± 6.87 66.18 ± 7.40 71.61 ± 5.68
U-Net++ [15,16]×VIP-CUP18 54.66 ± 3.77 49.89 ± 5.47 55.87 ± 2.23
TCGA 84.54 ± 1.62 79.47 ± 2.45 82.50 ± 2.42
CVC-ClinicDB 71.72 ± 6.81 69.81 ± 8.97 74.21 ± 4.56
U-Net+scAG (Proposed)×VIP-CUP18 55.89 ± 3.97 51.41 ± 6.81 58.24 ± 1.82
TCGA 85.18 ± 1.31 81.74 ± 1.89 83.84 ± 3.33
CVC-ClinicDB 73.31 ± 5.85 72.43 ± 7.14 76.82 ± 2.94
U-Net+scAG (Proposed)VIP-CUP18 56.26 ± 3.51 51.79 ± 4.42 57.11 ± 3.54
TCGA 85.83 ± 1.41 83.74 ± 1.81 83.86 ± 2.46
Table 5. Comparison of latency of testing consumption on three datasets.
ModelDeep
Supervision
No.
of Parameters
Inference Time(ms/img)
CVC-ClinicDBVIP-CUP18TCGA
U-Net [11]× 8637 × 10 6 151514
Attention U-Net [17,18]× 8726 × 10 6 222121
U-Net++ [15,16]× 10 , 198 × 10 6 282626
U-Net+scAG (Proposed)× 8656 × 10 6 333232
U-Net+scAG (Proposed) 8804 × 10 6 343334
Table 6. Performance on the CVC-ClinicDB dataset by using separate attention gates (best results marked bold).
ModelNo. of ParametersDice Score (%)Precision (%)Recall (%)
U-Net 8637 × 10 6 65.93 ± 6.34 61.49 ± 7.30 70.00 ± 6.62
U-Net + sAG 8639 × 10 6 ( + 0.025 % ) 67.55 ± 6.97 63.65 ± 3.96 70.16 ± 8.01
U-Net + cAG 8654 × 10 6 ( + 0.195 % ) 70.49 ± 5.40 67.43 ± 9.38 76.07 ± 6.13
U-Net + scAG 8656 × 10 6 ( + 0.22 % ) 71.72 ± 6.81 69.81 ± 8.97 74.21 ± 4.56
Table 7. Performance on the CVC-ClinicDB dataset by using the self-attention encoder feature (best results marked bold).
ModelDice Score (%)Precision (%)Recall (%)
U-Net 65.93 ± 6.34 61.49 ± 7.30 70.00 ± 6.62
U-Net + encoder CBAM [25] 68.37 ± 6.09 66.00 ± 7.79 73.48 ± 5.42
U-Net + scAG 71.72 ± 6.81 69.81 ± 8.97 74.21 ± 4.56
Table 8. Performance on the CVC-ClinicDB dataset using other attention gates (best results marked bold).
ModelDice Score (%)Precision (%)Recall (%)
U-Net 65.93 ± 6.34 61.49 ± 7.30 70.00 ± 6.62
U-Net + AG [17,18] 67.57 ± 6.47 64.03 ± 7.13 71.68 ± 5.96
U-Net + GAU [21] 68.59 ± 6.31 65.75 ± 8.24 72.64 ± 4.36
U-Net + scAG 71.72 ± 6.81 69.81 ± 8.97 74.21 ± 4.56
Table 9. Comparison of p-value between Deep UNet-scAG versus UNet, Attention UNet, and UNet++ based on Dice score, Precision, and Recall on the three dataset CVC-ClinicDC, TCGA and VIP-CUP18.
Method1:Method2MetricCVC-ClinicDBTCGAVIP-CUP18
Dice score0.12510.06220.1822
Deep U-Net-scAG:U-NetPrecision0.06460.00820.3779
Recall0.09630.80830.3072
Dice score0.22430.11680.2272
Deep U-Net-scAG:Attention U-NetPrecision0.07280.01850.0039
Recall0.87550.38360.3507
Dice score0.35510.26390.5512
Deep U-Net-scAG:U-Net++Precision0.25910.02340.6049
Recall0.86260.43680.1372

