1. Introduction
Emotion is triggered by specific situations, and the recognition of human emotion is a crucial topic in the study of human-computer interfaces (HCIs) to empathize with people [
1,
2,
3]. When a machine communicates with people, emotion detection can give people more affinities and help to provide personalized service to people depending on their moods, which inspires confidence in people.
Emotions are expressed in a variety of ways, such as facial expressions, voices, physiological signals, and text [
4,
5,
6,
7,
8]. Among them, physiological signals contain significant data about emotions [
9,
10]. Physiological signals change rapidly depending on changing emotions. Another advantage of biosignals is that they are spontaneous reactions that cannot deceive emotions [
11]. For example, people cannot control their heartbeats when they watch horror films. In contrast, people can hide fear by controlling their facial expressions by maintaining a poker face.
Thus far, researchers have used a number of physiological signals such as electroencephalogram (EEG), photoplethysmogram (PPG), electromyogram (EMG), respiration (RSP), blood volume pulse (BVP), skin conductivity (SC), and electrooculography (EOG) signals to recognize emotions [
12,
13,
14,
15,
16]. Recently, with the evolution of deep-learning frameworks, researchers have introduced deep-learning models to extract a number of features from these signals [
17,
18,
19]. Deep belief network (DBN)-based emotion recognition has been conducted using EEG signals, and convolutional neural networks (CNNs) have been introduced to extract the features of various biosignals [
20,
21].
The typical biosignals for emotion recognition are the EEG signals, as these signals are associated with the central nervous system and provide strong emotional features [
22,
23,
24,
25,
26]. Recently, advanced deep-learning models have been used to extract EEG features. Alhagry et al. introduced long short-term memory (LSTM) to classify emotions, and Song et al. proposed a dynamic graph CNN to learn the intrinsic relationship between different EEG channels [
27,
28]. Moreover, Chao et al. used a capsule network (CapsNet) to recognize emotions on the basis of a multiband feature matrix (MFM) [
29].
However, EEG analysis has the limitation of being a high-dimensionality problem. Furthermore, the procedure for obtaining an EEG signal is tedious and annoying, because multiple EEG electrodes have to be attached to get the EEG signal. To overcome these limitations and recognize true emotion, in this research, we used a PPG signal. It detects the blood volume changes in the tissue by using a pulse oximeter. A PPG signal is typically extracted from the finger, and many electrical devices have PPG sensor functions. Therefore, a PPG signal can be obtained more easily than other signals. However, the PPG signal has a weakness in that is vulnerable to vibrations, which implies that vibration-resistant measurements are required. Another merit of the PPG signal is that it changes quickly depending on the situation. Accordingly, a number of researchers have used PPG signals for emotion recognition [
12,
30,
31,
32,
33].
The feature extraction process is essential for emotion recognition. This is because the emotion is not revealed in the physiological signal itself, and therefore, significant characteristics associated with emotions should be extracted from the signal to detect emotion. There are two ways of extracting features from biosignals. The first one is a hand-crafted feature method that uses a statistical theory such as the mean, standard deviation, peak, and area.
To extract statistical features, a physiological signal is preprocessed or is changed as a power spectral density (PSD) with a Fourier transform before the application of statistical techniques. Kim et al. obtained 110 features, in all, from ECG, respiration, skin conductivity, and EMG signals, selecting partial features depending on the subject [
30]. Mert et al. proposed an emotion recognition method using multivariate extension empirical mode decomposition (MEMD) based on EEG signals [
34]. Hassan et al. used electro-dermal activity (EDA), PPG, and EMG signals and extracted statistical features from the PSD of the amplitude versus the occurrence distribution [
35]. Although manual features were effective at emotion recognition, they had a limitation in that they could not contain the overall details about the signal. As statistical features deal with statistical facts, information loss can occur.
The second method of extracting features is based on deep-learning where features are extracted using various neural network models [
36,
37]. Yang et al. introduced a parallel model of a recurrent neural network (RNN) and a CNN with an EEG signal to acquire meaningful features [
38]. Zhang et al. attempted to reconstruct the respiration signal with an auto-encoder model [
39]. These deep-learning-based models have the advantage that many significant features can be extracted automatically. However, deep-learning features cannot include statistical meanings, for example the mean and standard deviation. Moreover, the features extracted from a deep-learning model do not contain information about the frequency domain.
In this study, we took advantages of both methods by fusing statistical features and deep-learning features. For statistical features, we obtained six features in the time domain and 13 features in the frequency domain. For deep-learning features, the normal-to-normal (NN) interval and the PPG signal were used as the inputs of the CNN model. As a result, both statistical features and neural network features were used for accurate emotion recognition.
Furthermore, we focused on fast-emotion recognition in which the recognition interval was short. In general, the existing research on emotion recognition has a recognition interval between 30 s and 1 min, which makes it difficult to detect fast-changing emotions. Therefore, we proposed a feature extraction method using a 10 s PPG signal.
We extracted three types of PPG features for emotion recognition. The first feature was extracted using a statistical method based on both the time domain and the frequency domain. Then, we selected the meaningful statistical features by adopting Pearson’s correlation. Secondly, we acquired the NN interval features by using a CNN. The NN interval is used frequently to analyze a PPG signal. Lastly, we obtained PPG features through a normalized PPG signal using a CNN. We concatenated statistical features and deep-learning features and trained the deep-learning model.
The rest of this paper is organized as follows.
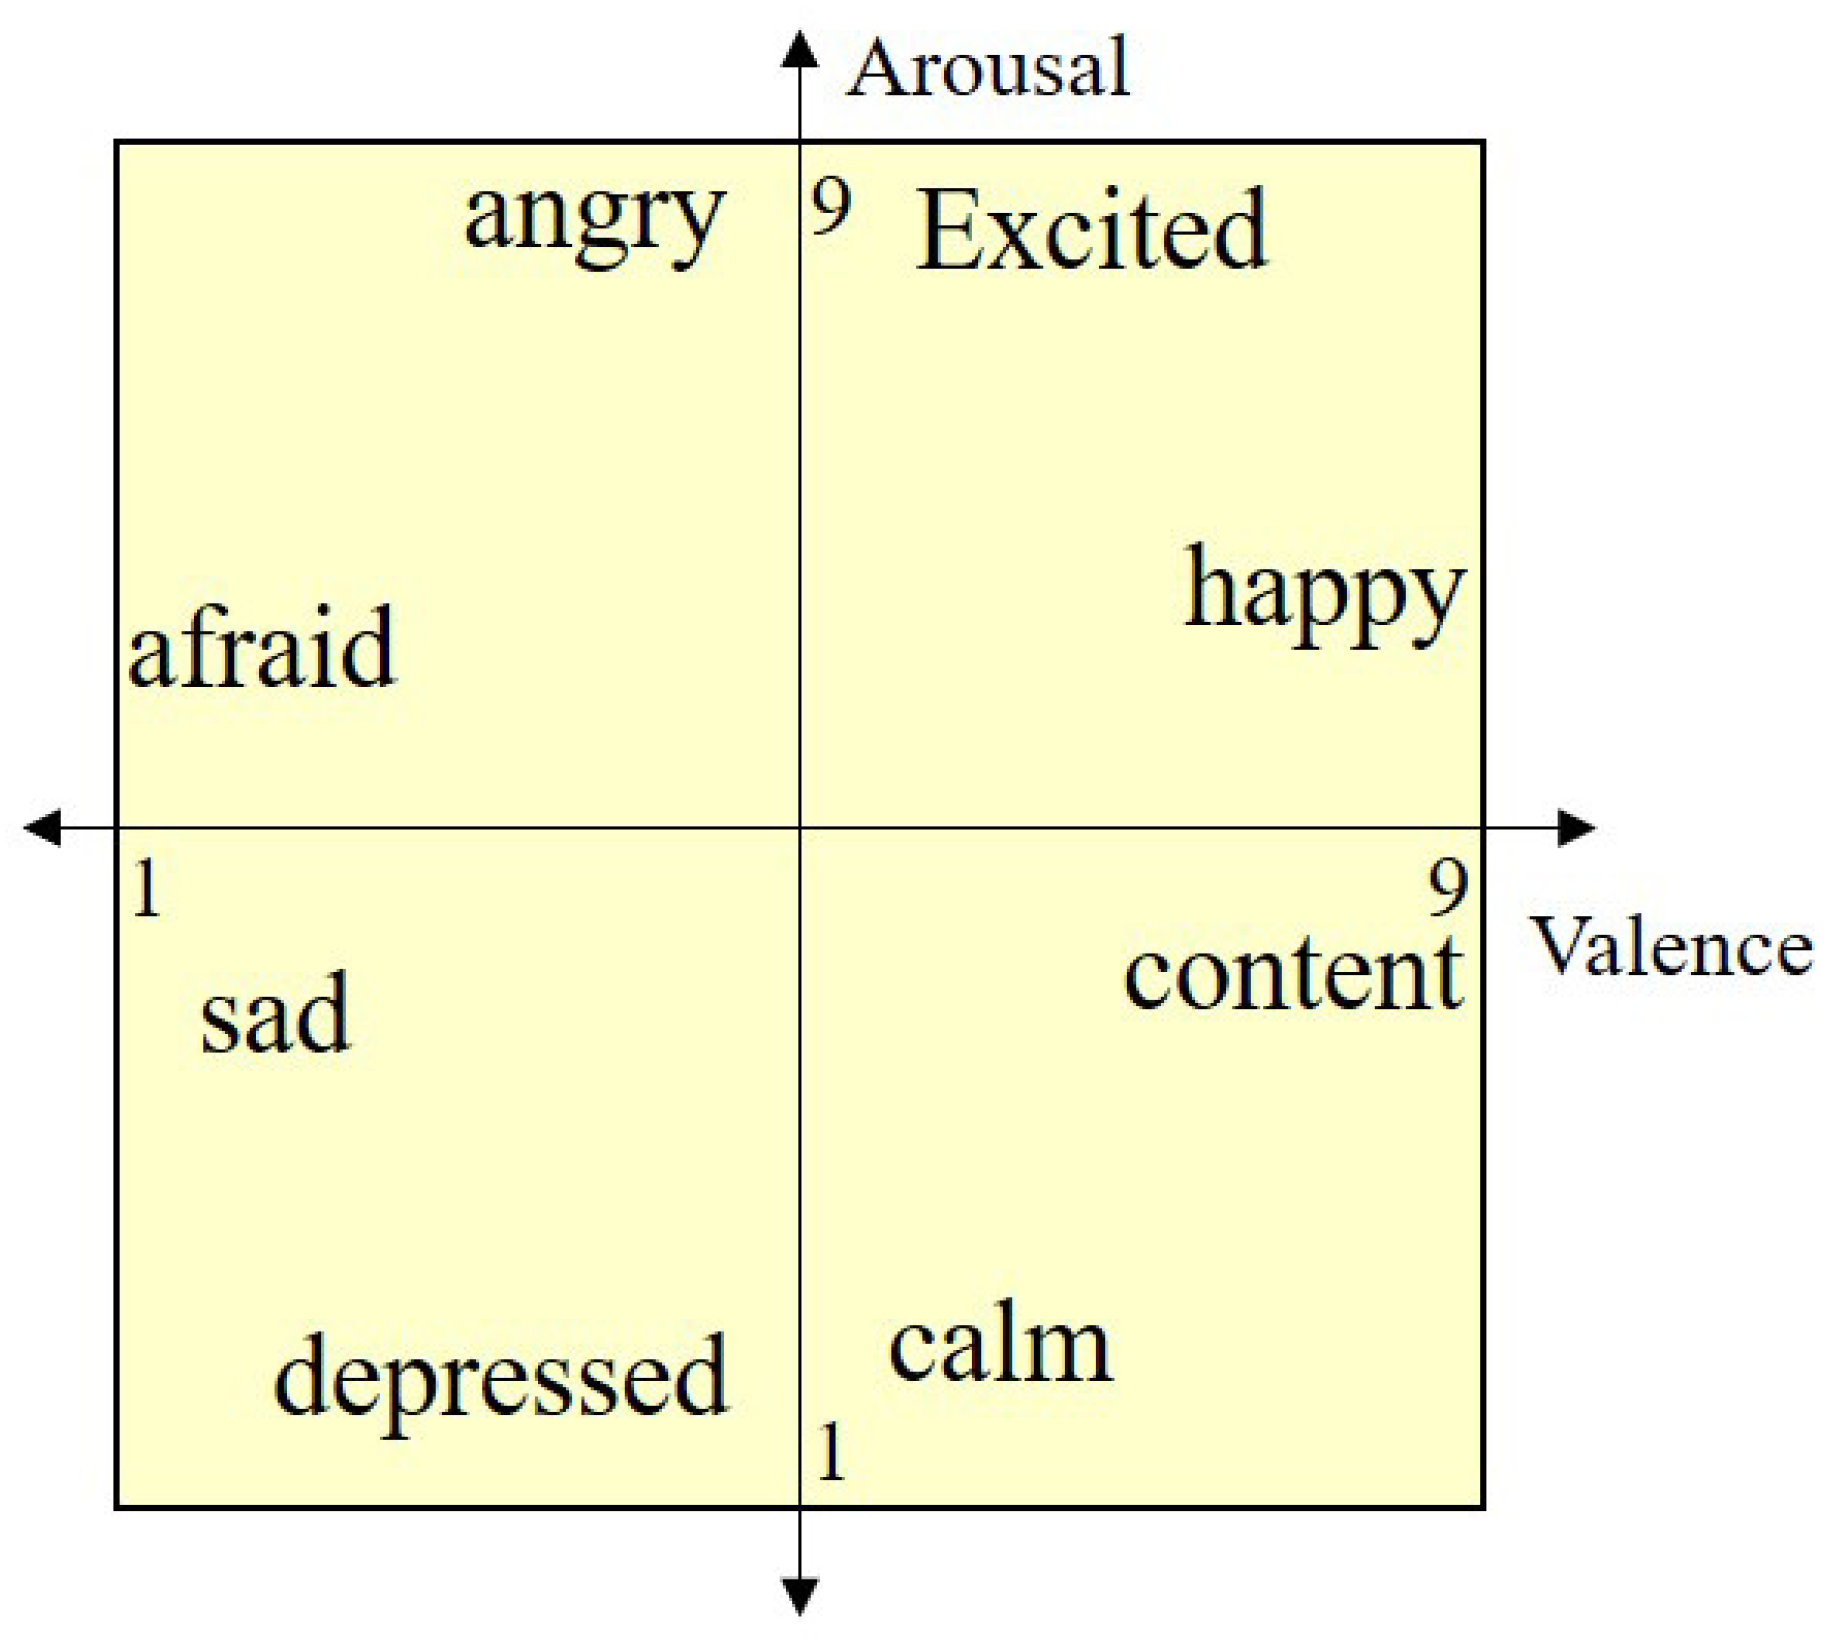
Section 2 provides a method of representing emotion and the typical parameters of emotion.
Section 3 describes the proposed methodology of extracting PPG features and emotion classification. In
Section 4, the description of the dataset and the experimental results are presented, and
Section 5 presents the conclusion.
3. Emotion Recognition with Selected Statistical PPG Features
The overall architecture of emotion recognition is shown in
Figure 2. The PPG signal was used to detect human emotion. In the feature extraction procedure, both the NN interval value and the PPG signal were used. For statistical features, the NN interval was used to obtain the time domain features, whereas the segmented PPG signal was used to acquire the frequency domain features. Likewise, the CNN model extracted features with the NN interval and the segmented PPG signal. After extracting the features, we fused the statistical features with the CNN features in the feature fusion module. The fused features were classified through the neural network, which detected the valence and arousal values. The detailed contents of the emotion recognition method are presented in the following subsections.
3.1. Data Acquisition Using NN Interval and Segmentation
In this study, we applied two preprocessing methods, the NN interval and segmentation. The typical raw PPG signal is depicted in
Figure 3. The PPG signal has a periodicity and peak value per cycle, whereas the baseline noise is included as an orange line in the figure. This baseline occurs because of an unintentional hand movement or breathing while recording the PPG signal. As the baseline varies according to people and situations, it must be removed by subtracting the raw signal from the baseline.
Figure 4 shows the result of baseline removal and the peak points in the PPG signal, which could be used to obtain the NN interval. NN intervals are the time differences between the adjacent peak values in the PPG signal, and
Figure 5 represents the NN interval result.
For emotion recognition, we segmented the PPG signal into 10 s, intending to detect emotion through a 10 s PPG signal. In
Figure 3 and
Figure 4, the PPG signal contained the 10 s signal, corresponding to 1280 samples for the Database for Emotion Analysis using Physiological signals (DEAP) dataset (128 Hz). As people have different PPG signals, the PPG signal was normalized by the max and min values of the PPG signal after removing the baseline that had a value between zero and one. As a result,
Figure 4 and
Figure 5 were used for extracting the hand-crafted features and the deep-learning-based features.
3.2. Feature Extraction Based on the Selection of Statistical Features
Hand-crafted features were used to improve the performance of emotion recognition. In general, statistical features are chosen as hand-crafted features, which are based on statistical information such as the mean, variance, and peak. The analysis of a physiological signal could be conducted in two domains: the time domain and the frequency domain. The existing method extracted the time domain and frequency domain features using the NN interval. However, it was impossible to use the NN interval for the short-interval emotion recognition in the frequency domain. Therefore, only time domain features were computed from the NN interval values and frequency domain features were extracted from the normalized PPG signal. The feature extraction method and the selection procedure for the statistical features are described in the next subsection.
3.2.1. Extraction of Time Domain Features
To extract the time domain features, we explored heart rate variability (HRV) features based on NN intervals. HRV features are crucial in human emotion, and we extracted six time domain features, namely meanNN, medianNN, SDNN, the percentage of differences between successive NN intervals ≥50 ms (pNN50), NN50, and root mean square of successive NN differences (RMSSD). More than six features could be obtained from a 1 min PPG signal; however, only six features were extracted from a 10 s PPG signal. The description of the time domain features is given in
Table 1.
3.2.2. Extraction of Frequency Domain Features
In general, the frequency analysis of a PPG signal proceeded through power spectral density (PSD) of at least 1 min values of NN intervals, as a 1 min signal was sufficient to acquire PSD, and the frequency analysis was meaningful. Therefore, we could not use the 10 s NN interval values for the frequency features, and we decided to use the normalized 10 s PPG signal to get the PSD rather than the NN intervals for the short interval of emotion recognition.
Figure 6 presents the PSD obtained from the 10 s PPG signal of high valence and low valence. It shows the discriminative properties according to the valence; the same properties occurred in arousal. Thus, we considered extracting features based on the frequency band (VLF, LF, and HF), which was similar to the frequency feature extraction through the NN interval. The power spectrum of the PPG signal was divided into three bands: very low-frequency band (VLF, 0–0.04 Hz), low-frequency band (LF, 0.04–0.15 Hz), and high-frequency band (HF, 0.15–0.4 Hz). In this figure, the bands are divided by dotted lines. On the basis of these three bands, we obtained 13 features using the area, peak point, and percentage value, as described in detail in
Table 2.
3.2.3. Selection of Statistical Features
As mentioned before, we obtained 19 statistical features for emotion recognition (six features for the time domain and 13 features for the frequency domain). In this work, we developed a feature selection method for emotion recognition using these 19 features. In fact, not all the statistical features were associated with emotion, and the valence and the arousal were not affected by these features. Features that were not related to emotion could interfere with the learning of emotion recognition.
Therefore, it was essential to consider the relation to the parameters. Consequently, we selected several features by using Pearson’s correlation, which measured the linear correlation between two variables. Before applying Pearson’s correlation, we set all feature values between zero and one. The formula of Pearson’s correlation is presented in (1), and the correlation coefficient had a value between +1 and −1, where 1/−1 denotes a positive/negative linear correlation and zero no correlation between the parameters. In this equation,
and
are the mean value of
x and
y, respectively. In general, if the absolute value of R is between 0.1 and 0.3, it has a weak linear correlation, and if the absolute value of R is between 0.3 and 0.7, it has a distinct linear correlation.
Figure 7 shows the result of Pearson’s correlation between emotions and statistical features. The first and the second columns represent the valence and the arousal, respectively, and the first and second rows correspond to the correlation between emotions (valence and arousal) and statistical features. Each coefficient value indicates how much it affects the valence and the arousal. To fuse the features in the neural network, it is essential to unify the number of features when training. Therefore, we decided to use 10 statistical features, which were one half of all the features with large coefficient values; we set each threshold for the valence and the arousal on the basis of the correlation coefficient.
Table 3 describes the selected features and the correlation threshold. In
Figure 7, valence correlations were stronger than those of arousal, and we set a higher threshold for valence. As the correlation coefficients of valence and arousal were different, the selected features were also different. In both the valence and the arousal cases, three time domain features and seven frequency domain features were selected on the basis of the correlation coefficients. As a result, 10 features were selected for both valence and arousal each, which were used for emotion classification.
3.3. Feature Fusion-Based Convolutional Neural Network
The CNN framework is widely used for learning features and classification in various fields. It consists of a feature extraction part and a classification part. The feature extraction section is composed of successive convolution layers and pooling layers with nonlinear functions. The classification part is formed by a fully connected layer and an output layer with a softmax function to score the probability of class.
Figure 8 shows the overall architecture of emotion recognition, which used statistical features and CNN features to classify valence. This structure was largely divided into three parts: CNN using a PPG signal, CNN using an NN interval, and statistical features. The first CNN model used a portion of the normalized PPG signal. After repeating the experiment, we found that a length of 240 (samples) resulted in better classification performance than the use of all 10 s signal values. Using the entire signal caused a reduction in performance. Although there was not much difference in accuracy, we chose the optimal length. Therefore, the input of the first CNN was a
vector corresponding to approximately the front 2–3 pulses of the PPG signal; there were three convolutional layers, namely Conv1, Conv2, and Conv3. Each convolutional layer consisted of a one-dimensional convolution network with a
convolutional filter, batch normalization (BN), and max-pooling layer with a
filter. There were 20 feature maps for every convolution layer with stride one, allowing a padding of size one. We used the BN that normalized the input layer to avoid over-fitting and improve performance. After Conv3, the dense layer (Dense1) consisted of 200 nodes to form the low-dimensional features, which implied that there were 200 features for the first CNN.
The second CNN used the NN interval as an input of the neural network. In general, there were 9–11 NN values depending on the person in the 10 s PPG signal. As CNN models must have the same input length, we only used the front nine NN intervals for the CNN. The second CNN was composed of two convolutional layers (Conv1_NN and Conv2_NN). Similar to the first CNN, a convolution network, BN, and a max-pooling layer comprised the convolutional layer. There were 10 feature maps for each convolutional layer with stride one, allowing a padding of size one, and a rectified linear unit (ReLU) was used as an activation function. After Conv2_NN, there were 30 features for the NN interval.
The third part was composed of statistical features selected on the basis of Pearson’s correlation. Depending on the emotion, ten statistical features were chosen; these features were passed to the next layer. Overall, in the flatten layer, we fused all the features extracted from both the CNN and the statistical method. We extracted 200 features from the first CNN, 30 features from the second CNN, and 10 features from the statistical method.
The classification layer was composed of a fully connected layer with 500 nodes and an output layer with two class nodes of high valence and low valence (high arousal and low arousal). The fully connected layer had 120,000 parameters (240 × 500) of weights, and dropout was applied to avoid over-fitting. The output layer used the softmax function for binary classification in order to obtain the probability of the class. The entire neural network was composed of the two CNNs and fully connected layer, and it was trained at the same time. In the arousal case, the model architecture and the parameters were the same as in the valence case, except for the selected statistical features.
We developed an emotion recognition model based on feature fusion. We concatenated the statistical features and the CNN features after extracting these features. To acquire both types of features, we utilized the NN interval and the normalized PPG signal. As a result, the proposed model recognized emotions using the advantages of both types of features.
4. Experimental Results
4.1. Dataset
We used the DEAP dataset, which is widely used in emotion recognition research. It is available for download upon authorization from the homepage [
41]. The DEAP dataset consists of two parts, namely the online ratings and the participant ratings. The online self-assessment contained the ratings of 120 1 min music videos by 14–16 volunteers with respect to arousal, valence, dominance, and liking the videos. Secondly, the other 32 participants watched a subset of 40 videos while recording various physiological signals; they also rated the videos in terms of arousal, valence, dominance, and liking from one to nine. The DEAP dataset contained various physiological signals, such as PPG, EMG, EEG, and EDA, and we only used the PPG signal. As arousal and valence were rated from one to nine and our purpose was a binary classification, we divided the arousal and valence classes according to the median value of five (low/high).
We used the PPG data of DEAP with a length of . Among the 32 participants, the PPG signals of only 20 participants were valid, and there were 8064 data points for the 1 min video clips (128 Hz). In the 1 min video, we divided the signal into 10 s and acquired six samples. Therefore, there were 4800 samples in all ().
4.2. Experimental Setting
We trained the CNN architecture to extract the features. The complete neural network had three inputs: normalized PPG signal, NN interval, and statistical features. The network had two parallel CNN models with three and two convolutional layers, respectively. After feature fusion, there was a fully connected layer with a 0.5 dropout rate. Shuffled mini-batch size = 64, learning rate = 0.01, training epoch = 200, Adam optimizer, and cross entropy for the loss function were used in the experiment. From the entire DEAP dataset, eighty percent of the samples were used for the training and 20% of the samples for testing. All the training procedures were implemented using Keras with a single GPU of GTX 1060. It was trained for 5 min, which was very fast because the inputs were one-dimensional PPG signals. Moreover, less than 1 ms was required for the inference time. All values were calculated as the average of the results of 10 measurements.
4.3. Experimental Results
As an emotion classification task is a binary classification, the classification accuracies of valence and arousal are shown in
Table 4. This table presents the accuracies of valence and arousal according to the model architectures. The fully connected model that used all three inputs was trained with fully connected layers rather than using the CNN architecture. The CNN-only model used the first CNN architecture, which did not add any statistical features and the CNN with the NN intervals. The CNN with the selected statistical features model represented the neural network with the first CNN and the selected statistical features and did not add the CNN with the NN intervals. The two-CNN models with the statistical features was trained with the first CNN, the second CNN, and all 19 statistical features. Lastly, the proposed model, which was composed of the first CNN, the second CNN, and the selected statistical features, showed the best performance for both valence and arousal in this experiment. The accuracy for valence was 82.1%, and the accuracy for arousal was 80.9%.
Overall, the results indicated that it was possible to recognize emotions from only a 10 s PPG signal. It was essential to use the CNN architecture since the fully connected model could not recognize emotion well. Moreover, the models adding statistical features represented a significant performance improvement: on average, the classification accuracy increased by 3%. In particular, the statistical features for valence had a more considerable effect on accuracy than the features for arousal. This was inferred from the results that the Pearson’s correlations for valence were higher than those for arousal. Furthermore, we could achieve better performance by using the NN intervals. Comparing the use of all the statistical features with that of the selected statistical features, we found that the selected features improved the performance. This indicated that the features that were not related to emotions were not suitable for the classification of emotion. As a result, using not only deep-learning features, but also statistical features showed better results.
Table 5 represents the comparisons with other studies using the DEAP dataset, which covered the classification accuracy and the recognition interval. Various deep-learning methods and physiological signals were used to obtain the better performance. Furthermore, more complicated deep-learning models were introduced, such as DBN, multimodal deep-learning, and auto-encoder. In general, the accuracy increased, and the recognition interval shortened. As shown in this table, we could prove that the proposed model outperformed the other methods in terms of the classification accuracy and the recognition interval. In particular, our method could detect emotion for a shorter interval with a better performance. Even the recent research using an auto-encoder with an RSP signal, focused on fast emotion recognition, had a 20 s recognition interval, which was double the recognition interval of the proposed method.
In this study, we used a PPG signal to detect human emotion. The greatest advantage of the use of the PPG signal is that its acquisition procedure is simple. It can be recorded using a small device, such as a cell phone, by wearing it on one’s finger. Moreover, the PPG signal changes instantaneously depending on the emotion. Since the recognition interval was 10 s and it could be recorded easily, it could be the most realistic signal for commercialization.
We introduced an effective emotion recognition model using a CNN and certain selected statistical features. The main contribution of this paper was the method of extracting features for a PPG signal within a short period of time. As an NN interval of more than 1 min was used for PSD, we used a normalized PPG signal to obtain the PSD for a 10 s signal. In all, we extracted six features for the time domain and 13 features for the frequency domain. Then, we proposed the use of Pearson’s correlation to select features related to the valence and the arousal. The result of Pearson’s correlation showed that the correlation between the valence and the statistical features was greater than that between the arousal and the statistical features. We selected 10 features with higher correlations for the valence and the arousal. Before that, we did not know whether the features extracted from the 10 s PPG signal or the NN interval were affected by emotions.
Another contribution was the feature fusion of deep-learning and statistical features. Both types of features had limitations, so fusing these features could compensate for the disadvantages of each type of feature. The features based on deep-learning did not contain statistical information about the time and the frequency fields, and statistical features did not cover the overall signals. We fused the CNN features related to the normalized PPG signal, CNN features related to the NN intervals, and the selected statistical features. As a result, we achieved a significant performance with a 10 s physiological signal, which had a shorter recognition interval than that considered in a recent study using respiration.
5. Conclusions
In this paper, we proposed an emotion recognition model using a PPG signal for the short recognition interval. We presented the advantage of using a PPG signal and the feature fusion-based neural network. To extract features, we preprocessed the PPG signal as a normalized 10 s PPG signal and 10 s NN intervals. Both preprocessed outputs were used to extract the statistical features and the deep-learning features.
We extracted the time domain features based on the NN intervals and the frequency domain features based on the normalized PPG signal. Among the 19 statistical features, we selected 10 statistical features that had a higher correlation coefficient through Pearson’s correlation. In addition, the CNN model was adopted to extract the features of the NN interval and the normalized PPG signal. After feature extraction through CNN, statistical features and CNN-based features were fused, and all the features were trained in the fully connected layer to classify emotions. As a result, we utilized both statistical features and deep-learning features to use the advantages of both methods. Furthermore, our method showed an impressive performance for the arousal and the valence with the shortest recognition interval of the 10 s PPG signal. It is possible to easily measure emotions in real life and apply it for stress assessment.
Our future works include adding the dominance parameter as a new dimension of the emotion model. Dominance represents dominant versus controlled emotions one feels. It allows more precise emotion recognition. Furthermore, we will add another physiological signal to complement the PPG signal. It is possible to improve the accuracy by extracting other statistical features with other signals.


