Comparison of Capillary Flow Porometry (CFP) and Liquid Extrusion Porometry (LEP) Techniques for the Characterization of Porous and Face Mask Membranes


Abstract
Featured Application
Abstract
1. Introduction
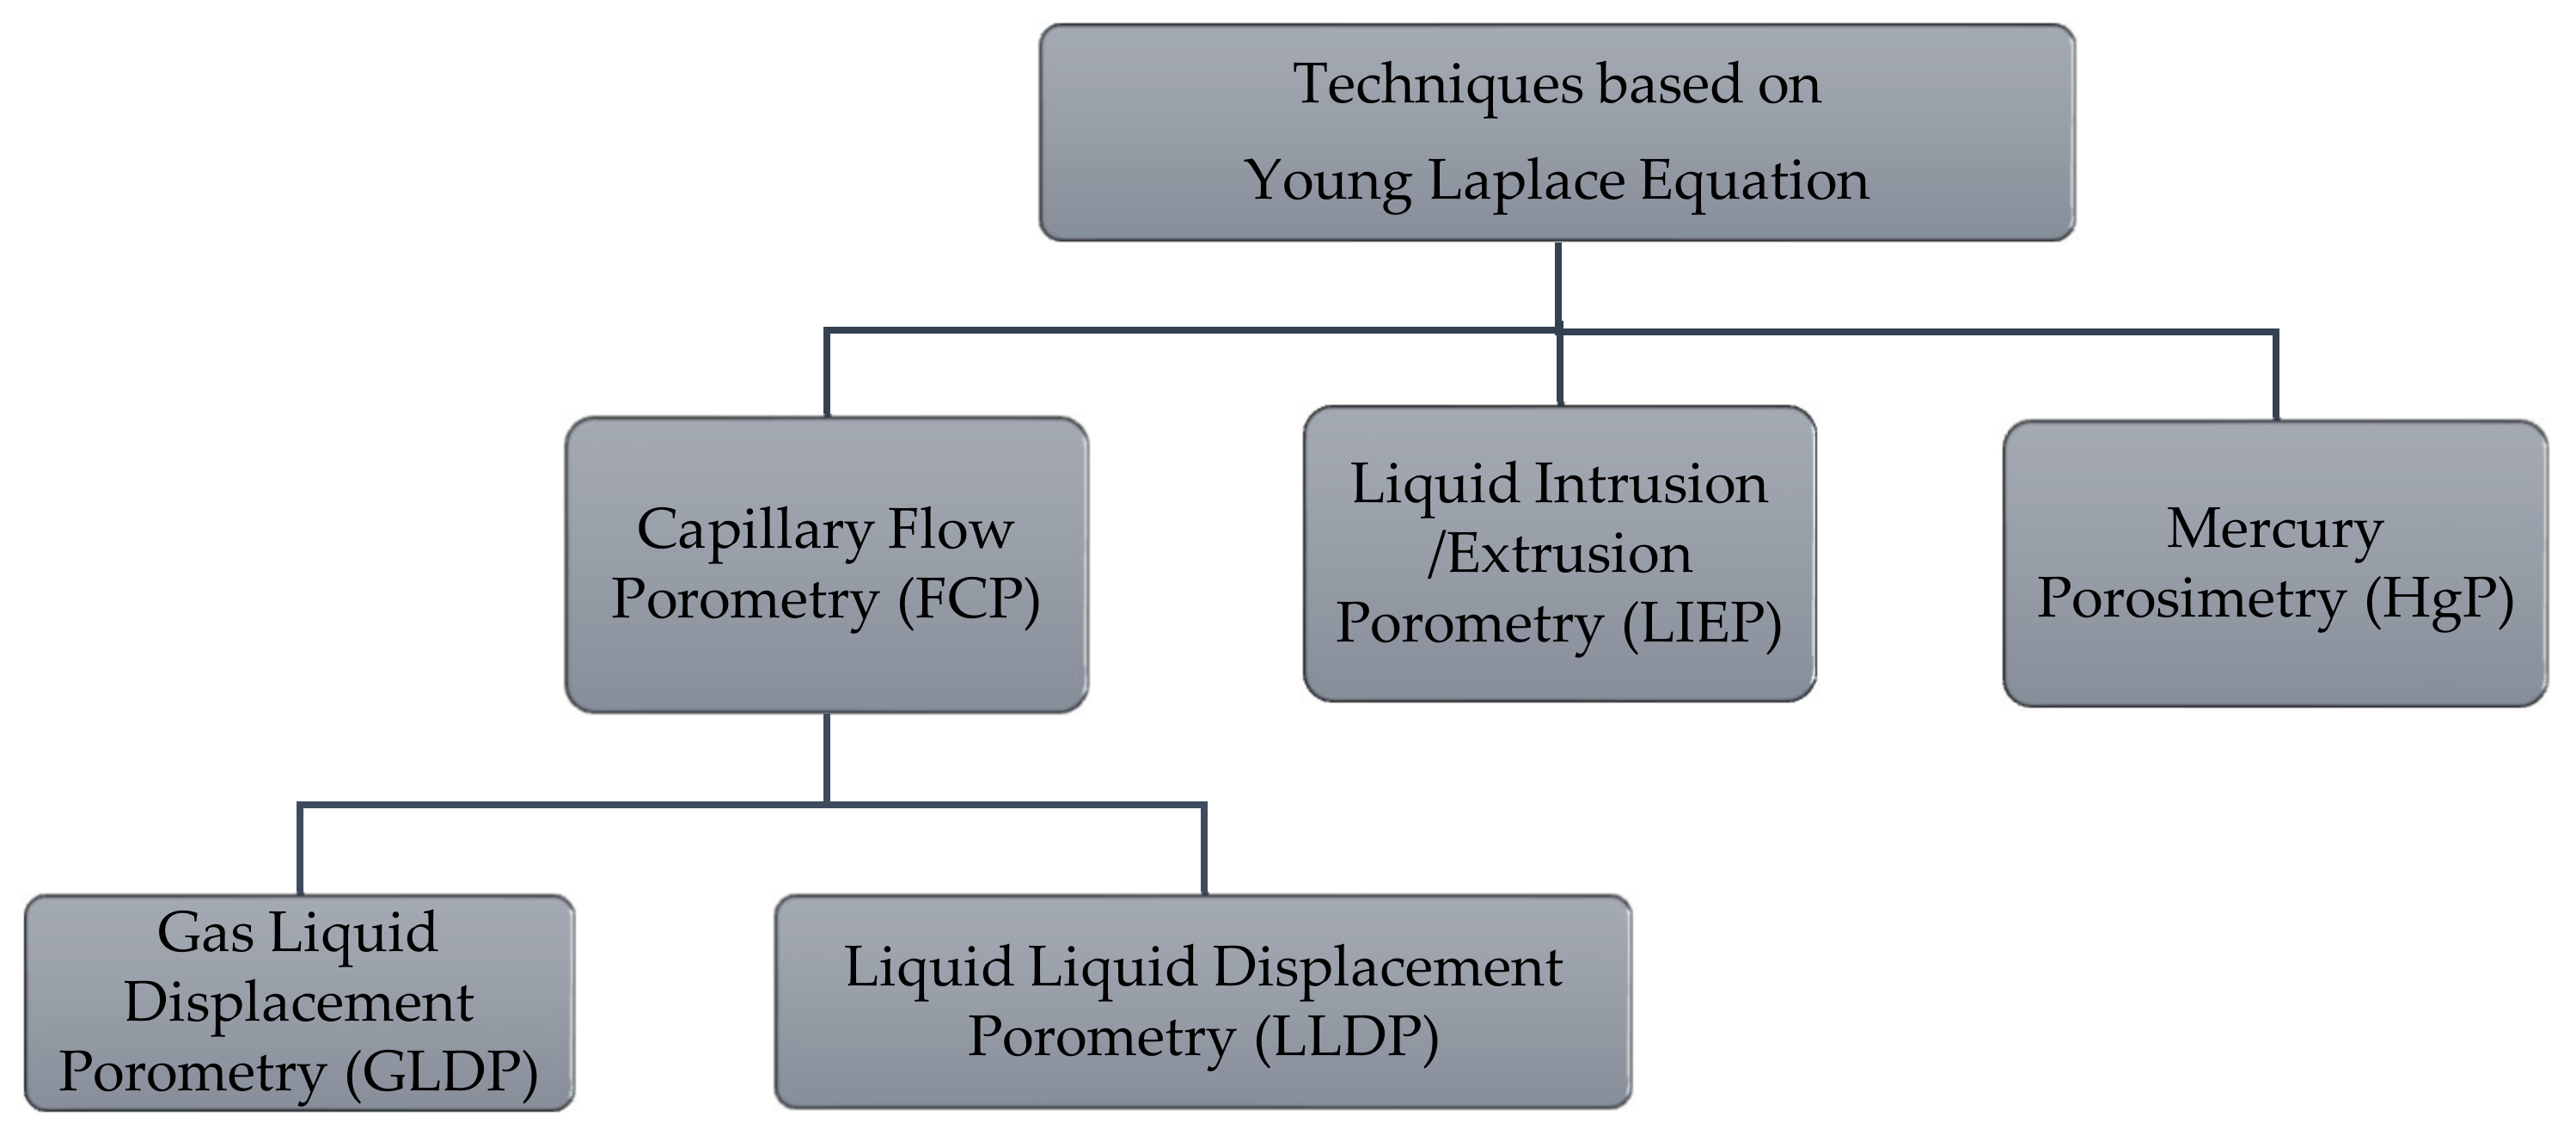
2. Theory
2.1. Capillary Flow Porometry (CFP) Principles
2.2. Liquid Intrusion/Extrusion Porometry (LIEP) Principles
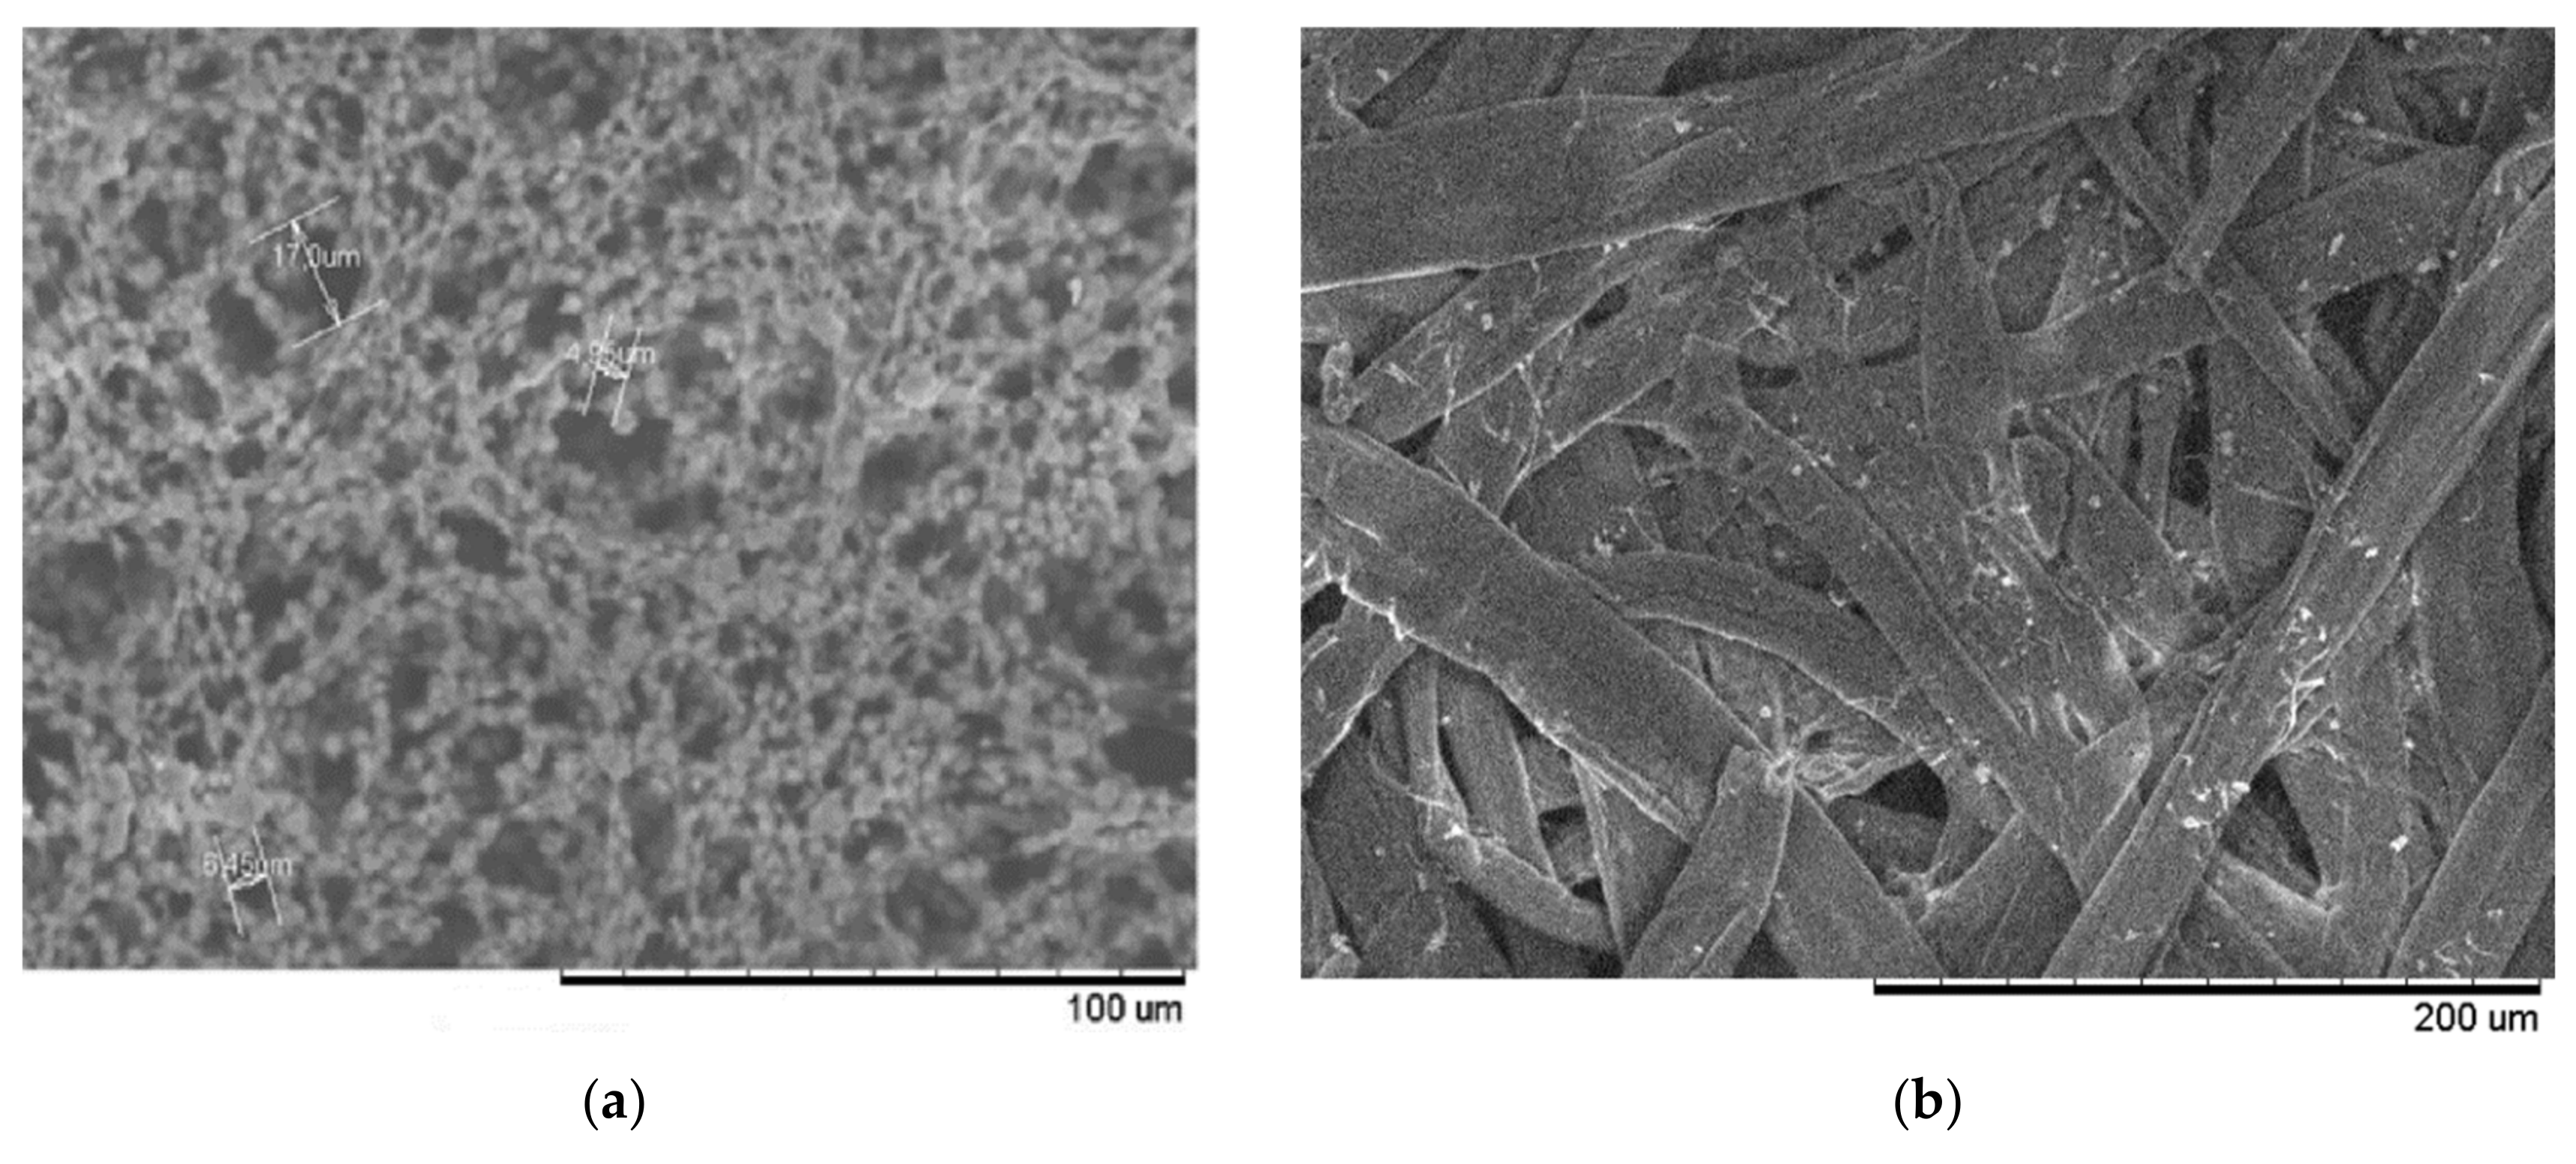
3. Materials and Methods
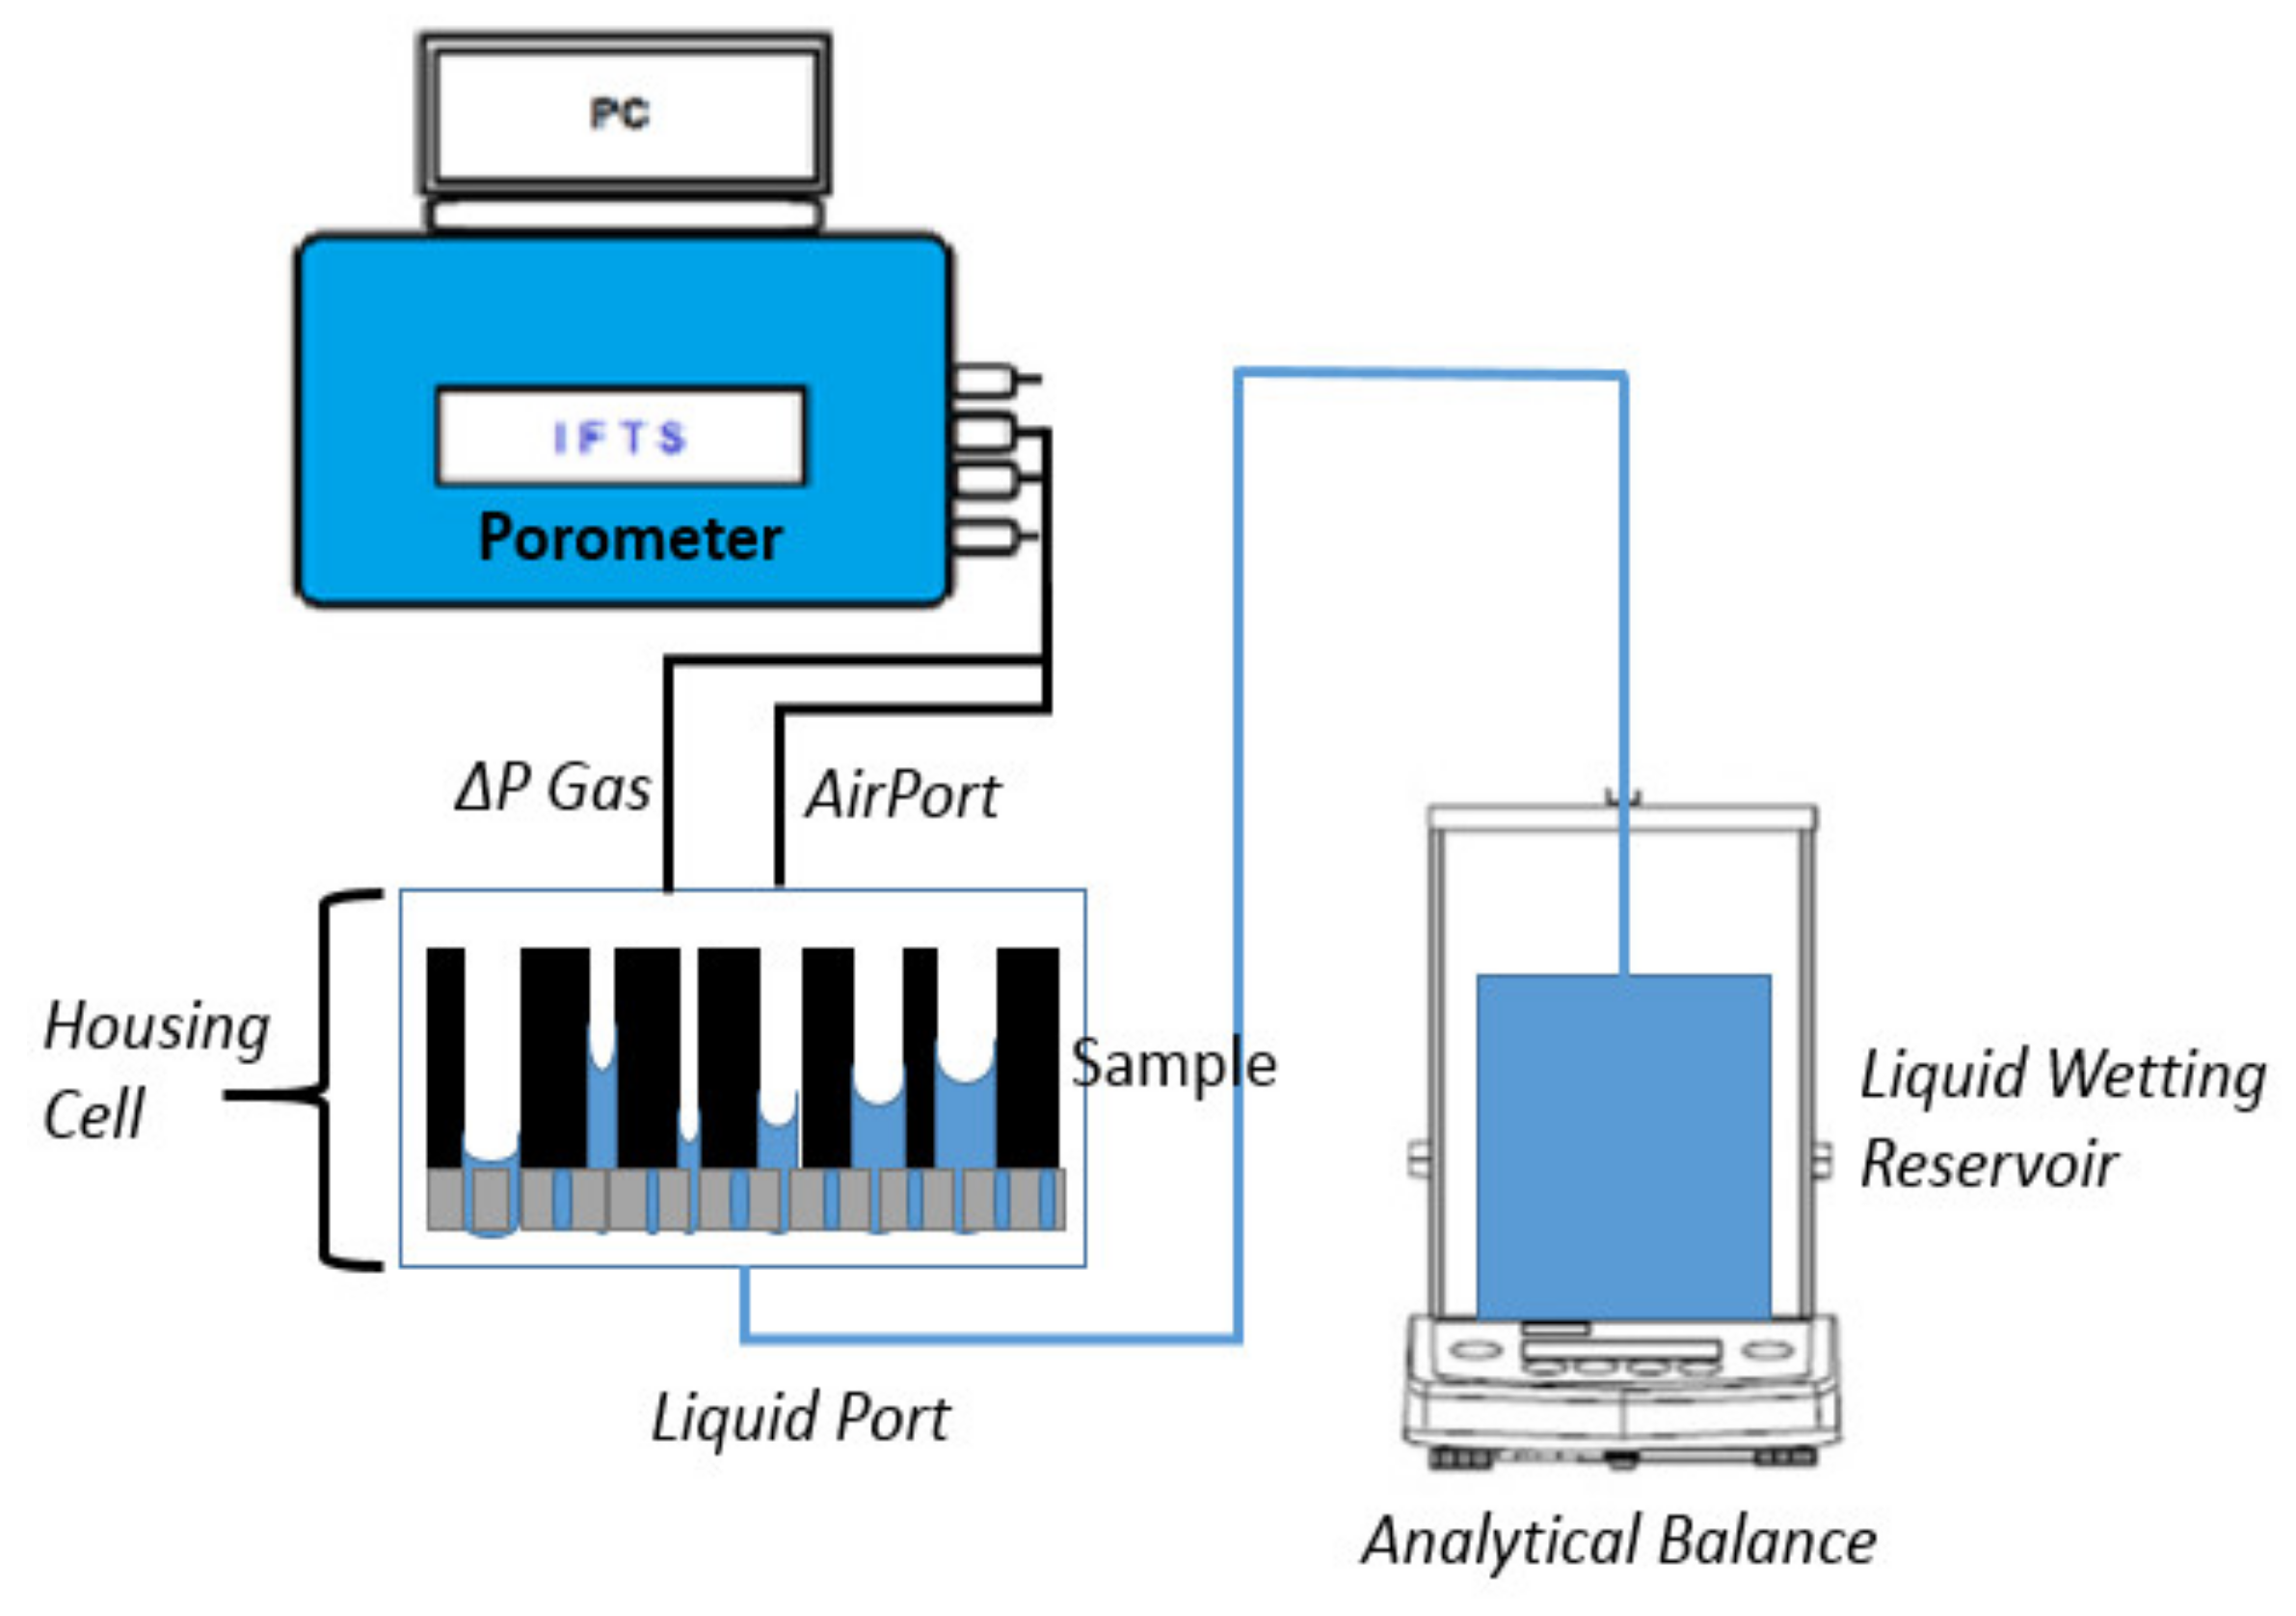
3.1. Capillary Flow Porometry (CFP) Method
3.2. Liquid Extrusion Porometry (LEP) Method
4. Results and Discussion
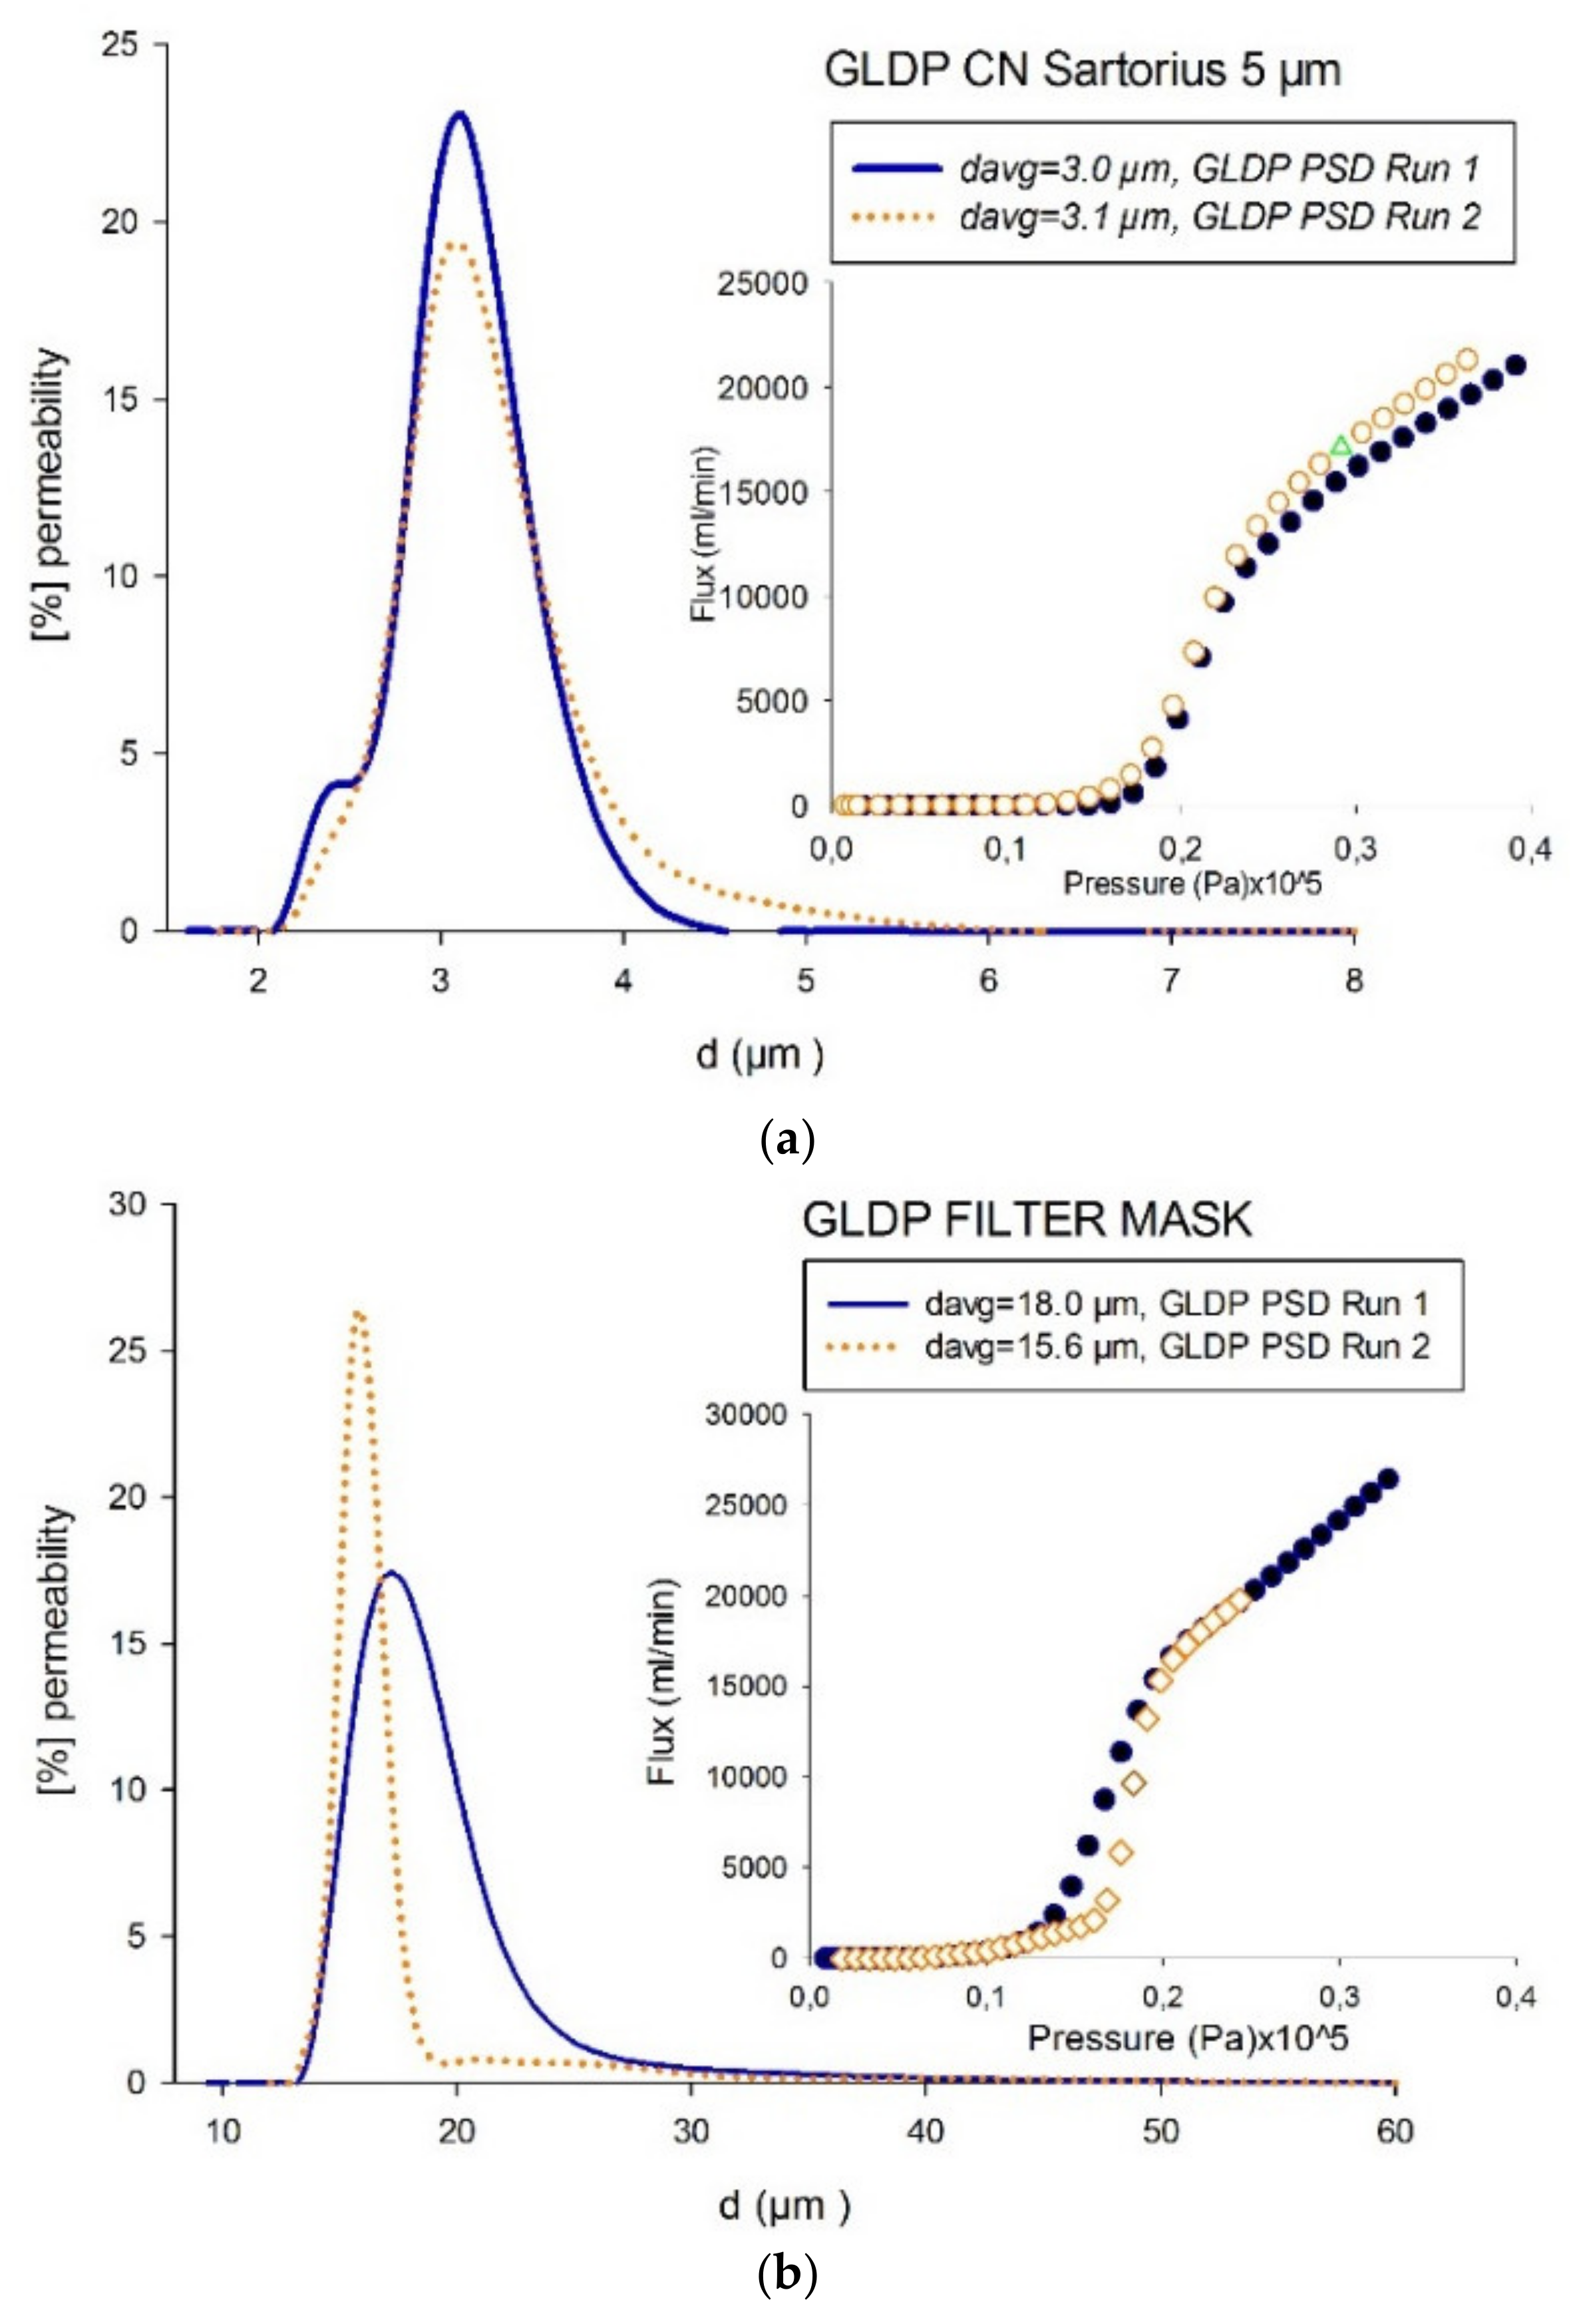
4.1. Flux vs. Pressure for the Flow Capillary Porometry Technique
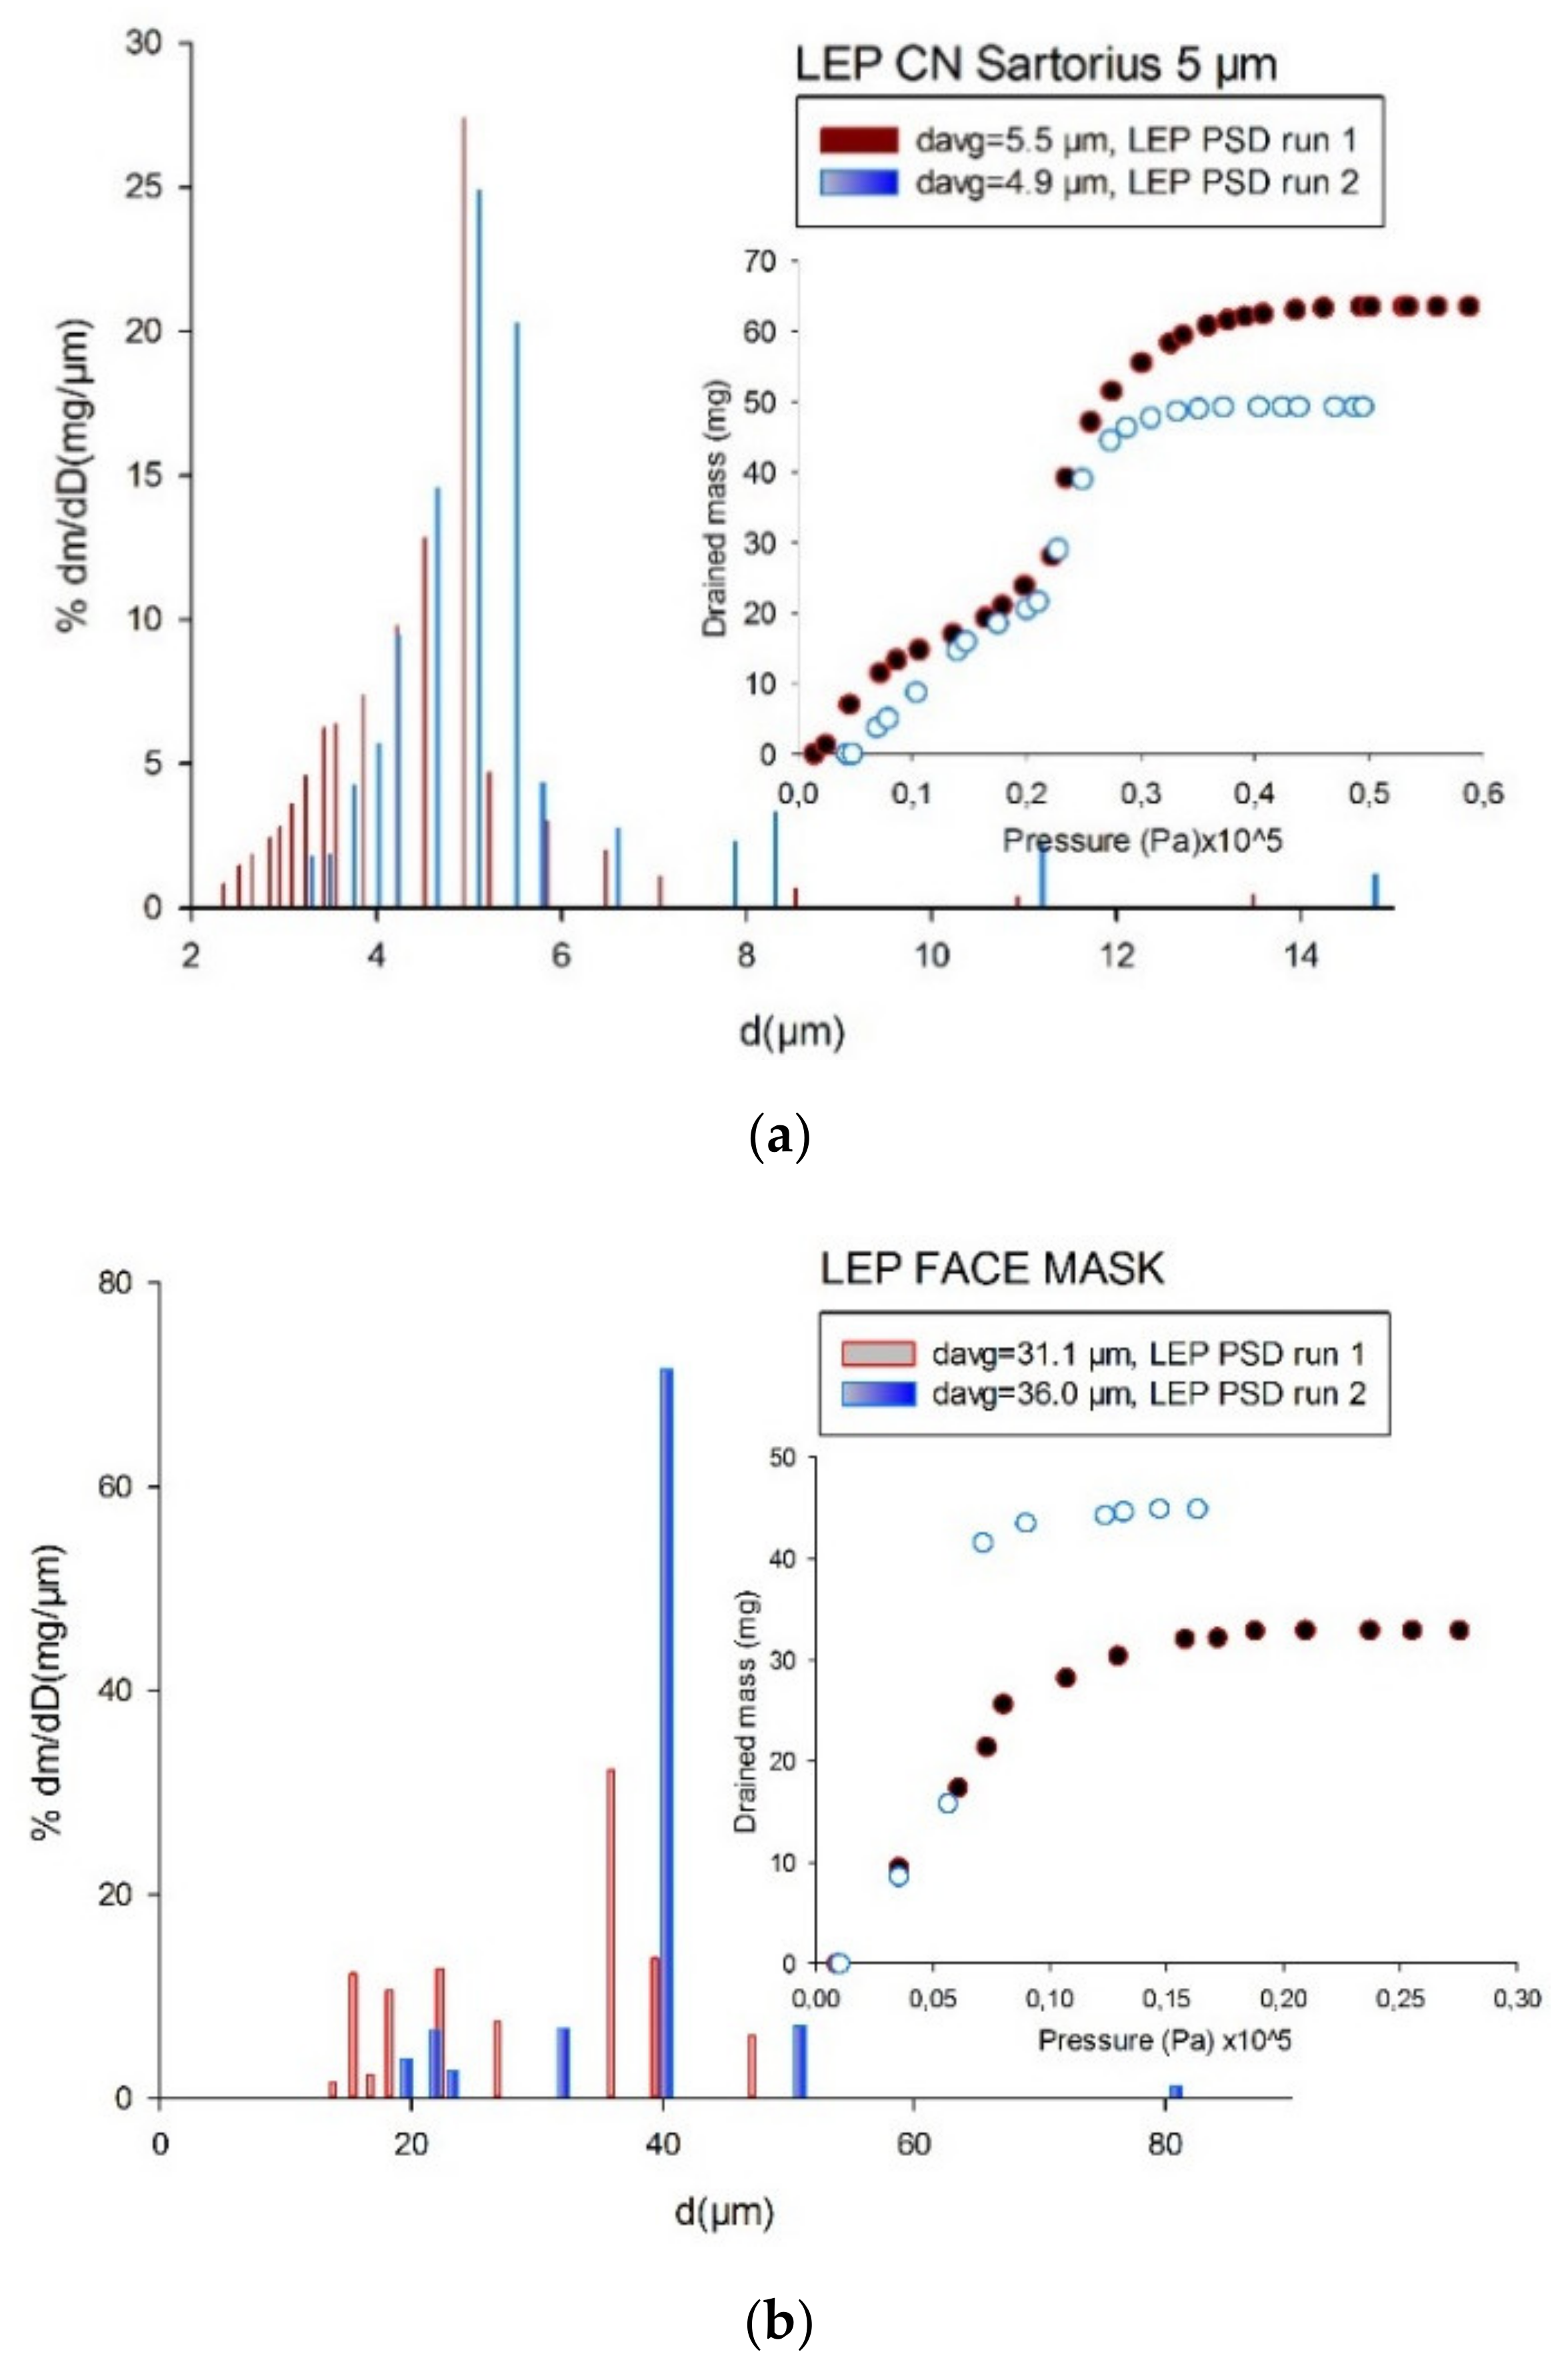
4.2. Drained Mass vs. Capillary Pressure for the Liquid Extrusion Porometry Technique
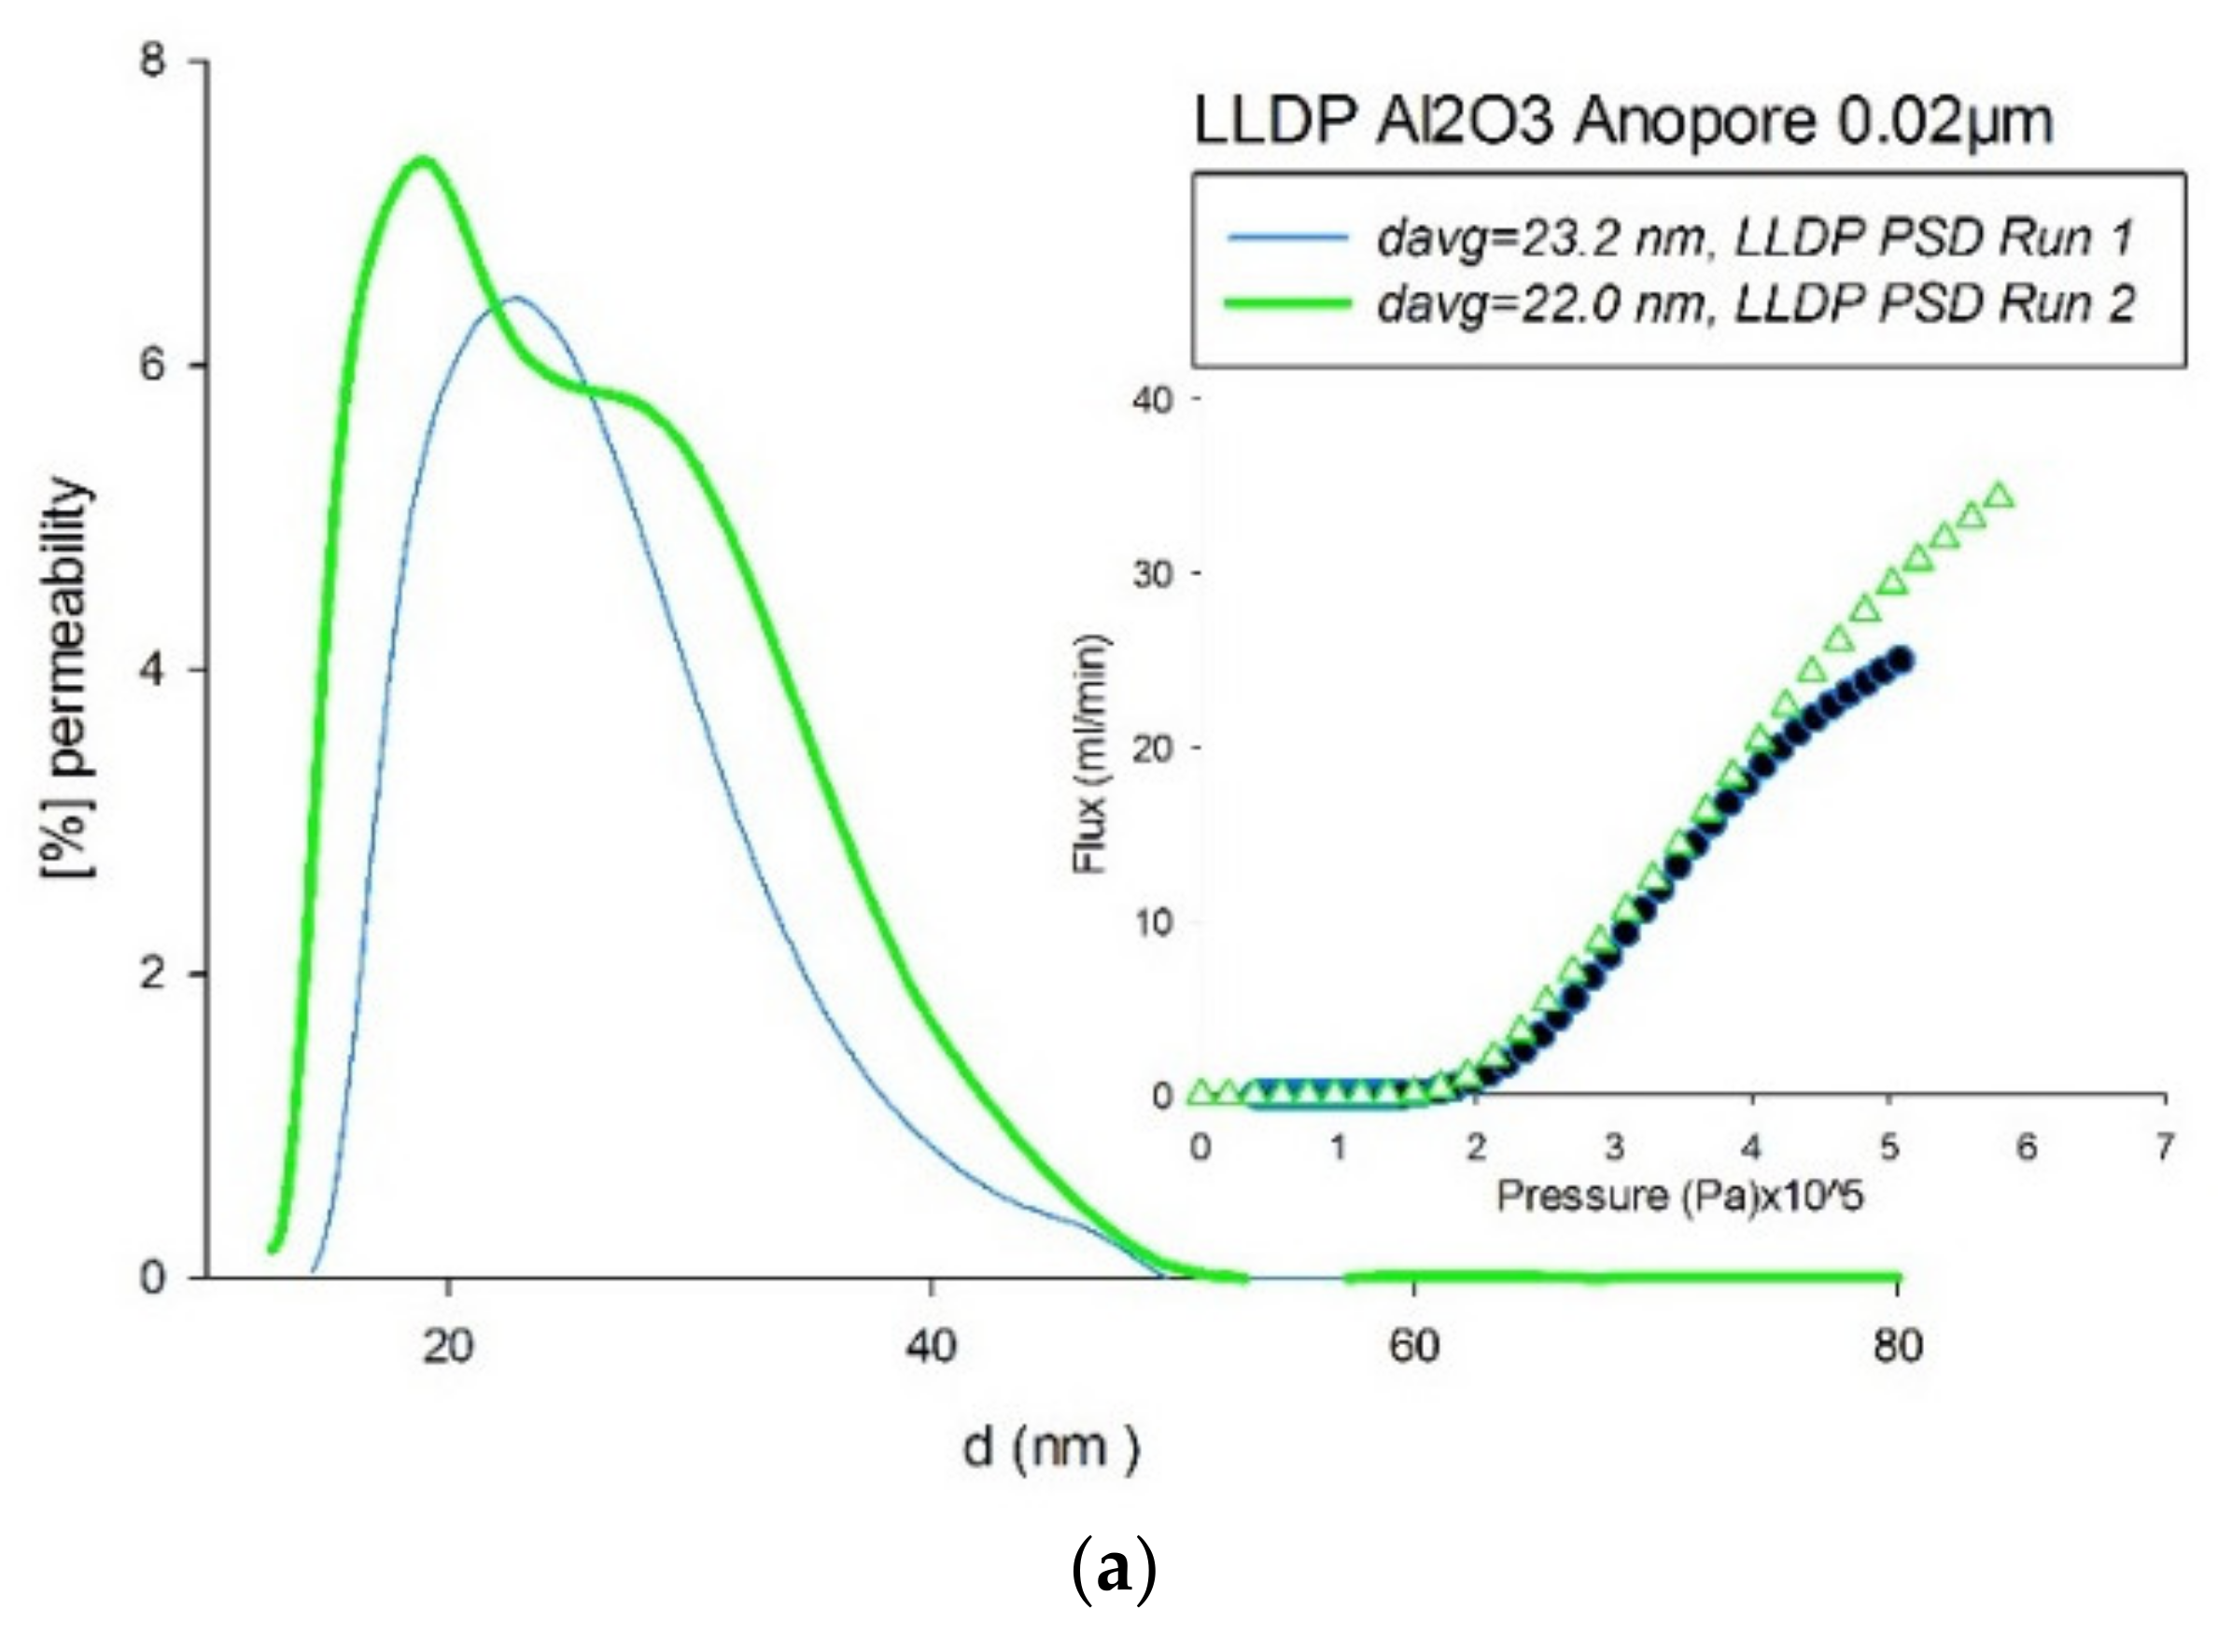
4.3. Comparison of Pore-Size Distributions (PSDs)
5. Conclusions
Author Contributions
Funding
Conflicts of Interest
Nomenclature
| Al2O3 | Alumina |
| ΔP | Differential pressure (Pa, bar) |
| Δm | Differential mass (mg) |
| Δd | Differential pore diameter (m) |
| dp | Pore diameter (m) |
| davg | Mean pore diameter (m) |
| FM | Face mask |
| GLDP | Gas liquid displacement porometry |
| HgP | Mercury porometry |
| h | Distance between the liquid reservoir level and sample surface (LEP porometry) |
| IFTS | Institut de la Filtration et des Techniques Séparatives |
| J | Volume flow (m3/s) |
| L | Permeability (m3/Pa s) |
| LEIP | Liquid intrusion/extrusion porometry |
| LEP | Liquid extrusion porometry |
| LLDP | Liquid-liquid displacement porometry |
| m | Drained mass (mg) |
| MF | Micro Filtration |
| MWCO | Molecular Weight Cut Off (Da) |
| PF | Particle filtration |
| PEMFC | Polymer Electrolyte Membrane Fuel Cells |
| PG | Gas pressure (Pa) |
| PAtm | Atmospheric Pressure (Pa) |
| Pc | Capillary pressure (Pa) |
| PET | Polyethylene membrane |
| PSD | Pore size distribution |
| UF | Ultrafiltration |
| Greek Letters | |
| γ | Interfacial or surface tension of the fluid pairs and membrane surface (mN/m) |
| p | Liquid density (Kg/m3) |
| θ | Contact angle (°) |
References
- Owen, G.; Bandi, M.; Howell, J.; Churchouse, S. Economic assessment of membrane processes for water and waste water treatment. J. Membr. Sci. 1995, 102, 77–91. [Google Scholar] [CrossRef]
- Cui, Z.F.; Jiang, Y.; Field, R.W. Chapter 1—Fundamentals of Pressure-Driven Membrane Separation Processes. In Membrane Technology; Cui, Z.F., Muralidhara, H.S., Eds.; Butterworth-Heinemann: Oxford, UK, 2010; pp. 1–18. [Google Scholar]
- Calvo, B.J.I.; Prádanos, P.; Palacio, L.; Hernández, A. Membrane Characterization: Porosity. In Encyclopedia of Membrane Science and Technology; Wiley Interscience Pub: New York, NY, USA, 2013; pp. 1–35. [Google Scholar]
- Ochoa, N.A.; Prádanos, P.; Palacio, L.; Pagliero, C.; Marchese, J.; Hernandez, A. Pore size distributions based on AFM imaging and retention of multidisperse polymer solutes. J. Membr. Sci. 2001, 187, 227–237. [Google Scholar] [CrossRef]
- Reingruber, H.; Zankel, A.; Mayrhofer, C.; Poelt, P. A new in situ method for the characterization of membranes in a wet state in the environmental scanning electron microscope. J. Membr. Sci. 2012, 399, 86–94. [Google Scholar] [CrossRef]
- Akhondi, E.; Wicaksana, F.; Krantz, W.B.; Fane, A. Evapoporometry determination of pore-size distribution and pore fouling of hollow fiber membranes. J. Membr. Sci. 2014, 470, 334–345. [Google Scholar] [CrossRef]
- Krantz, W.; Greenberg, A.; Kujundzic, E.; Yeo, A.; Hosseini, S.S. Evapoporometry: A novel technique for determining the pore-size distribution of membranes. J. Membr. Sci. 2013, 438, 153–166. [Google Scholar] [CrossRef]
- Niasar, V.; Hassanizadeh, S.M. Analysis of Fundamentals of Two-Phase Flow in Porous Media Using Dynamic Pore-Network Models: A Review. Crit. Rev. Environ. Sci. Technol. 2012, 42, 1895–1976. [Google Scholar] [CrossRef]
- Lenormand, R.; Touboul, E.; Zarcone, C. Numerical models and experiments on immiscible displacements in porous media. J. Fluid Mech. 1988, 189, 165. [Google Scholar] [CrossRef]
- Erbe, F. Die Bestimmung der Porenverteilung nach ihrer Größe in Filtern und Ultrafiltern. Colloid Polym. Sci. 1933, 63, 277–285. [Google Scholar] [CrossRef]
- Hernandez, A.; Calvo, J.; Prádanos, P.; Tejerina, F. Pore size distributions in microporous membranes. A critical analysis of the bubble point extended method. J. Membr. Sci. 1996, 112, 1–12. [Google Scholar] [CrossRef]
- Shao, P.; Huang, R.Y.; Feng, X.; Anderson, W. Gas-liquid displacement method for estimating membrane pore-size distributions. AIChE J. 2004, 50, 557–565. [Google Scholar] [CrossRef]
- Standard Test Method for Pore Size Characteristics of Membrane Filters Using Automated Liquid Porosimeter; ASTM International: West Conshohocken, PA, USA, 1999.
- Calvo, J.; Hernandez, A.; Prádanos, P.; Martınez, L.; Bowen, W. Pore Size Distributions in Microporous Membranes II. Bulk Characterization of Track-Etched Filters by Air Porometry and Mercury Porosimetry. J. Colloid Interface Sci. 1995, 176, 467–478. [Google Scholar] [CrossRef]
- Calvo, J.I.; Bottino, A.; Capannelli, G.; Hernandez, A. Pore size distribution of ceramic UF membranes by liquid–liquid displacement porosimetry. J. Membr. Sci. 2008, 310, 531–538. [Google Scholar] [CrossRef]
- Calvo, J.I.; Peinador, R.I.; Prádanos, P.; Bottino, A.; Comite, A.; Firpo, R.; Hernandez, A. Porosimetric characterization of polysulfone ultrafiltration membranes by image analysis and liquid–liquid displacement technique. Desalination 2015, 357, 84–92. [Google Scholar] [CrossRef][Green Version]
- Calvo, J.I.; Peinador, R.I.; Prádanos, P.; Palacio, L.; Bottino, A.; Capannelli, G.; Hernandez, A. Liquid–liquid displacement porometry to estimate the molecular weight cut-off of ultrafiltration membranes. Desalination 2011, 268, 174–181. [Google Scholar] [CrossRef]
- Calvo, J.I.; Peinador, R.I.; Thom, V.; Schleuss, T.; ToVinh, K.; Prádanos, P.; Hernandez, A. Comparison of pore size distributions from dextran retention tests and liquid-liquid displacement porosimetry. Microporous Mesoporous Mater. 2017, 250, 170–176. [Google Scholar] [CrossRef]
- Tanis-Kanbur, M.B.; Peinador, R.I.; Hu, X.; Calvo, J.I.; Chew, J.W. Membrane characterization via evapoporometry (EP) and liquid-liquid displacement porosimetry (LLDP) techniques. J. Membr. Sci. 2019, 586, 248–258. [Google Scholar] [CrossRef]
- Gostick, J.T.; Ioannidis, M.A.; Fowler, M.W.; Pritzker, M.D. Direct measurement of the capillary pressure characteristics of water–air–gas diffusion layer systems for PEM fuel cells. Electrochem. Commun. 2008, 10, 1520–1523. [Google Scholar] [CrossRef]
- Nam, J.H.; Kaviany, M. Effective diffusivity and water-saturation distribution in single- and two-layer PEMFC diffusion medium. Int. J. Heat Mass Transf. 2003, 46, 4595–4611. [Google Scholar] [CrossRef]
- Kong, C.S.; Kim, Y.; Lee, H.-K.; Shul, Y.-G.; Lee, T.-H. Influence of pore-size distribution of diffusion layer on mass-transport problems of proton exchange membrane fuel cells. J. Power Sources 2002, 108, 185–191. [Google Scholar] [CrossRef]
- Ozden, A.; Shahgaldi, S.; Li, X.; Hamdullahpur, F. A review of gas diffusion layers for proton exchange membrane fuel cells—With a focus on characteristics, characterization techniques, materials and designs. Prog. Energy Combust. Sci. 2019, 74, 50–102. [Google Scholar] [CrossRef]
- Jena, A.; Gupta, K. Advances in Pore Structure Evaluation by Porometry. Chem. Eng. Technol. 2010, 33, 1241–1250. [Google Scholar] [CrossRef]
- Gostick, J.T.; Ioannidis, M.A.; Fowler, M.; Pritzker, M.D. Wettability and capillary behavior of fibrous gas diffusion media for polymer electrolyte membrane fuel cells. J. Power Sources 2009, 194, 433–444. [Google Scholar] [CrossRef]
- Niu, Z.; Wang, Y.; Jiao, K.; Wu, J. Two-Phase Flow Dynamics in the Gas Diffusion Layer of Proton Exchange Membrane Fuel Cells: Volume of Fluid Modeling and Comparison with Experiment. J. Electrochem. Soc. 2018, 165, F613–F620. [Google Scholar] [CrossRef]
- Fairweather, J.D.; Cheung, P.; St-Pierre, J.; Schwartz, D.T. A microfluidic approach for measuring capillary pressure in PEMFC gas diffusion layers. Electrochem. Commun. 2007, 9, 2340–2345. [Google Scholar] [CrossRef]


| Material | Manufacturer | Pore Range | Nominal | Type | Structure | Young-Laplace Technique |
|---|---|---|---|---|---|---|
| Pore Size | ||||||
| Al2O3 | Whatman | UF | 0.02 µm | Disk | Uniform capillary | LLDP |
| PET | Company A | UF | Not available | Flat Sheet | Porous | LLDP |
| CN | Sartorius | MF | 5 µm | Disk | Porous | GLDP/LEP |
| FM | Company B | Particle Filtration | Not available | Flat Sheet | Fiber | GLDP/LEP |
| Membrane | Nominal davg (µm) | Young-Laplace Technique | davg (µm) Flow-Based or Mass Based | Wetting Liquid |
|---|---|---|---|---|
| Al2O3 | 0.02 | LLDP | 0.0226 ± 2.6% | Alcoholic Phase |
| PET | Not available | LLDP | 0.0274 ± 2.1% | Alcoholic Phase |
| NC | 5 | GLDP | 3.1 ± <1% | FC-43 |
| LEP | 5.2 ± 5.7% | Water Rich Phase | ||
| FM | Not available | GLDP | 16.8 ± 7.1% | Ultra-Pure Water |
| LEP | 33.5 ± 7.0% | Ultra-Pure Water |
© 2020 by the authors. Licensee MDPI, Basel, Switzerland. This article is an open access article distributed under the terms and conditions of the Creative Commons Attribution (CC BY) license (http://creativecommons.org/licenses/by/4.0/).
Share and Cite
Peinador, R.I.; Calvo, J.I.; Ben Aim, R. Comparison of Capillary Flow Porometry (CFP) and Liquid Extrusion Porometry (LEP) Techniques for the Characterization of Porous and Face Mask Membranes. Appl. Sci. 2020, 10, 5703. https://doi.org/10.3390/app10165703
Peinador RI, Calvo JI, Ben Aim R. Comparison of Capillary Flow Porometry (CFP) and Liquid Extrusion Porometry (LEP) Techniques for the Characterization of Porous and Face Mask Membranes. Applied Sciences. 2020; 10(16):5703. https://doi.org/10.3390/app10165703
Chicago/Turabian StylePeinador, R. I., José I. Calvo, and Roger Ben Aim. 2020. "Comparison of Capillary Flow Porometry (CFP) and Liquid Extrusion Porometry (LEP) Techniques for the Characterization of Porous and Face Mask Membranes" Applied Sciences 10, no. 16: 5703. https://doi.org/10.3390/app10165703
APA StylePeinador, R. I., Calvo, J. I., & Ben Aim, R. (2020). Comparison of Capillary Flow Porometry (CFP) and Liquid Extrusion Porometry (LEP) Techniques for the Characterization of Porous and Face Mask Membranes. Applied Sciences, 10(16), 5703. https://doi.org/10.3390/app10165703