Fatigue Cracking of Additively Manufactured Materials—Process and Material Perspectives

 , ,
, ,
Abstract
Featured Application
Abstract
1. Introduction
2. Materials and Methods
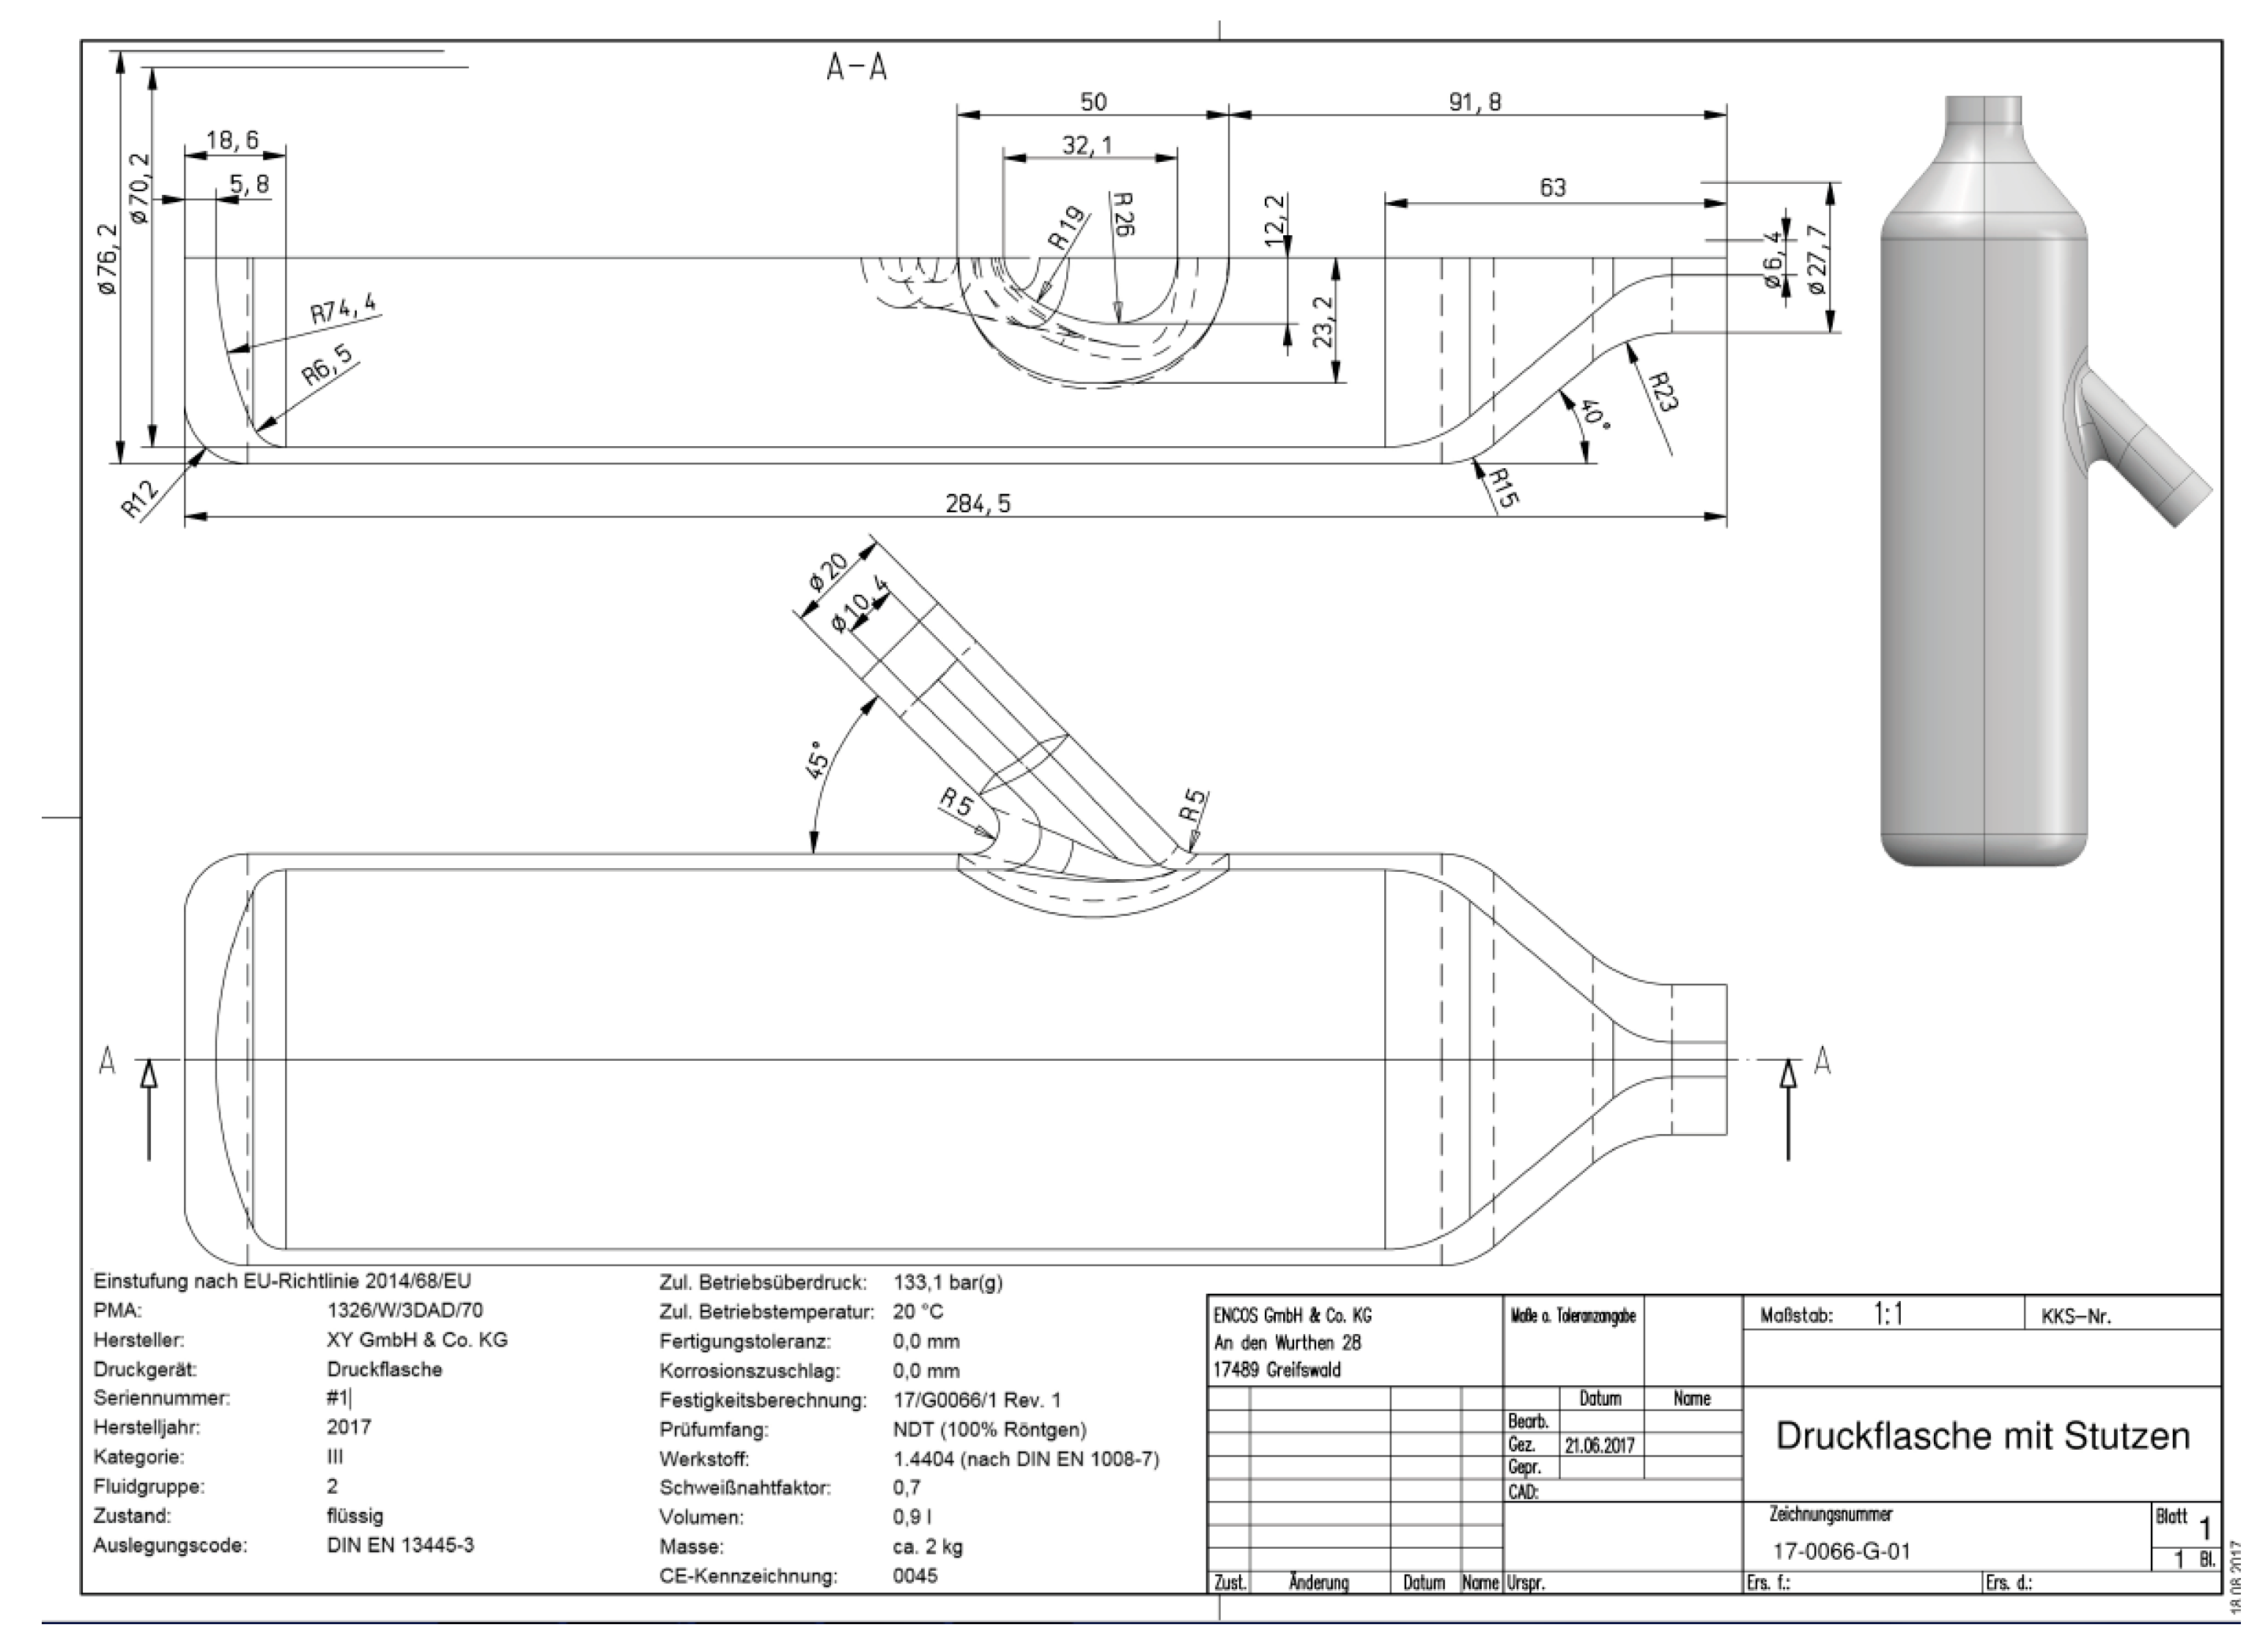
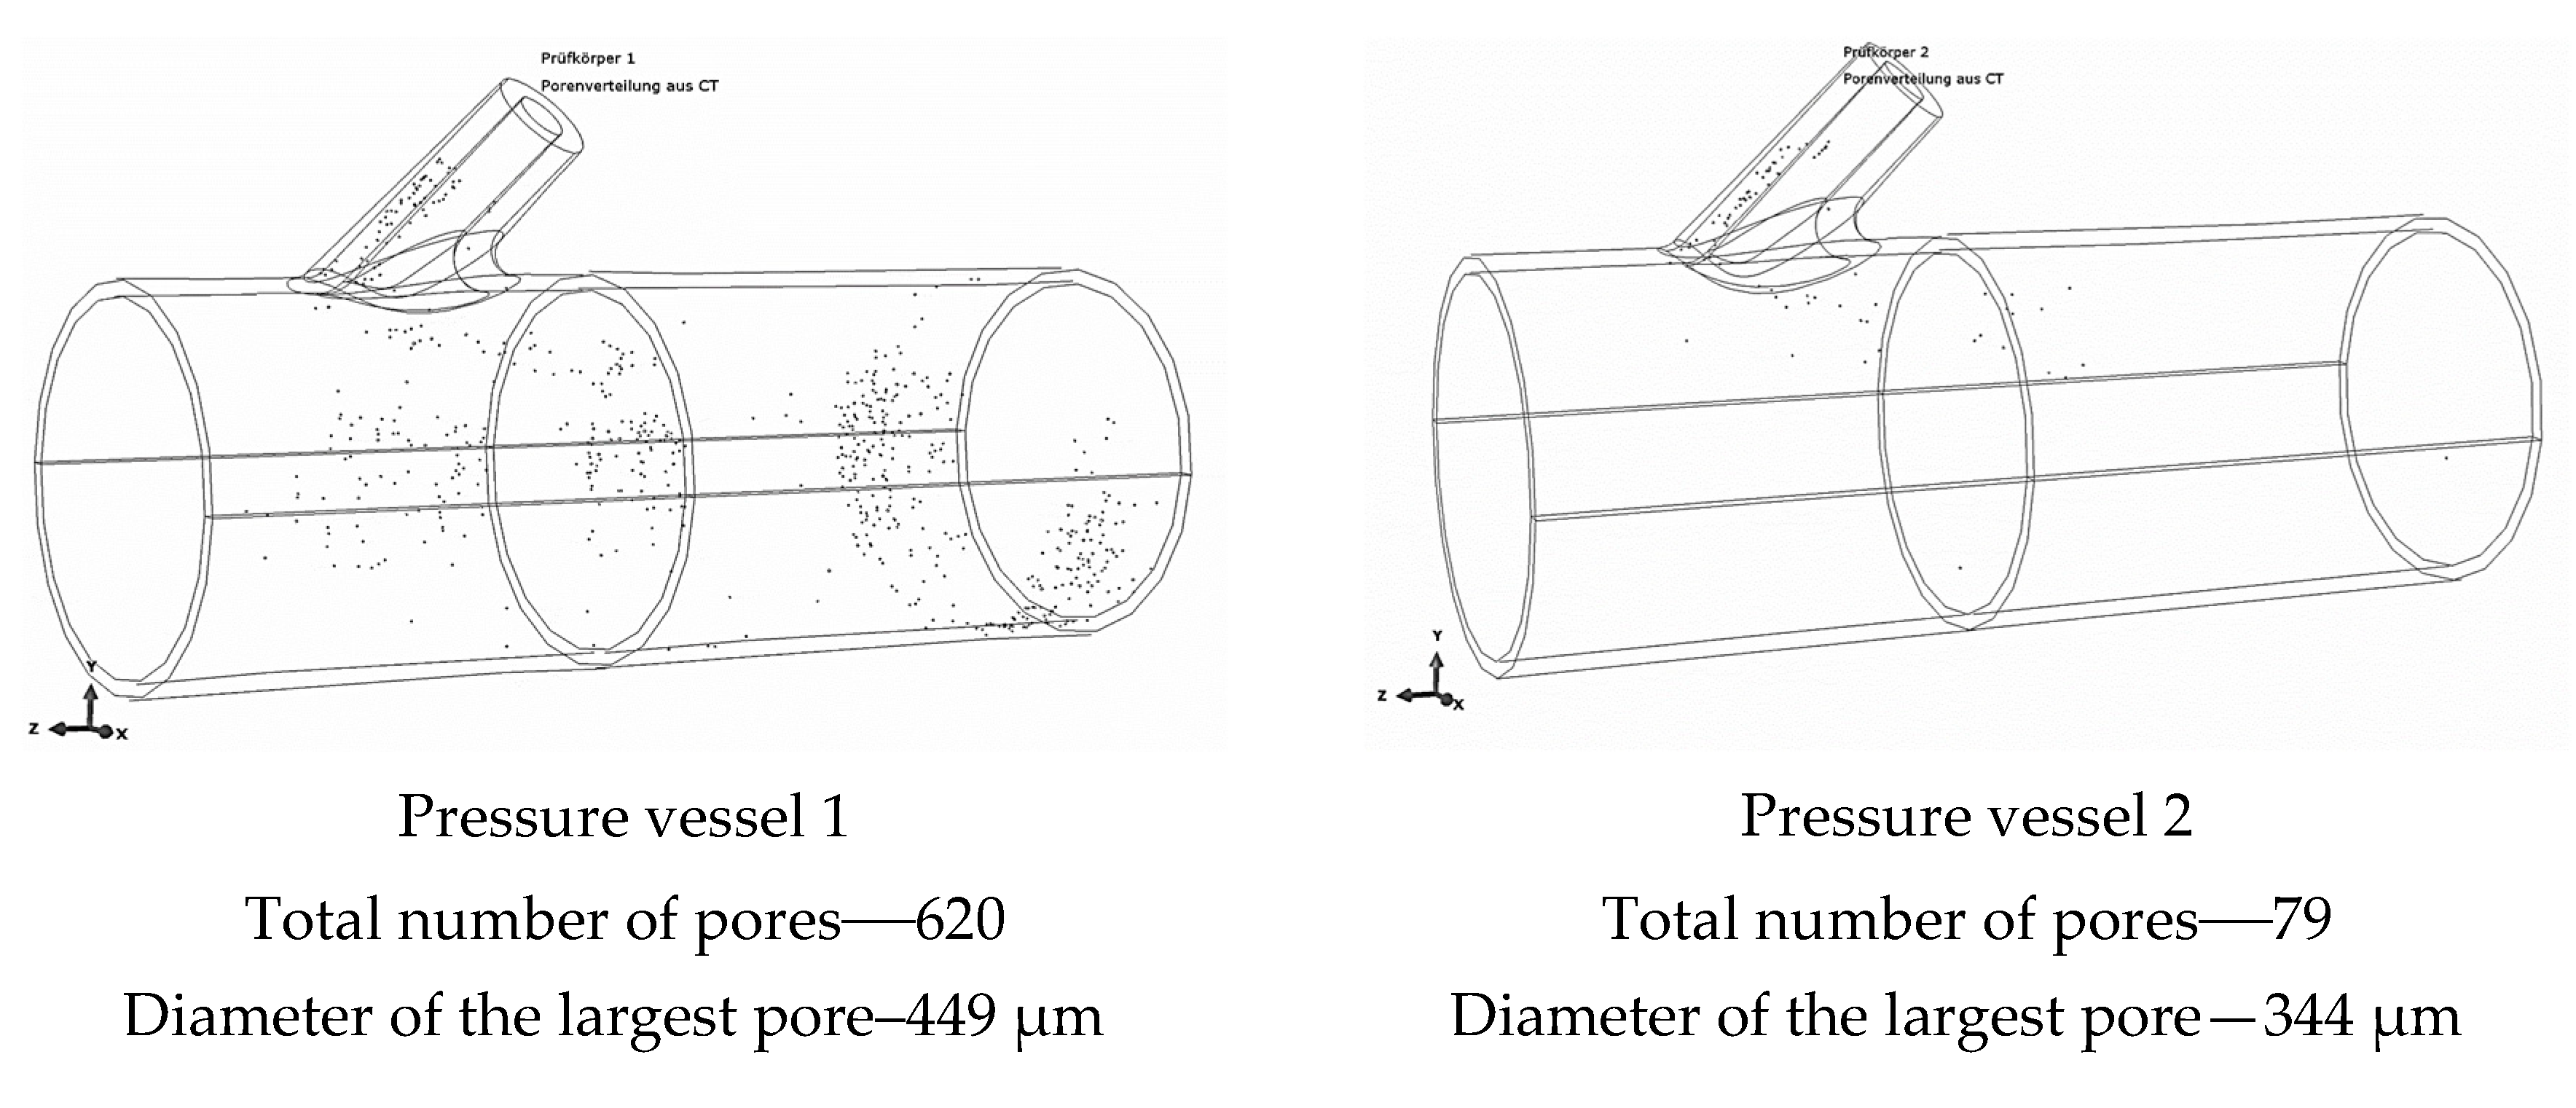
2.1. Test Components and Pore Density Evaluation
2.2. Conventionally and LPBF-Manufactured 316L Materials
2.3. Conventionally and LMD-Manufactured Laves Phase Strengthened Ferritic Steel Materials
2.4. Thermomechanical Fatigue Experiments
2.5. Fatigue Crack Growth Experiments
2.6. Microstructure Investigation
3. Results and Discussion
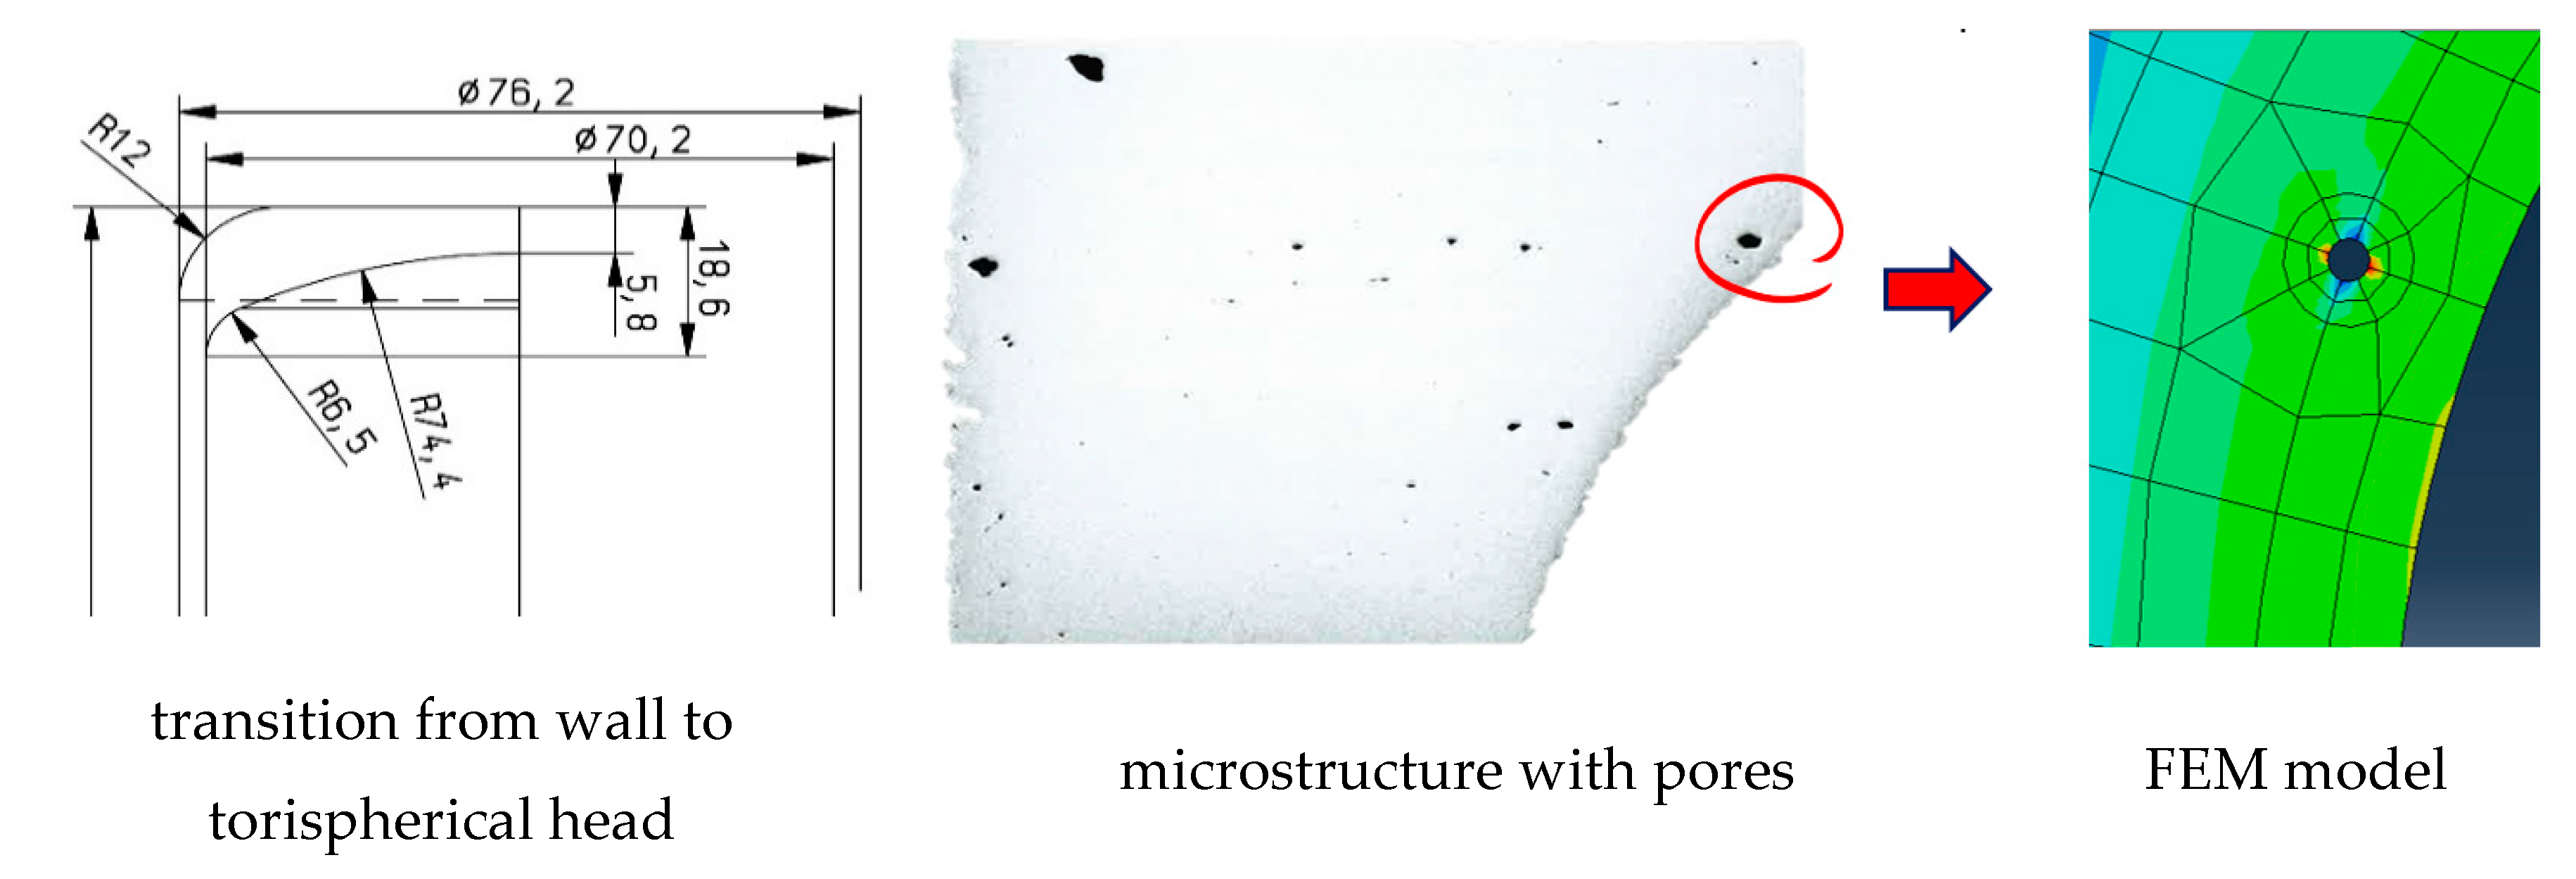
3.1. Pore Density Evaluation of the Model Pressure Vessel
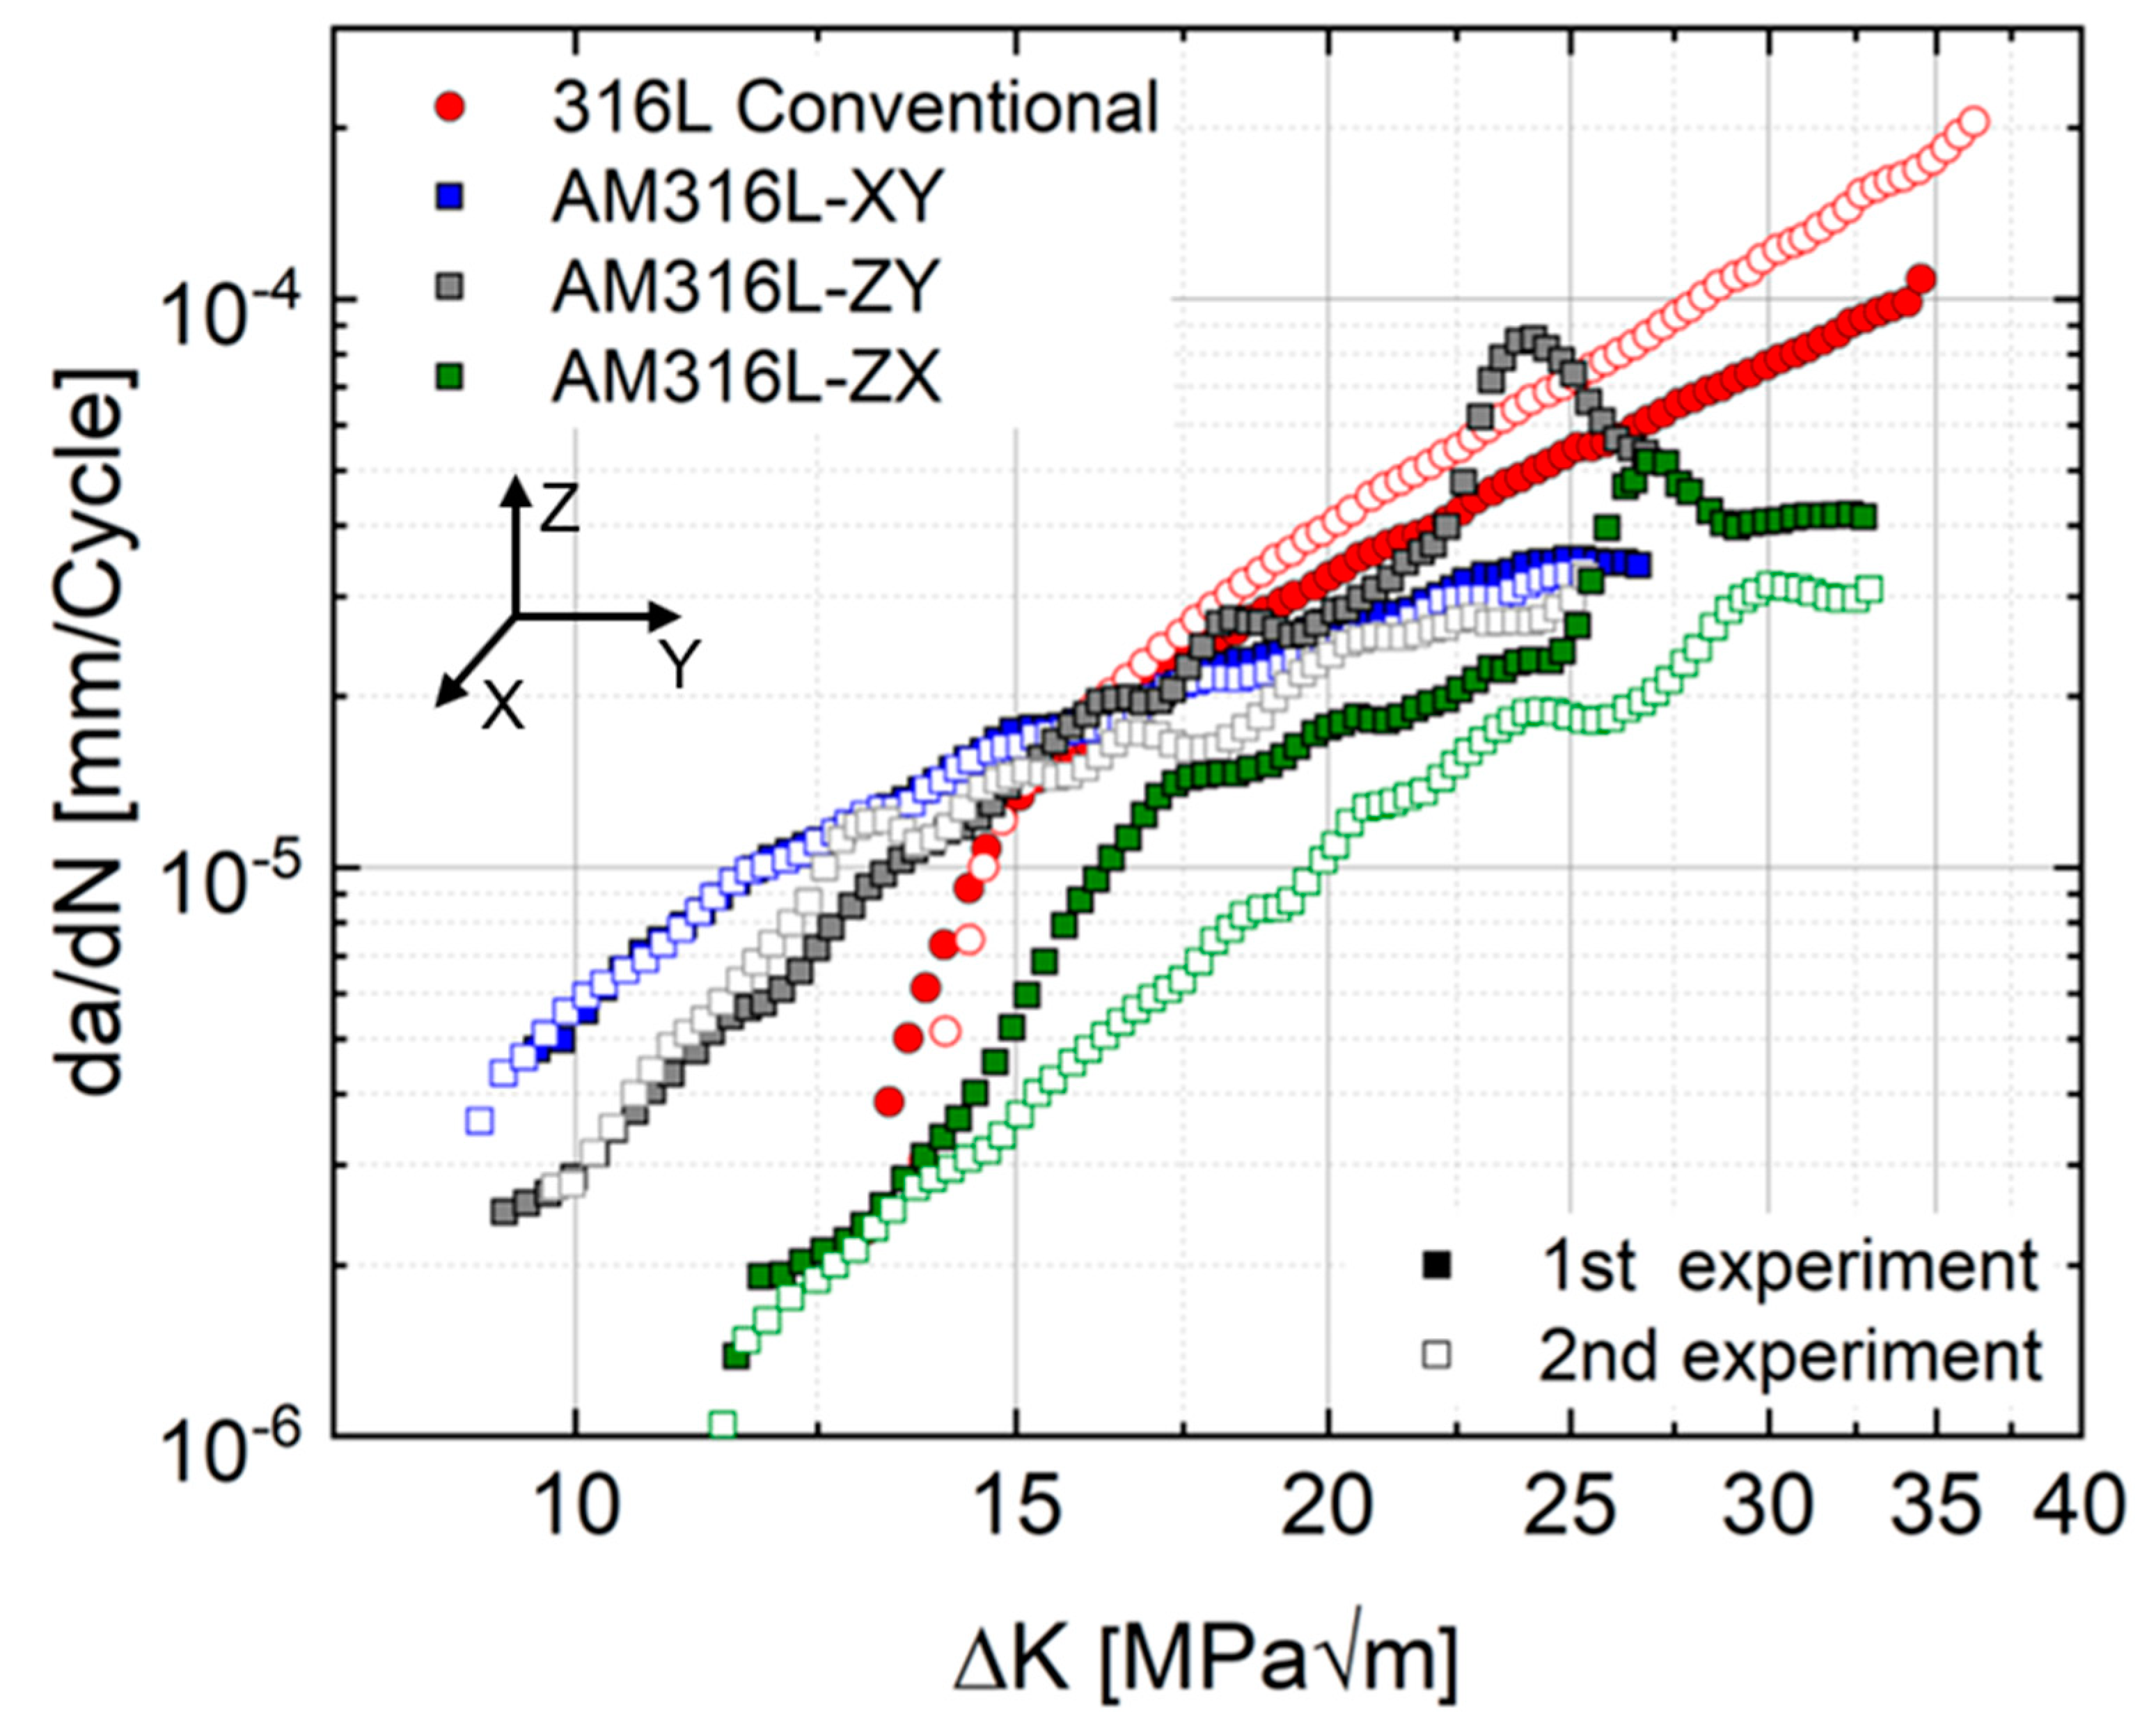
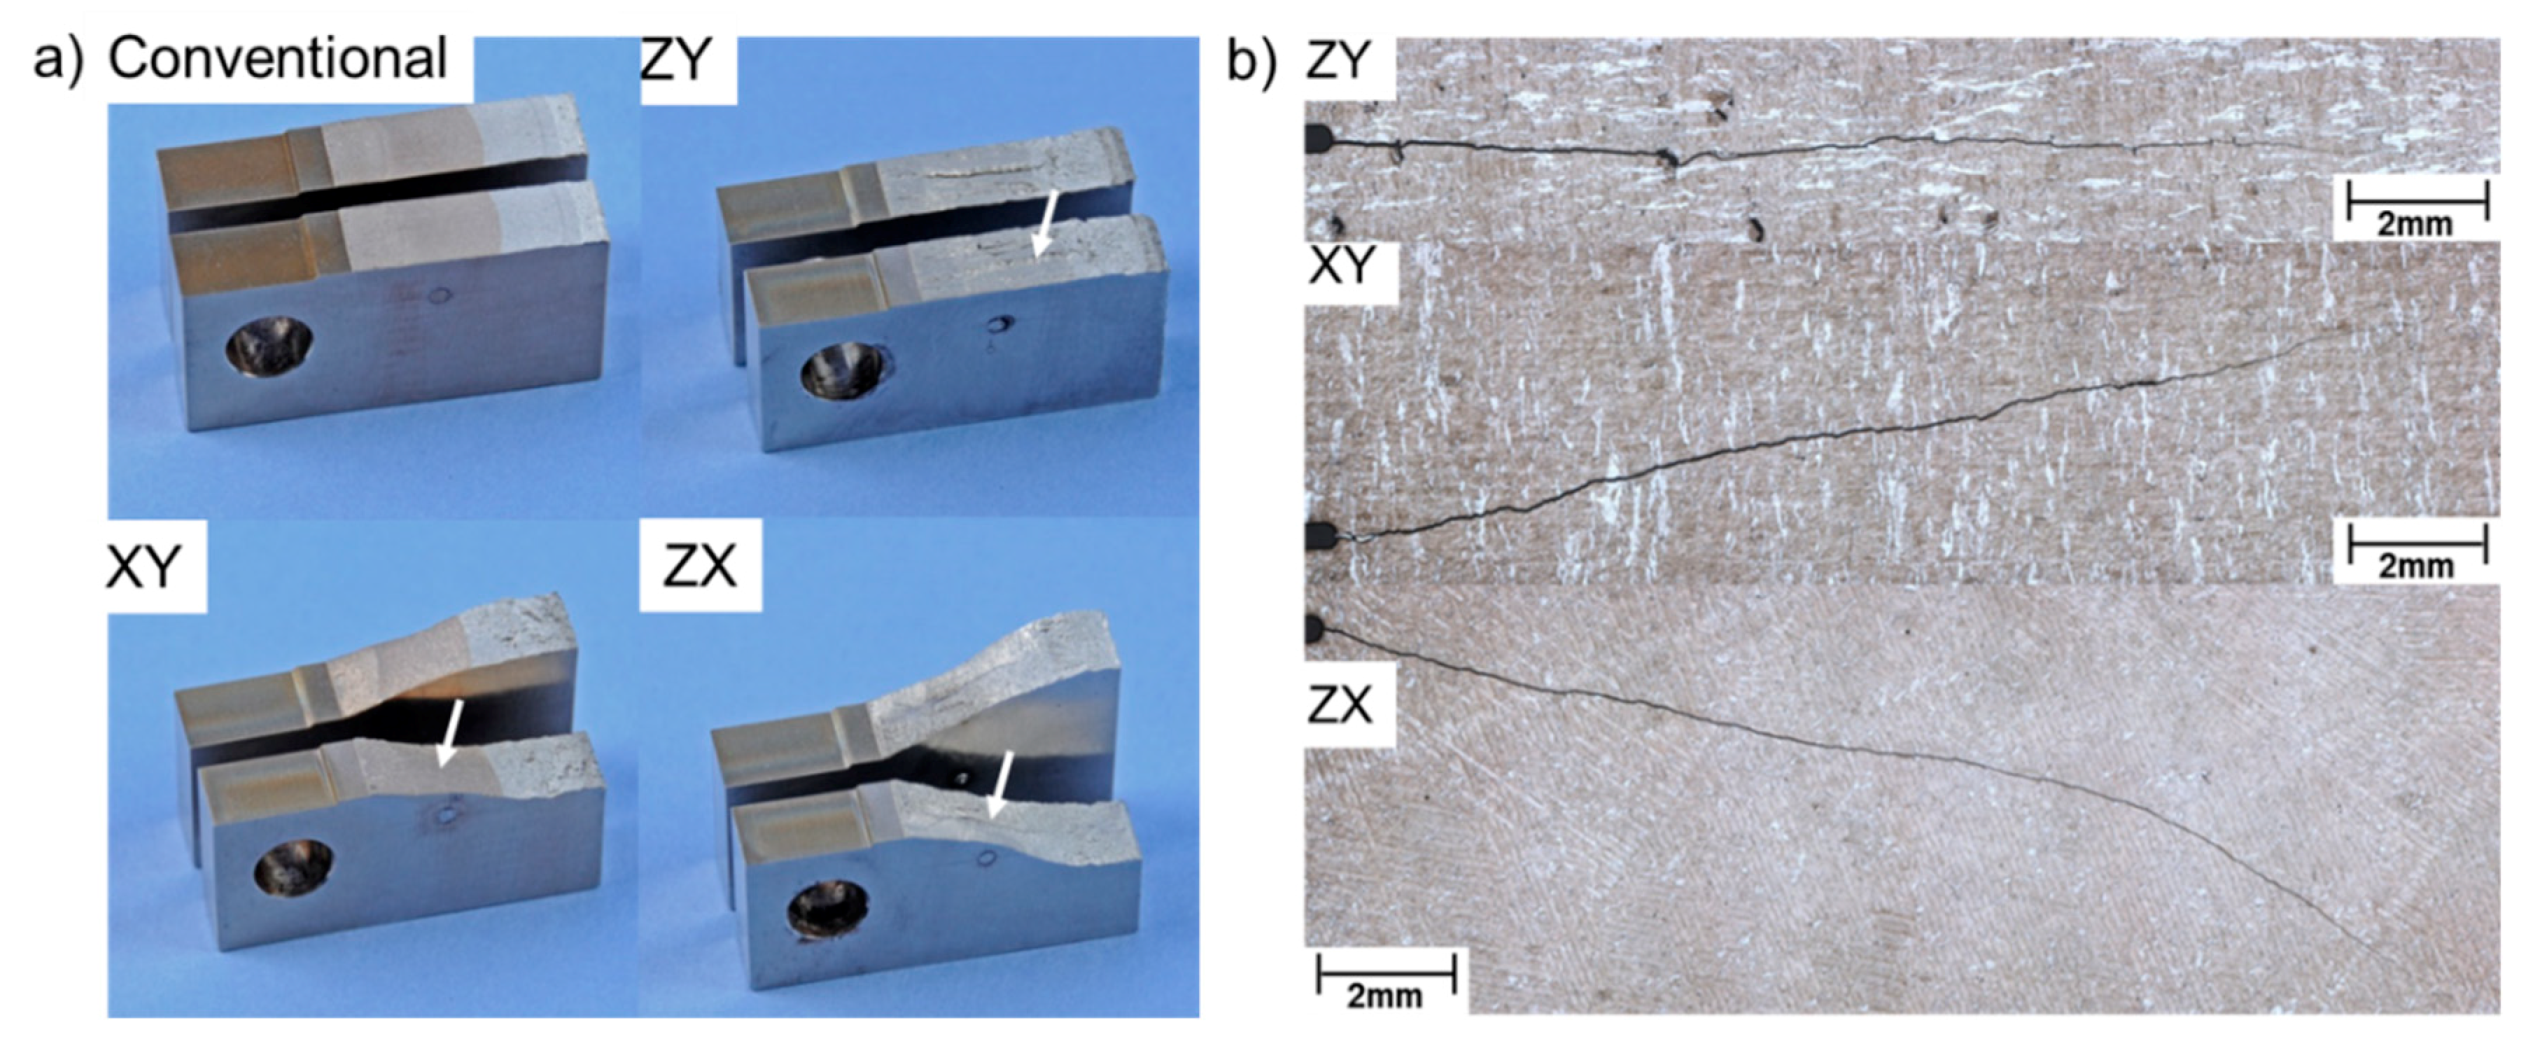
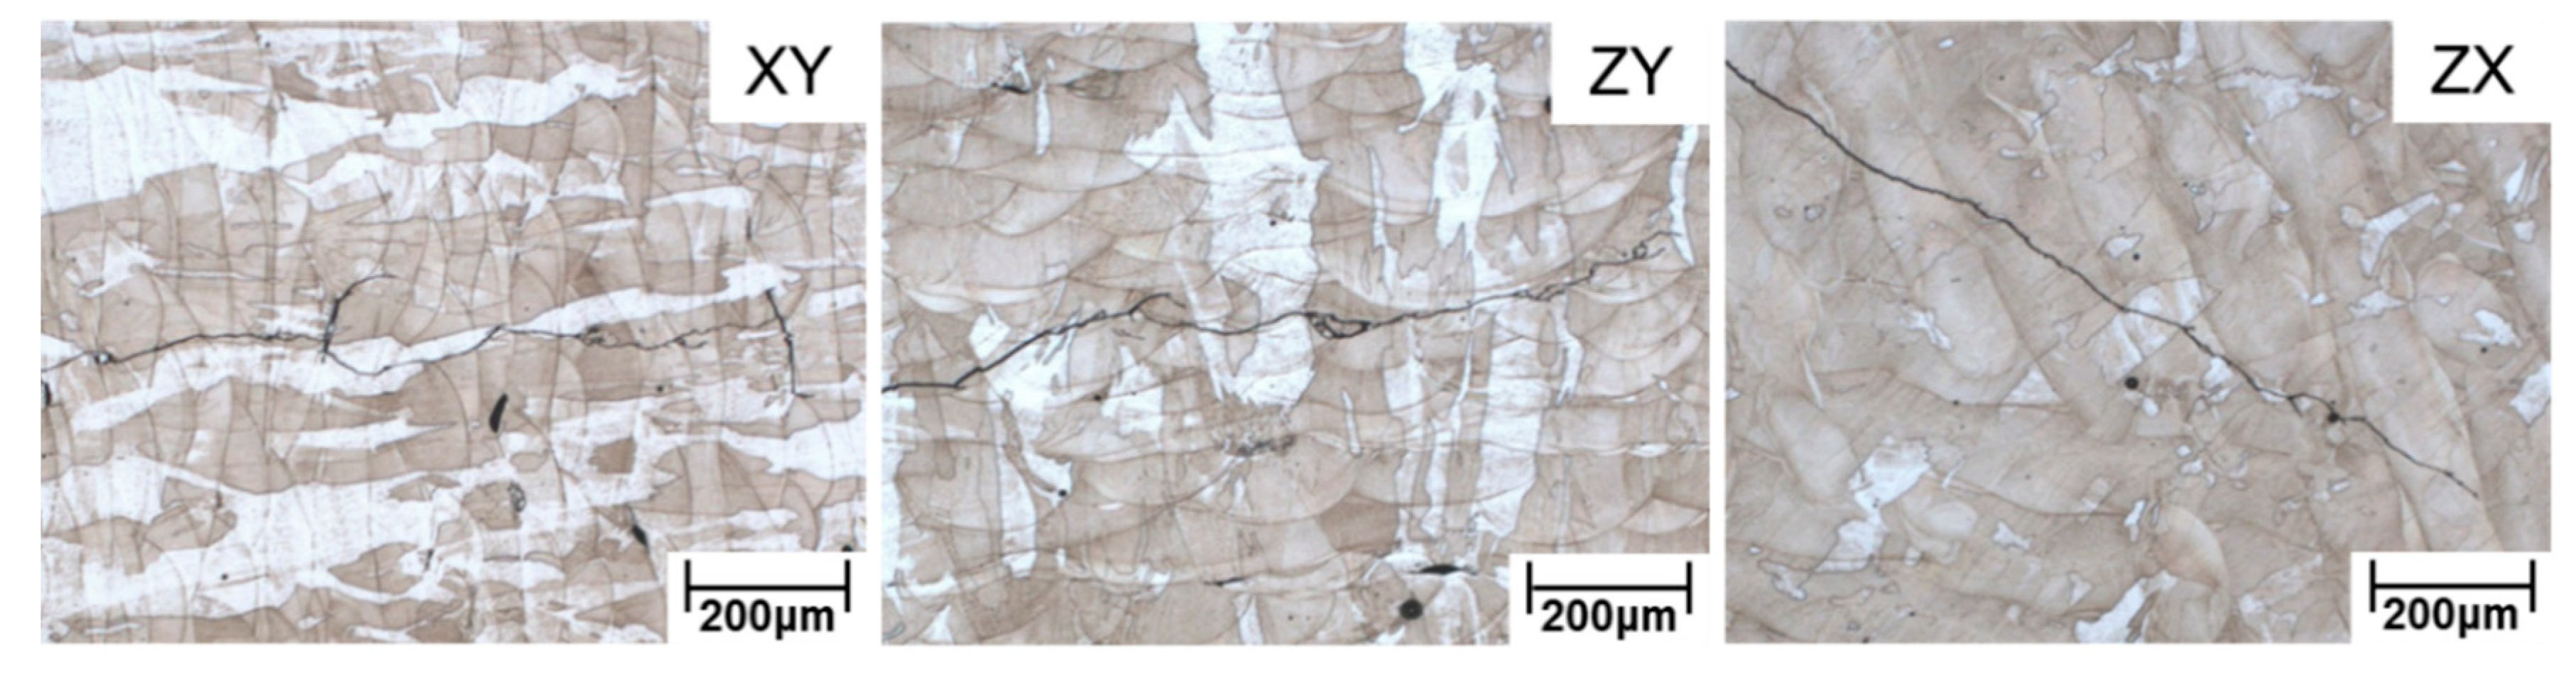
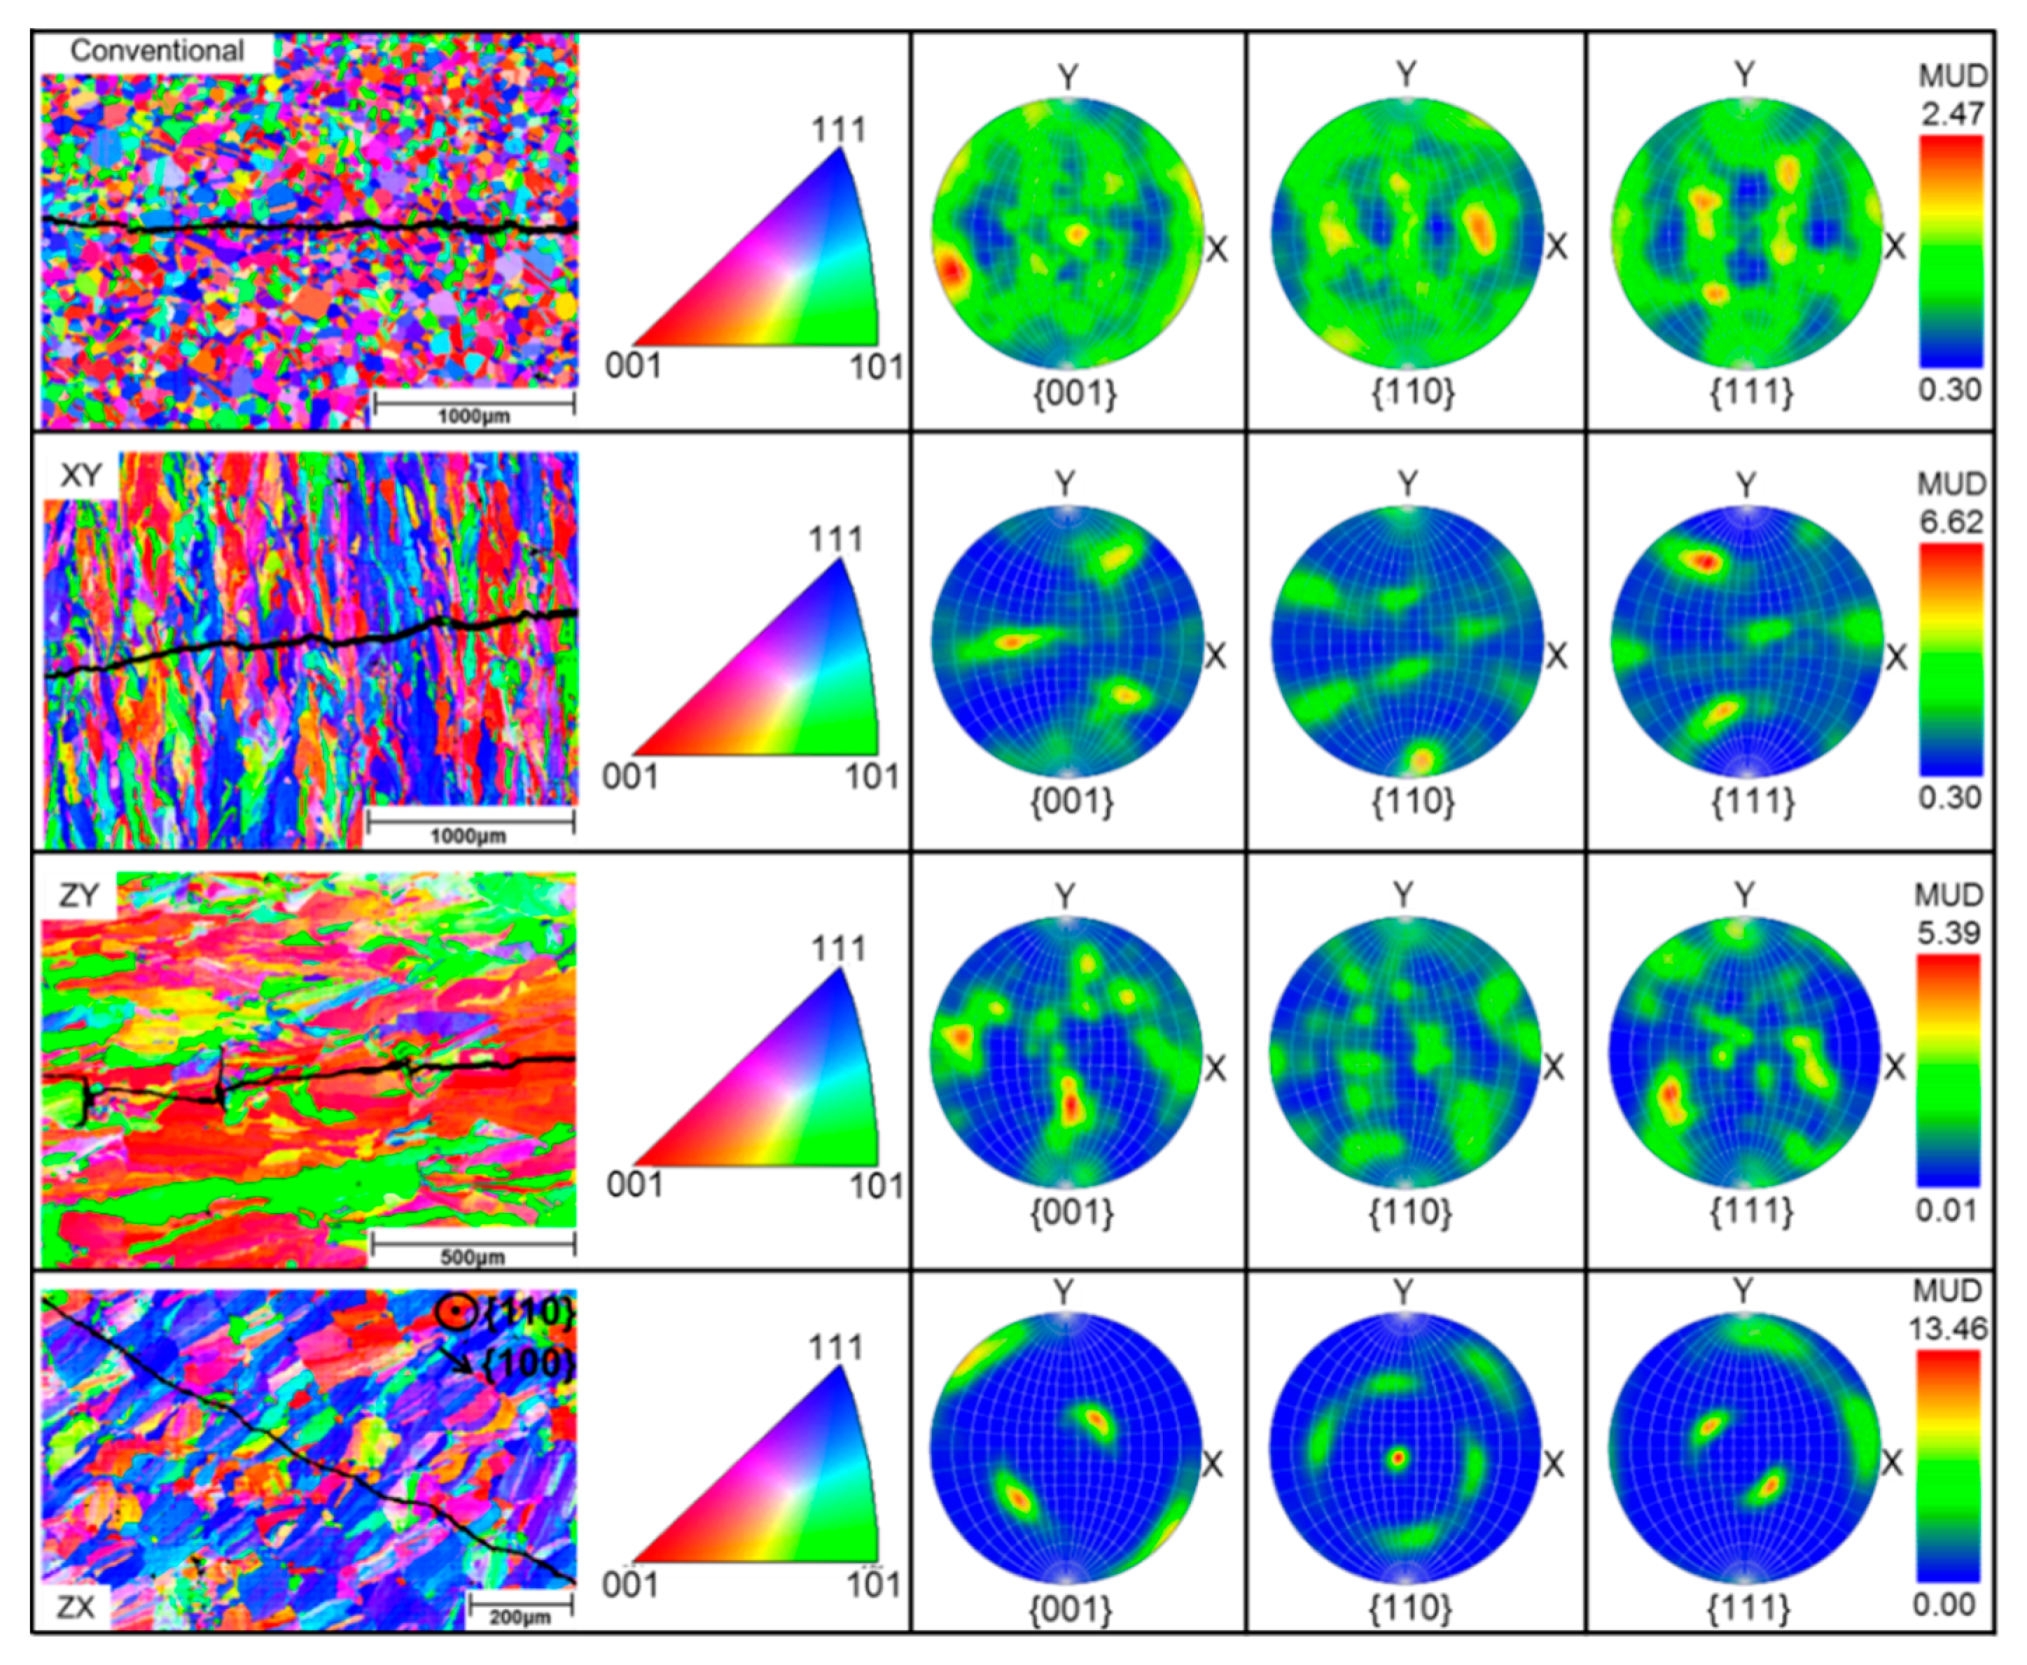
3.2. Crack Propagation in Conventionally and Additively Manufactured 316L
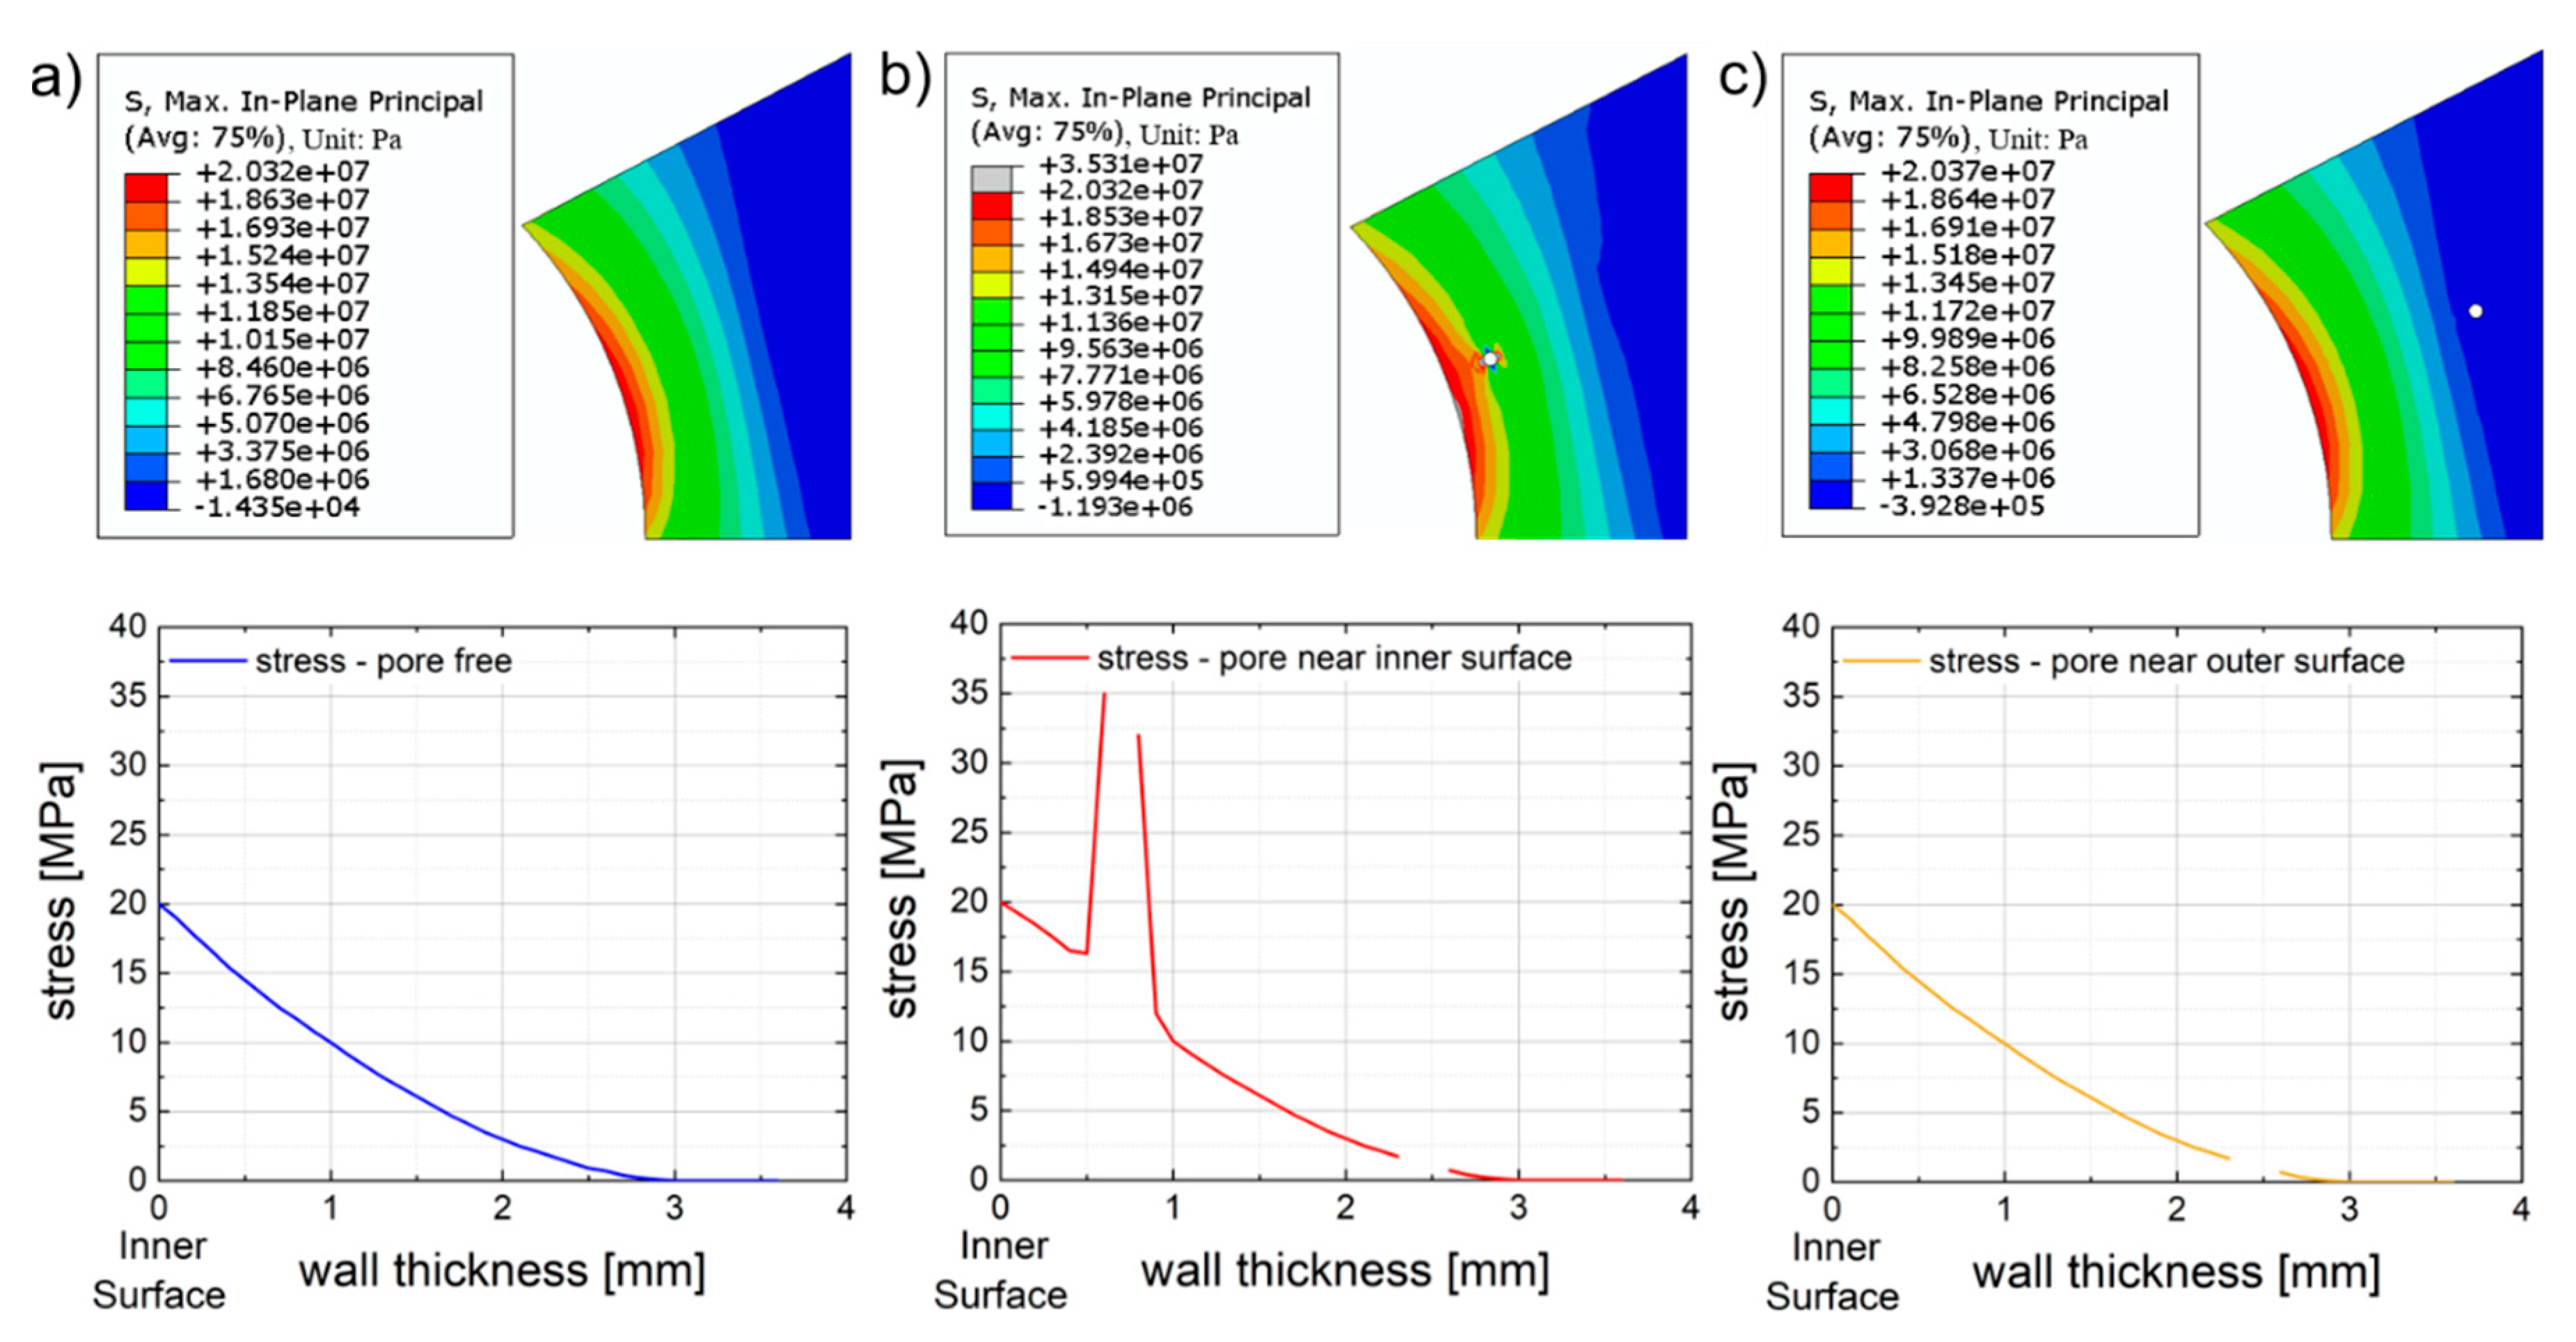
3.3. Manufacturing Defects and Their Impact on Fatigue Crack Propagation Behavior
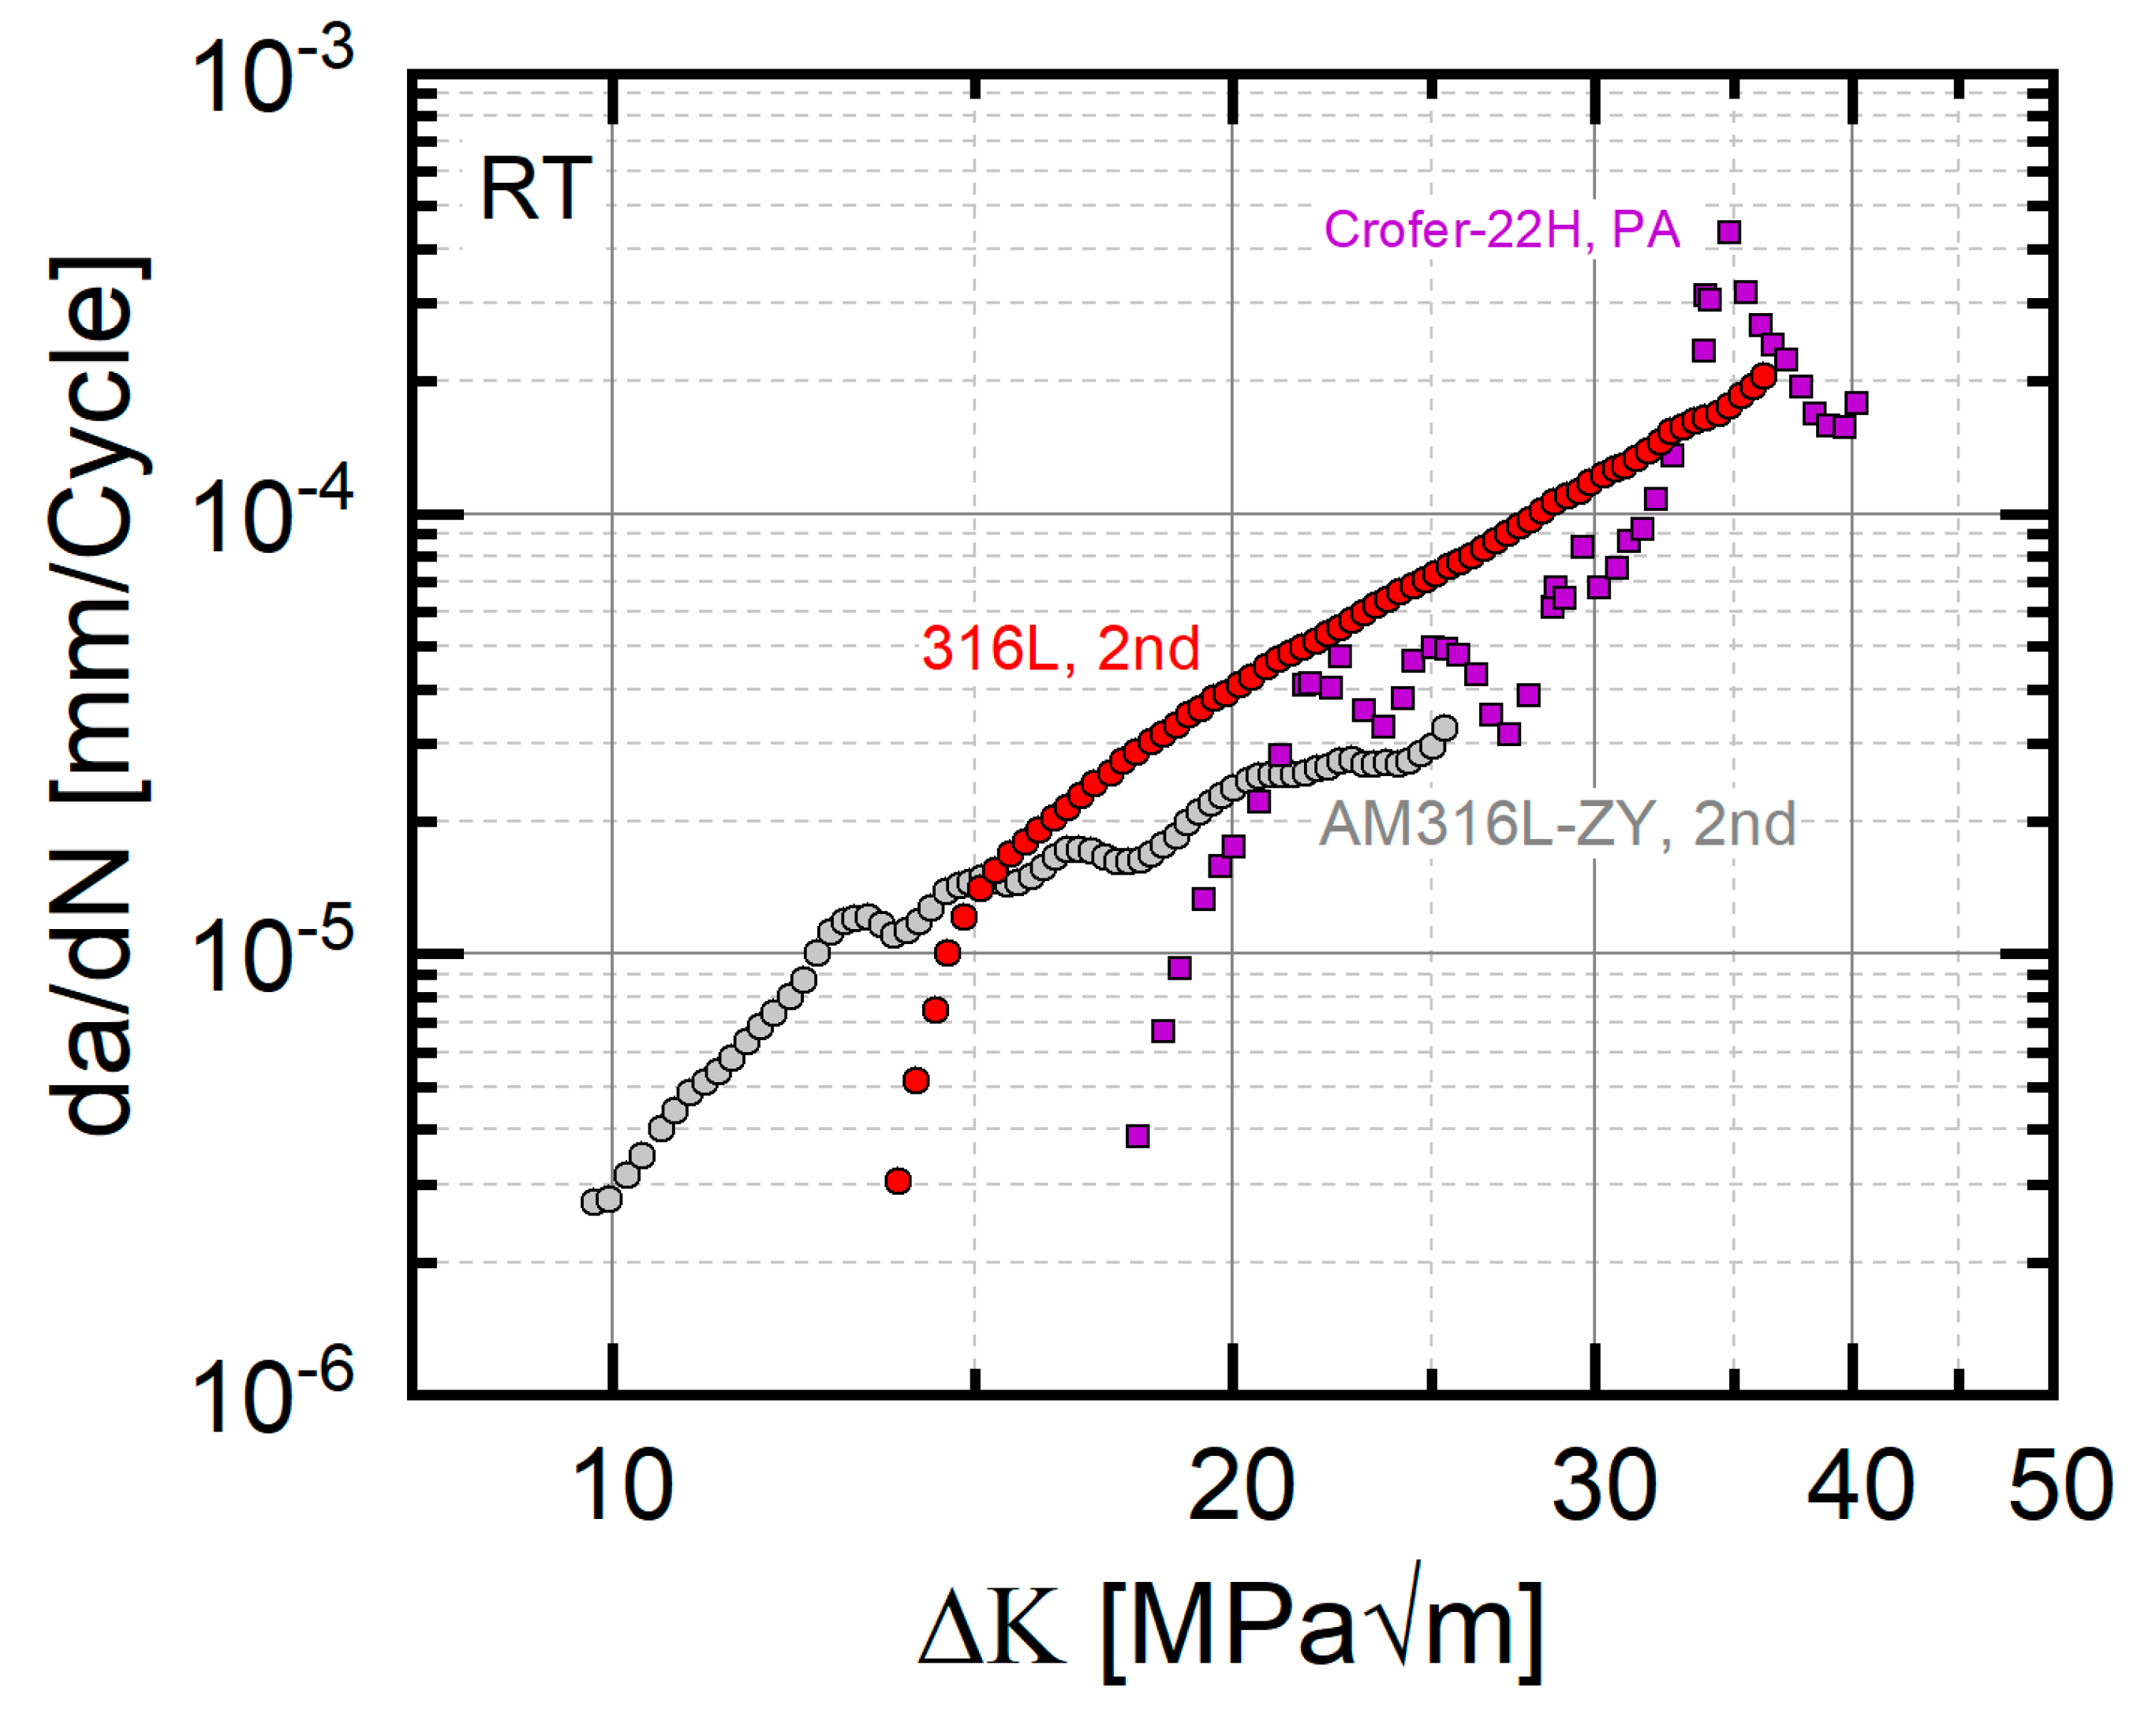
3.4. Novel Materials for Improved Structural Safety
4. Conclusions
4.1. Influence of Crack Propagation Rate on Component Lifetime
4.2. Summary and Outlook
Author Contributions
Funding
Acknowledgments
Conflicts of Interest
References
- Davies, C.M.; Thomlinson, H.; Hooper, P.A. Fatigue Crack Initiation and Growth Behaviour of 316L Stainless Steel Manufactured Through Selective Laser Melting. In Proceedings of the ASME 2017 Pressure Vessels and Piping Conference, Volume 6A: Materials and Fabrication, Waikoloa, HI, USA, 26 October 2017. [Google Scholar]
- Yadollahi, A.; Shamsaei, N.; Thompson, S.M.; Elwany, A.; Bian, L. Effects of building orientation and heat treatment on fatigue behavior of selective laser melted 17-4 PH stainless steel. Int. J. Fatigue 2017, 94, 218–235. [Google Scholar] [CrossRef]
- Zhang, M.; Sun, C.-N.; Zhang, X.; Wei, J.; Hardacre, D.; Li, H. High cycle fatigue and ratcheting interaction of laser powder bed fusion stainless steel 316L: Fracture behaviour and stress-based modelling. Int. J. Fatigue 2019, 121, 252–264. [Google Scholar]
- Blinn, B.; Klein, M.; Gläßner, C.; Smaga, M.; Aurich, J.C.; Beck, T. An investigation of the microstructure and fatigue behavior of additively manufactured AISI 316L stainless steel with regard to the influence of heat treatment. Metals 2018, 8, 220. [Google Scholar] [CrossRef]
- Spierings, A.B. Fatigue performance of additive manufactured metallic parts. Rapid Prototyp. J. 2013, 19, 88–94. [Google Scholar] [CrossRef]
- Meneghetti, G.; Rigon, D.; Gennari, C. An analysis of defects influence on axial fatigue strength of maraging steel specimens produced by additive manufacturing. Int. J. Fatigue 2019, 118, 54–64. [Google Scholar] [CrossRef]
- U.S. Federal Aviation Regulations. Advisory circular 25.571–Damage Tolerance and Fatigue Evaluation of Structure. 13 January 2011. [Google Scholar]
- Gosselin, S.R.; Simonen, F.A.; Heasler, P.G.; Doctor, S.R. Fatigue Crack Flaw Tolerance in Nuclear Power Plant Piping - A Basis for Improvements to ASME Code Section XI Appendix L (NUREG/CR-6934); U.S. Nuclear Regulatory Commission, Office of Nuclear Regulatory Research: Washington, DC, USA, 2007.
- ASME. Boiler and Pressure Vessel Code, Section VIII, Division 3, Alternative Rules for Construction of High Pressure Vessels, KD-4: Fracture Mechanics Evaluation. 2019; ISBN 9780791872895. [Google Scholar]
- Det Norske Veritas Recommended Practice DNV-RP-C203 Fatigue Design of Offshore Steel Structures. 2011.
- Riemer, A.; Leuders, S.; Thöne, M.; Richard, H.A.; Tröster, T.; Niendorf, T. On the fatigue crack growth behavior in 316L stainless steel manufactured by selective laser melting. Eng. Fract. Mech. 2014, 120, 15–25. [Google Scholar] [CrossRef]
- Riemer, A. Einfluss von Werkstoff, Prozessführung und Wärmebehandlung auf das bruchmechanische Verhalten von Laserstrahlschmelzbauteilen, Forschungsberichte des Direct Manufacturing Research Center; Shaker Verlag: Aachen/Duren, Germany, 2015; band 3; pp. 1–140. [Google Scholar]
- Kuhn, B.; Talik, M.; Lopez Barrilao, J.L.; Singheiser, L.; Yamamoto, Y. Development Status of High performance Ferritic (HiperFer) Steels. In Proceedings of the Eighth International Conference on Advances in Materials Technology for Fossil Power Plants, Sheraton Algarve, Portugal, 10–14 October 2016; pp. 1027–1035. [Google Scholar]
- Kuhn, B.; Talik, M.; Barrilao, J.L.; Chen, W.; Ning, J. Microstructure Evolution and Creep Strength of High performance Ferritic (HiperFer) Steels. In Proceedings of the 3rd International ECCC Creep & Fracture Conference, Rome, Italy, 5–7 May 2014; pp. 502–509. [Google Scholar]
- Kuhn, B.; Yamamoto, Y.; Talik, M.; Lopez Barrilao, J. High Performance Ferrite (HiperFer)—A New Alloy Family. In Proceedings of the 4th International ECCC Creep & Fracture Conference, Duesseldorf, Germany, 10–14 September 2017; pp. 1–10. [Google Scholar]
- Kuhn, B.; Talik, M.; Lopez Barrilao, J.; Singheiser, L. Microstructure stability of ferritic-martensitic, austenitic and fully ferritic steels under fluctuating loading conditions. In Proceedings of the 1st 123 HiMat Conference, Sapporo, Japan, 29 June–3 July 2015. [Google Scholar]
- Kuhn, B.; Lopez Barrilao, J.; Fischer, T. "Reactive" microstructure, the key to cost-effective, fatigue-resistant high temperature structural materials. In Proceedings of the Joint EPRI-123HiMAT International Conference on Advances in High Temperature Materials, Nagasaki, Japan, 21–24 October 2019; ISBN 13 987-1-62708-271-6. [Google Scholar]
- Kuhn, B.; Talik, M.; Fischer, T.; Fan, X.; Yamamoto, Y.; Lopez Barrilao, J. Science and Technology of High Performance Ferritic (HiperFer) Stainless Steels. Metals 2020, 10, 463. [Google Scholar] [CrossRef]
- Kuhn, B.; Talik, M.; Zurek, J.; Beck, T.; Quadakkers, W.J.; Singheiser, L.; Hattendorf, H. Development of High Chromium Ferritic Steels Strengthened by Intermetallic Phases. Proceedings of the 7th International Conference on Advances in Materials Technology for Fossil Power Plants, Waikoloa, HI, USA, 22–25 October 2013; ASM International, Materials Park Ohio Industrial Inc.: Cleveland, OH, USA 2013; pp. 1081–1092. [Google Scholar]
- Schulz, A.; Beckert, M.; Bietke, D.; Trieglaff, R. Additive Manufacturing–First Approaches to Pore Evaluation. In Proceedings of the 44th MPA-Seminar, Stuttgart, Germany, 17–18 October 2018. [Google Scholar]
- ASTM E647-1. Standard Test Method for Measurement of Fatigue Crack Growth Rates; ASTM International: West Conshohocken, PA, USA, 2011; Available online: www.astm.org (accessed on 10 August 2020).
- Data Sheet VDM Crofer 22 H. Available online: https://www.vdm-metals.com/fileadmin/user_upload/Downloads/Data_Sheets/Data_Sheet_VDM_Crofer_22_H.pdf (accessed on 10 June 2020).
- Froitzheim, J.; Meier, G.H.; Niewolak, L.; Ennis, P.J.; Hattendorf, H.; Singheiser, L. Development of high strength ferritic steel for interconnect application in SOFCs. J. Power Sources 2008, 178, 163–173. [Google Scholar]
- Hsiao, B.; Kuhn, Z.W.; Chen, D.; Singheiser, L.; Kuo, J.C.; Lin, D.Y. Characterization of Laves phase in Crofer22 H stainless steel. Micron 2015, 74, 59–64. [Google Scholar] [CrossRef] [PubMed]
- Talik, M.; Kuhn, B. High Temperature Mechanical Properties of a 17wt%Cr High Performance Ferritic (HiperFer) Steel Strengthened by Intermetallic Laves Phase Particles In Proceedings of the 9th International Charles Parsons Turbine and Generator Conference, Loughborough, UK, 15–17 September 2015.
- National Board Inspection Code (NBIC). Part-3 National Board Inspection Code; ASME Press: New York, NY, USA, 2011. [Google Scholar]
- ASME BPV Code. Section III, Division 1: Rules for Construction of Nuclear Facility Components; ASME Press: New York, NY, USA, 2019. [Google Scholar]
- Welding Technology Institute of Australis. (WTIA) publication, TGN-PE-02, Temper Bead Welding, Rev0,1; Welding Technology Institute of Australia: Pymble, Australia, 1 March 2006. [Google Scholar]
- ASME BPVC. Section IX-Welding, Brazing, and Fusing Qualifications; ASME Press: New York, NY, USA, 2015. [Google Scholar]
- Kuhn, B.; Talik, M.; Niewolak, L.; Zurek, J.; Hattendorf, H.; Ennis, P.J.; Quadakkers, W.J.; Beck, T.; Singheiser, L. Development of high chromium ferritic steels strengthened by intermetallic phases. Mater. Sci. Eng. A 2014, 594, 372–380. [Google Scholar]
- Lopez Barrilao, J.; Kuhn, B.; Wessel, E. Microstructure and Intermetallic Particle Evolution in Fully Ferritic Steels. In Proceedings of the 8th International Conference on Advances in Materials Technology for Fossil Power Plants, Algarve, Portugal, 10–14 October 2016; 2016; pp. 1027–1035, ISBN 13: 978-1-62708-131-3. [Google Scholar]
- Hsiao, Z.W.; Kuhn, B.; Yang, S.M.; Yang, L.C.; Huang, S.Y.; Singheiser, L.; Kuo, J.C.; Lin, D.Y. The Influence of Deformation on the Precipitation Behavior of a Ferritic Stainless Steel. In Proceedings of the 10th Liége Conference on Materials for Advanced Power Engineering, Schriften des Forschungszentrums Jülich/Energy & Environment, Liege, Belgium, 14–17 September 2014; Lecomte-Beckers, J., Dedry, O., Oackey, J., Kuhn, B., Eds.; Forschungszentrum Jülich GmbH Zentralbibliothek: Julich, Germany, 2014; Volume 94, pp. 349–358. [Google Scholar]
- Lopez Barrilao, J.; Kuhn, B.; Wessel, E. Identification, size classification and evolution of Laves phase precipitates in high chromium, fully ferritic steels. Micron 2017, 101, 221–231. [Google Scholar] [CrossRef] [PubMed]
- Lopez Barrilao, J.; Kuhn, B.; Wessel, E.; Talík, M. Microstructure of intermetallic particle strengthened high-chromium fully ferritic steels Mater. Sci. Technol. 2017, 33, 1056–1064. [Google Scholar]
- Lopez Barrilao, J.; Kuhn, B.; Wessel, E. Microstructure evolution and dislocation behaviour in high chromium, fully ferritic steels strengthened by intermetallic Laves phases. Micron 2018, 108, 11–18. [Google Scholar] [CrossRef] [PubMed]
- AD 2000 Regelwerk Taschenbuchausgabe 2020; 12. Auflage 2020, Merkblätter Reihe B; Herausgeber: Verband der TÜV e. V. (VdTÜV), Beuth Verlag: Berlin, Germany, 2020; ISBN 13: 9783410299110.
- Varfolomeyev, I.; Gienko, A.; Krasowsky, A.; Schmitt, W. Development of Weight Functions for Cracks in 3D Bodies; Report T 1/2000 for Fraunhofer IWM: Freiburg, Germany, 2000. [Google Scholar]
- IWM VERB. Ver. 8.1 IWM; Fraunhofer-Institut für Werkstoffmechanik: Freiburg, Germany, 2013. [Google Scholar]
- Paris, P.C.; Gomez, M.P.; Anderson, W.E. A rational analytic theory of fatigue; In the Trend in Engineering; University of Washington: Seattle, DC, USA, 1961; Volume 13, p. 1. [Google Scholar]
- ASME Boiler and Pressure Vessel Code. Section XI Rules for Inservice Inspection of Nuclear Power Plant. Components; ASME Press: New York, NY, USA, 2015. [Google Scholar]


| Fe | C | Si | Mn | P | S | Cr | Ni | Mo | N | Cu | |
|---|---|---|---|---|---|---|---|---|---|---|---|
| 316L sheet metal | Balance | 0.015 | 0.470 | 1.26 | 0.027 | 0.001 | 16.8 | 10.10 | 2.14 | 0.04 | 0.064 |
| 316L powder | Balance | 0.02 | 0.67 | 1.16 | 0.022 | 0.006 | 17.13 | 10.92 | 2.33 | 0.1 | - |
| Parameter: | Value: |
|---|---|
| Layer thickness | 50 μm |
| Laser power | 275 W |
| Exposure strategy | Stripes |
| Scan velocity | 760 mm/s |
| Hatch distance | 0.12 mm |
| Volume energy density | 60.3 J/mm3 |
| Build rate | 13.5 cm3/h |
| Crofer22 H | C | S | N | Cr | Ni | Mn | Si | Mo | Ti |
| 0.009 | 0.002 | 0.02 | 22.8 | 0.27 | 0.45 | 0.31 | 0.01 | 0.06 | |
| Nb | W | Cu | Fe | P | Al | Mg | Co | La | |
| 0.52 | 2.11 | 0.02 | Balance | 0.017 | 0.015 | <0.01 | 0.01 | 0.05 | |
| HiperFer 17Cr2 * | C | S | N | Cr | Ni | Mn | Si | Mo | Ti |
| <0.003 | <0.001 | <0.003 | 17–18 | - | 0.2–0.5 | 0.2–0.3 | - | - | |
| Nb | W | Cu | Fe | P | Al | Mg | Co | La | |
| 0.5–0.6 | 2.4–2.6 | - | Balance | - | - | - | - | - | |
| HiperFerAM | C | S | N | Cr | Ni | Mn | Si | Mo | Ti |
| <0.003 | <0.001 | <0.003 | 22 | - | 0.2–0.5 | 1 | - | - | |
| Nb | W | Cu | Fe | P | Al | Mg | Co | La | |
| 1.5 | 2 | - | Balance | - | - | - | - | - |
| Process Parameter | Value (3 mm Beam Diameter) | Value (0.66 mm Beam Diameter) |
|---|---|---|
| Laser power | 1375 W | 360 W |
| Feed speed | 400 mm/min | 1500 mm/min |
| Powder mass flow rate | 11.3 g/min | 2.4 g/min |
| Track offset | 2.3 mm | 0.35 mm |
| Height offset | 1.4 mm | 0.3 mm |
| Beam diameter | 3 mm | 0.66 mm |
| Deposition strategy | Unidirectional | Unidirectional |
| Nozzle type | Three-jet nozzle | Three-jet nozzle |
| Shielding gas | Argon | Argon |
| Material | Temperatures | Number of FCGAir Tests (R = 0.1, f = 20 Hz) |
|---|---|---|
| AM316L-XY | RT | 2 |
| AM316L-ZY | RT | 2 |
| AM316L-ZX | RT | 2 |
| 316L (conventional) | RT/650 °C | 2/1 |
| Crofer22 H, PA | RT | 1 |
| HiperFer 17Cr2, PA | 650°C | 1 |
| Material | σh | Nh | Nd | Nf | Damage Range |
|---|---|---|---|---|---|
| Crofer22 H | ≈205 MPa (38%) | 30 | 2400 | 2930 | 18.1% |
| HiperFer 17Cr2 | ≈236 MPa (42%) | 70 | 974 | 1389 | 29.9% |
| 316L | ≈47 MPa (5.4%) | 40 | 1143 | 1326 | 13.8% |
© 2020 by the authors. Licensee MDPI, Basel, Switzerland. This article is an open access article distributed under the terms and conditions of the Creative Commons Attribution (CC BY) license (http://creativecommons.org/licenses/by/4.0/).
Share and Cite
Fischer, T.; Kuhn, B.; Rieck, D.; Schulz, A.; Trieglaff, R.; Wilms, M.B. Fatigue Cracking of Additively Manufactured Materials—Process and Material Perspectives. Appl. Sci. 2020, 10, 5556. https://doi.org/10.3390/app10165556
Fischer T, Kuhn B, Rieck D, Schulz A, Trieglaff R, Wilms MB. Fatigue Cracking of Additively Manufactured Materials—Process and Material Perspectives. Applied Sciences. 2020; 10(16):5556. https://doi.org/10.3390/app10165556
Chicago/Turabian StyleFischer, Torsten, Bernd Kuhn, Detlef Rieck, Axel Schulz, Ralf Trieglaff, and Markus Benjamin Wilms. 2020. "Fatigue Cracking of Additively Manufactured Materials—Process and Material Perspectives" Applied Sciences 10, no. 16: 5556. https://doi.org/10.3390/app10165556
APA StyleFischer, T., Kuhn, B., Rieck, D., Schulz, A., Trieglaff, R., & Wilms, M. B. (2020). Fatigue Cracking of Additively Manufactured Materials—Process and Material Perspectives. Applied Sciences, 10(16), 5556. https://doi.org/10.3390/app10165556