Article

An Innovative Approach on Directed Energy Deposition Optimization: A Study of the Process Environment’s Influence on the Quality of Ti-6Al-4V Samples

1
Department of Applied Science and Technology, Politecnico di Torino, C.so Duca degli Abruzzi 24, 10129 Torino, Italy
2
Institute of Systems and Technologies for Sustainable Production, SUPSI, Galleria 2, 6928 Manno, Switzerland
*
Author to whom correspondence should be addressed.
Appl. Sci. 2020, 10(12), 4212; https://doi.org/10.3390/app10124212
Submission received: 25 May 2020 / Revised: 15 June 2020 / Accepted: 17 June 2020 / Published: 19 June 2020
(This article belongs to the Special Issue Additive Manufacturing in Industry)

Abstract

:
Blown powder additive manufacturing technologies are not restricted to the use of a process chamber. This feature allows to build larger components with respect to conventional powder bed processes. This peculiarity is mostly promising for manufacturing large components or repairing/rebuilding parts of large systems. The main downside of using an open environment, even if a protective shielding gas system is adopted, is the lack of control of process atmosphere. This is particularly critical for titanium alloys which are very sensitive to oxygen/nitrogen pick-up; they have a detrimental effect on ductility, by causing embrittlement and possibly leading to the formation of cracks. It is then important to address how environmental factors, such as process atmosphere and platform temperature, impact not only on the processability but also on the final component properties, both from a compositional and mechanical point of view. The correlations between these environmental factors and microstructure, interstitials content, grain size, and hardness were investigated. Moreover, the Hall–Petch equation was then adopted to additive manufacturing microstructures, characterized by a columnar grain morphology, and used to further investigate the relationship intercurring between grains and hardness and how different microstructures might influence this correlation.

1. Introduction

Additive manufacturing (AM) is a group of near-net-shape technologies which generally deploy pre-alloyed powders as feedstock material to build 3D objects layer by layer, directly from a computer-designed 3D model. For metal alloys, the available processes that involve the use of powder as raw material can be divided into powder-bed fusion (PBF) processes, such as laser powder-bed fusion (LPBF) and electron beam melting (EBM), and directed energy deposition (DED) processes. In DED systems, the powder is delivered directly onto the building area through nozzles, usually mounted on a multi-axis deposition head, and then melted through a heating source, commonly a laser. The absence of a powder bed and the movement freedom granted by the motion system make DED technologies particularly well suited for component repairing, large component manufacturing and compositionally graded materials production [1,2,3,4,5,6]. Laser DED systems were successfully adopted for producing components by using different materials, such as stainless steels [7], Ni alloys [8] and Ti alloys [9]. Amongst titanium alloys for the DED technology, the most frequently used is Ti-6Al-4V [10,11,12], making it possible to produce parts with mechanical properties similar or even higher than the traditionally manufactured counterparts [13]. The Ti-6Al-4V alloy is a well-established material for aerospace applications, although it finds usage in other industrial sectors, such as automotive, biomedical, energy production and the chemical field [14,15,16].
Among all the AM technologies, DED is currently the least investigated for Ti-6Al-4V. Further details on this technology are available elsewhere [1]. Currently most works available in the literature focus on analysing the process parameters optimization in order to improve the deposited component quality [17,18,19]. For example, Mahamood et al. [19] investigated the influence of scanning speed and laser power on the microhardness of Ti-6Al-4V produced via DED. Notwithstanding this, a deep knowledge to correlate the final component properties and quality to the process parameters and environment is still lacking. For example, atmosphere control is a key aspect to investigate, especially concerning its influence on oxygen, nitrogen and hydrogen content in the alloy, particularly critical for Ti-6Al-4V. It is well-known in fact that oxygen and nitrogen are α-stabilizing interstitial elements in titanium alloys, while hydrogen is a β-stabilizer (β-eutectoid) [14]. Oxygen indeed fits well in the octahedral vacancy of α-Ti (h.c.p.) due to the fact that it shares a similar radius (≈0.60 Å). Interstitials concentrations require strict monitoring due to their direct impact on mechanical properties [14]. For instance, ductility is severely reduced even by very low amounts of O and N, which might also change the deformation mode of the material from twinning to slip [20]. Interstitials influence was proved to be more critical for α-Ti alloys than β-Ti alloys and it is even more impacting for AM components, especially if characterized by a martensitic α’ microstructure. Yan et al. [20] estimated a threshold value of 0.22% wt. for oxygen content in AM Ti-6Al-4V, after which the material shows complete brittleness [20]. Nitrogen shows a similar behaviour in Ti alloys and its influence on this class of materials is also comparable. In general, in DED processes, using a sealed processing chamber should ensure improved atmosphere and process control, however it limits the maximum component size, which must be smaller than the chamber itself, and makes repairing operations more complex and restricted. In fact, several studies are available in the literature in which the deposition process was conducted using a sealed environment [21,22,23]. Among these, Qiu et al. [21] verified oxygen pick-up during the process and assessed only a small increase, proving the effectiveness of a glovebox-like chamber to ensure a low number of contaminants in the alloy. It is also possible to find some works [9,24] in which a shielding gas was used as a mean for protecting the material from oxygen/nitrogen pick-up, although a quantification of these interstitial element concentrations was still missing. Moreover, a comparison between these two scenarios was also absent according to the author’s knowledge.
The substrate temperature is another environmental factor that influences the final properties of the component deposited. In fact, the substrate temperature has a direct impact on the residual stresses induced by the process in the sample, which are particularly consistent for materials characterized by high yield strength at elevated temperatures, such as Ti-6Al-4V [25]. A lack of control on this phenomenon might lead to undesired consequences, such as crack formation, due to shrinkage deformation [26]. Raising the baseplate temperature during the process is a possible measure to prevent this event [27]. In fact, platform preheating is a common and thoroughly investigated practice for DED technologies. Multiple works [28,29], correlating the baseplate temperature to the final component distortion, are available in the literature. For example, Kistler et al. [30] were able to successfully link several process parameters of single layer samples, including platform temperature, to some final component properties such as porosity and hardness.
Currently, an in-depth investigation on the influence of deposition environment on Ti-6Al-4V DED samples features, such as microstructure and grain size, is still missing. Moreover, a quantitative comparison and quantification of interstitial elements in samples produced in different protective environments is also lacking, as mentioned before. In fact, most works available in the literature investigate how varying building parameters, such as laser power, scanning speed and powder feed rate, affects the components, usually built in an environment unvaried. Therefore, in this work an alternative approach was used: the building parameters were kept constant, while platform preheating and the deposition environment (i.e., sealed chamber compared to the exclusive use of an Ar flow as a protective mean) were varied in order to determine the influence of these two environmental factors on the final sample quality.

2. Materials and Methods

In this work, Ti-6Al-4V ELI (extra-low interstitials) gas-atomized powder, provided by LPW Technology Ltd (Runcorn, United Kingdom), was used. The particle size distribution of the powder, obtained through image analysis of SEM images, shown in Figure 1a, was quite homogeneous and symmetrical and led to a D (10), D (50) and D (90), respectively, of 49.08 µm, 79.92 µm and 119.92 µm. In Figure 1b a representative Scanning Electron Microscope (SEM) image of the powder was provided to show the spherical morphology of the employed particles. The cross-section of the particles, reported in Figure 1c, highlights the high quality of the powder due to the almost complete lack of pores and defects.
The samples analysed were built in SUPSI (University of Applied Sciences and Arts of Southern Switzerland) laboratory (ARM lab-DTI). A Laserdyne®430 system was used. This consists of a DED customised three axis laser processing system that employs a Convergent Photonics CF1000 fibre laser, characterised by a maximum laser power (P) of 1000 W, a wavelength (λ) of 1070 nm and a laser spot diameter (D) of 1 mm. A multi-nozzle deposition head, provided by Optomec Inc. (Albuquerque, United States), was employed. Further details on the system are available elsewhere [31]. Argon (purity 4.6) was used as a carrier and shielding gas, using flow rates of 4 L/min and 15 L/min respectively. All the specimens were built deploying the same set of building parameters, described in Table 1.
Cubic samples (15 × 15 × 15 mm) and horizontal bars (10 × 10 × 100 mm) were built in three different conditions, according to the process environment used, with the aim of evaluating the influence of the process atmosphere and temperature on the final component quality. The horizontal bars were used to investigate the influence of the process on larger pieces, while the cubic specimens were used for metallographic investigation of smaller parts.
The specimens will be addressed as:
  • SE-CB (Sealed Environment, Cold Base), if built in a glovebox-like chamber using a non-heated platform;
  • SE-HB (Sealed Environment, Hot Base), if built in glovebox-like chamber using a heated platform (220 °C);
  • ArS (Argon Shielding), if built in an open environment, using a shielding gas (Ar) as only mean of protection from oxidation and contamination.
The use of a sealed process chamber allowed to ensure the oxygen level was kept below 0.2% throughout the whole process.
All the cubic samples produced were crack-free and had densities above 99.97% by image analysis. These specimens were cut, mounted, then polished and etched using a Kroll reagent (93% H2O, 5% HNO3, 2% HF), to be prepared to be metallographic samples. HNO3 and HF were provided by Sigma-Aldrich (St. Louis, United States) and were characterized by a purity of 65% and 40% respectively. The samples were mechanically polished using silicon carbide papers (#400–#2400) and colloidal silica (0.04 µm) both provided by Struers (Ballerup, Denmark). Phase identification and crystallographic parameters calculations were evaluated by X-ray Diffraction (XRD) using a X-Pert PRO diffractometer (PANalytical, Almelo, Netherlands) in a Bragg Brentano configuration, the measurements were conducted using a Cu Kα radiation, operating the instrument at 40 kV and 40 mA. The step size was 0.013° and a 2θ range between 30°and 90° was considered. Subsequently microstructure observations were performed using a DM ILM optical microscope (Leica, Wetzlar, Germany). High-magnification imaging was performed using a PhenomXL SEM (Thermo Fisher Scientific, Waltham, United States). To further study structure–property relations, martensite needles measurements were conducted by pre-treating the OM micrographs (500x magnification) as described by Zhang et al. [32] and then using the software ImageJ. To provide a more representative measurement for the whole sample from a statistical point of view, the several micrographs analysed were extracted from areas of the specimen selected in an unbiased fashion. Twenty micrographs per condition were studied, in order to cover a significant portion of the whole cross-section. This resulted in the measurement of more than 1000 needles per sample.
Hardness evaluation was performed by deploying a VMHT microhardness tester (Leica, Wetzlar, Germany), set to apply a force of 300 g for 15 s. A total of 25 measurements per sample were performed on the Z cross-section and placed in a 5 × 5 grid, whose points were evenly distributed throughout the whole sample. By doing so, each spot was approximately 0.75 mm far from the others on the Z axis, 2.5 mm on the XY plane.
To assess the influence of the different building environments on the final sample interstitials concentrations, a 736 series O/N analyser (LECO Corporation, St. Joseph, United States) was used. Three samples per condition were considered. These specimens were obtained by cutting small portions (mass less of 0.1 g) of the cubic samples taken in an area ranging from the bottom to the top of the cube itself. By doing so, possible influences linked to the platform effect or the last layers were taken into account.

3. Results and Discussion

Considering that multiple environmental factors (atmosphere and temperature) were investigated simultaneously, the outcomes of every analysis conducted were analysed from two points of view:
  • A comparison of the results of ArS and samples and the samples built in a sealed environment (SE-CB and SE-HB) to understand the influence of the process atmosphere;
  • A comparison between the results of SE-CB and SE-HB samples to examine the effect of baseplate heating.

3.1. Microstructure and Phase Identification

The optical micrographs of all the conditions investigated in this study (ArS, SE-CB, and SE-HB) are provided in Figure 2. All samples showed prior-β grains, characterized by a columnar morphology, ranging from few microns to the sample height in size. These grains developed during the deposition due to the highly directional cooling, typical of this process, which involves epitaxial growth phenomena [33,34]. Banding, a typical feature of Ti-6Al-4V processed by DED, as reported for example by Ho et al. [35], was also observed in all cases.
For all conditions, the corresponding microstructure was mainly α’ martensite, easily recognizable from its needle-like ±45° structure [36], as generally occurring in processes that involve very rapid cooling (>410 °C/s) [37]. In these cooling conditions in fact the diffusionless βα’ shear-type transformation is more kinetically favoured than the usual, diffusion-driven βα+β transformation, typical of duplex titanium alloys such as Ti-6Al-4V [38].
However, a closer inspection of the high magnification micrographs highlights that the microstructure of the ArS samples (Figure 2b) shows different features in addition to the typical martensitic microstructure of samples produced in a sealed environment (Figure 2d,f). The ArS samples present, near to the martensitic structure, lamellae arranged in a ±30°/60° fashion, or basket-weave, which are typical of the more stable α + β Widmanstätten microstructure, possibly resulting from α’ needles decomposition [39].
So, it is possible to summarize the resulting microstructures as:
  • ArS: α’ martensitic microstructure and bimodal α + β;
  • SE-CB: Completely α’ martensitic microstructure;
  • SE-HB: Completely α’ martensitic microstructure.
To further analyse phase composition and to confirm the hypothesis made on the basis of microstructures, the XRD patterns of materials processed in the three conditions are reported in Figure 3. All these patterns appear quite similar, exhibiting all the peaks related to the Hexagonal Close Packed (HCP) phase α/α’ [36,40]. A complete distinction between the thermodynamically stable α-phase from the metastable α’ martensite just by means of X-ray pattern analysis is very complex, due to the common HCP lattice [40,41]. In addition, in SE-CB and SE-HB conditions, a shift of the α/α’ peaks towards higher angles was also noted, probably due to different internal stresses and/or dislocation densities, caused by the different cooling path [36,42]. Overall, no significant differences between SE-CB and SE-HB were noted in terms of XRD patterns.
A body centred cubic (BCC) β-phase, instead, was clearly distinguishable exclusively in ArS, as can be noted from the (110) peak [43]. This was the only peak available to evaluate the β phase due to the overlapping of the other peaks [44]. Detecting a non-negligible amount of β-phase confirms the aforementioned hypothesis of a small amount of α + β phases detected in ArS samples from micrograph observation (Figure 2b).
The appearance of α + β phases only in ArS samples was probably correlated to the process environment and consequent oxygen/nitrogen pick-up.
A more in-depth analysis was conducted by calculating the cell parameters of the α-phase, to better evaluate the differences occurring among all the conditions considered. In particular, cell parameters a and c were derived from the equation resulted by combining Bragg law and the plane-spacing equation for hexagonal systems [45]:
s i n 2 θ = λ 2 4 [ 4 3 h 2 + h k + k 2 a 2 + l 2 c 2 ]
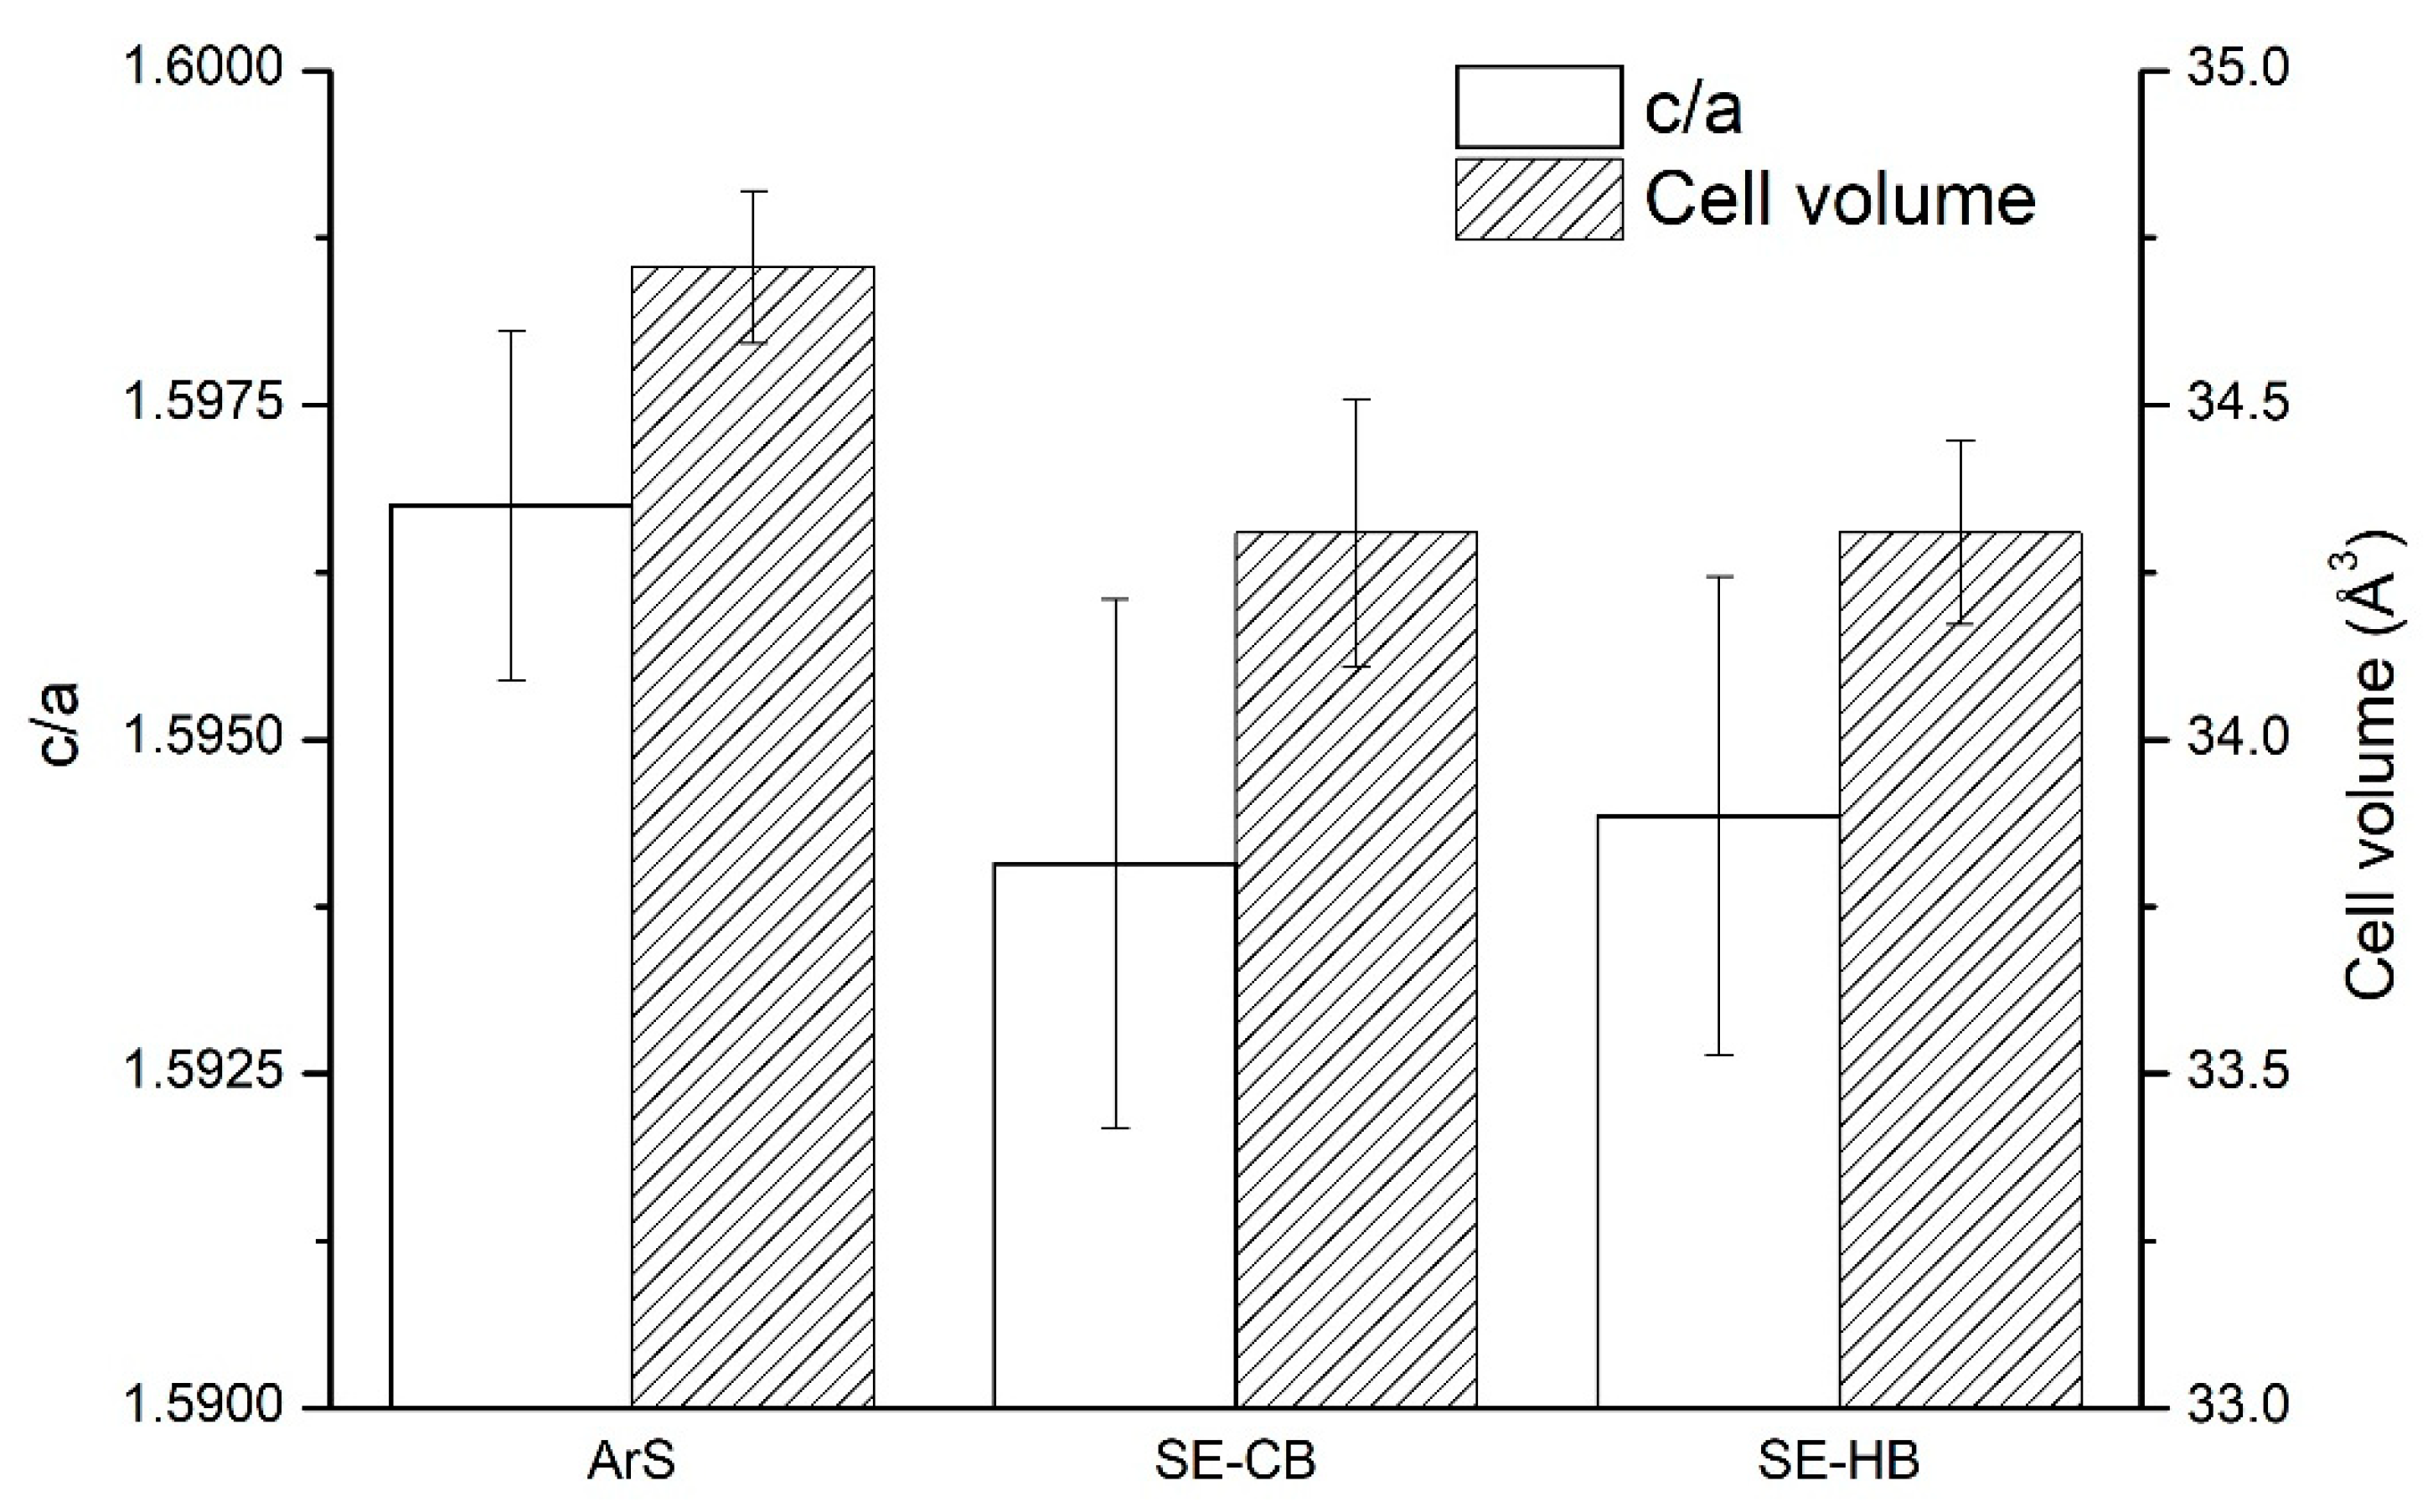
where a and c are the cell parameters, h, k and l are the Miller indices related to the referring peak and λ is the wavelength of the radiation used during the test and equals 1.5406 Å for Cu Kα radiation. To avoid texturing influence on the result, the “intensity averaging” method was used [45]. Once a and c were obtained, the ratio c/a and the cell volume of each sample were calculated. The results of this analysis are provided in Figure 4, in which the similarity between both the c/a ratio and cell volume of the SE-CB and SE-HB specimens is evident. In contrast, both these parameters are significantly greater for ArS samples. Previous studies [46,47] proved that the increase in cell parameters and volume might be related to a higher oxygen concentration in the sample, accordingly to the environment used for their building. It is in fact very likely that the exclusive use of shielding gas as only mean of protection during the deposition might not be enough to prevent an increase in the concentration of the interstitial elements (O, N, H). To confirm this, the evaluation of the interstitial content was carried out.

3.2. Interstitials Content

Interstitials (O, N, H) are particularly critical for Ti-6Al-4V. As mentioned before, these elements are highly soluble, even at relatively low temperature, and directly impact on the alloy mechanical properties, for example reducing ductility [14,46]. To estimate the influence of multiple elements at the same time, it is common to evaluate the oxygen equivalent concentration [ O ] EQ [48]:
[ O ] EQ = [ O ] + 2 [ N ] + 2 3 [ C ]
Another study [49] implemented Equation (2), taking in account a greater coefficient for [N] and assessed in addition the influence of Fe on [ O ] EQ as:
[ O ] EQ = [ O ] + 2.77 [ N ] + 0.1 [ Fe ]
In this study, only O and N were considered because the other elements concentrations included in Equations (2) and (3) resulted negligible. Moreover, the second equation was used since it takes in account a greater coefficient for [N], resulting in higher [ O ] EQ . This possible overestimation was considered acceptable due to precautionary purposes. An oxygen and nitrogen evaluation were performed on the samples in all the building conditions and on the powder used for deposition, in the virgin state. The [O], [N] and [O]EQ results are reported in Figure 5.
As expected, [O] and [N] were found to be lowest in the powder. The deposition led to an increase in the concentration of both elements in all the conditions. The ArS samples revealed a high interstitial concentration, providing a [O] of 0.132% and a [N] of 0.104%. These led to an [O]EQ value of 0.42%, markedly higher than the 0.22% threshold [20], resulting in a brittle sample. The results for SE-CB and SE-HB samples were close, especially for oxygen (respectively 0.0924% and 0.0956%). Nitrogen pick-up was more severe in SE-HB samples, which showed a [N] of 0.0205%, whilst in SE-CB samples a concentration of 0.0109% was reached. However, in both cases, the values of [O]EQ were lower than the 0.22% threshold (0.1226% for SE-CB and 0.1523% for SE-HB).
The high oxygen/nitrogen pick-up detected can also explain two main results:
  • the differences in microstructure between ArS samples (α’ martensitic microstructure and bimodal α + β) and the other conditions (completely α’ martensitic microstructure). In fact, Malinov et al. [50] proved that Ms (martensite start) is substantially unaffected by oxygen content increases, when relatively low concentrations are involved (≈ 0.2%). However, Tβ (beta transus temperature) markedly rises, even at very low oxygen content. This different behaviour might be a possible explanation for the formation of a relevant amount of β phase in ArS samples. In fact, both O and N act in titanium alloys as α phase stabilizers [14]. These elements cause basically an increase in the temperature range between Tβ and Ms, favouring the β→ α + β transformation;
  • the bigger cell that ArS provided as a result of the XRD analysis. In fact, as previously mentioned, O and N fit well in the octahedral vacancy of the h.c.p. lattice of Ti-α, distorting the cell and resulting in a larger volume.

3.3. Grain Size

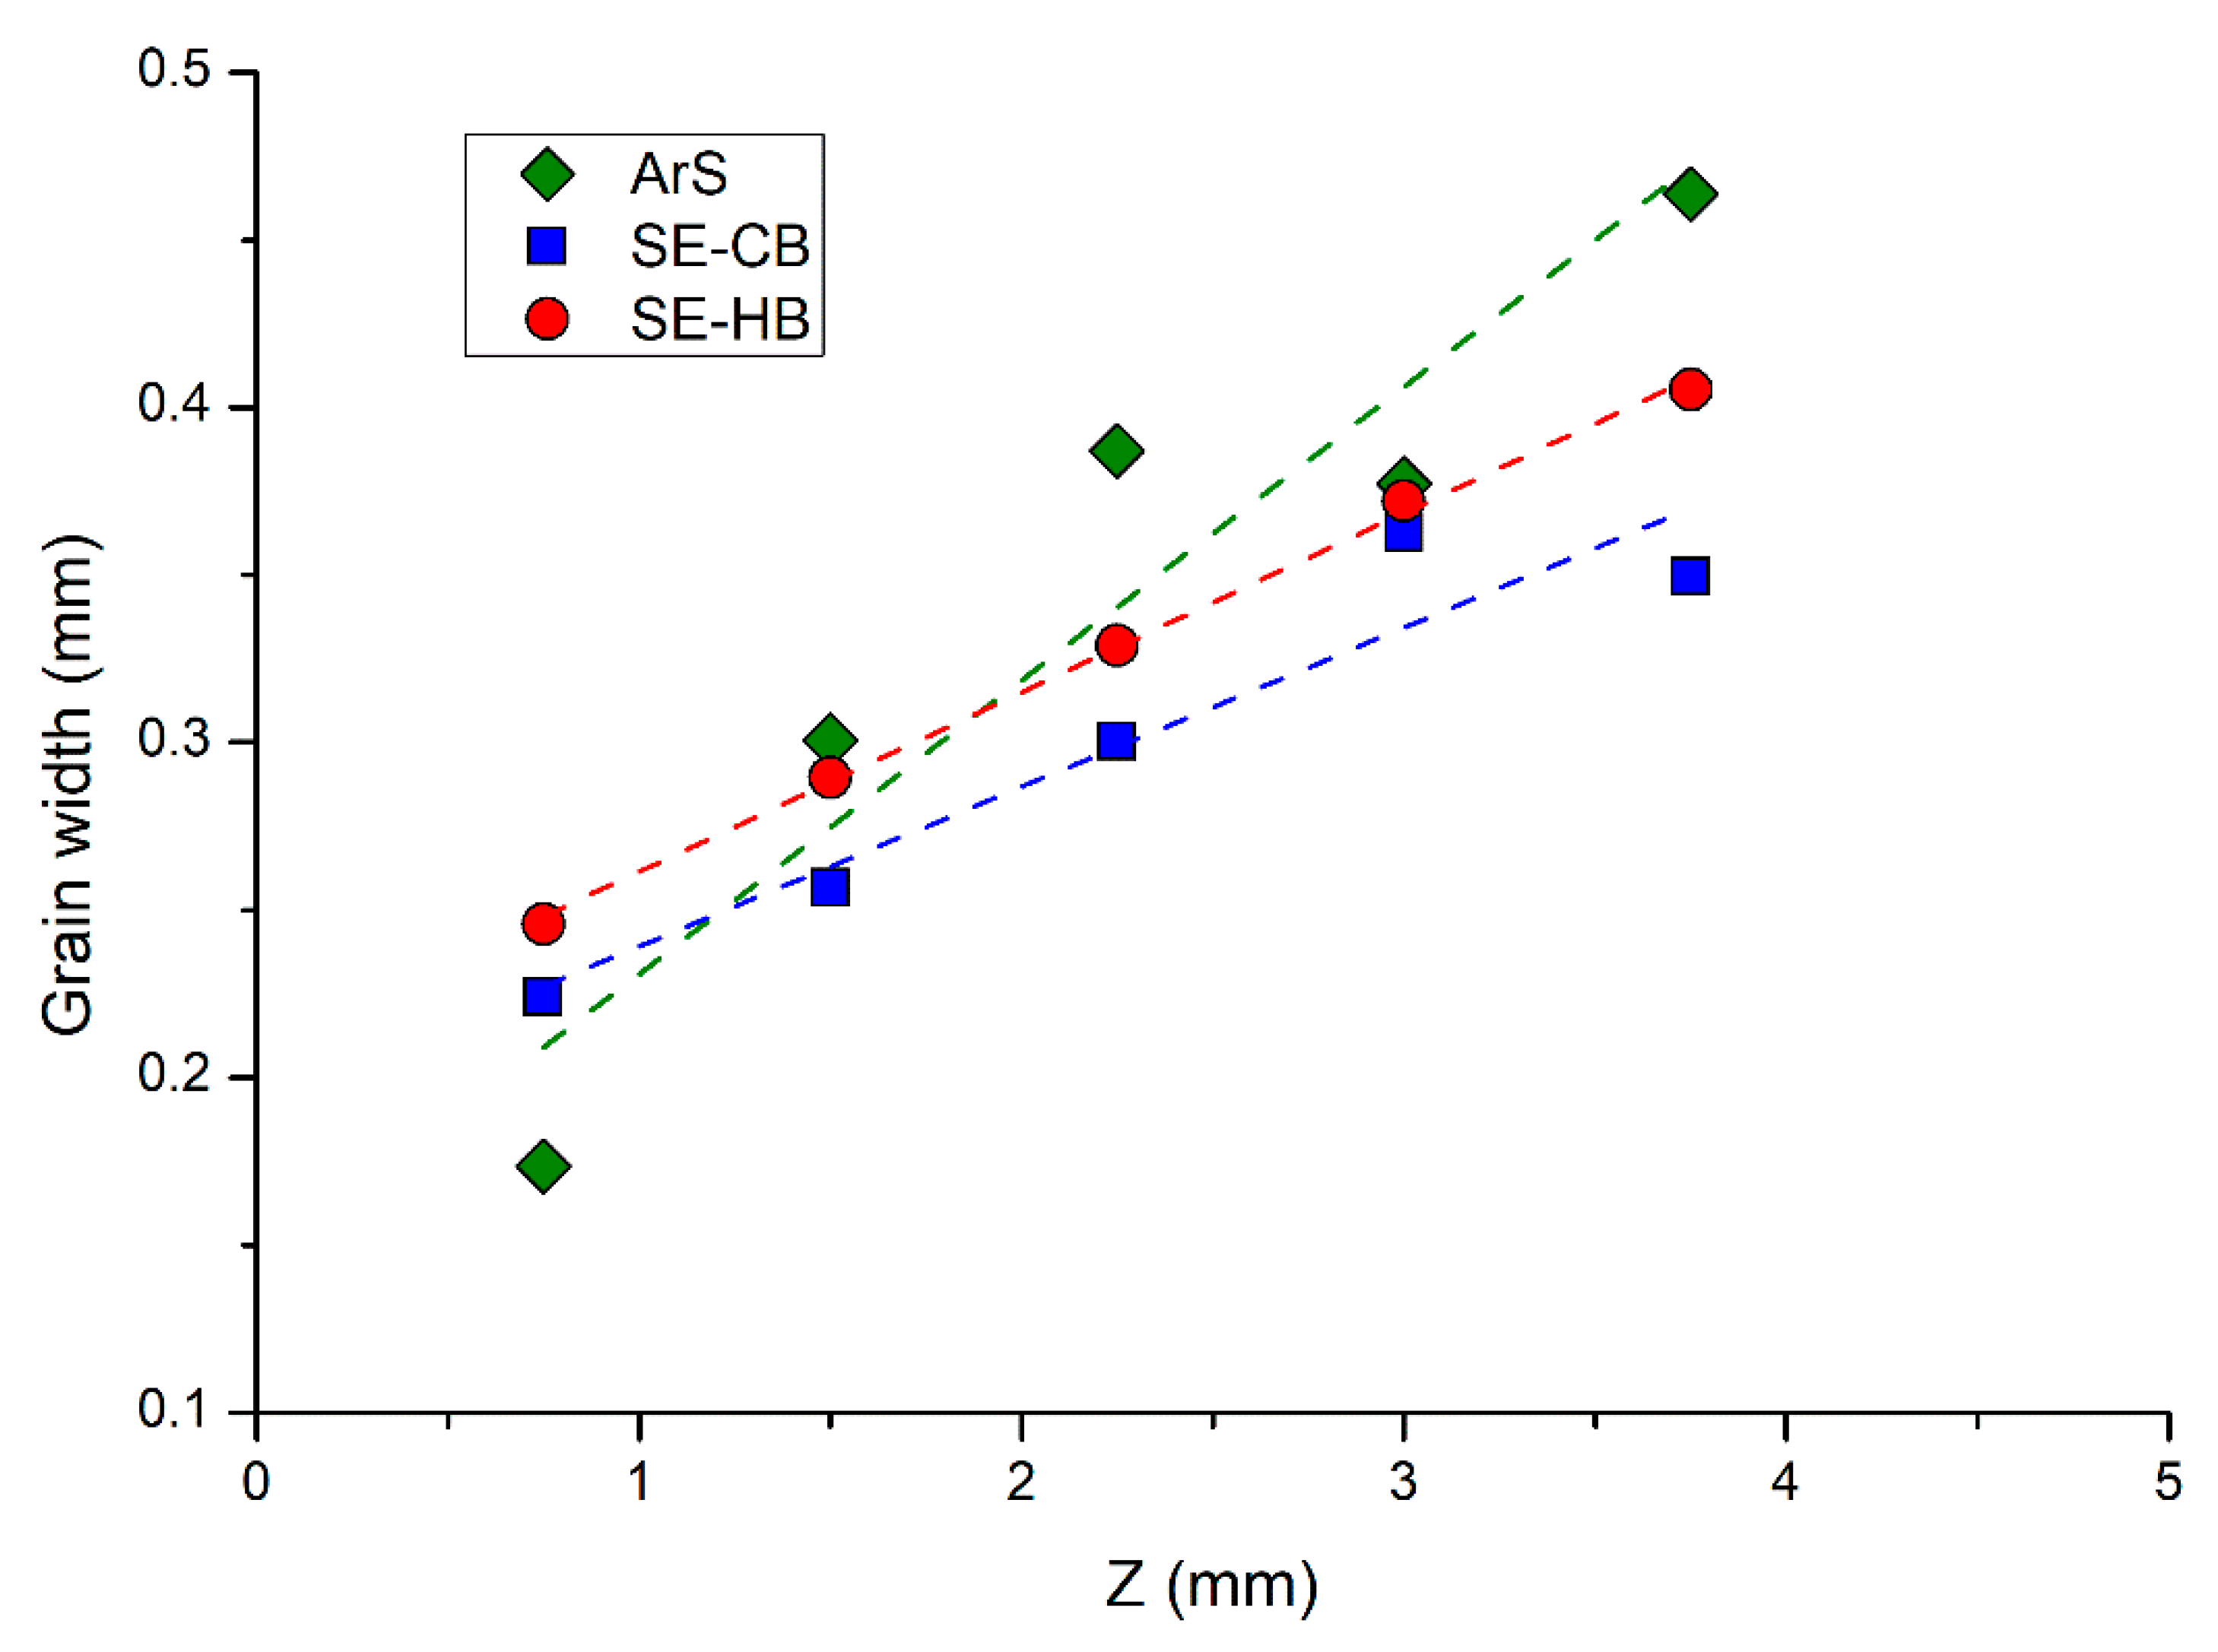
Since columnar grains are highly anisotropic and characterized by lengths that can reach up to the height of the sample itself [35], measuring grain size directly, as in conventionally produced materials, can lead to unreliable results. It is then common practice in AM materials to measure only the grain width, approximately perpendicular to the sample development section [39,51]. Finding a proper way for measuring grain size is necessary, because it greatly affects the final component mechanical properties and moreover it is directly influenced by the thermal history of the material. Previous studies [37,52] demonstrated that during deposition a layer is subjected to a complex thermal cycle, characterized by subsequent heating and cooling phases, caused by the laser action. Nevertheless, the thermal path of the reference layer is also a function of its distance from the base (Z). In fact, heat dissipation is much more effective when the layer is very close to the baseplate, which effectively acts as a heatsink [10,53]. It was already discussed how variations on the cooling path might relevantly affect the final properties of the component. Being prior-β grains size directly dependent on the cooling rate from the β region, when cooling from T > Tβ [54], the correlation between the cooling rate and the Z position can be investigated by measuring the evolution of grain size along the direction Z. Figure 6 reports the results of this analysis, in which grain width was evaluated using the intercept method along the whole sample at different distances from the baseplate. As visible from the graph, there is a clear increasing trend that correlates grain width and vertical position for all the samples, coherently with the considerations made on the cooling rate variations. ArS samples are characterized by a steeper slope with respect to SE-CB and SE-HB, which leads to more consistent grain width variations along Z. This difference might be caused by the variations in composition due to the different processing environment. In fact, interstitials elements lead to a different solidification behaviour, due to the changes in the alloy typical temperatures (e.g., Ms). Comparing SE-CB and SE-HB samples instead, the grain widths are consistent with the assumptions made. In fact, from a thermal point of view, the samples built in the SE-HB condition undergo a lower cooling rate than the SE-CB condition, due to the difference in temperature between the melt pool and the baseplate itself. In fact, as confirmed by Figure 6, SE-HB samples show larger grains than SE-CB samples at all the Z values considered. Furthermore, these two trends are parallel. This correlation between processing environment and grain width is consistent with the platform preheating.

3.4. Martensite Analysis

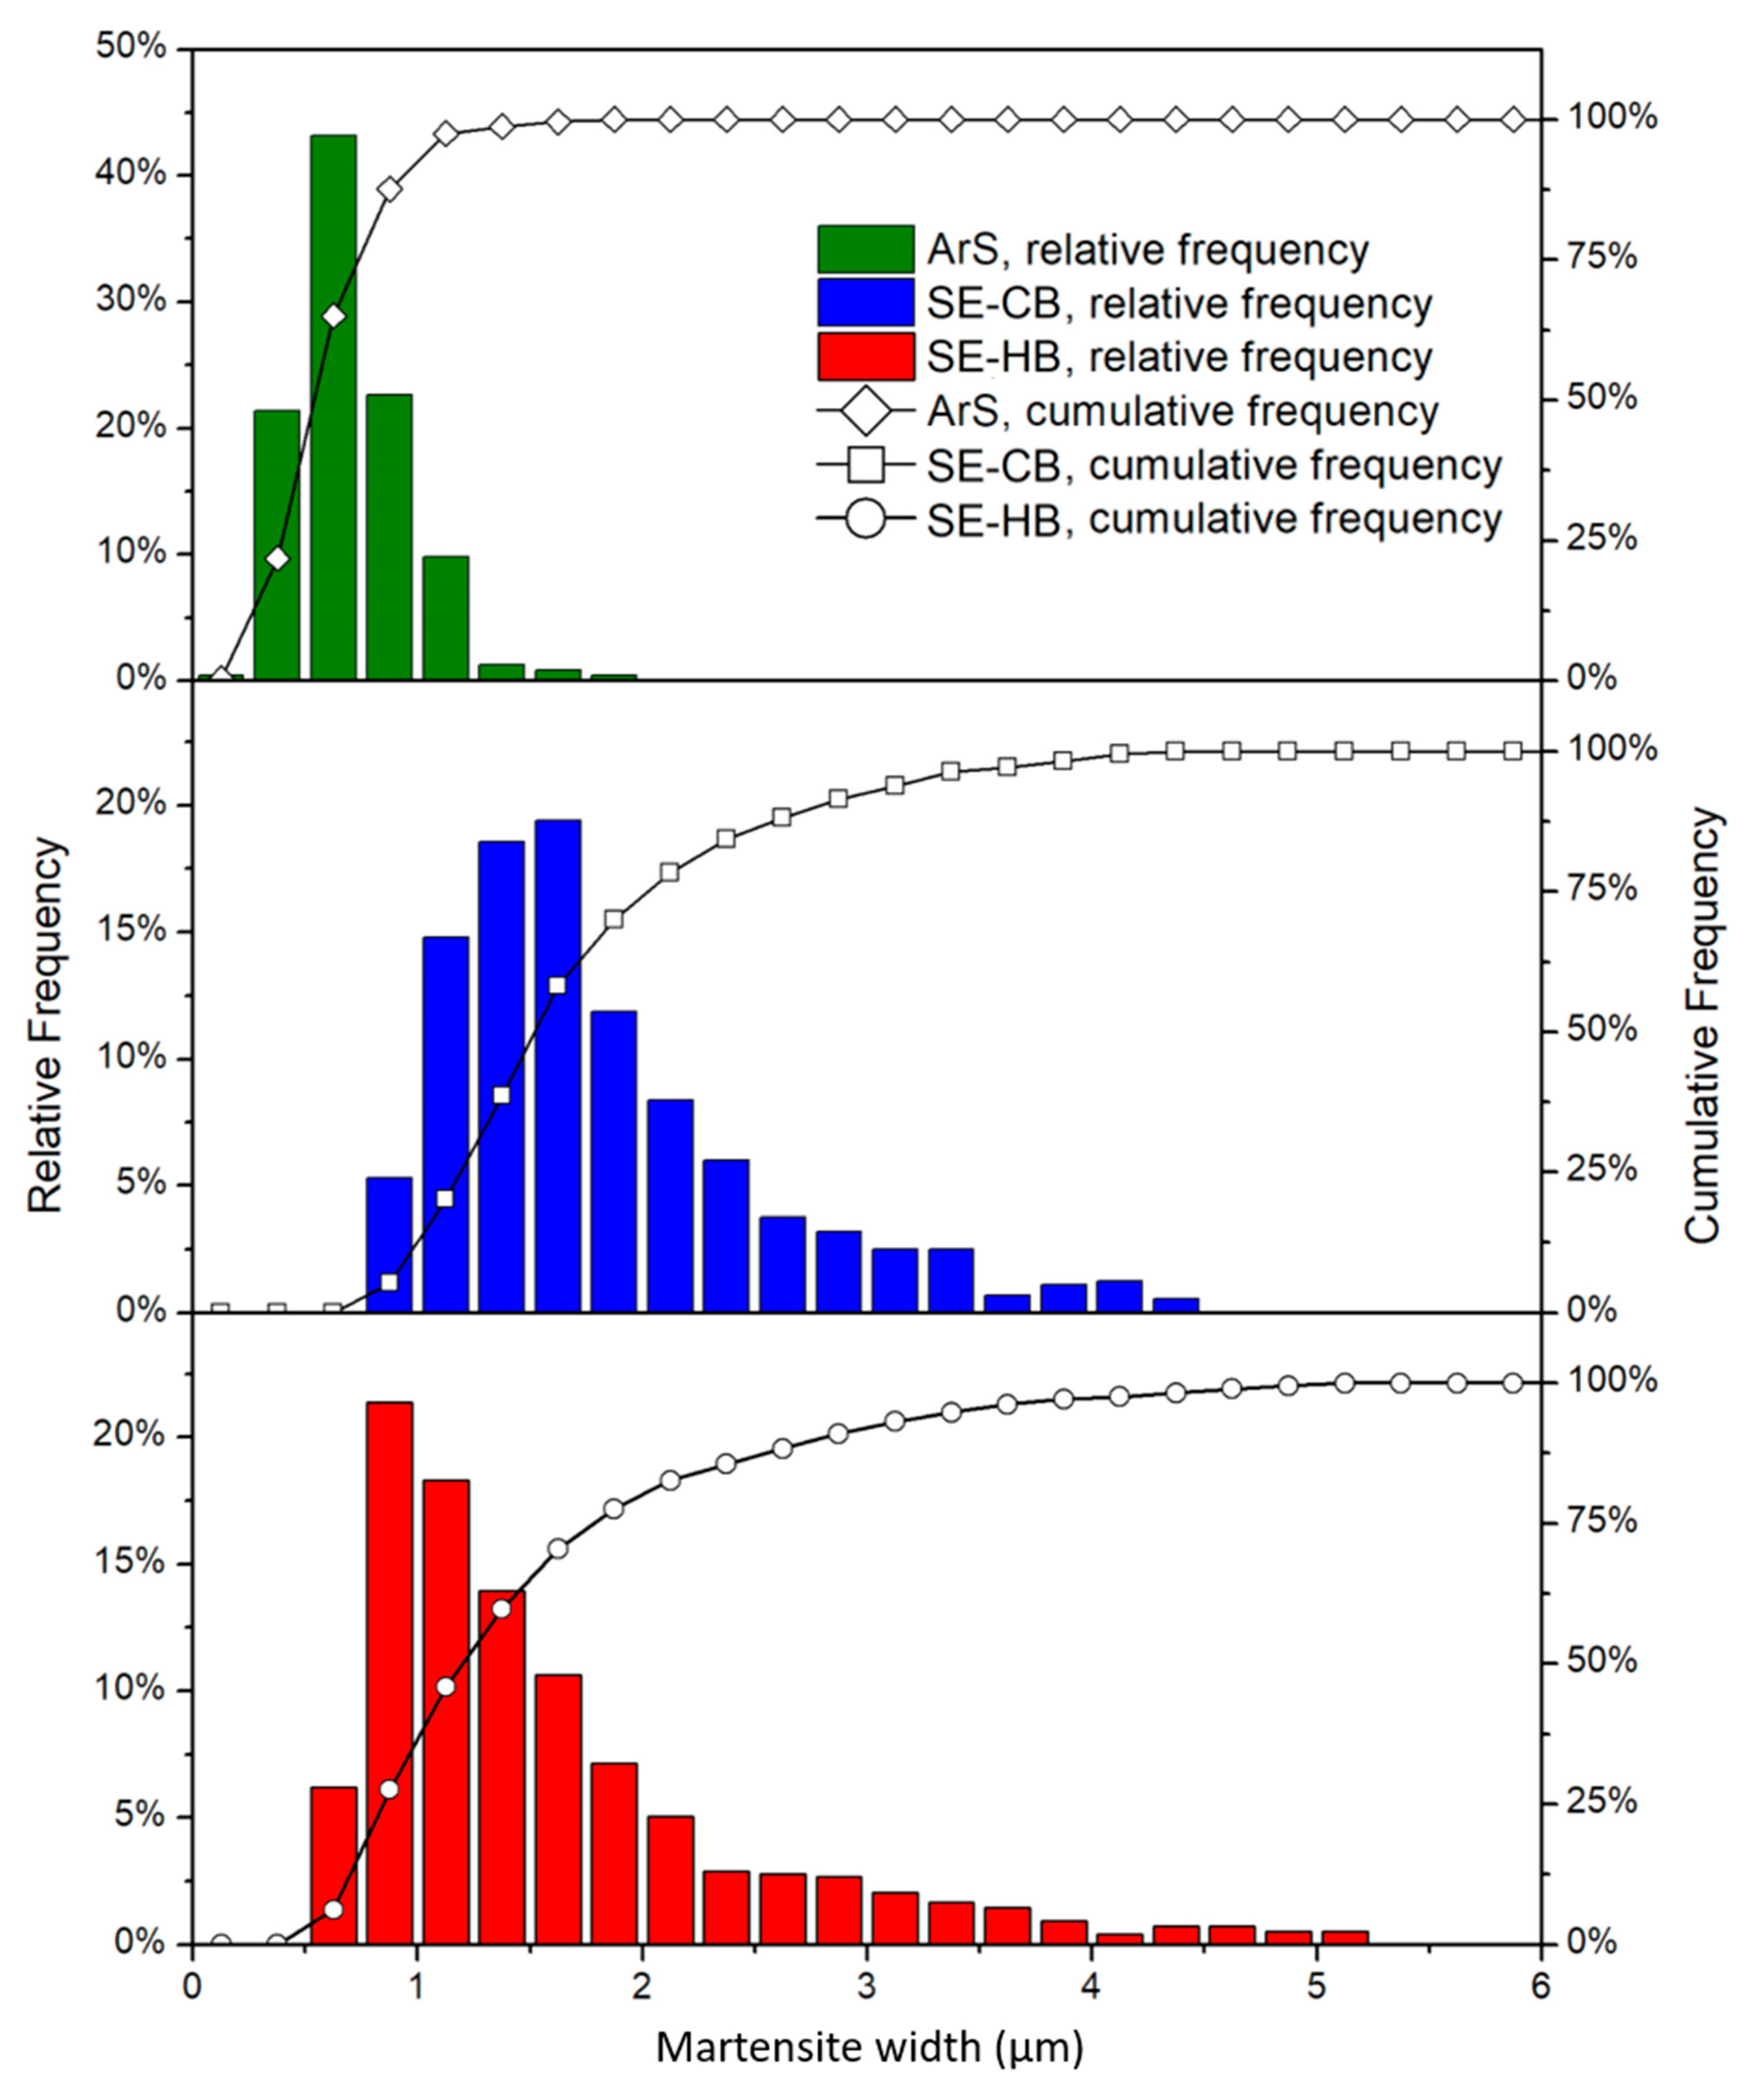
Martensite needles characterization is very important due to their influence on the mechanical properties of the final component, that can be eventually correlated to the process environment [36,55]. Acicular width was chosen therefore as the most suitable and representative property to compare, and the resulting distributions for all the analysed samples are reported in Figure 7. The exclusive use of shielding gas as a protective mean leads to the formation of a very fine martensitic microstructure, characterized by a mean width of 0.69 µm. This value is sensibly lower when compared to acicular widths of 1.83 µm and 1.60 µm of SE-CB and SE-HB samples, respectively. Although, the difference in microstructure between ArS (acicular α’ and lamellar α + β) and the other samples (acicular α’) must be taken into account, as it certainly influences martensitic width and causes the shift of the ArS curve towards lower values. As mentioned before, microstructural variations are caused by the different deposition environments used. Hence, this shift is related to interstitials pick-up and unrelated to thermal factors. Instead, the dissimilar width values measured for the samples built using a sealed environment might be related to the different cooling rate that defines the deposition process in the case of platform heating. Conduction is in fact the most influencing heat dissipation phenomenon occurring during the process [37,53]. The cooling rate, which greatly influences the final material microstructure [36,37], is then directly dependent on the temperature difference between the melt pool and the baseplate. As a consequence of that, a variation in the building platform temperature leads to a different cooling rate during the deposition, which eventually results in different microstructural features.
Although this seems to be in contradiction to the results obtained from the α’ width evaluation in which SE-HB samples were characterized by a finer martensitic microstructure (Figure 7), even if SE-CB samples underwent a faster cooling. This phenomenon might be explained considering that the martensitic size is the result of an athermal growth. In fact, since the same type of microstructure (completely martensitic) is involved, the SE-HB sample is characterized by larger grains, hence by a lower MS and elastic strain energy (Δgel), as demonstrated by previous studies [56,57]. Δgel is a thermodynamic property which is roughly correlated to dislocation density [58]. Wollants et al. [59] used this parameter to describe the change in free Gibbs energy ΔG in a transformation that leads to the formation of a martensitic product, by approximating it as an elliptic inclusion in the β phase:
Δ G = 2 π r 2 γ 4 3 π r 2 c ( Δ g c h Δ g e l )
where c is half the thickness of the inclusion, r is the radius, Δ g c h is the chemical driving force per volume unit. The Δ G value is in fact a balance between this last term and the elastic strain energy [56]. It has been assessed that a reduction in elastic strain energy corresponds to finer α’ needles [57], as confirmed by experimental data.
From a phenomenological point of view, a slower cooling induces less stress-related defects in the sample, such as dislocations, that favour nucleation and growth of martensite needles [36,42]. It is then reasonable to assume that in SE-CB samples martensite is bigger in size, as confirmed by experimental data. This correlation between microstructural features size and thermal history of the process demonstrates a behaviour for martensite completely opposite to the more stable microstructures (α + β), such as the aforementioned Widmanstätten [60], which formation is diffusion-related instead.

3.5. Hardness

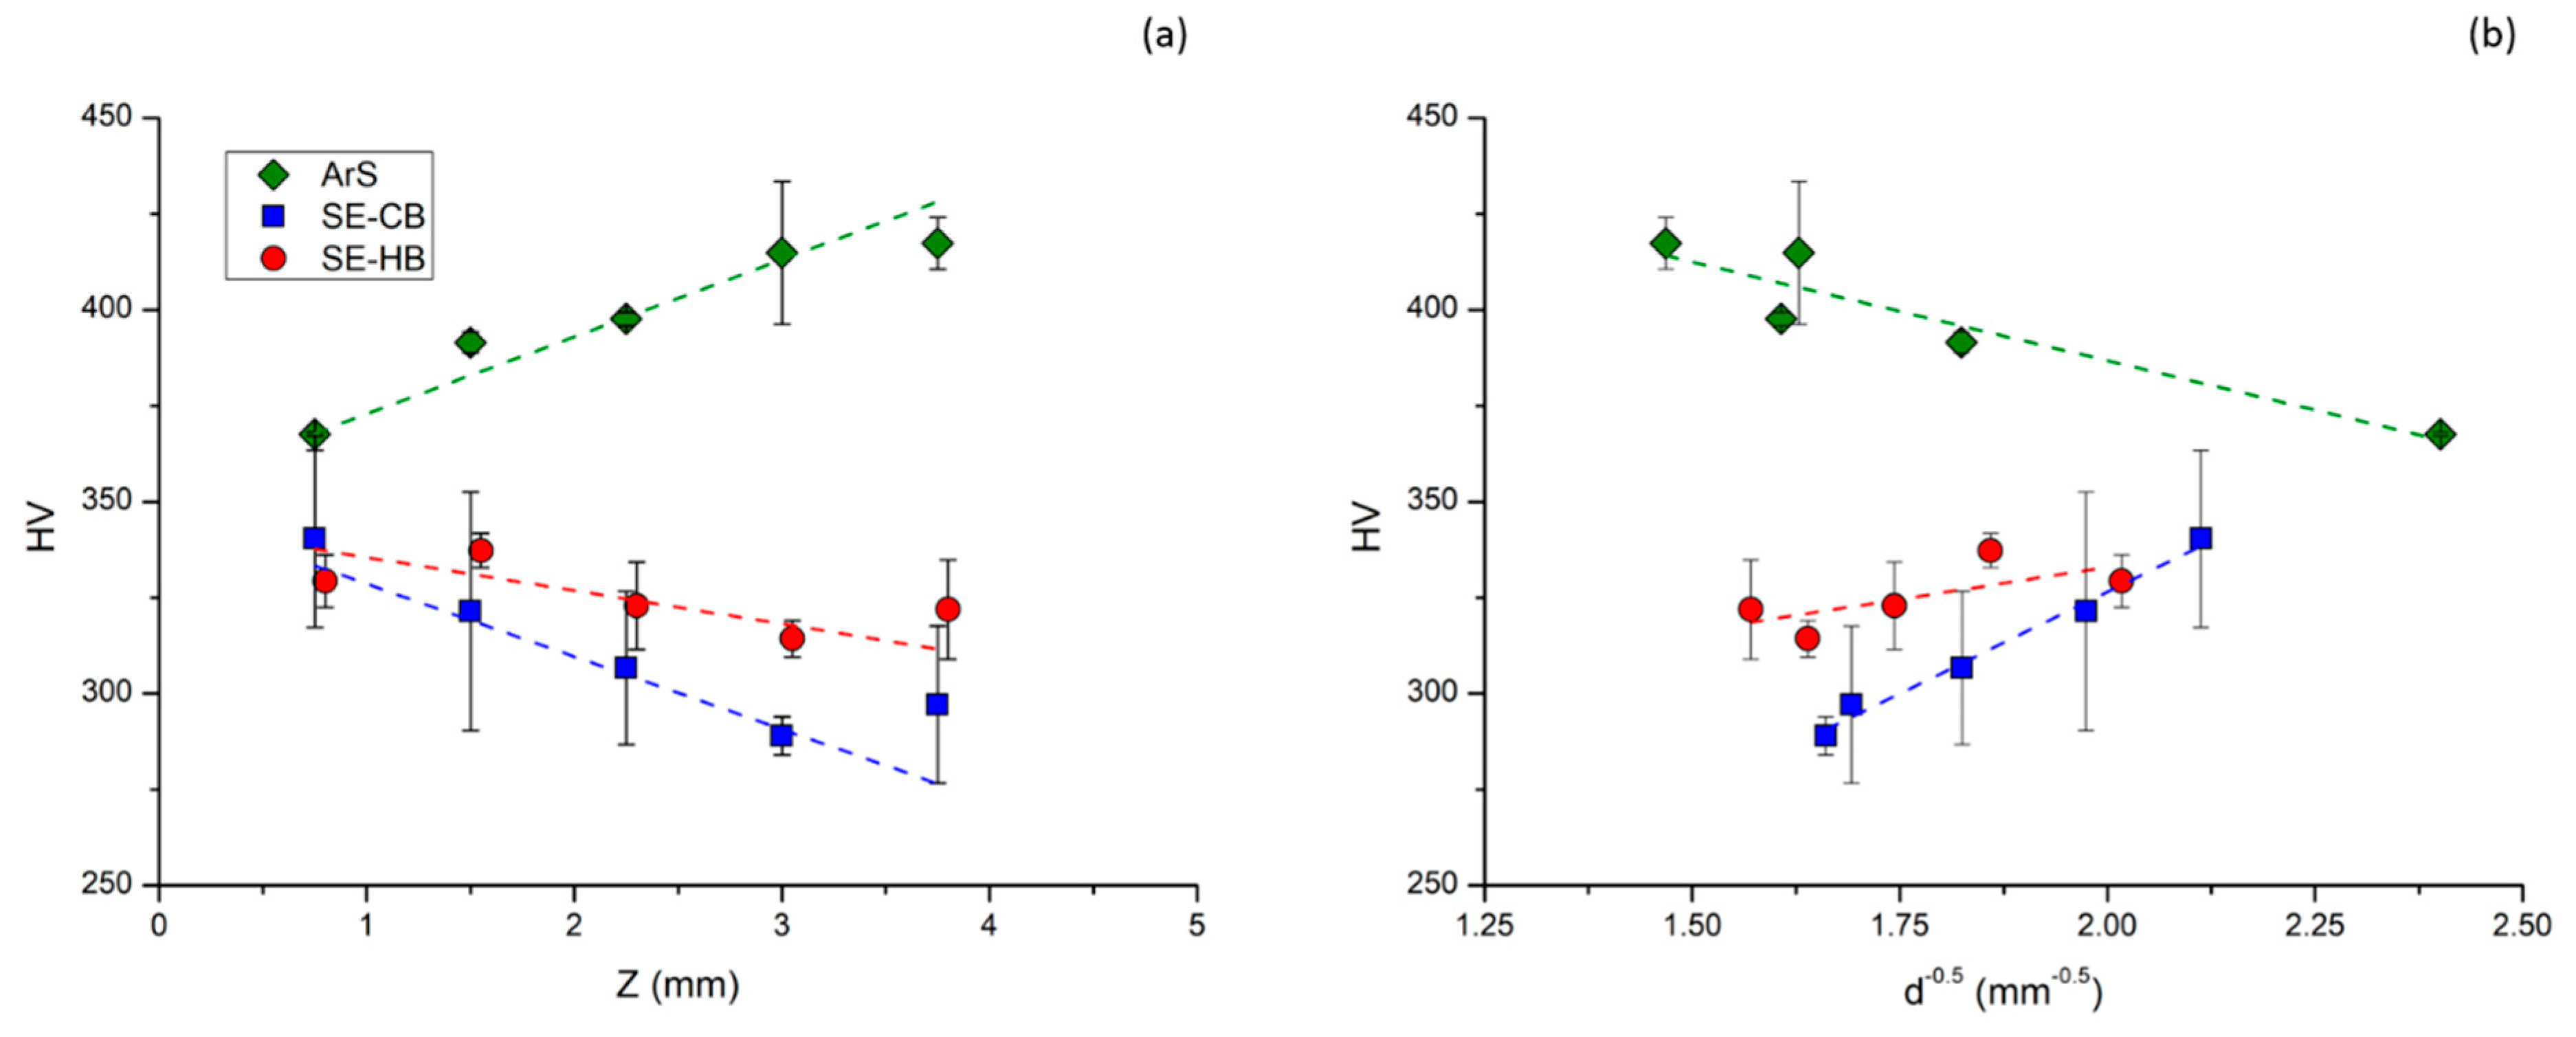
Hardness measurements were performed at different heights in the samples cross-section to evaluate whether the thermal history and consequent variations in grain width along Z impact on hardness is relevant or not. The resulting average hardness values for all the conditions considered were 398 ± 20 HV for ArS samples, 311 ± 27 HV and 325 ± 11 HV for SE-CB and SE-HB samples respectively. The markedly higher hardness for the first sample type is probably the result of the finer and different microstructure (as shown in Figure 2 and Figure 7), deriving from the increase in interstitial elements content. Microstructure refinement can also explain the slightly higher hardness value for SE-HB samples (finer martensite) with respect to SE-CB ones [61].
The average results for different Z values are plotted in Figure 8a, in the same way used previously for grain width, in Section 3.3. Important variations in hardness along Z are explained by confirming the initial hypothesis that the sample height has a direct impact on grain width.
As previously stated, while ArS sample hardness values showed an upward-sloping variation as Z increases, SE-CB and SE-HB samples were characterized by an opposite trend, displaying a decreasing HV trend as the distance from the platform increases. This markedly different behaviour might be caused by the different microstructures involved.
Considering the correlation between baseplate distance and grain width/hardness in the specimens built in a sealed environment, it can be derived that the intrinsic variation in cooling rate typical of this process and related to the baseplate temperature has a direct impact on the microstructure of the material. It then leads to the formation of anisotropic samples. On the other hand, this sensitive change was detected in small samples and in an area relatively close to the baseplate. This phenomenon might be negligible for greater values of Z (bigger samples). In fact, significant grain width/hardness variations in bigger samples seem unlikely. Moreover, the first millimetres from the surface are usually removed anyway due to machining. Considering that, this variation might be negligible for large samples. These phenomena might be critical for repairing applications, which usually involve a small area. To assess all these scenarios, further studies must be carried out on bigger samples to evaluate when and if the growing trend eventually reaches a plateau or at least a negligible variation.
To further investigate the above-mentioned behaviour, being able to distinguish between the influence of the microstructure itself and the grain size effect (grain boundary strengthening) is important. Both phenomena in fact play an important role in determining the mechanical properties of the alloy, including hardness. The Hall–Petch equation [62,63] is a well-known correlation between grain size and yield strength, that can be correlated to hardness [64,65], for polycrystalline metallic materials:
σ y = σ 0 + k d
where σ y is the material yield strength, σ 0 and k are material constants and d is the grain diameter. The evaluation of this last parameter is particularly complex in AM materials, since the grains are usually strongly anisotropic. Furthermore, the correlations between d and σ y (or HV) are acceptable for comparison only if the same type of microstructure is considered. In fact, different samples of the same material with similar grain size, but completely different microstructures (e.g., due to different thermal history) might show very different Hall–Petch curves. Figure 8b provides the results obtained evaluating the Hall-Petch curves for the samples in all the building conditions. In this case, instead of using different samples with different grain sizes, the Hall-Petch curves were obtained by considering different areas of the same sample, corresponding to horizontal slices at different distances from the baseplate on the Z-axis cross-section. This analysis works under the assumption that the Hall-Petch correlation is applicable to local measurements of the same sample and that local variations of columnar grains impact on microstructure and hardness, as previously assumed. Because of the opposite trend that ArS samples showed with respect to the other conditions in hardness measurements, even in Hall-Petch curves the resulting line slopes are opposite. Furthermore, kSE-CB and kSE-HB are markedly different, confirming a certain influence of the platform temperature on the final microstructure, independent from grain width, confirming the α’ size measurements provided in Figure 7. In fact, Tan et al. [66] proved that both grain boundaries strengthening and microstructure refinement play an important role in raising Ti-6Al-4V yield strength and both these phenomena must be taken into account when considering Hall-Petch plots. According to their results, grain size has a greater strengthening effect, although the authors worked on Ti-6Al-4V produced by EBM, which is mainly characterized by a lamellar microstructure. Moreover, the distance from the platform might also indirectly influence the microstructure by directly affecting grain width and consequently the martensite size leading to a sort of graded microstructure along Z. In fact, grain boundaries are preferential nucleation spots for martensite needles [14]. Hence, a local inter-grain α’ size variation along Z might be possible, leading to a different distribution in the bottom and the top part of the same grain, consequence of the different grain boundaries concentrations along the sample height. However further analysis is necessary to assess this possible local effect.

3.6. Effect on Larger Pieces

The horizontal bars deposited in an open environment, using argon as shielding gas as the only mean to protect them from oxidation and interstitial diffusion, presented visible cracks on the external surface, as reported in Figure 9a. These features were consistent throughout the whole sample on the top surface (Figure 9b) and also on the side (Figure 9c). The analysis of the cross-section proved that the cracks penetrated inside the sample (Figure 9d) and were linked to undesired phenomena, such as layer debonding.
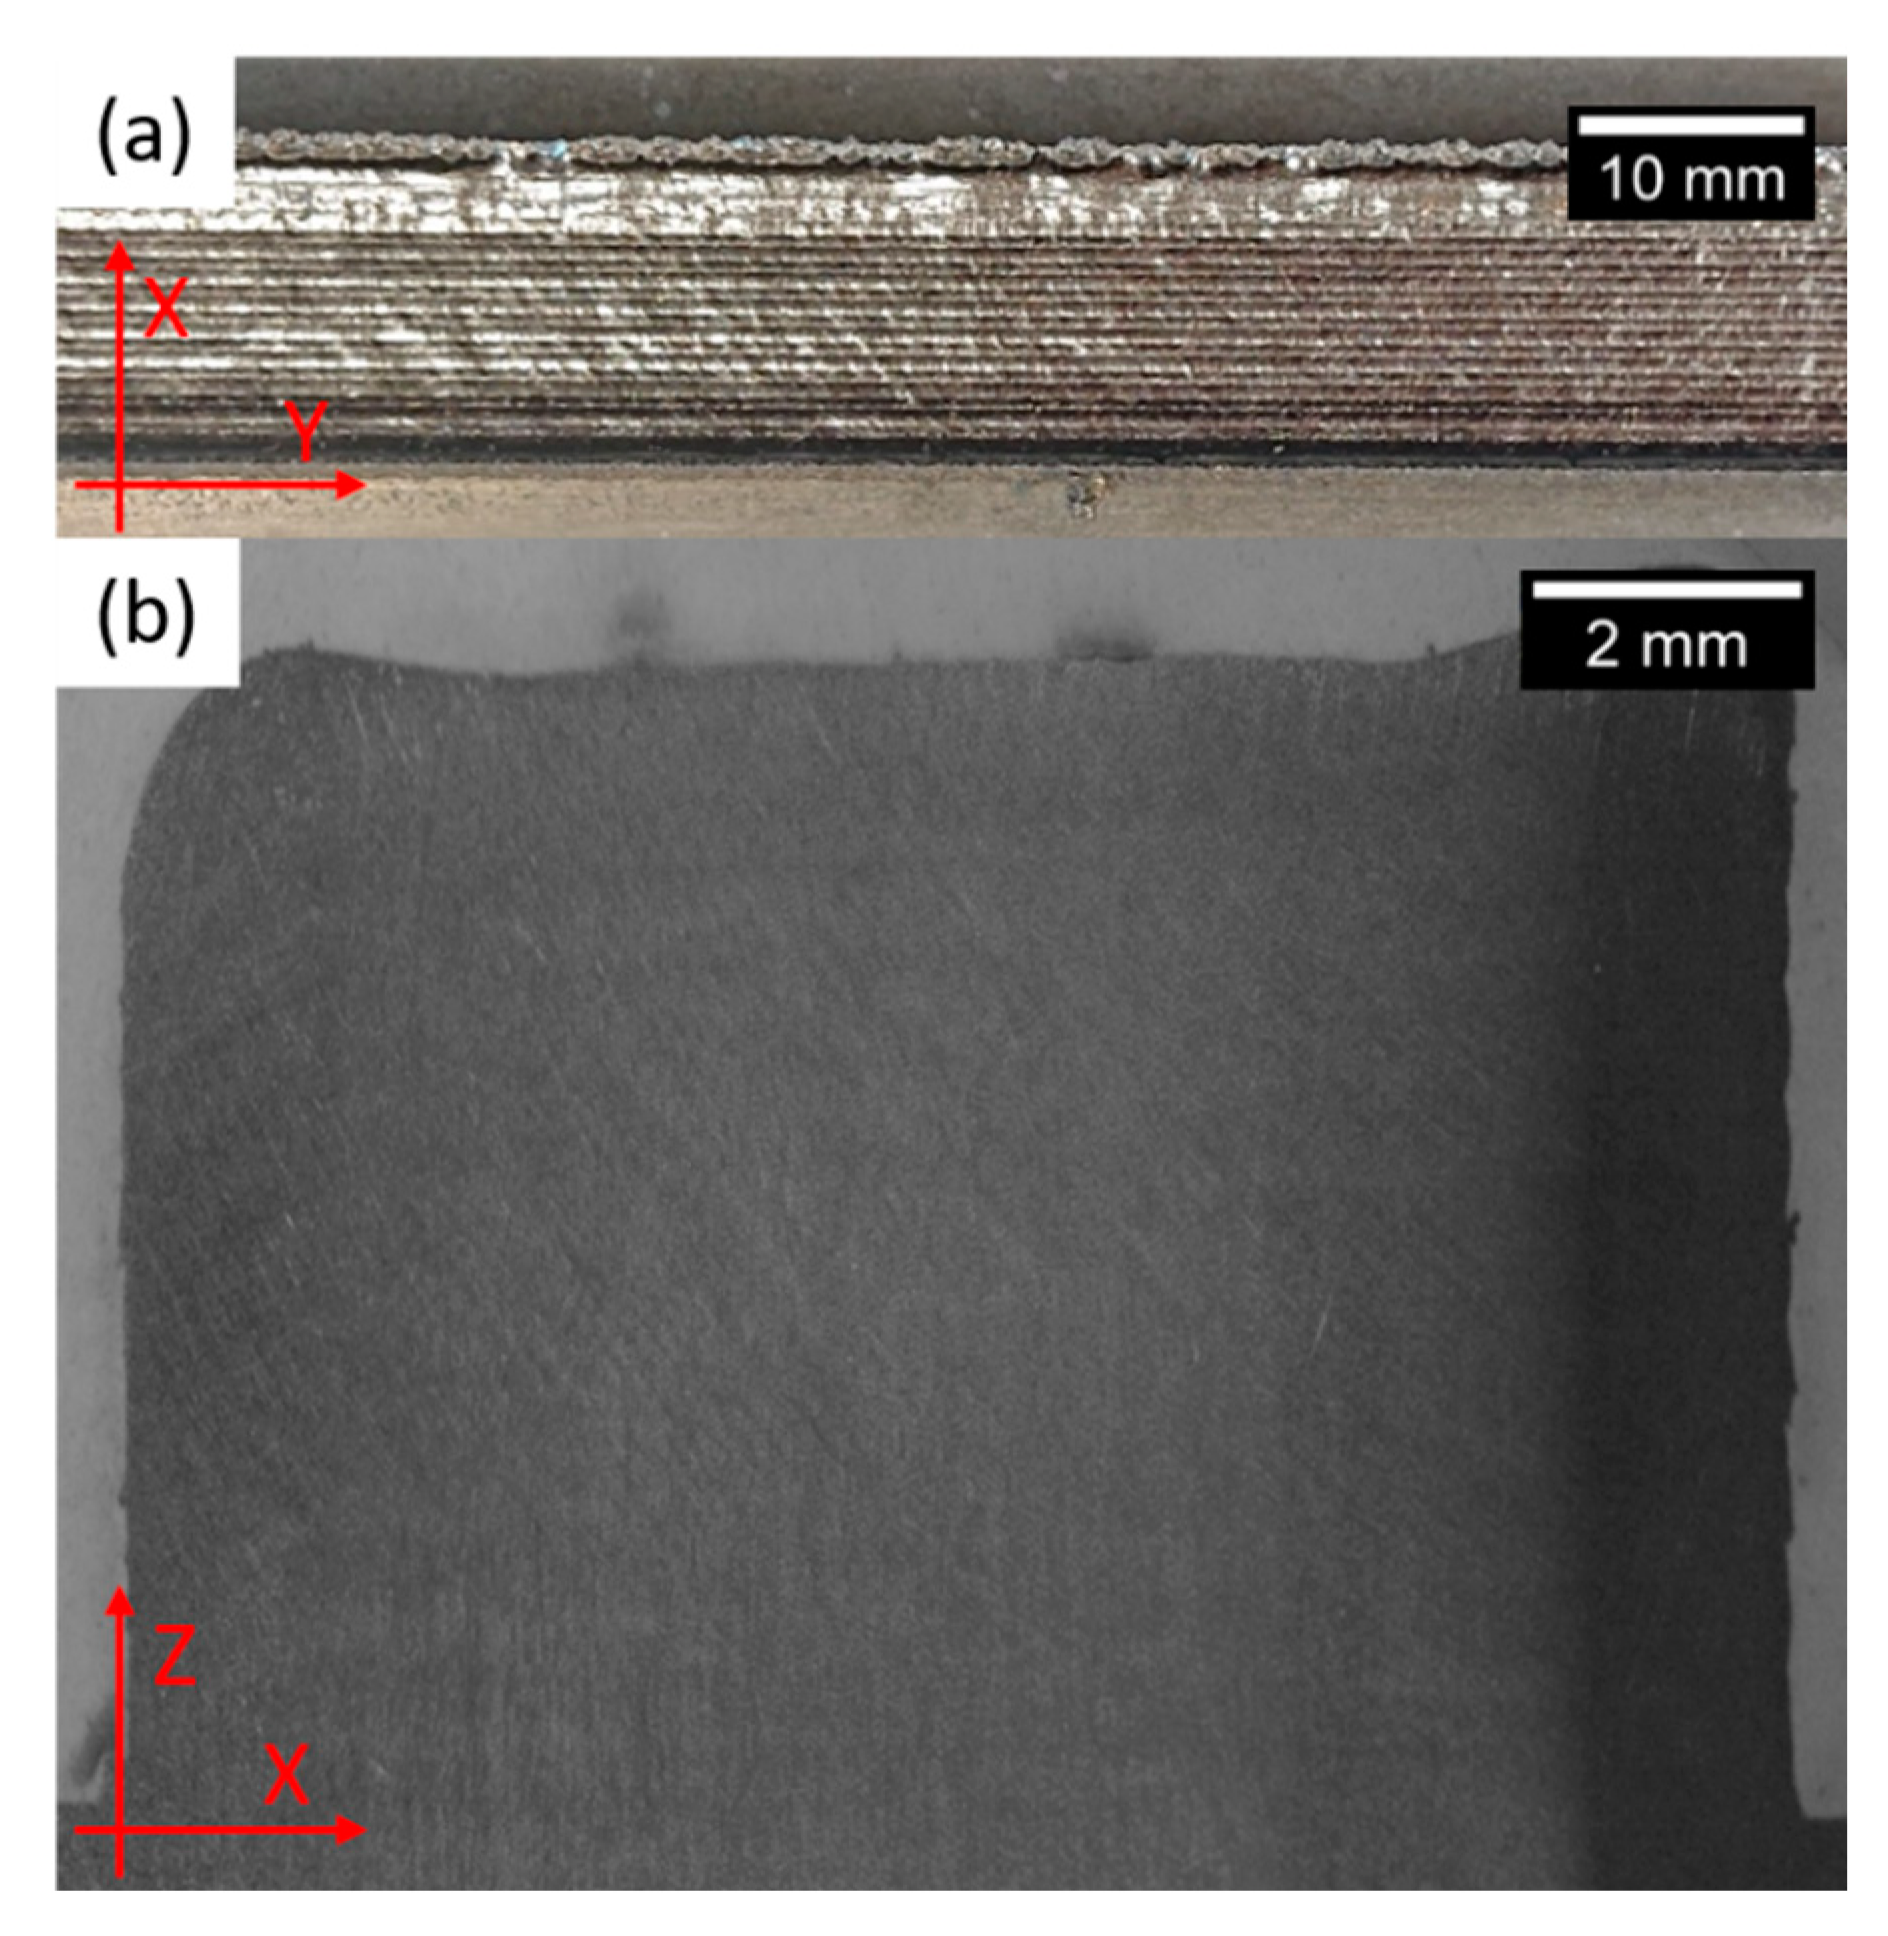
Contrarily, bars built in a sealed environment (glovebox-like) filled with argon gas, keeping the oxygen level below 0.2% throughout the whole process, did not show visible cracks on the external surface (Figure 10a) nor in the cross-section (Figure 10b). These bars were built in CB and HB conditions, in the same way as the cubic samples were deposited. In Figure 10, the bar built using platform preheating is shown as a representative example.
Process atmosphere was the only relevant difference between the deposition scenarios that lead to the formation of fully dense samples and the case in which the bars were completely cracked. The brittle behaviour of the ArS samples, consequence of oxygen and nitrogen pick-up, would then be considered the cause of cracking. Even if Ti-6Al-4V has a low tendency to crack during solidification, property that makes these alloys well suitable for AM [35], in the ArS case the interstitial concentration is too excessive and prevents the possibility to build bigger components. Although, cracking phenomena resulted critical only for samples bigger in size (bars). Smaller samples (cubes) instead were crack-free in all the building conditions, proving that, from a process perspective, controlling the atmosphere is critical only for samples larger in size. Even though, it must be taken into consideration that process environment variations influence the final properties of the sample. Hence, even if a small piece must be deposited (e.g., repairing applications), process environment must be thoroughly investigated and taken into consideration, as it impacts on the quality of the specimen itself.

4. Conclusions

The aim of this work was to determine how platform preheating and a sealed deposition environment, with respect to the exclusive use of an Ar flow as a protective mean, impacted on the final quality of Ti-6Al-4V samples built via DED. The most important results that were obtained can be summarized as follows:
  • Environmental factors in DED processes have a great impact on process feasibility, by directly influencing the final properties of the component. In particular, it was proved that the process atmosphere has a direct impact on the final properties of the component, such as microstructure and grain size, which result in a change of mechanical properties and can even affect the possibility to effectively build components;
  • It is possible to obtain large crack-free samples only if a sealed environment is used and if the oxygen content can be kept very low. However, this makes the production of very large components more complex;
  • Carrying the deposition in shielding gas makes the process feasible only if small components are produced. However, these samples will be characterized by a completely brittle behaviour, due to oxygen pick-up. Moreover, repairing small portions of large parts, which result impossible to fit in a sealed chamber, results acceptable in this environment. Although, the feasibility depends on the final requirements for the repaired part, in terms of mechanical properties. In fact, ductility might be a limiting factor.

Author Contributions

Conceptualization, A.C., A.A. and F.M.; methodology, A.C. and A.A.; validation, A.A., S.B. and M.L.; resources, F.M., S.B. and A.V.; data curation, A.A., S.B., M.L.; writing—original draft preparation, A.C.; writing—review and editing, A.A., F.M., S.B. and M.L.; project administration, S.B., A.V. and P.F. All authors have read and agreed to the published version of the manuscript.

Funding

This research was funded by Horizon 2020 research and innovation program with grant number 723795.

Acknowledgments

The authors would like to acknowledge the European Horizon 2020 research and innovation programme; grant agreement No. 723795 / 4D Hybrid–Novel ALL-IN-ONE machines, robots and systems for affordable, worldwide and lifetime distributed 3D hybrid manufacturing and repair operations.

Conflicts of Interest

The authors declare no conflict of interest.

References

  1. Thompson, S.M.; Bian, L.; Shamsaei, N.; Yadollahi, A. An overview of Direct Laser Deposition for additive manufacturing; Part I: Transport phenomena, modeling and diagnostics. Addit. Manuf. 2015, 8, 36–62. [Google Scholar] [CrossRef]
  2. Saboori, A.; Gallo, D.; Biamino, S.; Fino, P.; Lombardi, M. An Overview of Additive Manufacturing of Titanium Components by Directed Energy Deposition: Microstructure and Mechanical Properties. Appl. Sci. 2017, 7, 883. [Google Scholar] [CrossRef] [Green Version]
  3. Saboori, A.; Aversa, A.; Marchese, G.; Biamino, S.; Lombardi, M.; Fino, P. Application of Directed Energy Deposition-Based Additive Manufacturing in Repair. Appl. Sci. 2019, 9, 3316. [Google Scholar] [CrossRef] [Green Version]
  4. Frazier, W.E. Metal additive manufacturing: A review. J. Mater. Eng. Perform. 2014, 23, 1917–1928. [Google Scholar] [CrossRef]
  5. Wilson, J.M.; Piya, C.; Shin, Y.C.; Zhao, F.; Ramani, K. Remanufacturing of turbine blades by laser direct deposition with its energy and environmental impact analysis. J. Clean. Prod. 2014, 80, 170–178. [Google Scholar] [CrossRef]
  6. Zhang, Y.; Bandyopadhyay, A. Direct fabrication of bimetallic Ti6Al4V+Al12Si structures via additive manufacturing. Addit. Manuf. 2019, 29, 100783. [Google Scholar] [CrossRef] [PubMed]
  7. Sklyar, M.O.; Turichin, G.A.; Klimova, O.G.; Zotov, O.G.; Topalov, I.K. Microstructure of 316L stainless steel components produced by direct laser deposition. Steel Transl. 2016, 46, 883–887. [Google Scholar] [CrossRef]
  8. Zhong, M.; Liu, W.; Ning, G.; Yang, L.; Chen, Y. Laser direct manufacturing of tungsten nickel collimation component. J. Mater. Process. Technol. 2004, 147, 167–173. [Google Scholar] [CrossRef]
  9. Dinda, G.P.; Song, L.; Mazumder, J. Fabrication of Ti-6Al-4V Scaffolds by Direct Metal Deposition. Metall. Mater. Trans. A 2008, 39, 2914–2922. [Google Scholar] [CrossRef] [Green Version]
  10. Azarniya, A.; Colera, X.G.; Mirzaali, M.J.; Sovizi, S.; Bartolomeu, F.; St Weglowski, M.K.; Wits, W.W.; Yap, C.Y.; Ahn, J.; Miranda, G.; et al. Additive manufacturing of Ti–6Al–4V parts through laser metal deposition (LMD): Process, microstructure, and mechanical properties. J. Alloys Compd. 2019, 804, 163–191. [Google Scholar] [CrossRef]
  11. Barboza, M.J.R.; Perez, E.A.C.; Medeiros, M.M.; Reis, D.A.P.; Nono, M.C.A.; Neto, F.P.; Silva, C.R.M. Creep behavior of Ti-6Al-4V and a comparison with titanium matrix composites. Mater. Sci. Eng. A 2006, 428, 319–326. [Google Scholar] [CrossRef]
  12. Sibisi, P.N.; Popoola, A.P.I.; Arthur, N.K.K.; Pityana, S.L. Review on direct metal laser deposition manufacturing technology for the Ti-6Al-4V alloy. Int. J. Adv. Manuf. Technol. 2020, 107, 1163–1178. [Google Scholar] [CrossRef]
  13. Dutta, B.; Froes, F.H. The Additive Manufacturing (AM) of titanium alloys. In Titanium Powder Metallurgy; Elsevier, Ed.; Butterworth-Heinemann: Oxford, UK, 2015; pp. 447–468. [Google Scholar]
  14. Leyens, C.; Peters, M. Titanium and Titanium Alloys: Fundamentals and Applications; John Wiley & Sons: Hoboken, NJ, USA, 2003; ISBN 3-527-30534-3. [Google Scholar]
  15. Veiga, C.; Davim, J.P.; Loureiro, A.J.R. Proprties and applications of titanium alloys. Rev. Adv. Mater. Sci. 2012, 32, 133–148. [Google Scholar]
  16. Cui, C.; Hu, B.M.; Zhao, L.; Liu, S. Titanium alloy production technology, market prospects and industry development. Mater. Des. 2011, 32, 1684–1691. [Google Scholar] [CrossRef]
  17. Kobryn, P.A.; Moore, E.H.; Semiatin, S.L. Effect of laser power and traverse speed on microstructure, porosity, and build height in laser-deposited Ti-6Al-4V. Scr. Mater. 2000, 43, 299–305. [Google Scholar] [CrossRef]
  18. Cottam, R.; Brandt, M. Laser cladding of Ti-6Al-4V powder on Ti-6Al-4V substrate: Effect of laser cladding parameters on microstructure. Phys. Procedia 2011, 12, 323–329. [Google Scholar] [CrossRef] [Green Version]
  19. Mahamood, R.M.; Akinlabi, E.T.; Akinlabi, S. Laser power and Scanning Speed Influence on the Mechanical Property of Laser Metal Deposited Titanium-Alloy. Lasers Manuf. Mater. Process. 2015, 2, 43–55. [Google Scholar] [CrossRef] [Green Version]
  20. Yan, M.; Xu, W.; Dargusch, M.S.; Tang, H.P.; Brandt, M.; Qian, M. Review of effect of oxygen on room temperature ductility of titanium and titanium alloys. Powder Metall. 2014, 57, 251–257. [Google Scholar] [CrossRef]
  21. Qiu, C.; Ravi, G.A.; Dance, C.; Ranson, A.; Dilworth, S.; Attallah, M.M. Fabrication of large Ti-6Al-4V structures by direct laser deposition. J. Alloys Compd. 2015, 629, 351–361. [Google Scholar] [CrossRef]
  22. Klimova-Korsmik, O.G.; Turichin, G.A.; Shalnova, S.A.; Gushchina, M.O.; Cheverikin, V.V. Structure and properties of Ti-6Al-4V titanium alloy products obtained by direct laser deposition and subsequent heat treatment. J. Phys. Conf. Ser. 2018, 1109, 012061. [Google Scholar] [CrossRef]
  23. Zhai, Y.; Galarraga, H.; Lados, D.A. Microstructure, static properties, and fatigue crack growth mechanisms in Ti-6Al-4V fabricated by additive manufacturing: LENS and EBM. Eng. Fail. Anal. 2016, 69, 3–14. [Google Scholar] [CrossRef]
  24. Gharbi, M.; Peyre, P.; Gorny, C.; Carin, M.; Morville, S.; Le Masson, P.; Carron, D.; Fabbro, R. Influence of various process conditions on surface finishes induced by the direct metal deposition laser technique on a Ti-6Al-4V alloy. J. Mater. Process. Technol. 2013, 213, 791–800. [Google Scholar] [CrossRef] [Green Version]
  25. Bian, L.; Thompson, S.M.; Shamsaei, N. Mechanical Properties and Microstructural Features of Direct Laser-Deposited Ti-6Al-4V. JOM 2015, 67, 629–638. [Google Scholar] [CrossRef]
  26. Szost, B.A.; Terzi, S.; Martina, F.; Boisselier, D.; Prytuliak, A.; Pirling, T.; Hofmann, M.; Jarvis, D.J. A comparative study of additive manufacturing techniques: Residual stress and microstructural analysis of CLAD and WAAM printed Ti-6Al-4V components. Mater. Des. 2016, 89, 559–567. [Google Scholar] [CrossRef] [Green Version]
  27. Beuth, J.; Klingbeil, N. The role of process variables in laser-based direct metal solid freeform fabrication. JOM 2001, 53, 36–39. [Google Scholar] [CrossRef]
  28. Corbin, D.J.; Nassar, A.R.; Reutzel, E.W.; Beese, A.M.; Michaleris, P. Effect of substrate thickness and preheating on the distortion of laser deposited ti-6al-4v. J. Manuf. Sci. Eng. Trans. ASME 2018, 140, 1–9. [Google Scholar] [CrossRef] [Green Version]
  29. Lu, X.; Lin, X.; Chiumenti, M.; Cervera, M.; Hu, Y.; Ji, X.; Ma, L.; Yang, H.; Huang, W. Residual stress and distortion of rectangular and S-shaped Ti-6Al-4V parts by Directed Energy Deposition: Modelling and experimental calibration. Addit. Manuf. 2019, 26, 166–179. [Google Scholar] [CrossRef]
  30. Kistler, N.A.; Corbin, D.J.; Nassar, A.R.; Reutzel, E.W.; Beese, A.M. Effect of processing conditions on the microstructure, porosity, and mechanical properties of Ti-6Al-4V repair fabricated by directed energy deposition. J. Mater. Process. Technol. 2019, 264, 172–181. [Google Scholar] [CrossRef]
  31. Mazzucato, F.; Aversa, A.; Doglione, R.; Biamino, S.; Valente, A.; Lombardi, M. Influence of Process Parameters and Deposition Strategy on Laser Metal Deposition of 316L Powder. Metals 2019, 9, 1160. [Google Scholar] [CrossRef] [Green Version]
  32. Zhang, Q.; Yu, C.; Peng, Y.; Peng, Q. Quantification of the thickness of Widmanstatten α-laths in Ti alloys. In Proceedings of the 5th International Congress on Image and Signal Processing CISP, Chongqing, China, 16–18 October 2012; pp. 464–468. [Google Scholar] [CrossRef]
  33. Brandl, E.; Greitemeier, D. Microstructure of additive layer manufactured Ti-6Al-4V after exceptional post heat treatments. Mater. Lett. 2012, 81, 84–87. [Google Scholar] [CrossRef]
  34. Gorsse, S.; Hutchinson, C.; Gouné, M.; Banerjee, R. Additive manufacturing of metals: A brief review of the characteristic microstructures and properties of steels, Ti-6Al-4V and high-entropy alloys. Sci. Technol. Adv. Mater. 2017, 18, 584–610. [Google Scholar] [CrossRef] [PubMed] [Green Version]
  35. Ho, A.; Zhao, H.; Fellowes, J.W.; Martina, F.; Davis, A.E.; Prangnell, P.B. On the origin of microstructural banding in Ti-6Al4V wire-arc based high deposition rate additive manufacturing. Acta Mater. 2019, 166, 306–323. [Google Scholar] [CrossRef]
  36. Yang, J.; Yu, H.; Yin, J.; Gao, M.; Wang, Z.; Zeng, X. Formation and control of martensite in Ti-6Al-4V alloy produced by selective laser melting. Mater. Des. 2016, 108, 308–318. [Google Scholar] [CrossRef]
  37. Salsi, E.; Chiumenti, M.; Cervera, M. Modeling of microstructure evolution of Ti6Al4V for additive manufacturing. Metals 2018, 8, 633. [Google Scholar] [CrossRef] [Green Version]
  38. Froes, F.H. Titanium: Physical Metallurgy Processing and Application; ASM International: Cleveland, OH, USA, 2015; ISBN 1-62708-079-1. [Google Scholar]
  39. Kok, Y.; Tan, X.; Tor, S.B.; Chua, C.K. Fabrication and microstructural characterisation of additive manufactured Ti-6Al-4V parts by electron beam melting: This paper reports that the microstructure and micro-hardness of an EMB part is thickness dependent. Virtual Phys. Prototyp. 2015, 10, 13–21. [Google Scholar] [CrossRef]
  40. Wysocki, B.; Maj, P.; Sitek, R.; Buhagiar, J.; Kurzydłowski, K.; Święszkowski, W. Laser and Electron Beam Additive Manufacturing Methods of Fabricating Titanium Bone Implants. Appl. Sci. 2017, 7, 657. [Google Scholar] [CrossRef]
  41. Nabhani, M.; Shoja Razavi, R.; Barekat, M. Corrosion study of laser cladded Ti-6Al-4V alloy in different corrosive environments. Eng. Fail. Anal. 2019, 97, 234–241. [Google Scholar] [CrossRef]
  42. Zhang, W.; Jin, Y.M.; Khachaturyan, A.G. Phase field microelasticity modeling of heterogeneous nucleation and growth in martensitic alloys. Acta Mater. 2007, 55, 565–574. [Google Scholar] [CrossRef]
  43. Amaya-Vazquez, M.R.; Sánchez-Amaya, J.M.; Boukha, Z.; Botana, F.J. Microstructure, microhardness and corrosion resistance of remelted TiG2 and Ti6Al4V by a high power diode laser. Corros. Sci. 2012, 56, 36–48. [Google Scholar] [CrossRef]
  44. Galarraga, H.; Warren, R.J.; Lados, D.A.; Dehoff, R.R.; Kirka, M.M.; Nandwana, P. Effects of heat treatments on microstructure and properties of Ti-6Al-4V ELI alloy fabricated by electron beam melting (EBM). Mater. Sci. Eng. A 2017, 685, 417–428. [Google Scholar] [CrossRef] [Green Version]
  45. Cullity, B.D.; Stock, S.R. Elements of X-Ray Diffraction; Addison-Wesley Publishing: Boston, MA, USA, 1956. [Google Scholar]
  46. Oh, J.M.; Lee, B.G.; Cho, S.W.; Lee, S.W.; Choi, G.S.; Lim, J.W. Oxygen effects on the mechanical properties and lattice strain of Ti and Ti-6Al-4V. Met. Mater. Int. 2011, 17, 733–736. [Google Scholar] [CrossRef]
  47. Montanari, R.; Costanza, G.; Tata, M.E.; Testani, C. Lattice expansion of Ti-6Al-4V by nitrogen and oxygen absorption. Mater. Charact. 2008, 59, 334–337. [Google Scholar] [CrossRef] [Green Version]
  48. Ogden, H.R.; Jaffee, R.I. The Effects of Carbon, Oxygen and Nitrogen on the Mechanical Properties of Titanium and Titanium Alloys; TML Report No. 20; Titanium Metallurgical Laboratory, Batelle Memorial Institute: Columbus, OH, USA, 1955. [Google Scholar]
  49. Soeda, S.; Fujii, H.; Okano, H.; Hanaki, M. High Strength, High Ductility Titanium-Alloy and Process for Producing the Same. U.S. Patent 6,063,211, 16 May 2000. [Google Scholar]
  50. Malinov, S.; Sha, W.; Guo, Z. Application of artificial neural network for prediction of time-temperature-transformation diagrams in titanium alloys. Mater. Sci. Eng. A 2000, 283, 1–10. [Google Scholar] [CrossRef]
  51. Vrancken, B.; Thijs, L.; Kruth, J.P.; Van Humbeeck, J. Heat treatment of Ti6Al4V produced by Selective Laser Melting: Microstructure and mechanical properties. J. Alloys Compd. 2012, 541, 177–185. [Google Scholar] [CrossRef] [Green Version]
  52. Kelly, S.M.; Kampe, S.L. Microstructural evolution in laser-deposited multilayer Ti-6Al-4V builds: Part II. Thermal Modeling. Metall. Mater. Trans. A Phys. Metall. Mater. Sci. 2004, 35, 1869–1879. [Google Scholar] [CrossRef]
  53. Shamsaei, N.; Yadollahi, A.; Bian, L.; Thompson, S.M. An overview of Direct Laser Deposition for additive manufacturing; Part II: Mechanical behavior, process parameter optimization and control. Addit. Manuf. 2015, 8, 12–35. [Google Scholar] [CrossRef]
  54. Broderick, T.F.; Jackson, A.G.; Jones, H.; Froes, F.H. The effect of cooling conditions on the microstructure of rapidly solidified Ti-6Al-4V. Metall. Trans. A 1985, 16, 1951–1959. [Google Scholar] [CrossRef]
  55. Wei, K.; Wang, Z.; Li, F.; Zhang, H.; Zeng, X. Densification behavior, microstructure evolution, and mechanical performances of selective laser melted Ti-5Al-2.5Sn α titanium alloy: Effect of laser energy input. J. Alloys Compd. 2019, 774, 1024–1035. [Google Scholar] [CrossRef]
  56. Bignon, M.; Bertrand, E.; Tancret, F.; Rivera-Díaz-del-Castillo, P.E.J. Modelling martensitic transformation in titanium alloys: The influence of temperature and deformation. Materialia 2019, 7, 100382. [Google Scholar] [CrossRef]
  57. He, J.; Li, D.; Jiang, W.; Ke, L.; Qin, G.; Ye, Y.; Qin, Q.; Qiu, D. The Martensitic Transformation and Mechanical Properties of Ti6Al4V Prepared via Selective Laser Melting. Materials 2019, 12, 321. [Google Scholar] [CrossRef] [Green Version]
  58. Porter, D.A.; Easterling, K.E.; Sherif, M.Y. Phase Transformations in Metals and Alloys, 3rd ed.; CRC Press: Boca Raton, FL, USA, 2009. [Google Scholar]
  59. Wollants, P.; Roos, J.R.; Delaey, L. Thermally- and stress-induced thermoelastic martensitic transformations in the reference frame of equilibrium thermodynamics. Prog. Mater. Sci. 1993, 37, 227–288. [Google Scholar] [CrossRef]
  60. Gil, F.J.; Ginebra, M.P.; Manero, J.M.; Planell, J.A. Formation of α-Widmanstätten structure: Effects of grain size and cooling rate on the Widmanstätten morphologies and on the mechanical properties in Ti6Al4V alloy. J. Alloys Compd. 2001, 329, 142–152. [Google Scholar] [CrossRef]
  61. Puebla, K.; Murr, L.E.; Gaytan, S.M.; Martinez, E.; Medina, F.; Wicker, R.B. Effect of Melt Scan Rate on Microstructure and Macrostructure for Electron Beam Melting of Ti-6Al-4V. Mater. Sci. Appl. 2012, 03, 259–264. [Google Scholar] [CrossRef] [Green Version]
  62. Hall, E.O. The deformation and ageing of mild steel: II Characteristics of the Lüders deformation. Proc. Phys. Soc. Sect. B 1951, 64, 742–747. [Google Scholar] [CrossRef]
  63. Petch, N.J. The Cleavage Strength of Polycrystals. J. Iron Steel Inst. 1953, 174, 25–28. [Google Scholar]
  64. Pavlina, E.J.; Van Tyne, C.J. Correlation of Yield strength and Tensile strength with hardness for steels. J. Mater. Eng. Perform. 2008, 17, 888–893. [Google Scholar] [CrossRef]
  65. Lu, W.; Shi, Y.; Li, X.; Lei, Y. Correlation between tensile strength and hardness of electron beam welded TC4-DT joints. J. Mater. Eng. Perform. 2013, 22, 1694–1700. [Google Scholar] [CrossRef]
  66. Tan, X.; Kok, Y.; Tan, Y.J.; Descoins, M.; Mangelinck, D.; Tor, S.B.; Leong, K.F.; Chua, C.K. Graded microstructure and mechanical properties of additive manufactured Ti-6Al-4V via electron beam melting. Acta Mater. 2015, 97, 1–16. [Google Scholar] [CrossRef]
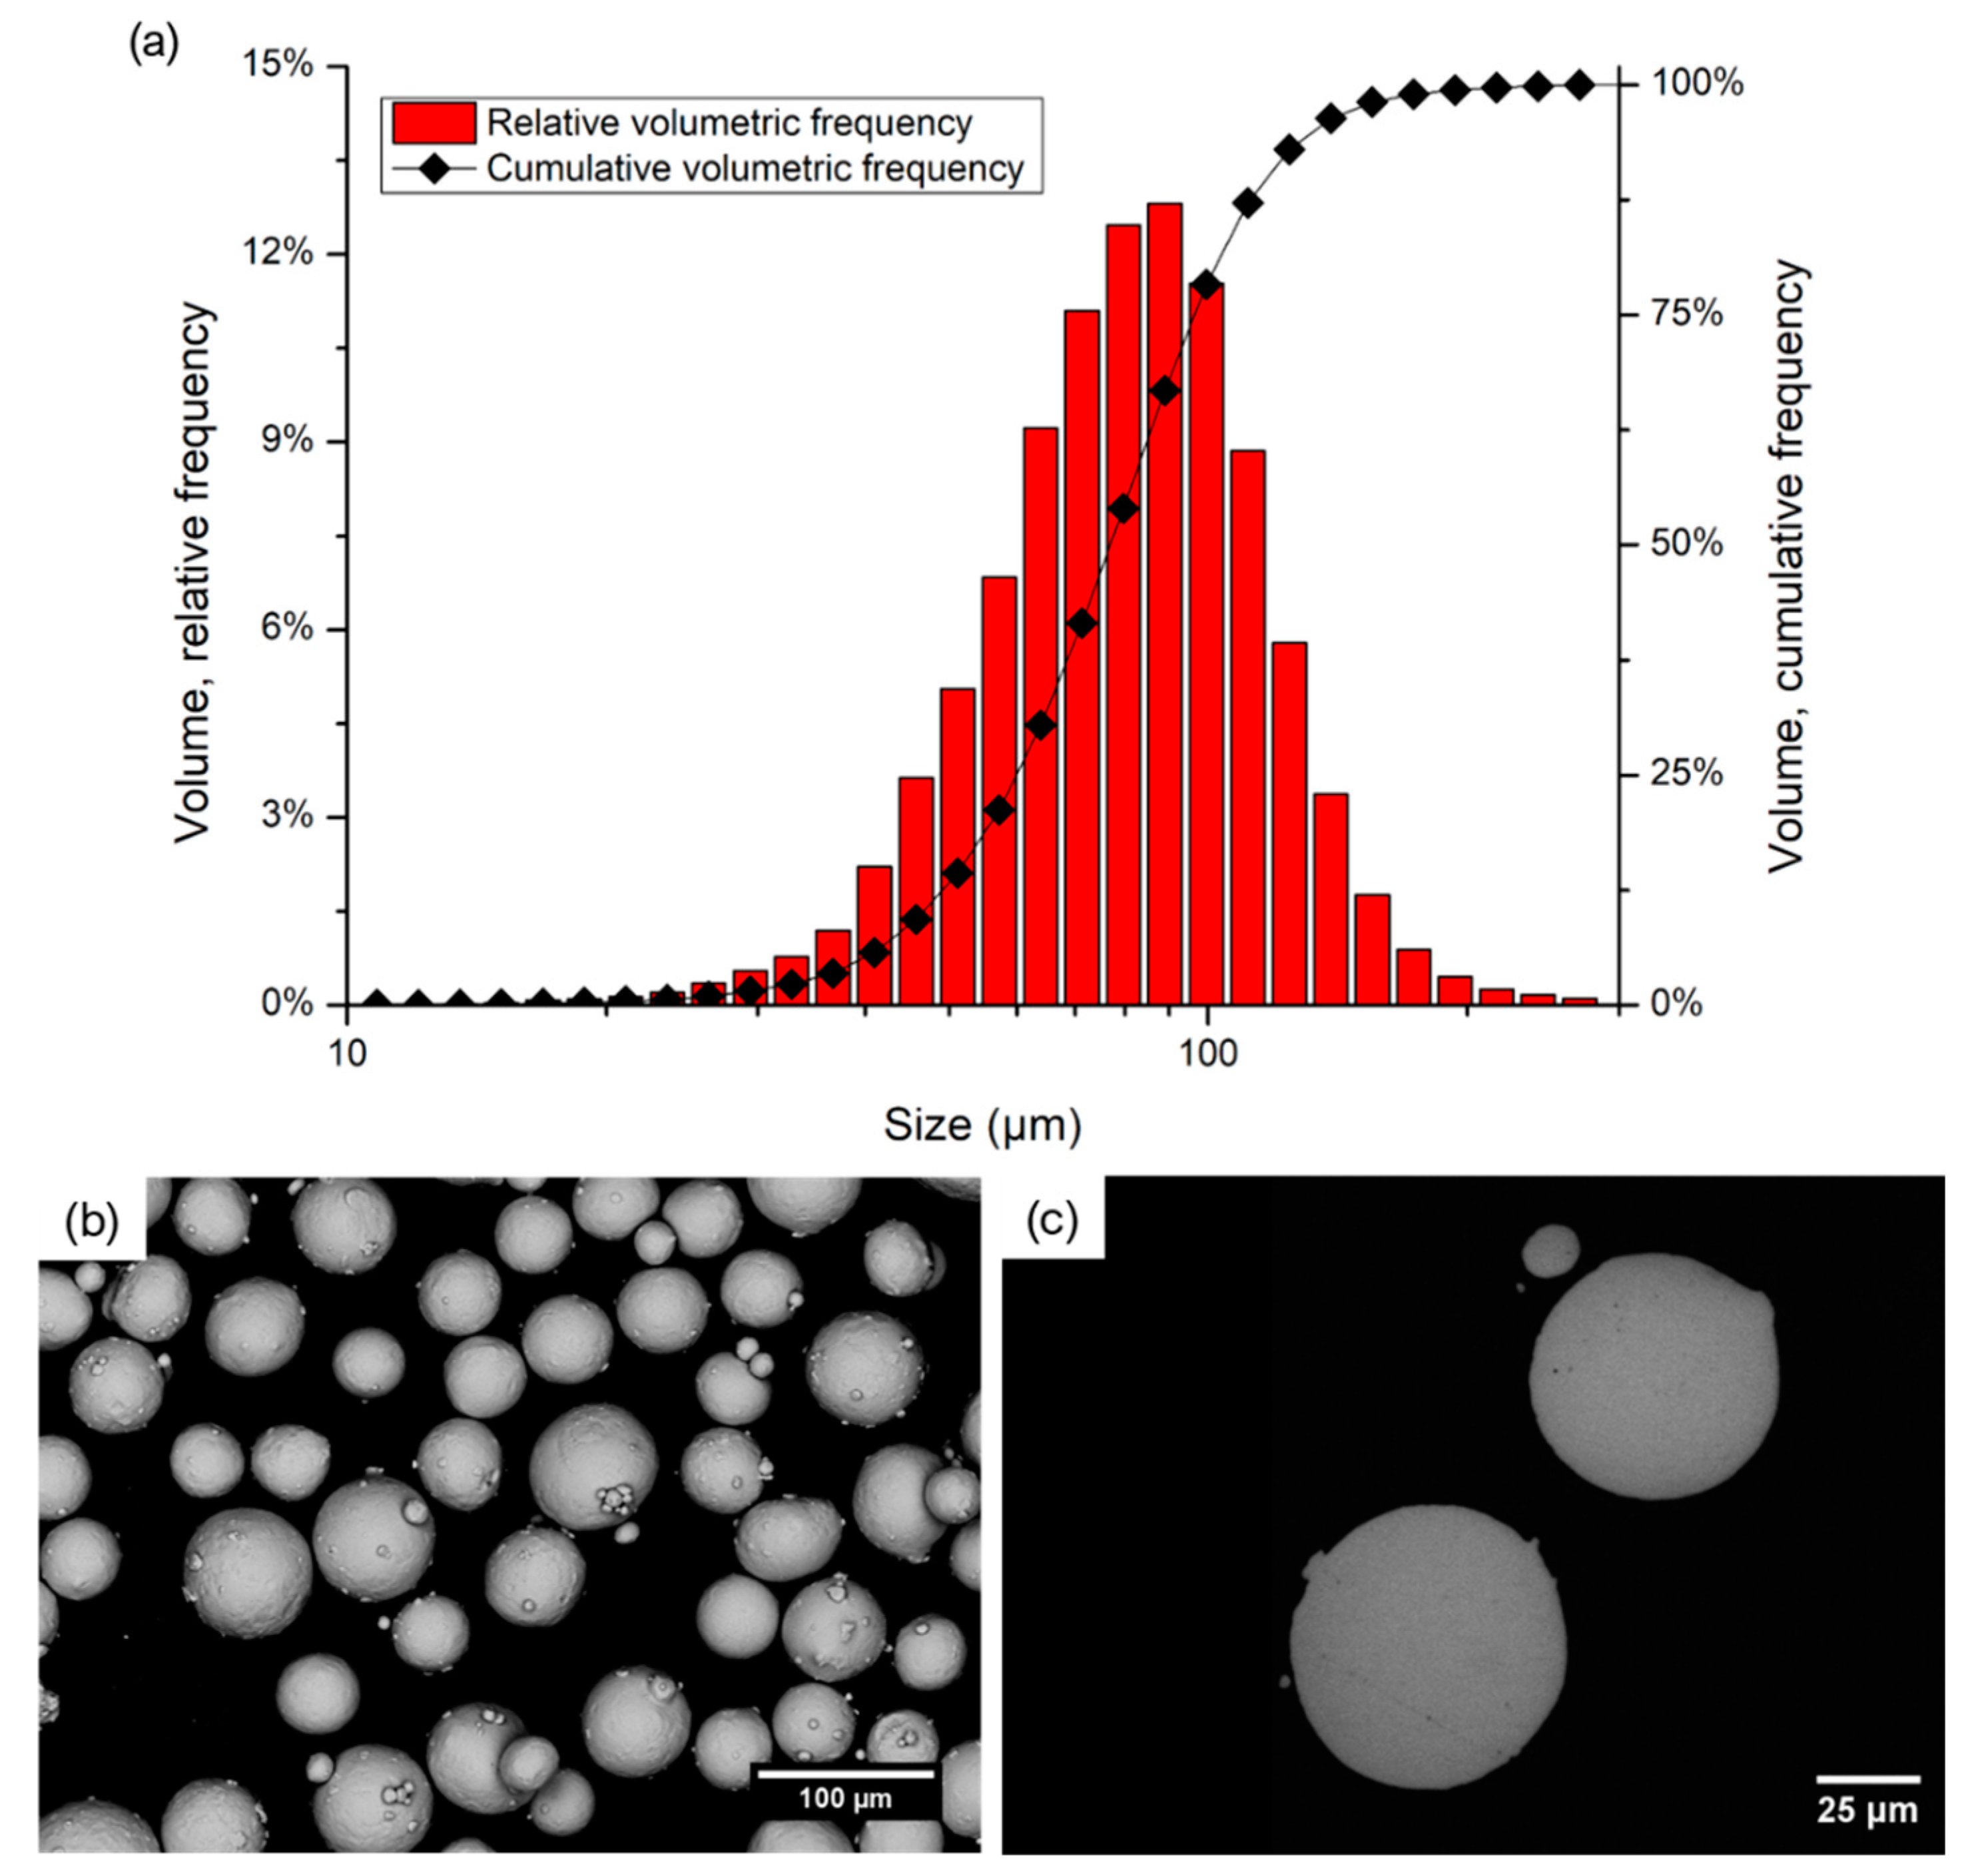
Figure 1. Particle size distribution of the Ti-6Al-4V ELI powder used for deposition (a), SEM image of the powder (b) and cross-section of the particles (c).
Applsci 10 04212 g001
Figure 2. Optical micrographs of samples built in conditions: protective argon flow (ArS) (a,b), sealed environment using a non-preheated platform (SE-CB) (c,d) and sealed environment using a preheated platform (SE-HB) (e,f).
Applsci 10 04212 g002
Figure 3. XRD patterns for all the deposition conditions considered.
Applsci 10 04212 g003
Figure 4. c/a ratio and cell volume for all the conditions considered.
Applsci 10 04212 g004
Figure 5. Oxygen and nitrogen concentration evaluated for the samples built in all the considered environment and relative [O]EQ evaluation. The 0.22% threshold is highlighted in red.
Applsci 10 04212 g005
Figure 6. Prior-β grain average width and relative linear interpolation for all conditions plotted as a function of Z.
Applsci 10 04212 g006
Figure 7. Martensite width relative and cumulative frequency distribution for all the deposition conditions considered.
Applsci 10 04212 g007
Figure 8. Micro-Vickers hardness with relative linear interpolation for all conditions plotted as a function of Z (a) and relative Hall-Petch plot (b).
Applsci 10 04212 g008
Figure 9. Horizontal bars built using shielding gas. Top (a,b), side (c) view and cross-section (d).
Applsci 10 04212 g009
Figure 10. Horizontal bars built in a sealed chamber and using a preheated platform. Top view (a) and cross-section (b). Similar results were obtained using a non-preheated platform.
Applsci 10 04212 g010
Table 1. Set of building parameters used to build the cubic Ti-6Al-4V samples.
Power
(W)
Scan Speed
(mm/min)
Powder Feed Rate
(g/s)
Hatching Distance
(mm)
Z-Step
(µm)
Scanning Strategy
3007000.0170.581000°/90°