Article

Industry-Friendly Hydroethanolic Extraction Protocols for Grateloupia turuturu UV-Shielding and Antioxidant Compounds

MARE—Marine and Environmental Sciences Centre, ESTM, Instituto Politécnico de Leiria, 2520-641 Peniche, Portugal
*
Author to whom correspondence should be addressed.
Appl. Sci. 2020, 10(15), 5304; https://doi.org/10.3390/app10155304
Submission received: 26 June 2020 / Revised: 16 July 2020 / Accepted: 29 July 2020 / Published: 31 July 2020
(This article belongs to the Special Issue Marine Resources Application Potential for Biotechnological Purposes)

Abstract

:

Featured Application

To develop industry-friendly extraction methodologies to obtain bioactive extracts of Grateloupia turuturu for the cosmeceutical industry.

Abstract

Grateloupia turuturu is an invasive macroalga on the Iberian coast, known to produce bioactive compounds with different cosmeceutical bioactivities, namely UV shielding and antioxidants. The goal of this study was to optimize the extraction procedure of main bioactivities of this species with cosmetic potential, using Response Surface Methodology. Two Box–Behnken designs were used to evaluate the effect of ethanol concentration (0–50%), liquid-solid ratio, time, pH, and temperature on yield, UV absorbance, and antioxidant activity. Both optimizations showed a similar trend: aqueous extracts have higher yields and extracts performed with ethanol as part of the solvent have higher activities concerning UV absorbance and antioxidant activity. For all the extracts an absorption peak between 320 and 340 nm was observed. This data now allows further studies by narrowing the extracts worthful of characterization. The development of industry-friendly extraction methods allows the valorization of this invasive species, contributing for the potential creation of natural and eco-friendly products by the cosmetic industry while contributing to the restoration of affected environments.

1. Introduction

The use of marine organisms for the exploitation of bioactive compounds has recently increased due to their biotechnological potential in different areas as pharmaceutical, cosmetic/cosmeceutical, food/feed, and many others [1,2]. Within this group, macroalgae are known to be great producers of bioactive compounds [2], with growth rates that ensure biomass availability from harvesting and aquaculture.
Grateloupia turuturu is an edible red macroalga native from Korea and Japan that has been classified as invasive species in the Atlantic Ocean, and was first reported in Portugal in 1997 [3]. This seaweed is characterized as rich in carbohydrates and proteins, as well as having a low lipid content [4]. It is present in “mid-intertidal” areas and is easily found in intertidal pools [5], where the exposure to solar radiation and oxidative stress levels are high [5]. The ability to protect themselves against harmful radiation make these organisms potential sources for the discovery of compounds with antioxidants and UV shielding activities [4,6]. Moreover, it has product development potential in the cosmetics industry.
For a successful screening of such compounds and to ensure the industrial feasibility of their application, an adequate method of extraction should be developed [7]. Although more recent and effective methods have been developed (the novel extraction methodologies, characterized by more technological approaches resulting in better performance and lower environmental impact), the utilization of solid-liquid extraction (SLE) is still one of the best solutions for the production of extracts with the intent of industrialization, given the low technical and facility requirements for its up-scale implementation. However, SLE can be fine-tuned to perform better (be more efficient, selective, eco-friendly, and profitable) by optimizing several operational parameters: physicochemical properties of the raw material, the selected solvents/respective concentrations, pH, temperature, extraction time, and others [8]. A balance between the time of extraction and the temperature is extremely important to avoid thermal degradation. Room temperature can be an advantage, as it preserves compounds and reduces the associated economic costs of the procedure [7]. Regarding the type of solvent, water-based extractions are privileged and ethanol and acetone are the most accepted organic solvents considering their security and cost [9]. Solvent selection depends not only on their inherent safety and cost but also on the cost associated to their evaporation, and ability to extract target compounds. For all these reasons, binary mixtures of water and ethanol are popular in the natural extract production for industry. Specifically, in the case of G. turuturu, hydroethanolic extraction is the most biotechnologically relevant since this is the best solvent to recover this species’ main bioactivities: sulphated galactans (known antioxidant, anticoagulant, and antimicrobial activities [10]), phycobiliproteins (PBPs), and mycosporine-like amino acids (MAAs) (with antioxidant activity and very high UV-shielding activity [4,10]).
The optimization of the extraction parameters for the obtention of compounds groups described above using a one-dimensional method, where only one factor is modified at a time, is not only time-consuming but more expensive [11]. Using the response surface methodology (RSM), it is possible to avoid these difficulties, since this statistical method allows for the simultaneous evaluation of different variables (enabling the detection of potential interactions between the tested conditions), reducing the high number of experiments, and, consequently, the quantity of reagents used and the time associated to the process [12].
Thus, the main goal of this study was to optimize the extraction process of bioactivities as measured by antioxidants and UV-shielding from the red macroalga Grateloupia turuturu, with the potential for use in the cosmetic industry. Reponses surface methodology was used to characterize the effects of ethanol percentage in the extraction solvent, time of extraction, liquid-to-solid ratio, temperature, and pH in these bioactivities. This promoted the added value to the species through the potential creation of natural and eco-friendly products in the cosmetics field, while contributing for the restoration of the natural environments, following a circular economy approach.

2. Materials and Methods

2.1. Seaweed Collection

Grateloupia turuturu was collected at Aguda beach in Arcozelo, Portugal (41.054826, −8.656865). The collected biomass was cleaned and sorted for epibionts, dried in a wind tunnel at 25 °C, milled to flour-like powder (particle size 150 ± 50 µm), and vacuum stored at room temperature, in the dark, until further use.

2.2. Response Surface Methodology: Box–Behnken Design

An RSM with a Box–Behnken design was performed to determine the influence of three independent parameters in the hydro-ethanolic extracts: liquid-solid ratio (mL·g−1) (LSR), time of extraction (min), and ethanol percentage, as established below (Table 1).
A second assay was designed to assess the influence of the extraction temperature (°C), pH, and ethanol percentage (v/v) (Table 2). In this case, the LSR and extraction time were defined according to results obtained from the first optimization assay (time of extraction of 60 min and LSR of 40 mL·g−1).
Extracts of Grateloupia turuturu were obtained by mixing 5.0 g of the seaweed biomass with the assigned volume of the assigned solvent, for the assigned time under constant magnetic stirring and thermostatized. After the extraction procedure, each extract was centrifuged (10,000× g for 5 min) and the supernatant filtered at low pressure (Whatmann n°1) and stored at 4 °C until further processing (maximum 24 h). The extracts were then evaporated under reduced pressure at 40 °C and desiccated under a vacuum concentrator at room temperature (Vacufuge, Eppendorf, Germany). Dry extracts were weighed and yield was calculated (g extract·g−1 biomass).
Each extract was then resuspended for further assaying their UV-absorbance and antioxidant activities. Water extracts were resuspended in water at 25 mg·mL−1; 25% (v/v) ethanol extracts were resuspended in 25% (v/v) DMSO in water at 50 mg·mL−1; 50% (v/v) ethanol extracts were resuspended in 50% (v/v) DMSO in water at 100 mg·mL−1.

2.3. UV Absorbance Spectra

For the UV absorption spectrum, 200 μL of each extract at 0.1 mg·mL−1 was added to a 96-well microplate suitable for UV readings (n = 4; Greiner UV-Star®, Greiner Bio-one, Kremsmünster, Austria) as well as the respective blanks, following the methodology of Maciel et al. [13]. The absorbance was read between the wavelengths of 280 nm and 400 nm (Biotek® Synergy H1, Winooski, VT, USA). The integral of the absorbance (Abs) between these wavelengths was computed and used to calculate a massic extinction coefficient (ε, in mL·cm−1·g−1 extract), using the liquid height in each well (l, in cm) and mass concentration of the extracts (C, in mg·mL−1) for each extract according to the formula:
ε = 280 400 A b s l C

2.4. Antioxidant Activity

The antioxidant activity was measured with the oxygen radical absorbance capacity (ORAC) assay, according to Dávalos and colleagues [14]. For the preparation of the standard curve, a Trolox stock solution, diluted in 75 mM phosphate buffer (VWR®, Radnor, PA, USA), pH 7.4, was used to prepare the dilutions from 8 µM to 0.5 µM. The obtained extracts were tested at 1 mg·mL−1 (diluted in 75 mM phosphate buffer). A fluorescein solution at 70 nM was used and the AAPH reagent (Sigma®, Darmstadt, Germany) was prepared fresh at a final concentration of 12 mM. A total of 20 μL of each sample were placed in a 96-well black microplate (Greiner®, Kremsmünster, Austria) and 120 μL of a fluorescein solution (70nM) (Sigma®, Darmstadt, Germany) was added to all samples, including the standard curve. For blanks, 120 μL of 75 mM phosphate buffer was added instead of fluorescein. The plate was then incubated inside the microplate reader (Biotek® Synergy H1, Winooski, VT, USA) at 37 °C and the fluorescence was read for 15 min with 1 min interval at an excitation wavelength of 485 nm, and an emission wavelength of 525 nm. After the incubation period, 60 μL of pre-warmed (37 °C) AAPH (2,2′-Azobis(2-methylpropionamidine) dihydrochloride) reagent (Sigma®, Darmstadt, Germany) was added. The fluorescence was read for 80 min with 1 min intervals. Data was treated and results were expressed as μmol of Trolox equivalents per gram of extract (μmol TE·g-1 ext).

2.5. Data Treatment

The values of antioxidant activity and of UV-absorbance were studied both as specific activity (activity per mass unit of extract) and total activity (activity per unit of seaweed extracted), the latter calculated by multiplying the values of the respective activities by the yield of extract. The results from the two Box–Behnken were organized in a table containing 30 experimental runs (the 30 extracts), for which the value of each of the five variables under study (percentage of ethanol, LSR, time, temperature, and pH), and the value for each of the five parameters determined (yield, specific and total antioxidant activity, and specific and total UV-absorbance) was available.
For each Box–Behnken experiment, five response surface models were computed by multiple linear regression. For that, R statistical language was used, along with RStudio, and packages ‘rsm’ and ‘viridis’ [15,16,17,18]. The basis for model development was a quadratic multiple linear regression containing all three variables, but no interactions, followed by a manual stepwise, backwards-forward-backwards regression fitting. Then, the model was manually refined by considering the p-value of the estimates β, the p-value of the model and both the R-squared and the adjusted R-squared of the model. Individual factors with a p-value greater than 0.1 were always excluded and individual factors with a p-value between 0.05 and 0.1 were excluded whenever their removal from the model resulted in an approximation of the adjusted R-squared to the R-squared. Then, linear binary interactions of the variables were added iteratively to sporadically improve the model’s fit, because ethanol percentages introduced a chemical variability that could cause drastic shifts in the parameters, quadratic binary interactions, and cubic variables. We attempted to maintain the degrees of freedom above 8 and keep residue distribution random via visual inspection of the fit-real plot. The equations and goodness-of-fit statistical parameters (residual standard error, multiple R-squared, adjusted R-squared, p-value, and degrees of freedom) are reported in the manuscript alongside the contour plots for each of the five models at three slices of ethanol percentage. The fit-real plots (Figure S1), as well as the individual p-values of the estimates (Figure S2), and the complete dataset are included in the Supplementary Material.

3. Results

Response surface methodology was used to characterize the effects of LSR, time of extraction, and ethanol percentage in the solvent on the bioactivities recovered from G. turuturu biomass using a Box–Behnken design of experiment. Moreover, a second experiment using LSR and time values allowed the characterization of temperature and pH effects on different hydroethanolic extractions. Both optimizations showed a similar trend: aqueous extracts have higher yields and extracts performed with ethanol as part of the solvent have higher activities concerning the UV absorbance and antioxidant activity. For all the extracts, an absorption peak between 320 and 340 nm was observed.

3.1. First Optimization

The models of the effects of ethanol concentration (X1), LSR (X2), and time of extraction (X3) are presented in Figure 1, Figure 2, Figure 3, Figure 4 and Figure 5. Concerning the yield of these extracts (Figure 1), the aqueous extractions varied between 0.25 and 0.5 g extract·g−1 biomass with an almost linear increase with an increasing LSR for all times. For extracts with 50% ethanol (v/v), yield varied from 0.2 and 0.25 g extract·g−1 biomass with maximums at either central time and maximum LSR, or minimum LSR at either of the time extremes. For intermediate ethanol percentages, the yield varied between 0.2 and 0.38 g extract·g−1 biomass, increasing when LSR increased.
Regarding UV absorbance per gram of extract (Figure 2), for the aqueous extractions, it varied between 50,000 and 70,000 mL·cm−1·g−1 extract, reaching its maximum with lower LSR and central time of extraction, decreasing with increasing LSR and extreme times of extraction. In the presence of 50% ethanol (v/v), higher UV absorbance values were obtained, increasing with higher times of extraction and LSR, while the intermediate percentage of ethanol showed higher values when high LSR and low time of extraction are combined. Globally, the results showed that increasing concentrations of ethanol favor the UV absorbance of extracts.
The total UV absorbance per gram of biomass (Figure 3), showed higher values in aqueous extractions and hydroethanolic extractions with 50% ethanol (v/v), reaching the maximum value of 2,800,000 mL·cm−1·g−1 biomass. For aqueous extractions, the minimum was reached with low LSR and low time of extraction and maximum with higher LSR and a central time of extraction. The hydroethanolic extractions followed a similar tendency.
Considering the antioxidant activity per gram of extract (Figure 4), an increase was verified when ethanol percentages increased, varying from 20 to 70 µmol TE·g−1 extract in aqueous extractions, and between 120 and 170 µmol TE·g−1 extract in hydroethanolic extractions with 50% ethanol (v/v). LSR did not influence antioxidant activity in aqueous extractions when combined with higher time of extraction, where the maximum activity is recovered. On the contrary, in the presence of 50% ethanol (v/v), higher time of extraction and lower LSR generated the highest values. For intermediate percentages of ethanol, maximum values were found in the presence of higher time of extraction and minimum LSR, and with higher LSR and lower extraction time.
The total ORAC activity per gram of biomass (Figure 5) maximized hydroethanolic extractions with 50% of ethanol (v/v), followed by aqueous extractions. For water-based extractions, the maximum experimental value (3000 µmol TE·g−1 biomass) was reached in the presence of high LSR, independent of extraction time, showing a lower LSR and a lower time the minimum value found, while for 50% ethanol (v/v), the antioxidant activity is maximized in the presence of higher extraction times and lower LSR.
The overall analysis of the models led to the decision to fix the LSR at 40 mL·g−1 and time of extraction at 60 min in the second Box–Behnken design.

3.2. Second Optimization

From the second round of extractions that included the variables ethanol concentration (%) (X1), temperature (°C) (X2), and pH (X3), the same models described above were attained (Figure 6, Figure 7, Figure 8, Figure 9 and Figure 10). Globally, yield of cold extraction followed the same trend as before (lower values with more ethanol) and that of hot extraction was almost constant across ethanol concentrations. Yield (Figure 6) had maximum values in hydroethanolic extractions using 50% ethanol (v/v) for central temperatures, close to 60 °C and acidic pH. For aqueous extractions and extractions with 25% ethanol, the minimum obtained was 0.4 g extract·g−1 biomass and the maximum 0.6 g extract·g−1 biomass. However, a basic pH and high temperature were necessary to reach the maximum value in aqueous extractions, while for hydroethanolic extractions with 25% ethanol (v/v) the maximum was reached with lower temperatures and acidic pH.
Concerning the UV absorbance per gram of extract (Figure 7), an increase of the values with increasing percentages of ethanol was achieved, being the maximum value of aqueous extractions 38,000 mL·cm−1·g−1 extract, for 25% ethanol (v/v) 40,000 mL·cm−1·g−1 extract and 50% ethanol (v/v) 80,000 mL·cm−1·g−1 extract. Using the temperature of 25 °C for water-based extractions, the maximum was reached regardless of pH. For the highest percentage of ethanol, the maximum values were attained with basic pH and lower temperatures.
The total UV absorbance per gram of biomass (Figure 8) also increased with increasing percentages of ethanol, reaching the maximum value of 3,000,000 mL·cm−1·g−1 biomass for the extractions with 50% ethanol (v/v). The aqueous extractions and the hydroethanolic extractions showed a similar profile, reaching the maximum values with acidic pH and lower temperatures.
Regarding the antioxidant activity per gram of extract (Figure 9), a slight increase of function values were found for the extractions, with 50% ethanol (v/v) (maximum of 95 µmol TE·g−1 extract and minimum of 60 µmol TE·g−1 extract) when compared with water-based extractions (maximum of 70 µmol TE·g−1 extract and minimum of 20 µmol TE·g−1 extract). For aqueous extractions, the conditions to obtain the maximum values are basic pH and higher temperatures (between 60 °C and 95°C) and for 50% ethanol (v/v) basic pH and temperatures at either of the extremes. For the hydroethanolic extractions with 25% ethanol (v/v), the higher the temperature and the pH, the higher antioxidant activity could be recovered.
The total ORAC activity per gram of biomass (Figure 10) showed to benefit from aqueous extractions, reaching the highest values between the tested conditions, using basic pH and high temperatures during the extraction procedure. For the hydroethanolic extractions, the highest values were obtained with the same conditions as for the aqueous extraction, but a skewed profile developed with a second relative maximum with acidic extractions at 25 °C.

4. Discussion

Global seaweed utilization is growing worldwide in response to the increasing demand for natural and functional ingredients [19]. Optimizations of seaweed extractions and high-throughput screening assays may contribute to find alternatives to the chemical industry, facing several challenges and limitations. In this study, crude extracts from G. turuturu produced by hydroethanolic SLE were optimized regarding extraction time, LSR, concentration of ethanol in water, solvent pH, and extraction temperature, using two RSM analysis with Box–Behnken designs [20].
Regarding the variable temperature, the requirements and cost for energy and equipment are lower at room temperature when compared with extraction at high temperatures. Working with neutral or natural solvent pH also excludes the need for additional resources to modify this variable, or for the maintenance of pH-related equipment deterioration. Likewise, lower LSR and extraction time are privileged conditions concerning cost effectiveness and environmental impact. Regarding ethanol percentage, due to the ease to evaporate and reuse it when compared to water, a balance between the increased cost of the solvent and the decreased cost of operation needs to be addressed. However, the availability and low toxicity of this solvent makes it readily accepted by the industry. Ethanol is also suitable for the use in cosmetics; it is sometimes even used as an ingredient. A balance between yield and specific activity of the extract (activity per mass unit) must be accounted when optimizing an extraction, since high yields and high specific activity are often inversely related and a maximum recovery of functional bioactivities can be found at intermediate values. Hence, biological activities coupled with good yields can supply good amounts of a final product. Nonetheless, lower yields with much higher activity, despite seemingly detrimental for the reduced quantity of extracts, may provide mixtures of compounds with less chemical complexity, turning the purification processes used for fine chemistry industries (such as cosmeceutical and pharmaceutical) cheaper or allow their incorporation in formulas at low rates, achieving the intended activity without compromising product safety. For these reasons, a comprehensive modelling of both yield and activities with extraction parameters is a dataset of paramount importance for the technology transfer of bioactive extracts from academy to industry.
The obtained extracts were used to evaluate antioxidant and UV-absorbing capacities, which are important features in the cosmeceutical industry. Grateloupia-specific SLE assumptions were made based on the literature: (1) dry biomass is mostly composed, in terms of massic contribution, of polysaccharides and proteins, which are almost exclusively soluble in water [21,22,23,24]; (2) polysaccharides are mostly agaran-carragenan hybrids (sulphated galactans) and thus have solubility/extractability highly conditioned by extraction variables such as time, LSR, temperature, and pH [22,23,25,26,27,28,29,30]; (3) mycosporine-like amino acids can be extracted with all the solvents used (water, ethanol 25%, and 50% (v/v)), possibly varying the relative content in each MAA with the solvent [27,31,32]; (4) proteins and MAAs are the main compounds responsible for UV-absorbance [4,27]; (5) ethanol inclusion in the solvent allows the recovery of compounds from highly polar (e.g., phenolic compounds) to medium polarity (carotenoids, sterols, fatty alcohols, etc.), all of which might contribute to antioxidant activity [33,34]; and (6) polysaccharides exhibit antioxidant activity, despite being below ethanol-extracted polar metabolites [22,35].
Three “slices” of cubic data at ethanol percentages 0, 25, and 50 were chosen to be represented as 2D contour plots (Figure 1, Figure 2, Figure 3, Figure 4, Figure 5, Figure 6, Figure 7, Figure 8, Figure 9 and Figure 10). Ethanol was chosen to be the variable seen in slices because the effects found were not expected to lead to smooth, gradual changes in the parameters, as ethanol inclusion in the solvent leads to compositional changes that are more drastic than the variation of physicochemical parameters. Thus, despite being successfully modelled, ethanol effect will be discussed mostly as the difference between 0, 25, and 50% (v/v), discretely.
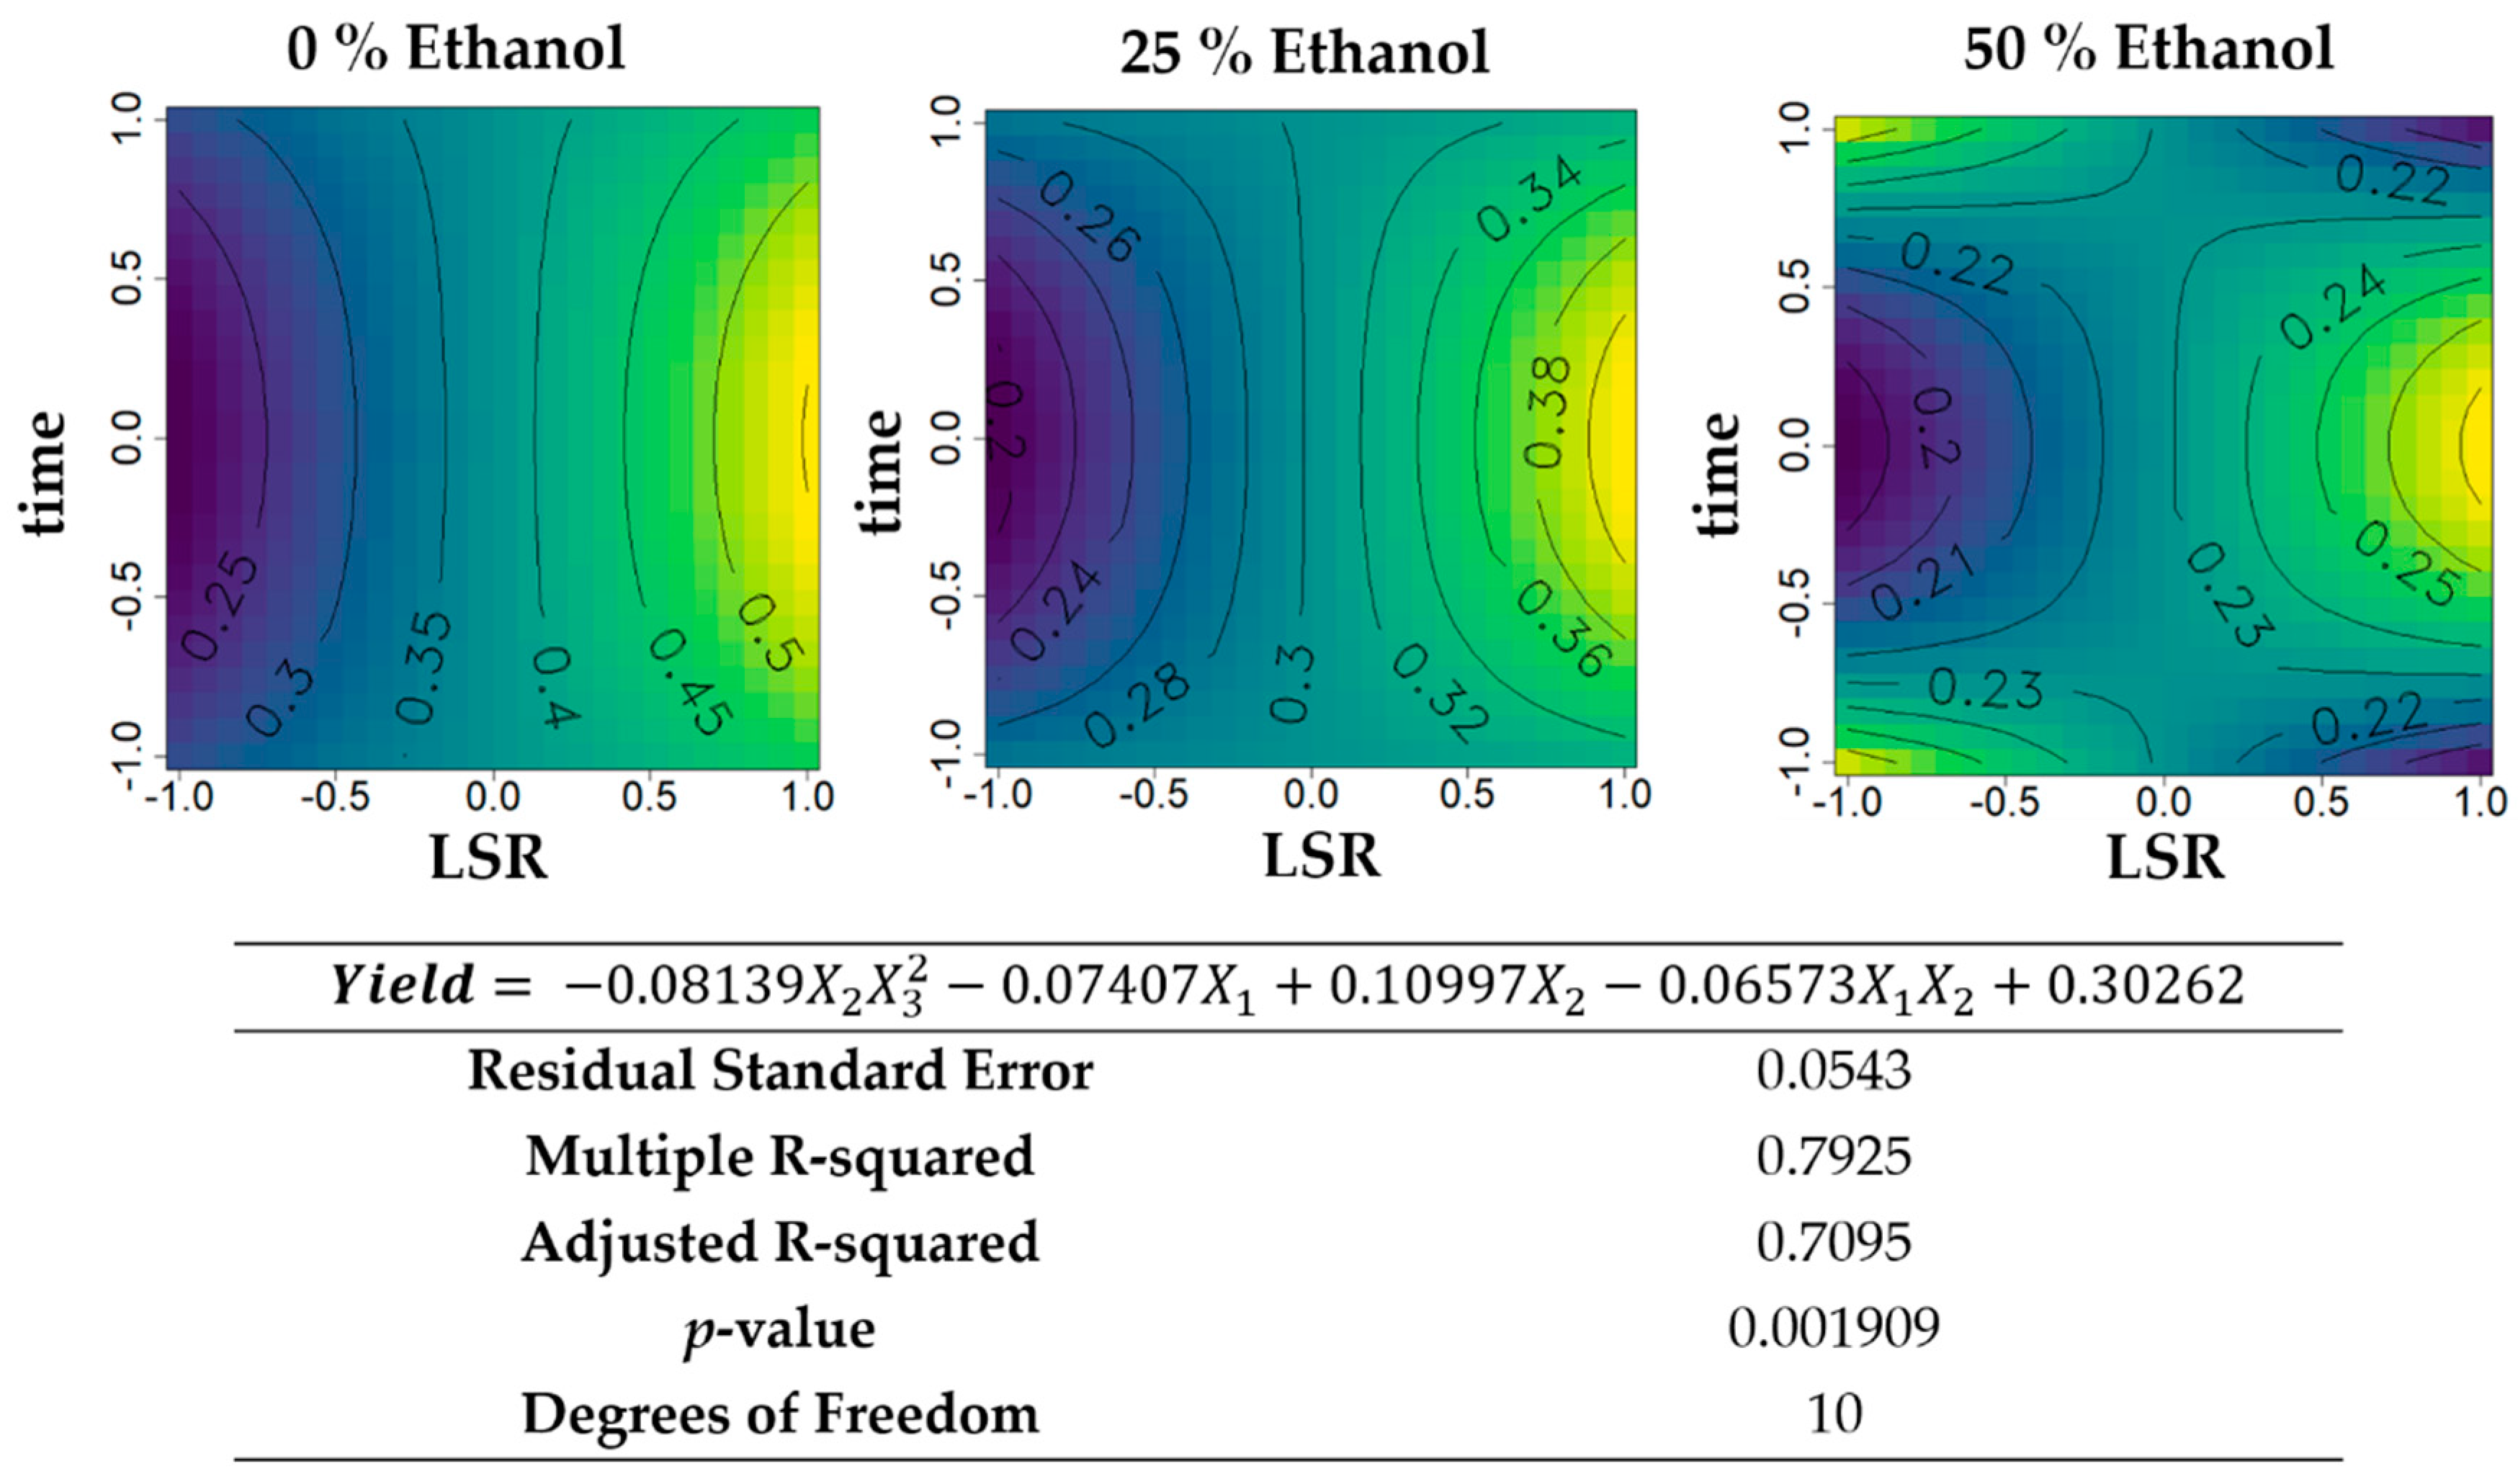
The first optimization addressed the effect of LSR, time, and ethanol percentage on the extraction of antioxidant and UV-absorbing molecules (Figure 1, Figure 2, Figure 3, Figure 4 and Figure 5). Typically, LSR affects an extraction quadratically, having an optimal value, which decreases bilaterally [8,36]. Concerning time, it is usual to observe a steep increase in yield and other parameters of the extraction initially, approaching a plateau as time increases further, or a peak followed by decrease, in the case of sensitive bioactivities or low-solubility compounds abundance [36]. Ethanol inclusion, in the case of seaweeds, in which biomass extractives are mostly composed of polysaccharides and proteins, is expected to decrease yield and impact bioactivities differentially. In the case of G. turuturu, in this work, most of these trends were confirmed, with some exceptions.
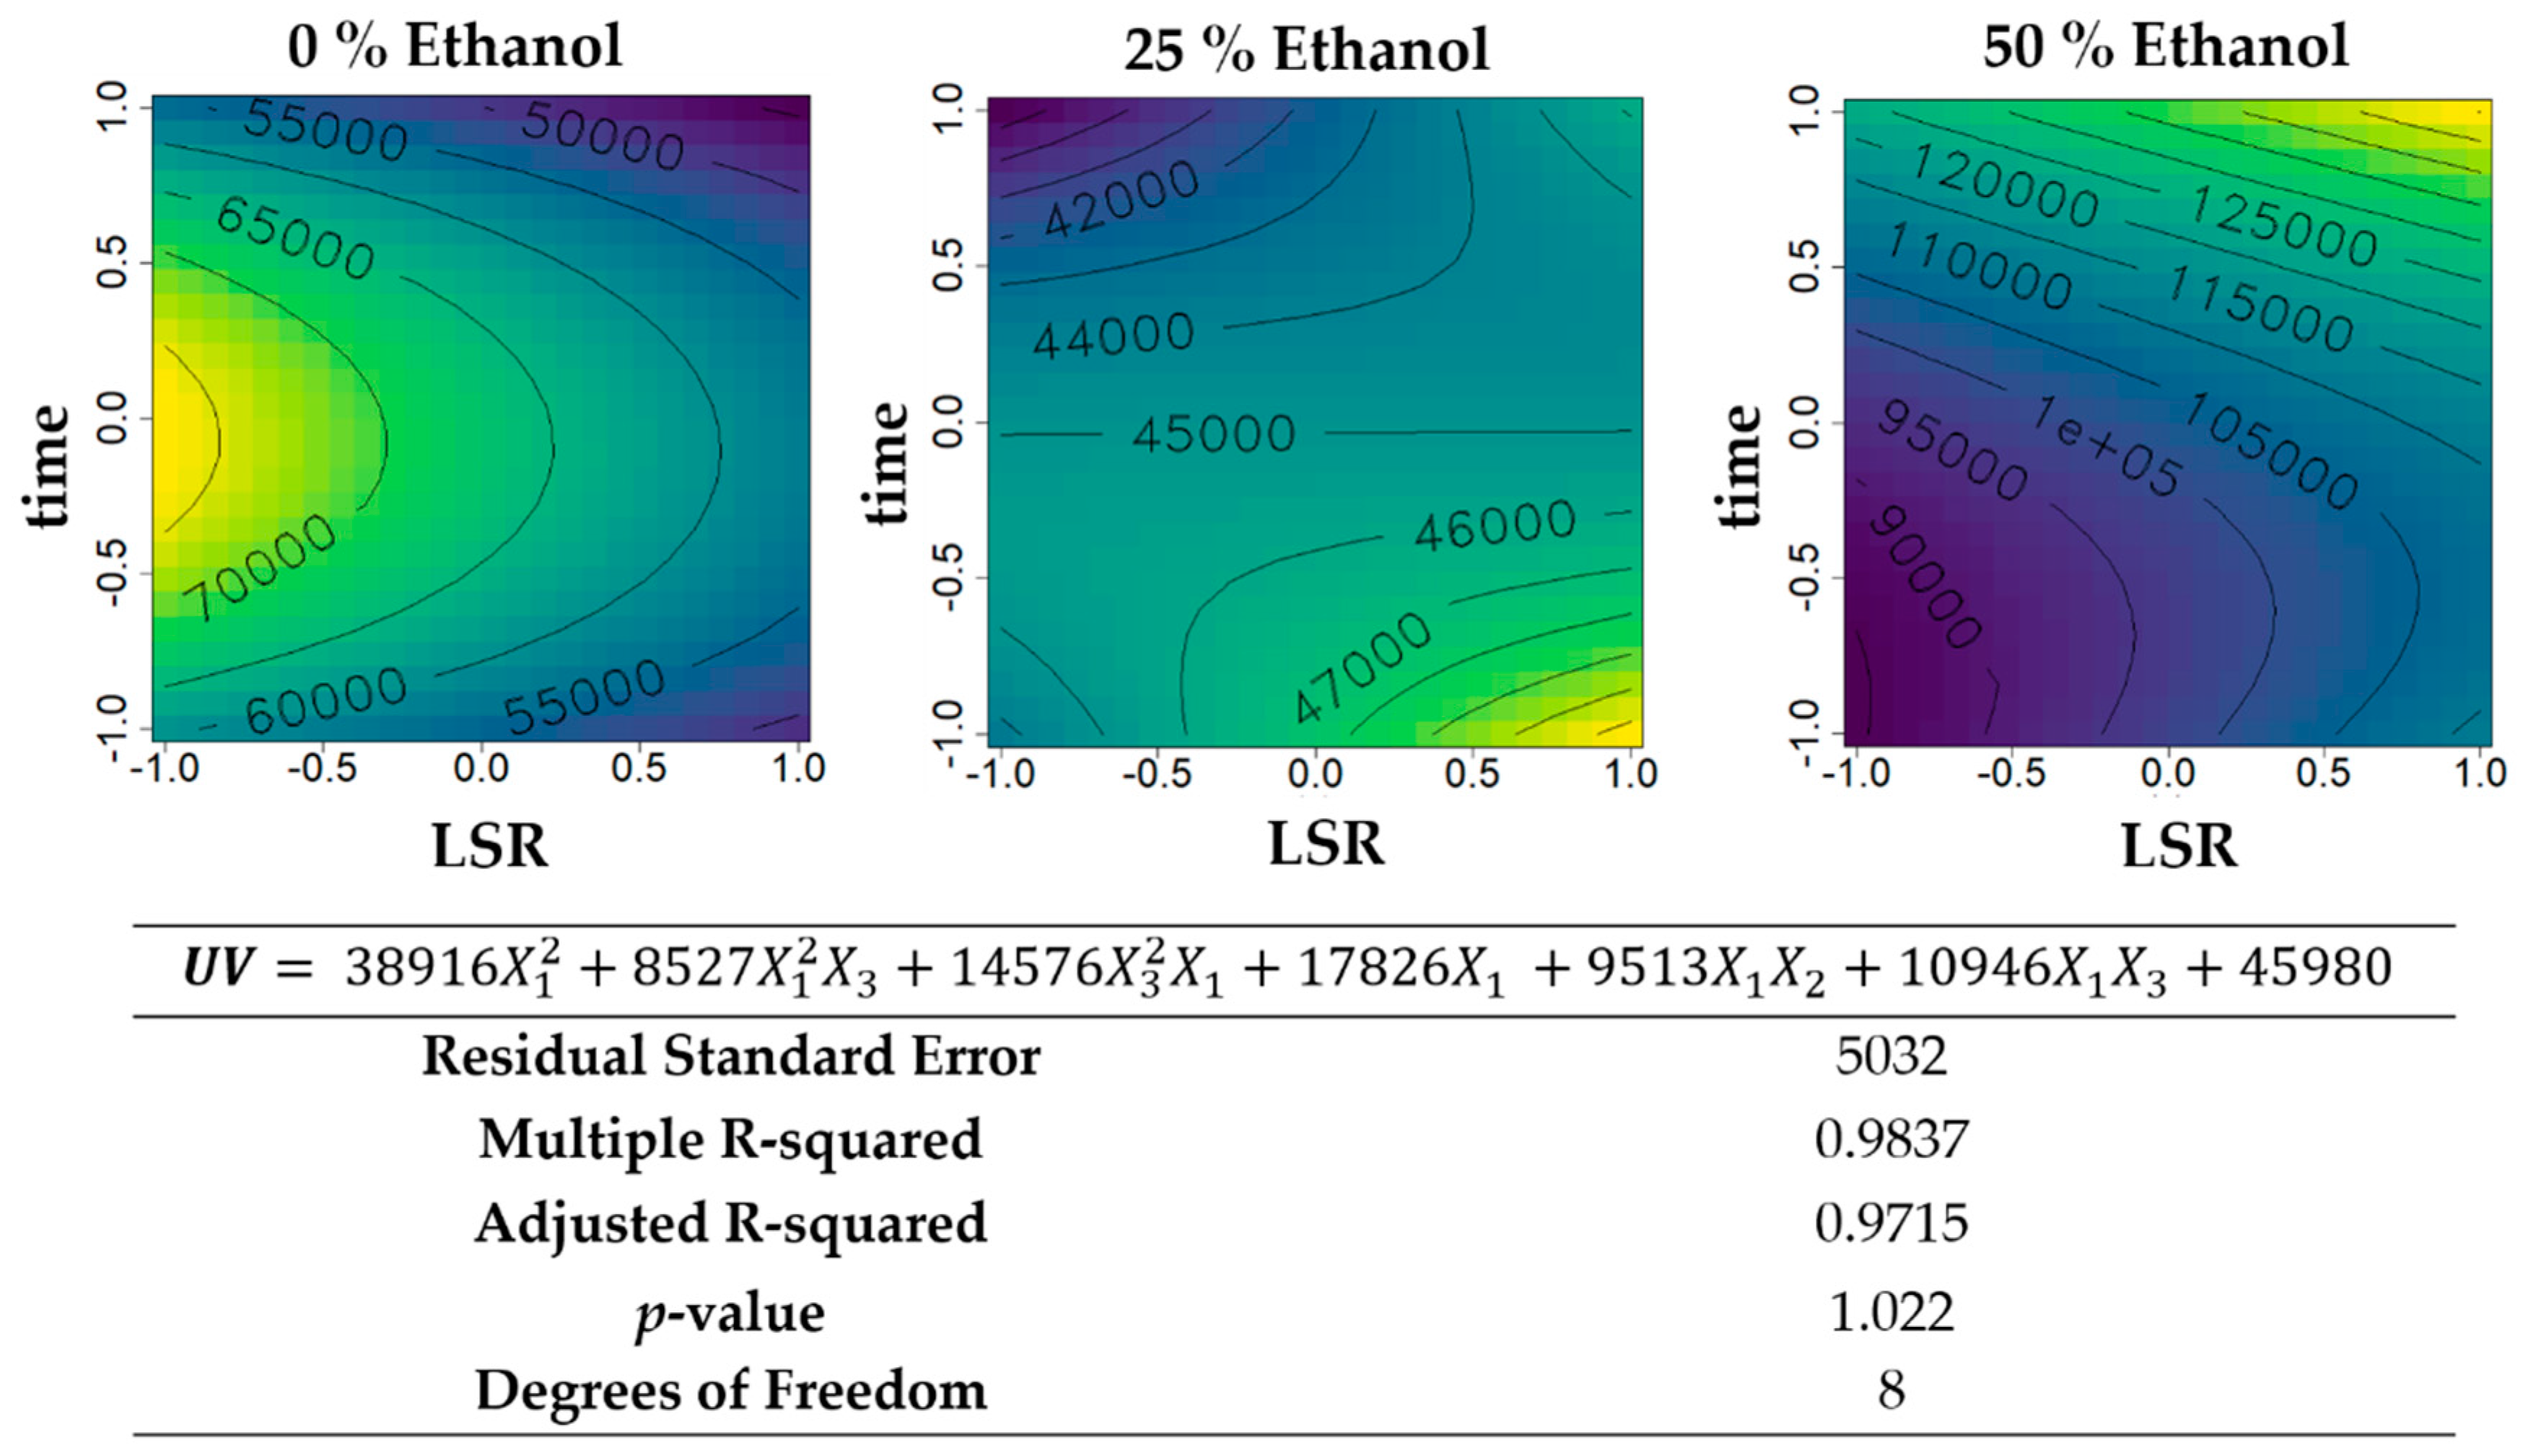
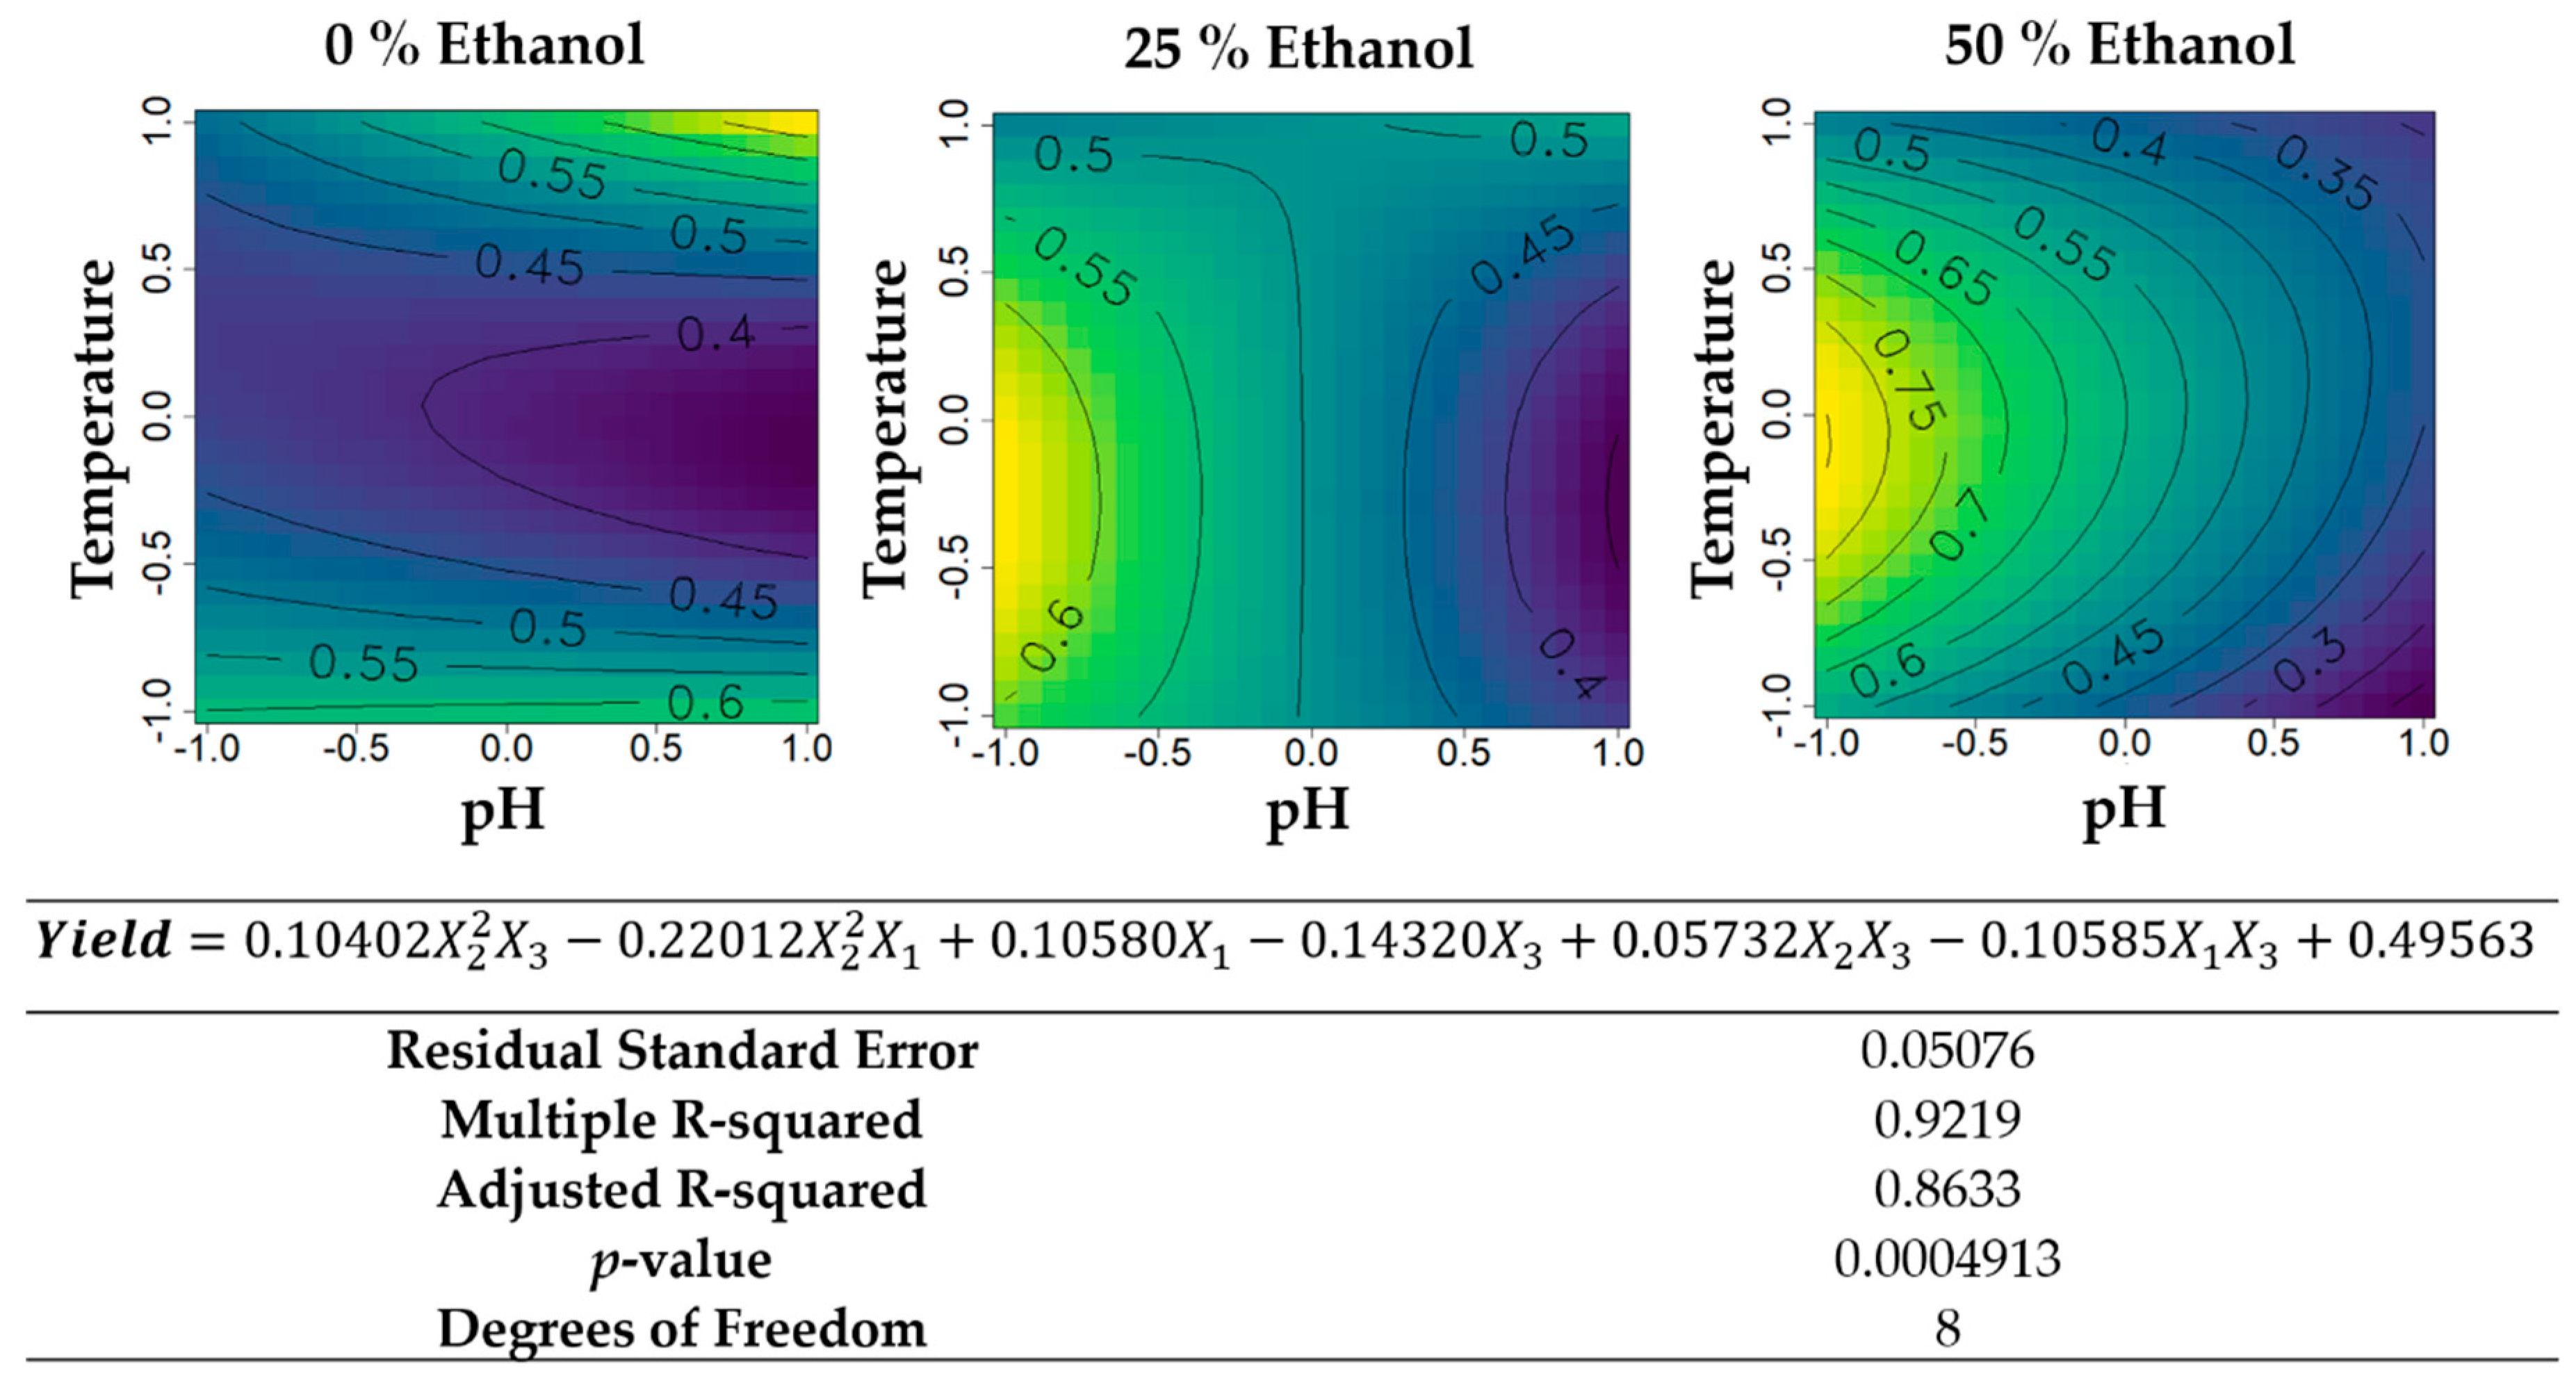
Yield of G. turuturu hydroethanolic extractions (Figure 1) reached its maximum at 0% ethanol (water extraction), which was expected since water is capable of extracting the sulphated galactans of G. turuturu, and ethanol decreases solubility [25,26]. Moreover, water extracted the protein fraction from the biomass, which also had a significant massic contribution in its composition, where compounds (i.e., phycoerythrin) were present [4]. The effect pattern for LSR and time was maintained through different ethanol values; for the most part (the central range of values of time and LSR), yield increased linearly with LSR and time had almost no effect on extraction. Naturally, higher LSRs tended to favor the extraction of soluble compounds due to increased solvent availability. However, there were different LSR effects and time outside the mid-ranges. In extreme LSRs, time had a quadratic effect on extraction, with inverse trends depending on LSR. In low-range LSR (“shortage” of solvent), yield of short extraction times tended to decrease with an increase in time up to the 60 min of extraction and then increased again. It seems to be a counterintuitive phenomena, but it was repeatedly observed in previous works [37,38,39]. It may be that the initial contact of solvent with biomass promotd a rapid solubilization of certain extracellular biomass compounds and that the gradual extraction of intracellular compounds with time somehow promoted the precipitation of the formerly soluble, initally extracted ones. Then, with even greater extraction times, either by the continuation of intracellular compound extraction, or by the re-solubilization of the precipitates, yield increased again. In high-range LSR (“abundance” of solvent), the phenomenon inverted the monotony, maintaining the quadratic shape. Interestingly, for G. turuturu, this phenomena was of such proeminence that for 50% ethanol extractions, for extreme times of extraction, the trend of linear increase of yield with LSR inverts, and lower solvent volumes become more efficient.
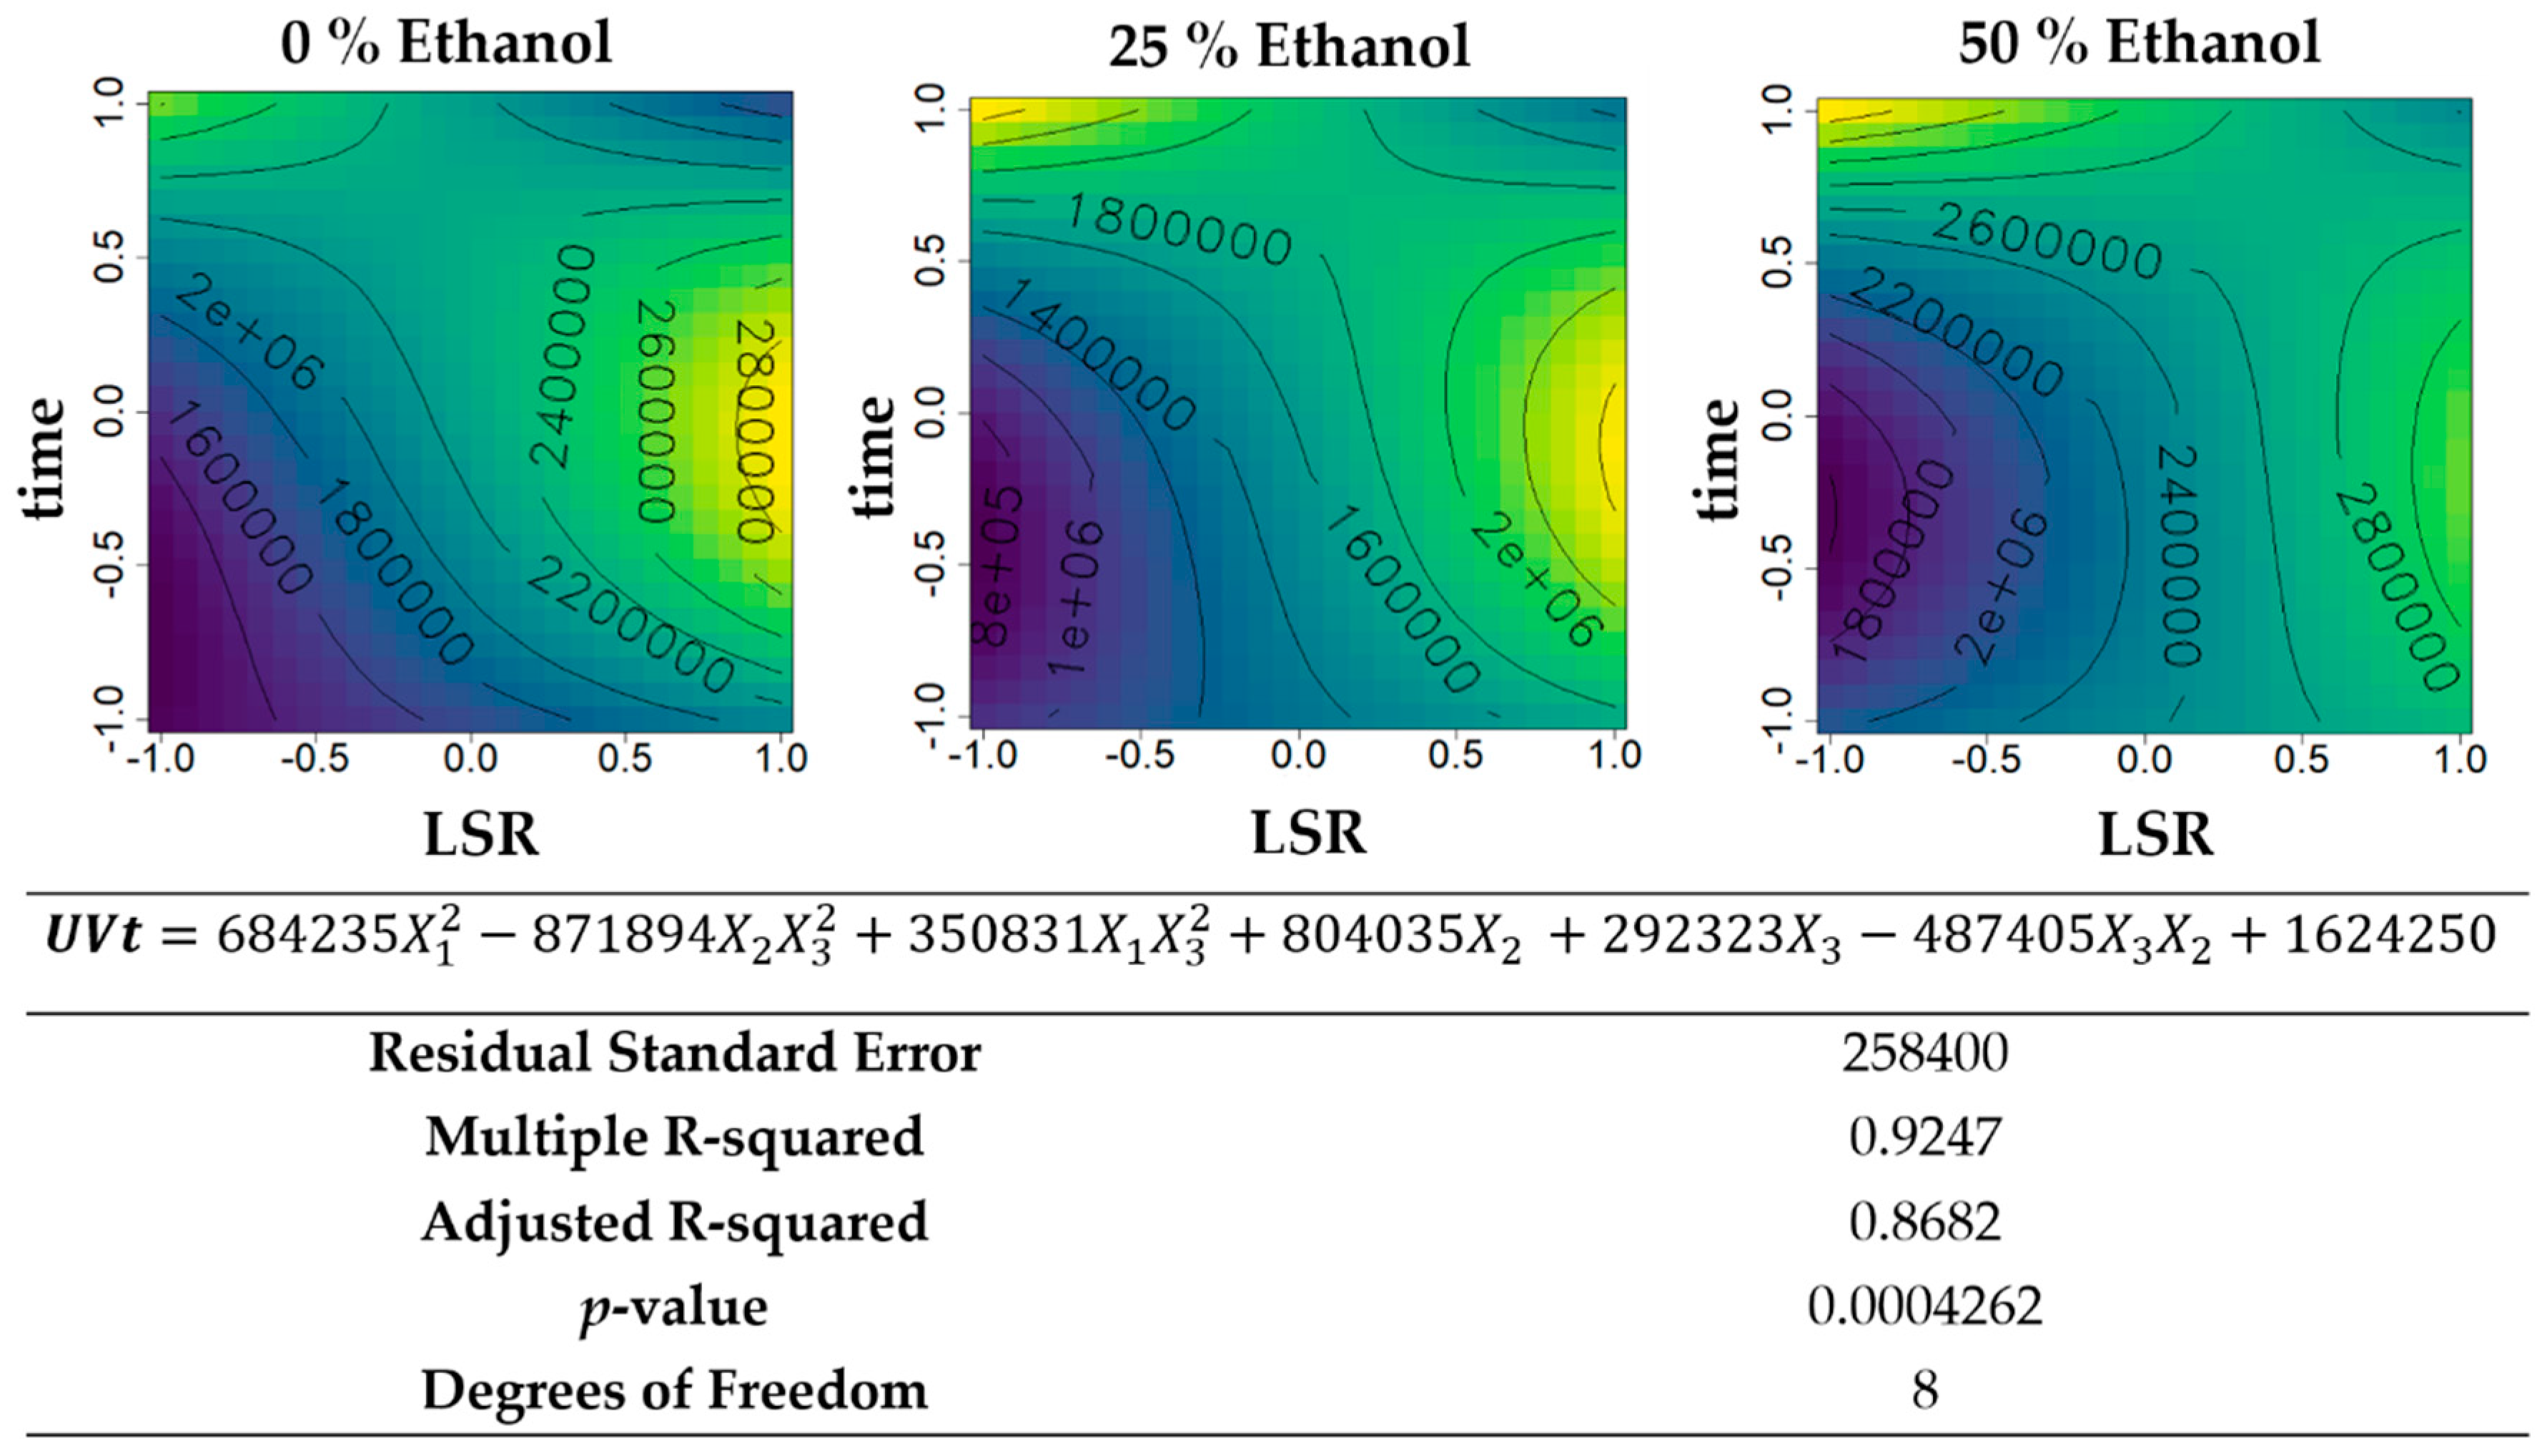
The effect of LSR and time on UV absorbance of hydroethanolic extracts of G. turuturu is plotted in Figure 2. UV-absorbing compounds in this macroalgae species likely range from hydrophilic proteins and mycosporine-like aminoacids to polar organic compounds of phenolic or lipidic nature [34,35]. Concerning ethanol content in the solvent, the highest concentration (50% v/v) resulted in the most absorbing extracts, likely because this solvent composition can retrieve both types of highly-absorbing compounds (the polyphenols and the MAAs) with almost no extraction of carbohydrates (non-active, “activity-diluting” extractives). By reducing the amount of ethanol, UV absorbance decreased to less than half the massic extinction coefficient at 25% (v/v) ethanol compared to 50% (v/v) ethanol, at optimal times and LSR conditions. It might be because, at this value of ethanol, solubility of polyphenols and/or of specific MAAs decreased, and/or carbohydrate solubility increased. When approaching 0% (v/v) ethanol, an increase of UV absorbance was again observed, possibly because of increased protein content in the extracts. At a given ethanol percentage, LSR and time impacted the extraction of UV absorbing compounds differently. For instance, in water extracts, UV absorbance decreased with higher LSRs almost linearly, regardless of extraction time, and followed a quatradic curve (with a peak at intermediate extraction time) regardless of LSR. The decrease of activity with LSR might be correlated with the increase in yield; the extraction of more compounds in the yield increment cold be responsible for “diluting” the UV absorbing compounds with non-absorbing ones (likely carbohydrates). This suggests that the compounds responsible for UV absorption in the water extract are actually readily and highly water soluble, more than their co-extractives, which adds to the possibility of being proteins and/or MAAs. The occurrence of an optimal time of extraction, followed by a decrease of absorbance, suggests the degradation of these compounds with prolonged extractions. With the addition of ethanol, some skewing of the contours occurs at 25% (v/v) ethanol, where MAAs were likely the only absorbing compounds quantitatively extracted. Lower solvent volumes and higher extraction times led to minimum recovery, while higher solvent volumes with short extraction times maximized it. At 50% ehtanol extraction, more than 40 mL·g−1 of solvent and/or more than 100 min of extraction were required to achieve optimal recovery of UV absorbing compounds from G. turuturu biomass. By multiplying the specific UV absorbance of the extracts by their yield, one can further characterize the extraction in terms of total UV-absorbing capacity (Figure 3), and therefore final profitability should perform compound purification, as well high rates of inclusion of crude extracts. In the case of hydroethanolic extraction, the total UV-absorbing capacity recovered became almost unimpacted by the ethanol percentage and the pattern of LSR effects and time became similar for different ethanol percentages. Nonetheless, either 0 or 50% (v/v) ethanol percentages were shown to best extrat solvents. Maximum recovery in thoses cases was attained using either low solvent volume for a long amount of time or high solvent volume for a mid-to-low amount of time. The similar patterns of the contour plots reinforced the idea that observations on the specific activity plots (Figure 7) were caused indirectly, in which the activity was “diluted” by non-active co-extractives, rather than directly, through differences in the amount of extracted UV-absorbing molecules. Thus, ethanol, LSR, and time might be good parameters to adjust in order to target higher-purity/potency extractions, especially for applications where purification is not meant to be performed.
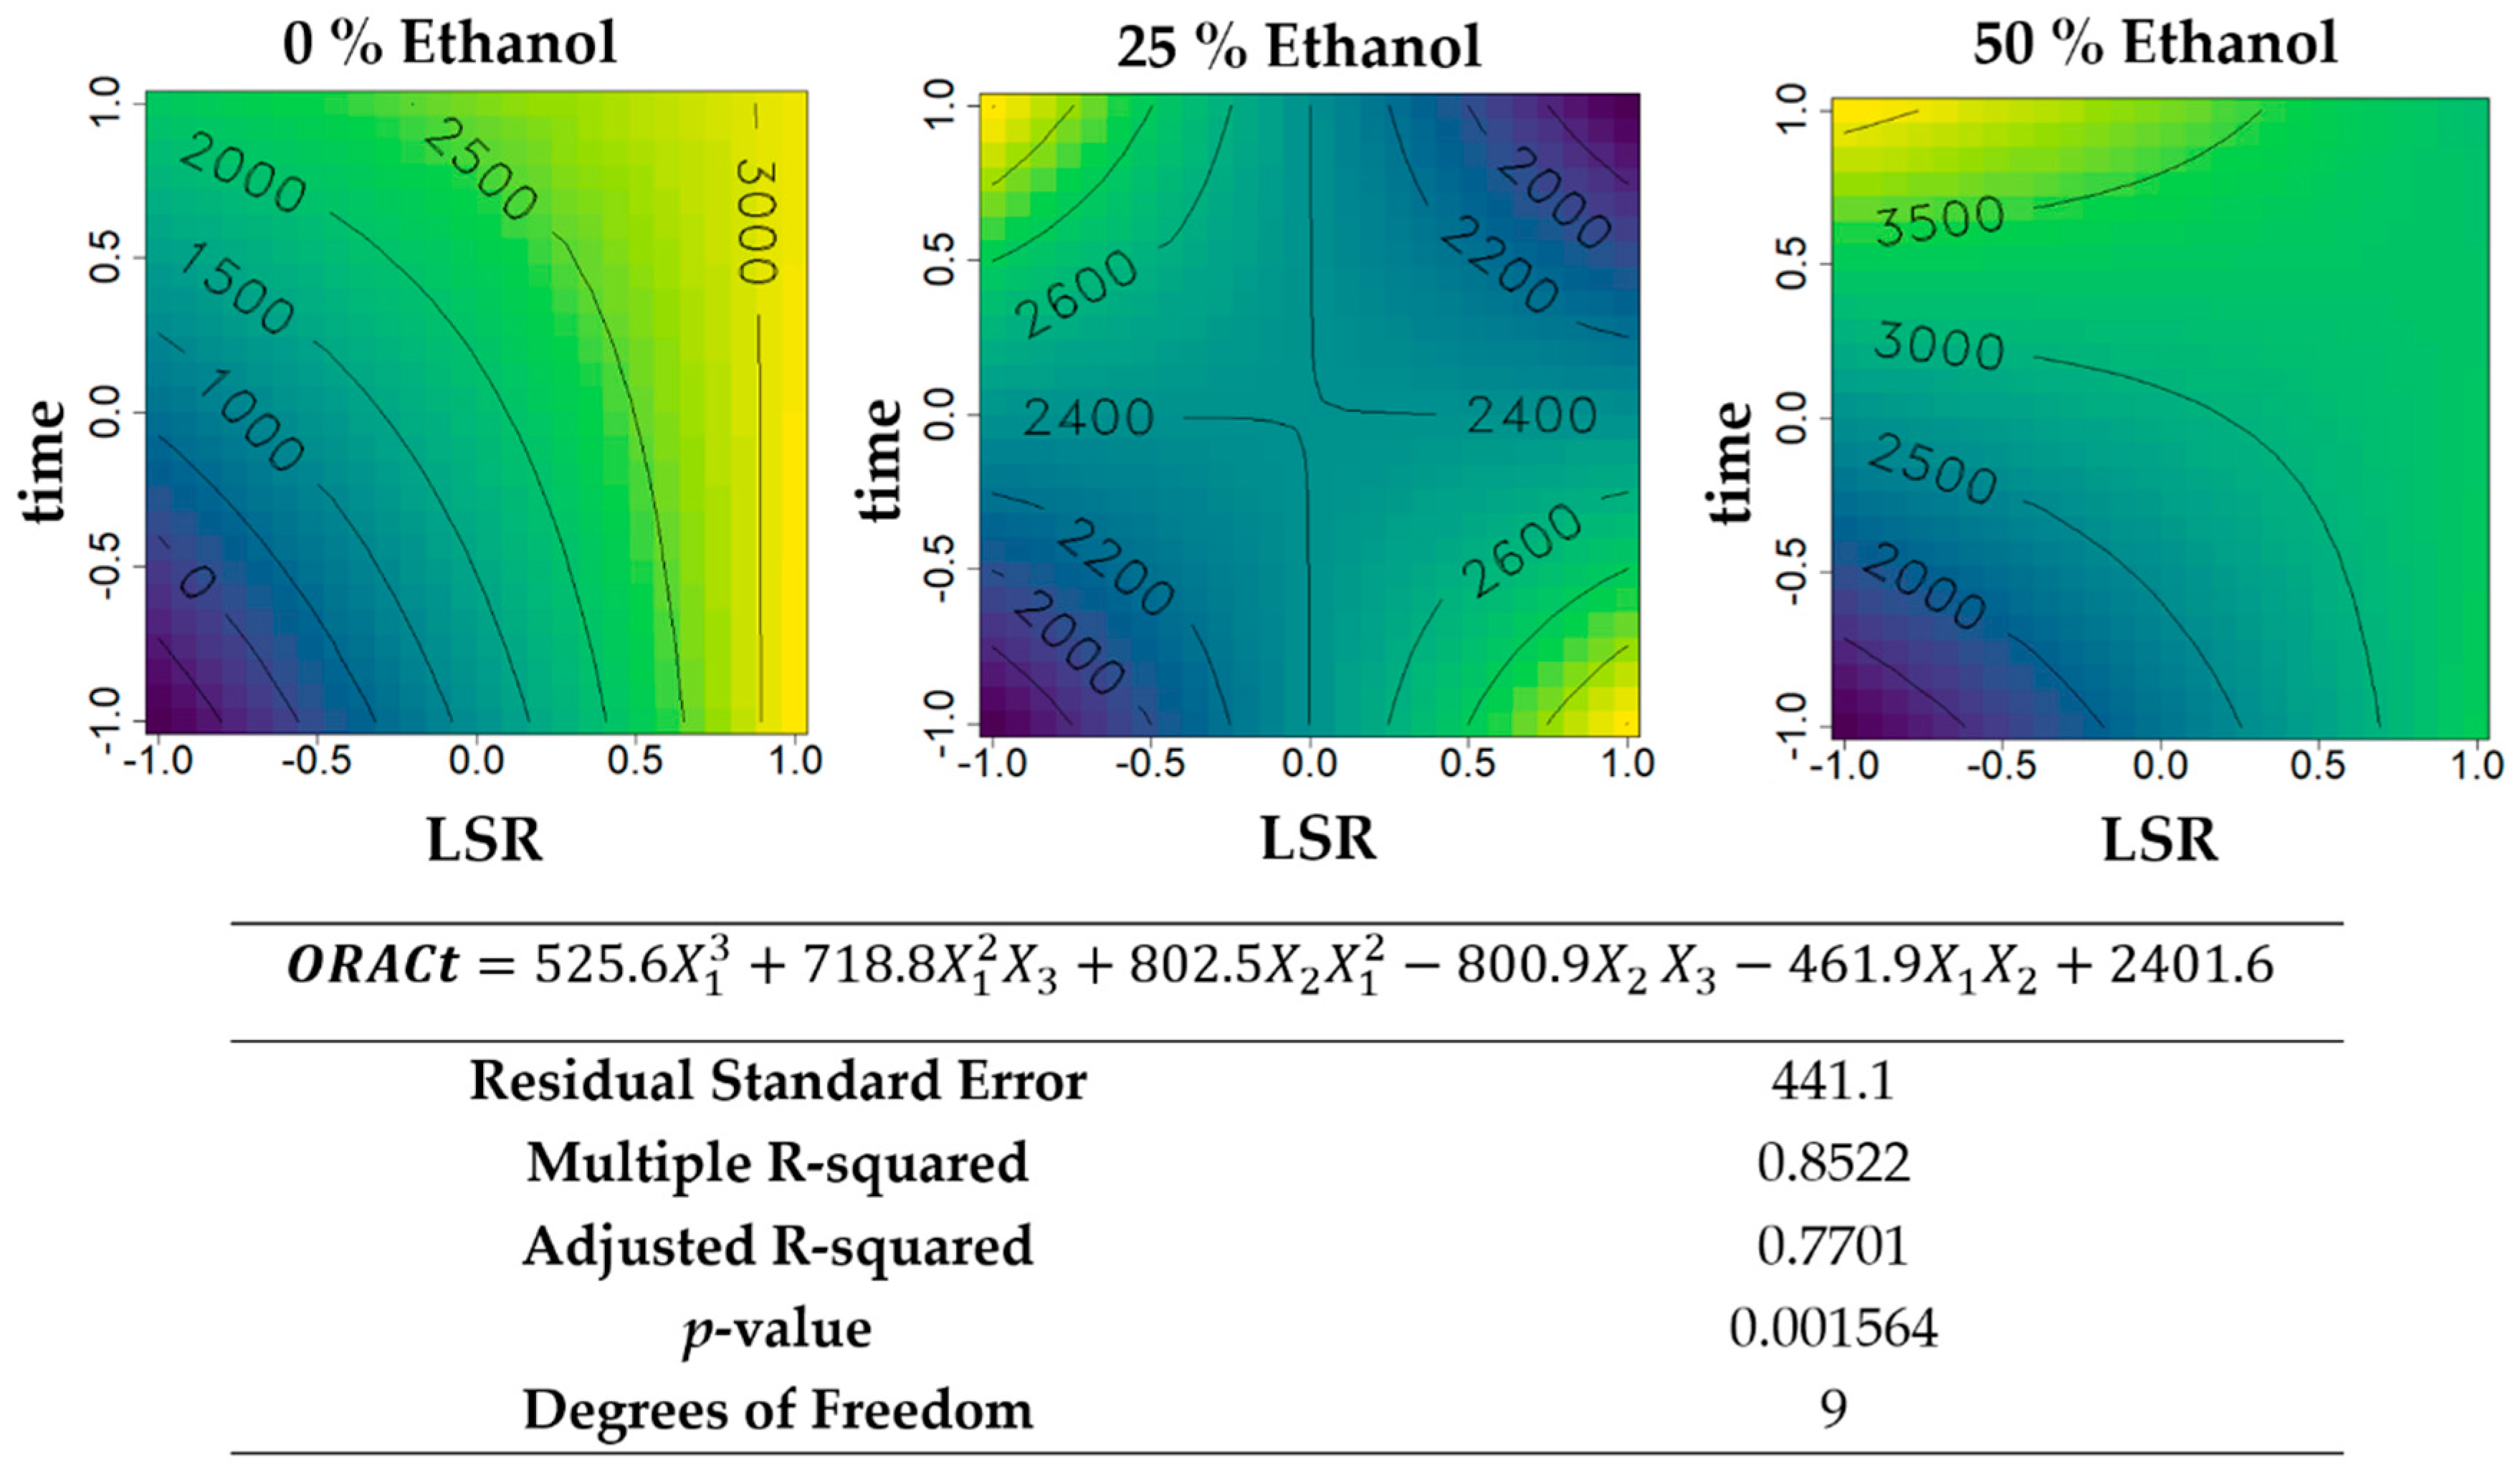
The specific ORAC extract activity (Figure 4) was significantly impacted by all three variables under study. As expected, the more ethanol in the solvent, the higher the antioxidant activity. Alcohols were the preferred solvent for recovering antioxidant activity, as polar metabolites soluble in alcohols are often responsible for crude extract antioxidant activity [40]. In G. turuturu, antioxidant polyphenols, chlorophylls, and other hydroxyl-containing molecules occurred, such as polar carotenoids and tocopherols, all of which became more readily solubilized by the presence of ethanol in the solvent [19,33,41]. However, ORAC activity in water extracts from G. turuturu is worth studying, as sulphated carrageenans can present this activity [22,23] and their presence in a higher quantity might result in worthy application studies of these molecules. In the case of water extracts, both high volumes of solvent and long extraction times benefitted antioxidant recovery from G. turuturu. Actually, the 40 mL·g−1 and 100 min used in this study as upper limits of these variables did not decrease and rather increased. However, 10 mL·g−1 of solvent extracted for 100 min led to maximum ORAC activity, even higher than using 40 mL·g−1 for 100 min. If enough extraction time was employed, then increasing volume worsened the extract’s specific antioxidant activity, likely because it allowed the extraction of non-active components that “diluted” the active ones. For 50% (v/v) ethanol, the same conditions (low volume and high time) resulted in maximum ORAC activity as well. However, for this solvent, higher volumes invariably resulted in same-or-poorer results, even at low times of extraction, which indicates that the recovery of the ethanol-soluble antioxidants was limited by the rate of mass transfer, and not by solubility.
Total ORAC activity (Figure 5) recovered per gram of biomass followed similar trends, in the case of 25% and 50% (v/v) ethanol. For water extracts, however, extraction under sub-optimal conditions regarding specific-activity, namely higher solvent volumes, regardless of time, because of an increase in yield, maximized antioxidant recovery to the point of obtaining maximum ORAC activity using 40 mL·g−1 for 20 min. If the extraction was made under optimal specific-ORAC activity, i.e., 10 mL·g−1 for 100 min, only 66% of total capacity available was recovered, despite being purer (higher per gram of extract). In any case, specific- and total-ORAC activities of G. turuturu hydroethanolic extracts had maximums in the limits of time and LSR tested, meaning that higher values of ORAC might be available in G. turuturu biomass if further optimization of these variables is performed.
The overall analysis of LSR, time, and ethanol percentage effects on the three parameters (yield, ORAC, and UV-absorption) of G. turuturu extracts suggested that ethanol percentage resulted in extracts fundamentally different at the chemical composition level, to a point where it should still be a variable under optimization in the study of temperature and pH effects. Thus, this variable was maintained in the second Box–Behnken design. For this second set of extractions, a LSR and time value was chosen by considering the overall effects observed in the first Box–Behnken, attempting to maximize yield, ORAC, and UV-absorption: 60 min of extraction and 40 mL·g−1. Under these conditions, temperature and pH effects on different hydroethanolic extractions were characterized (Figure 6, Figure 7, Figure 8, Figure 9 and Figure 10). Typically, for SLEs, temperature increases were expected to result when yield increased and more so when using water as a solvent. Solubility of organic substances tends to increase with temperature, and mass transfer phenomena become facilitated by kinetic energy possessed at higher temperatures [42,43]. The adjustment of pH is not something for which a trend is typically assigned, as it highly depends on the solvent and matrix being extracted; if pH changes results in higher or lower solubilities depends entirely on each molecule’s characteristics [7]. For seaweed, however, because the matrix has a high content of polysaccharides and proteins, both macromolecules for which pH drastically alters their solubilities, pH adjustment is expected to result in very different extracts.
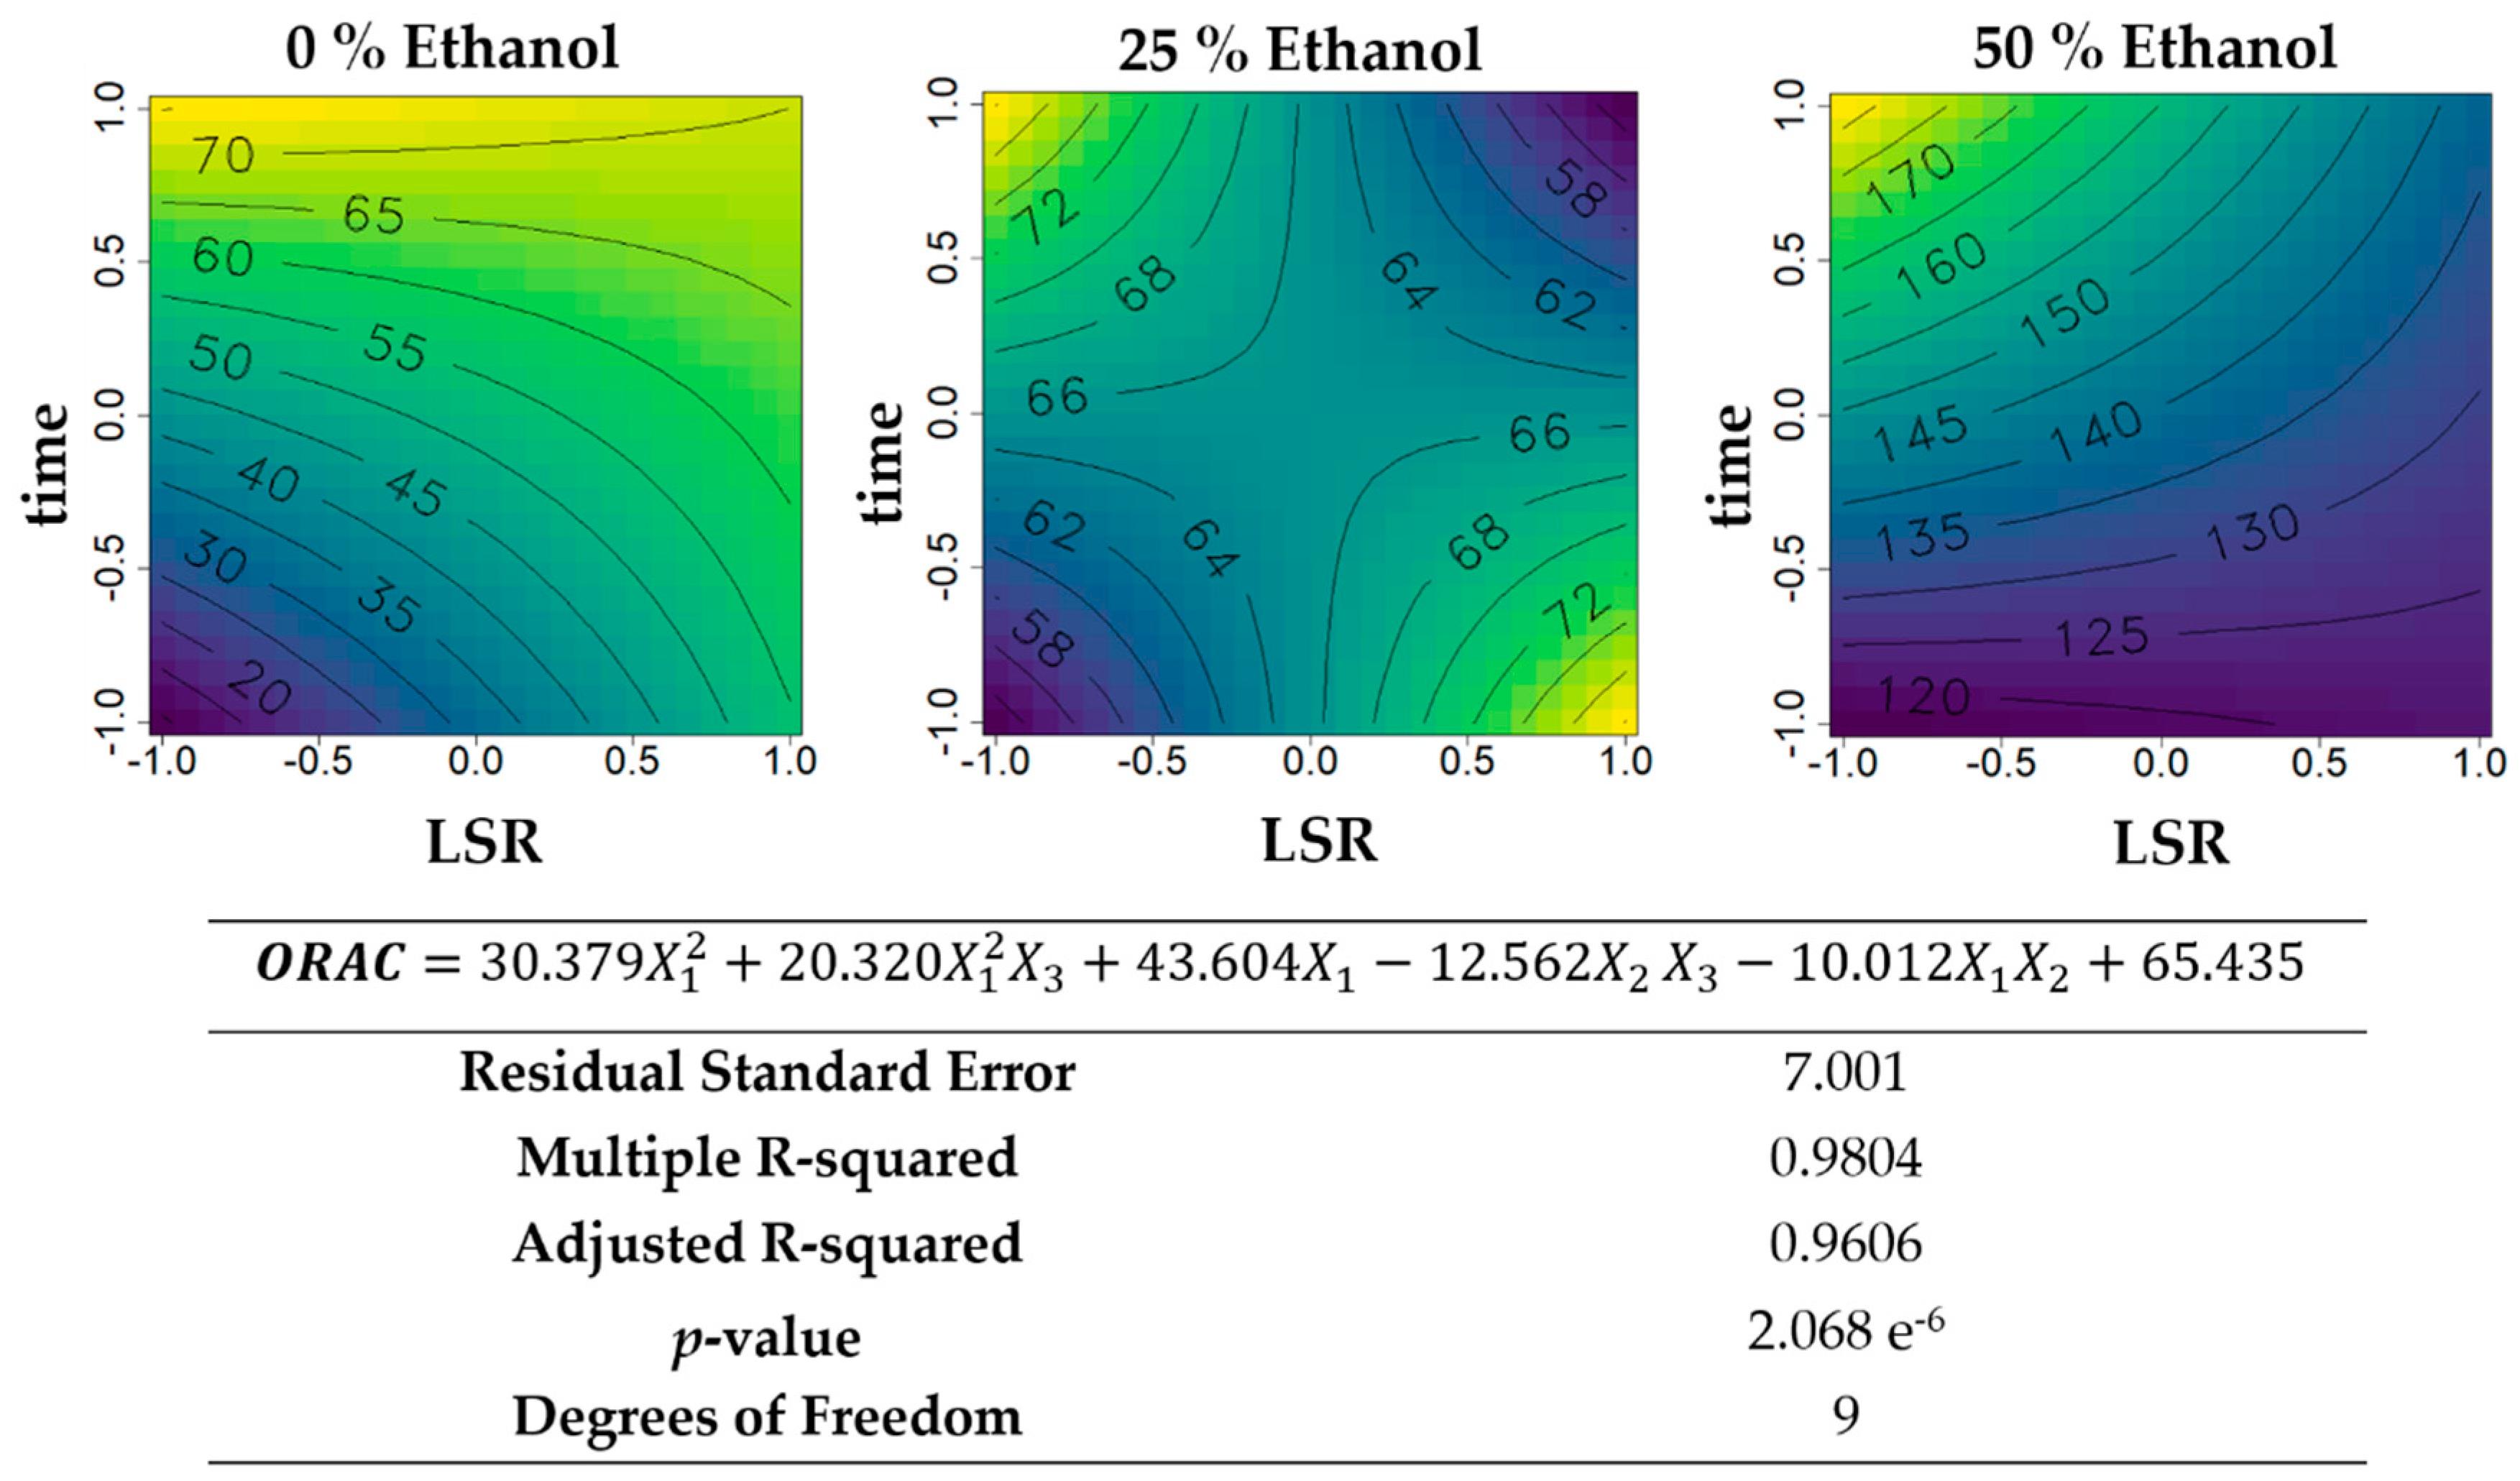
The yield of the extracts produced for the second optimization (Figure 6) revealed some unexpected effects. In the water extract, heating led to a decrease in yield that only reverted to an increase in the middle of the range (approximatley 60 °C), reaching a maximum yield at 95 °C, but had comparable values at room temperature. In the 25% (v/v) ethanol, the yield was not affected by temperature at a neutral pH. In the 50% (v/v) ethanol, the yield did increase with temperature, but in the middle of the range, it decreased to values comparable to room temperature. None of these three phenomena are in accordance with the SLE theory, but have been observed for seaweed extracts before; conditions of higher solvent availability/solubility sometimes result in lower yields [7]. In this case, it might be that, for water extracts, the compounds extracted at room temperature, plus the extra compounds extracted at 60 °C, end up interacting (for example, protein-polysaccharides adsorption), precipitating, and being removed along with the extracted biomass particles. The same phenomena might occur in the 50% (v/v) ethanol for the high-end temperatures tested. By modifying the pH, it is less odd that events like these occur or cease to occur. Side chains of proteins and polysaccharides become either totally protonated (in acid pH) or totally deprotonated (in alkaline pH) to a point where adsorption phenomena and solvation phenomena change significantly [42,43]. In G. turuturu, pH adjustment did not significantly impact the water-based extraction at room temperature, because whatever was being extracted had low molecular weight carbohydrates for which protonation was less relevant in terms of solubility than higher-molecular weight ones. At a near-boiling temperature, however, a linear increase of yield with pH suggested that alkalinity promoted extraction, which was expected since alkaline hydrolysis was one of the methods to dissolve cellulosic biomass and solvate their carbohydrates [44]. With ethanol in the solvent, this trend was reversed and we observed an almost-linear increase of yield and decreased pH. These events may be related to an increased ease of mass transfer due to a certain degree of acid and alkaline-hydrolysis of the cellulose cell walls. If that is the case, then in ethanol-containing solvents it has been demonstrated that acidic pH increased the solubility of G. turuturu metabolites, perhaps by disrupting the hydrogen bonds between proteins and such other solubles.
UV-absorbance of the extracts in the second Box–Behnken (Figure 7) followed a similar trend across the different ethanol percentages, which makes sense considering that in the initial optimization it was in the vicinity of 40 mg·mL−1 with 60 min of extraction, and the ethanol percentage had a low effect (pattern was similar). This reinforced that ethanol percentage, using this LSR and time, did not change extract composition in terms of UV-absorbing molecules (the proteins, the MAAs, and some polyphenols). However, like the first RSM, higher ethanol did promote higher absolute UV-absorbance values, possibly by decreasing the co-extraction of non-absorbing molecules. Both temperature and pH had significant effects on UV absorbance. Temperature followed a quadratic curve with a minimum absorbance at the middle of the range and, at the end, experience maximum near-RT and near-boiling. The compounds that were hypothesized to precipitate with the increased extraction of other molecules (observed in the yield) are possibly responsible for the UV absorbance (likely, the proteins). In the 50% (v/v) ethanol, even though the yield increased at mid temperature and decreased at higher ones, UV-absorbance was minimal at mid temperature increased with higher temperature. Chemical characterization of the extracts using chromatographic and spectroscopic techniques could assist in describing these mass tranfer nuances. The effect of pH was seemingly impacted by temperature, with neutral pH being better for UV absorbance recovery with hot extraction, following a quadratic curve, while room temperature extracts had no- to linear-effect with increased ethanol. The solubility of UV-absorbing proteins and MAAs might be impacted by pH since these molecules contain a certain balance of carboxylic and amine groups, which varies their state of protonation with pH [45]. Considering that yield is lower under alkaline conditions, it is likely that an increase in UV-absorbance of alkaline extracts at room temperature is, however, caused by a lower co-extraction of non-absorbing molecules, rather than a direct effect on the extraction of UV-absorving molecules.
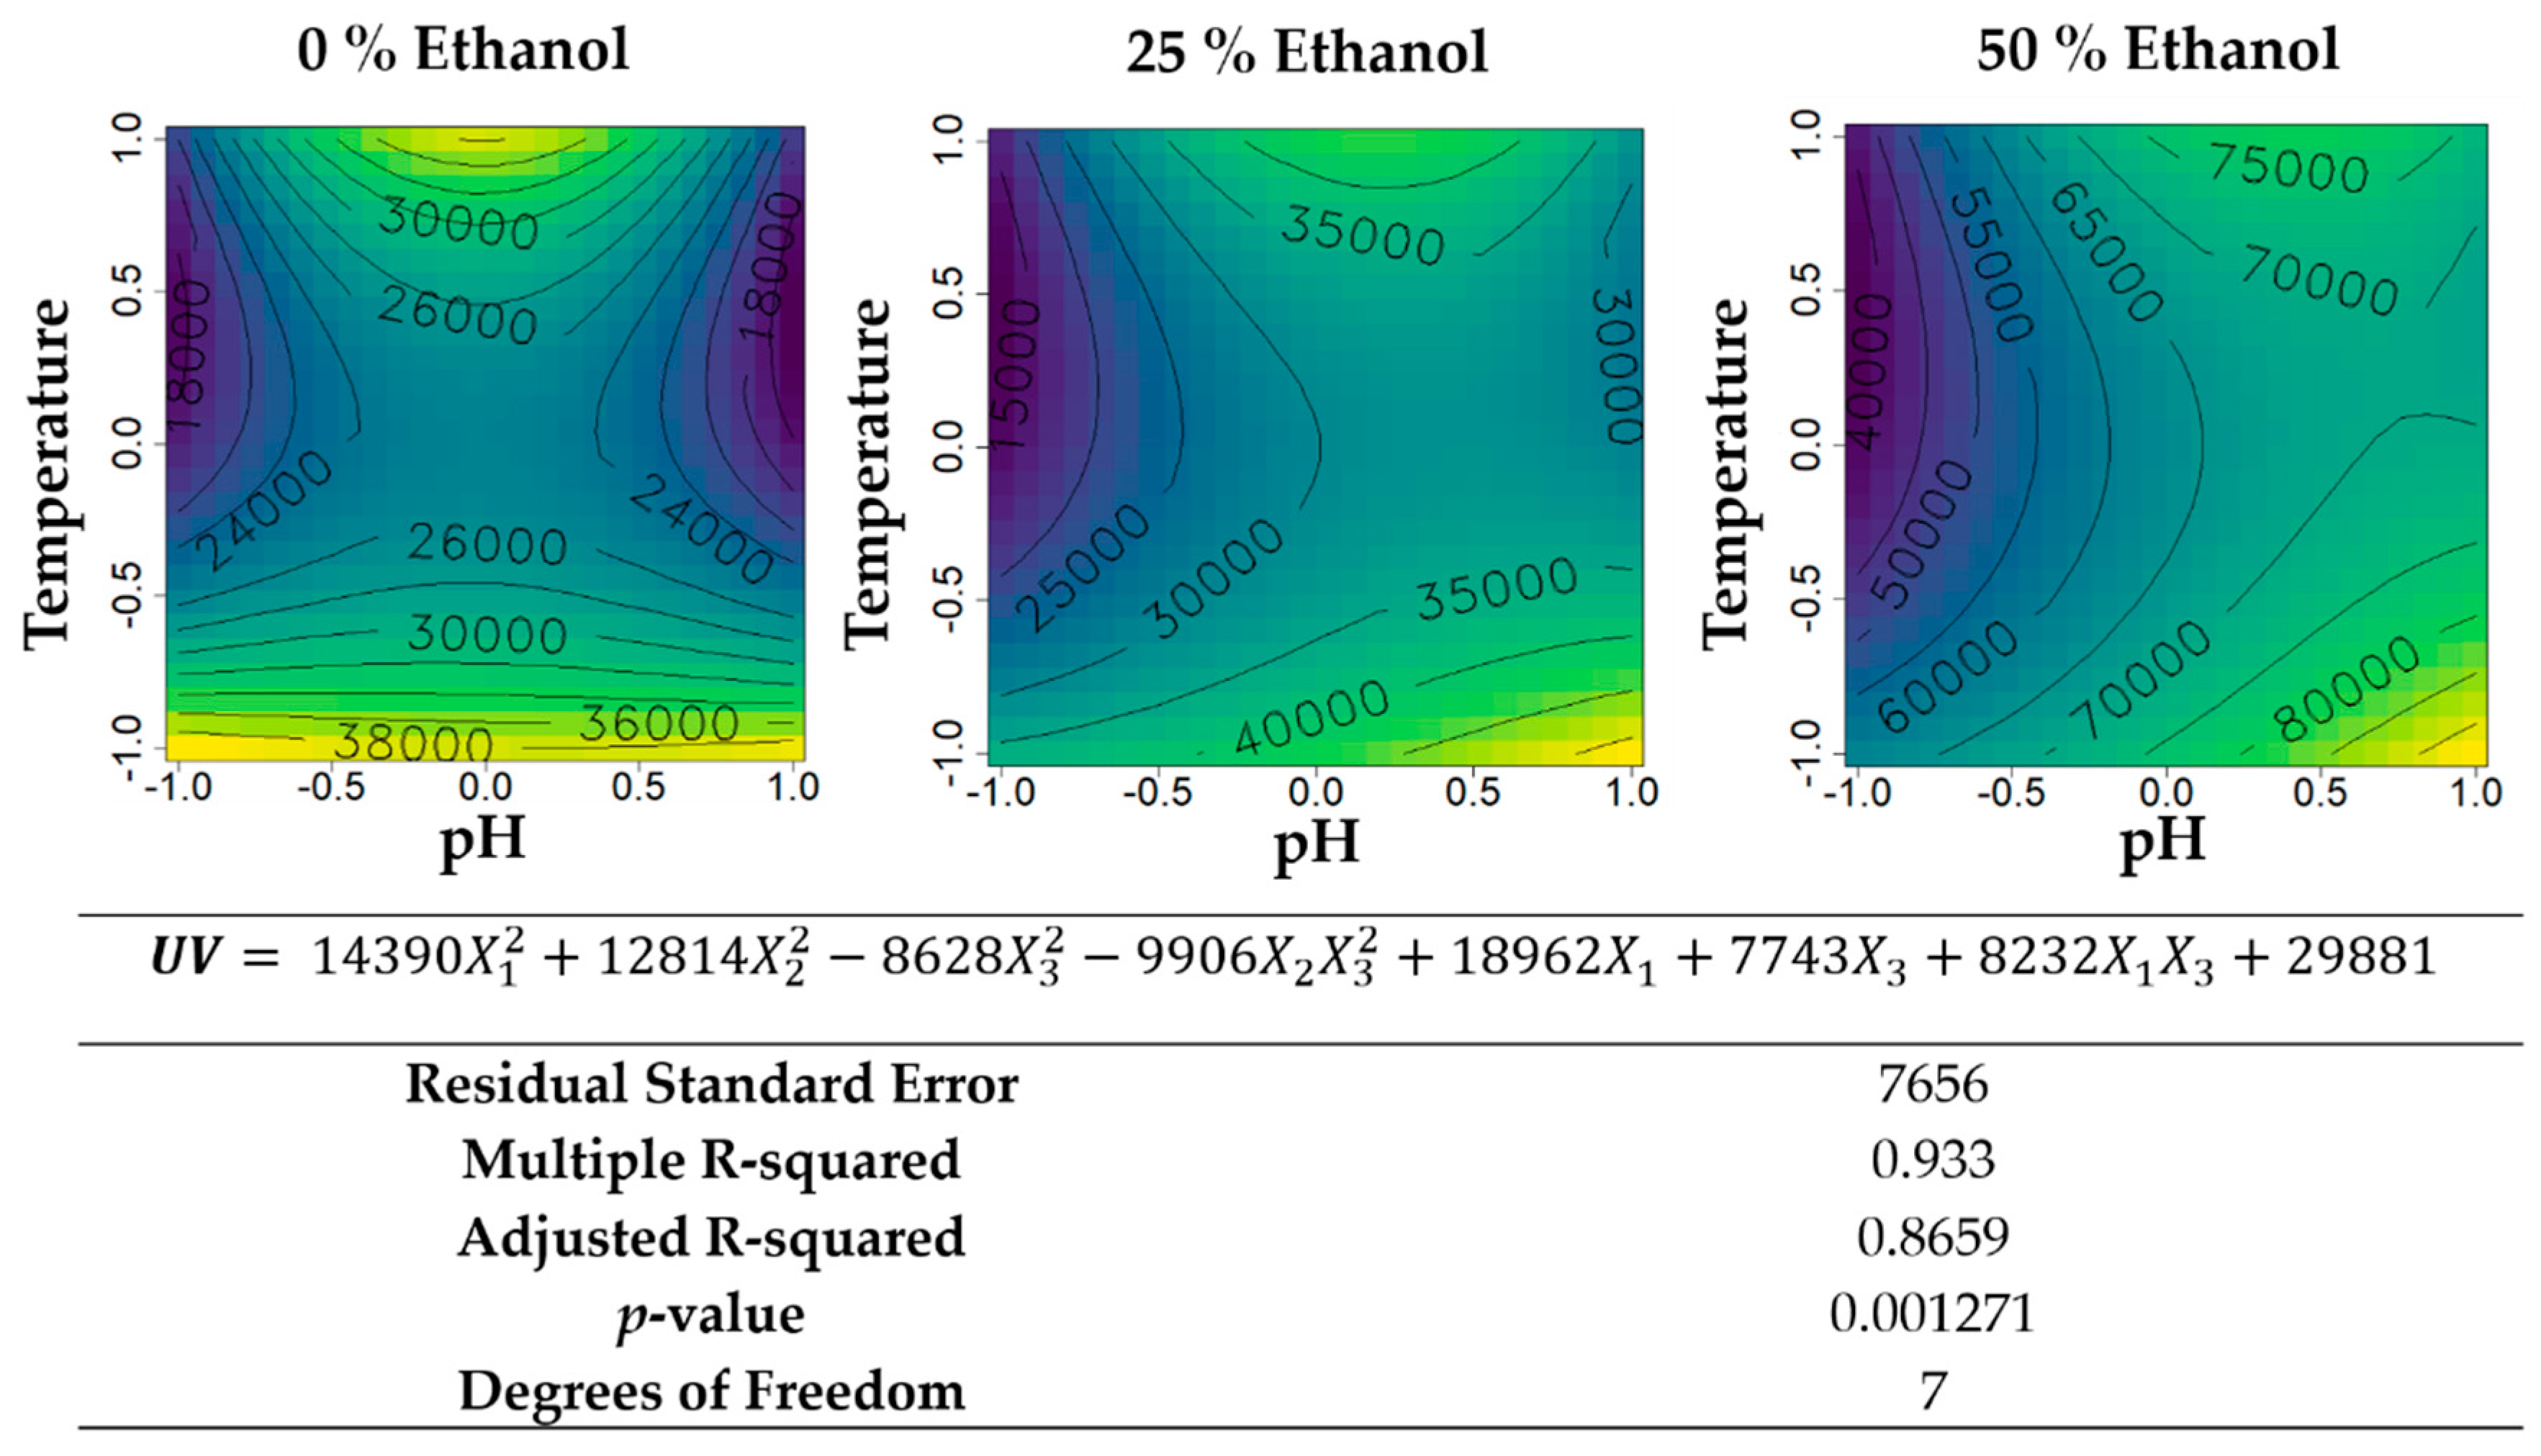
Considering extraction yield and UV-absorbance together (total UV-absorbance, see Figure 8), it is clear that room temperature and acidic solvents, especially those containing ethanol, are the best extraction method (concerning pH and temperature) for UV-absorbing molecules recovery from G. turuturu. It is important to observe how significant the impact of pH adjustment is. In this study, when working at room temperature, the addition of HCl to the solvent allowed increments in UV-absorbing molecules a total recovery of 33% to 62% for 50% ethanol and 0% (v/v) ethanol, respectively. This represents a significant increase in profitability and therefore in the sustainability of industrially exploring this species of seaweed with a simple modification of the extraction protocol.
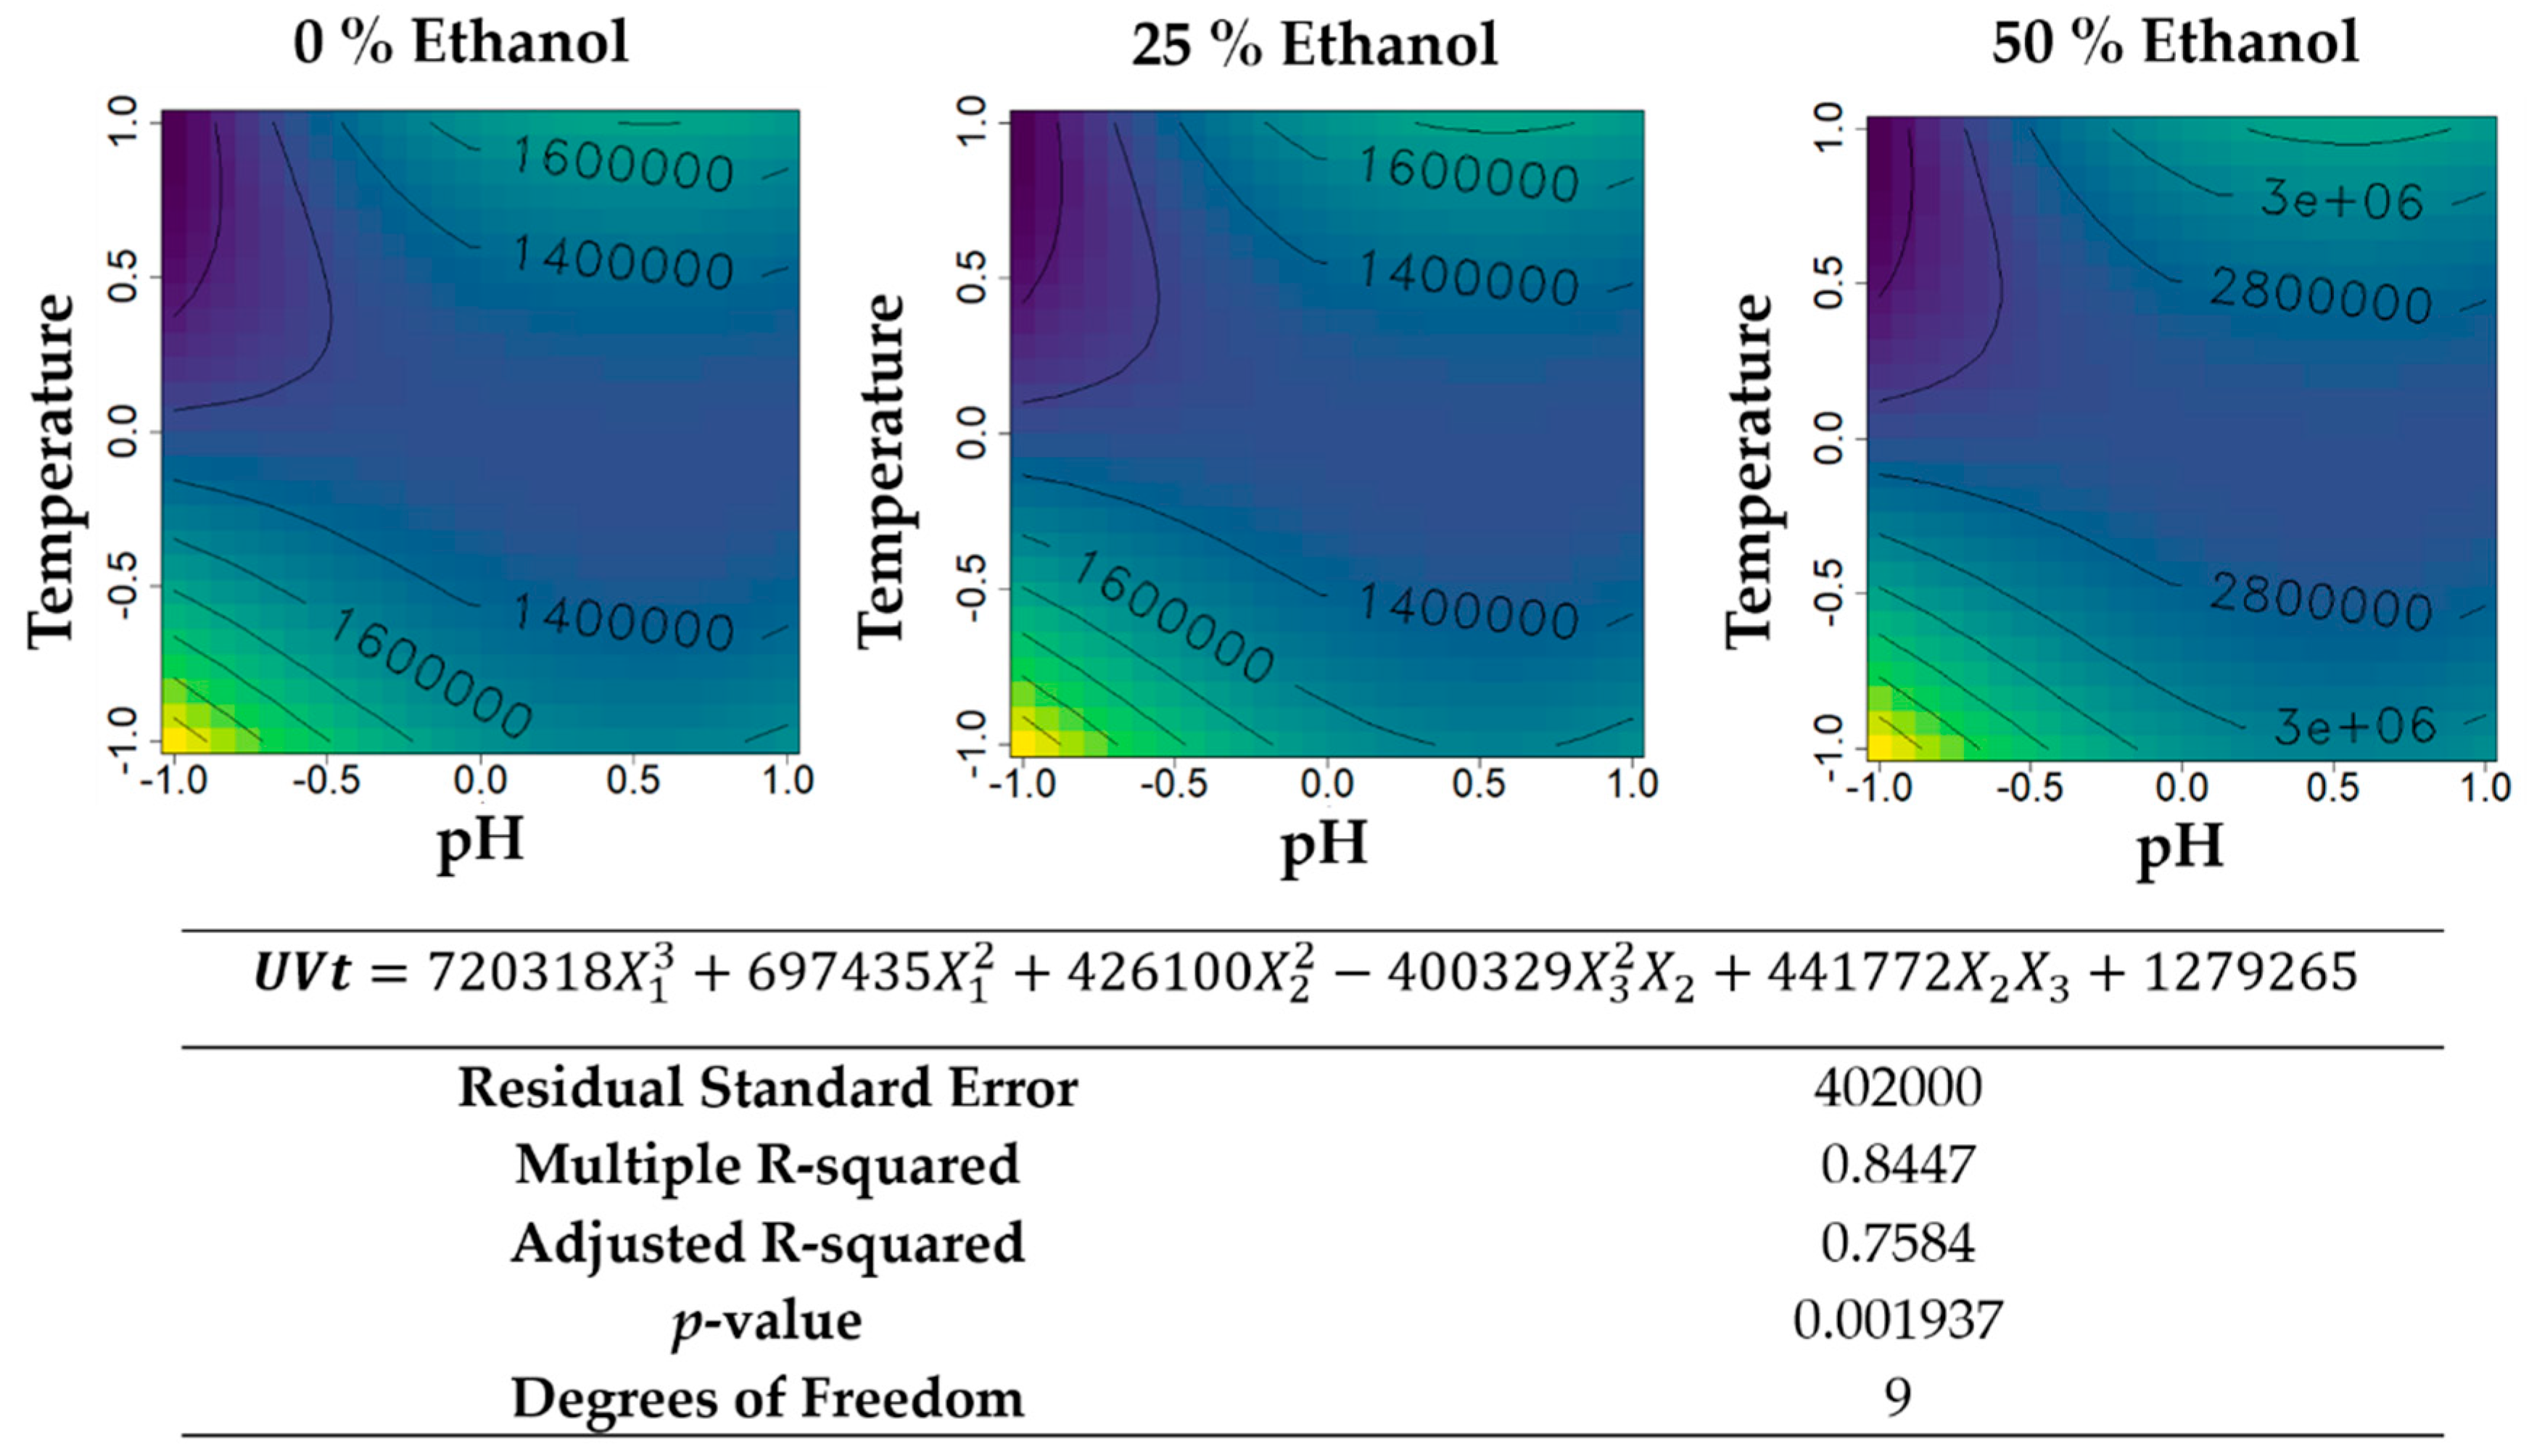
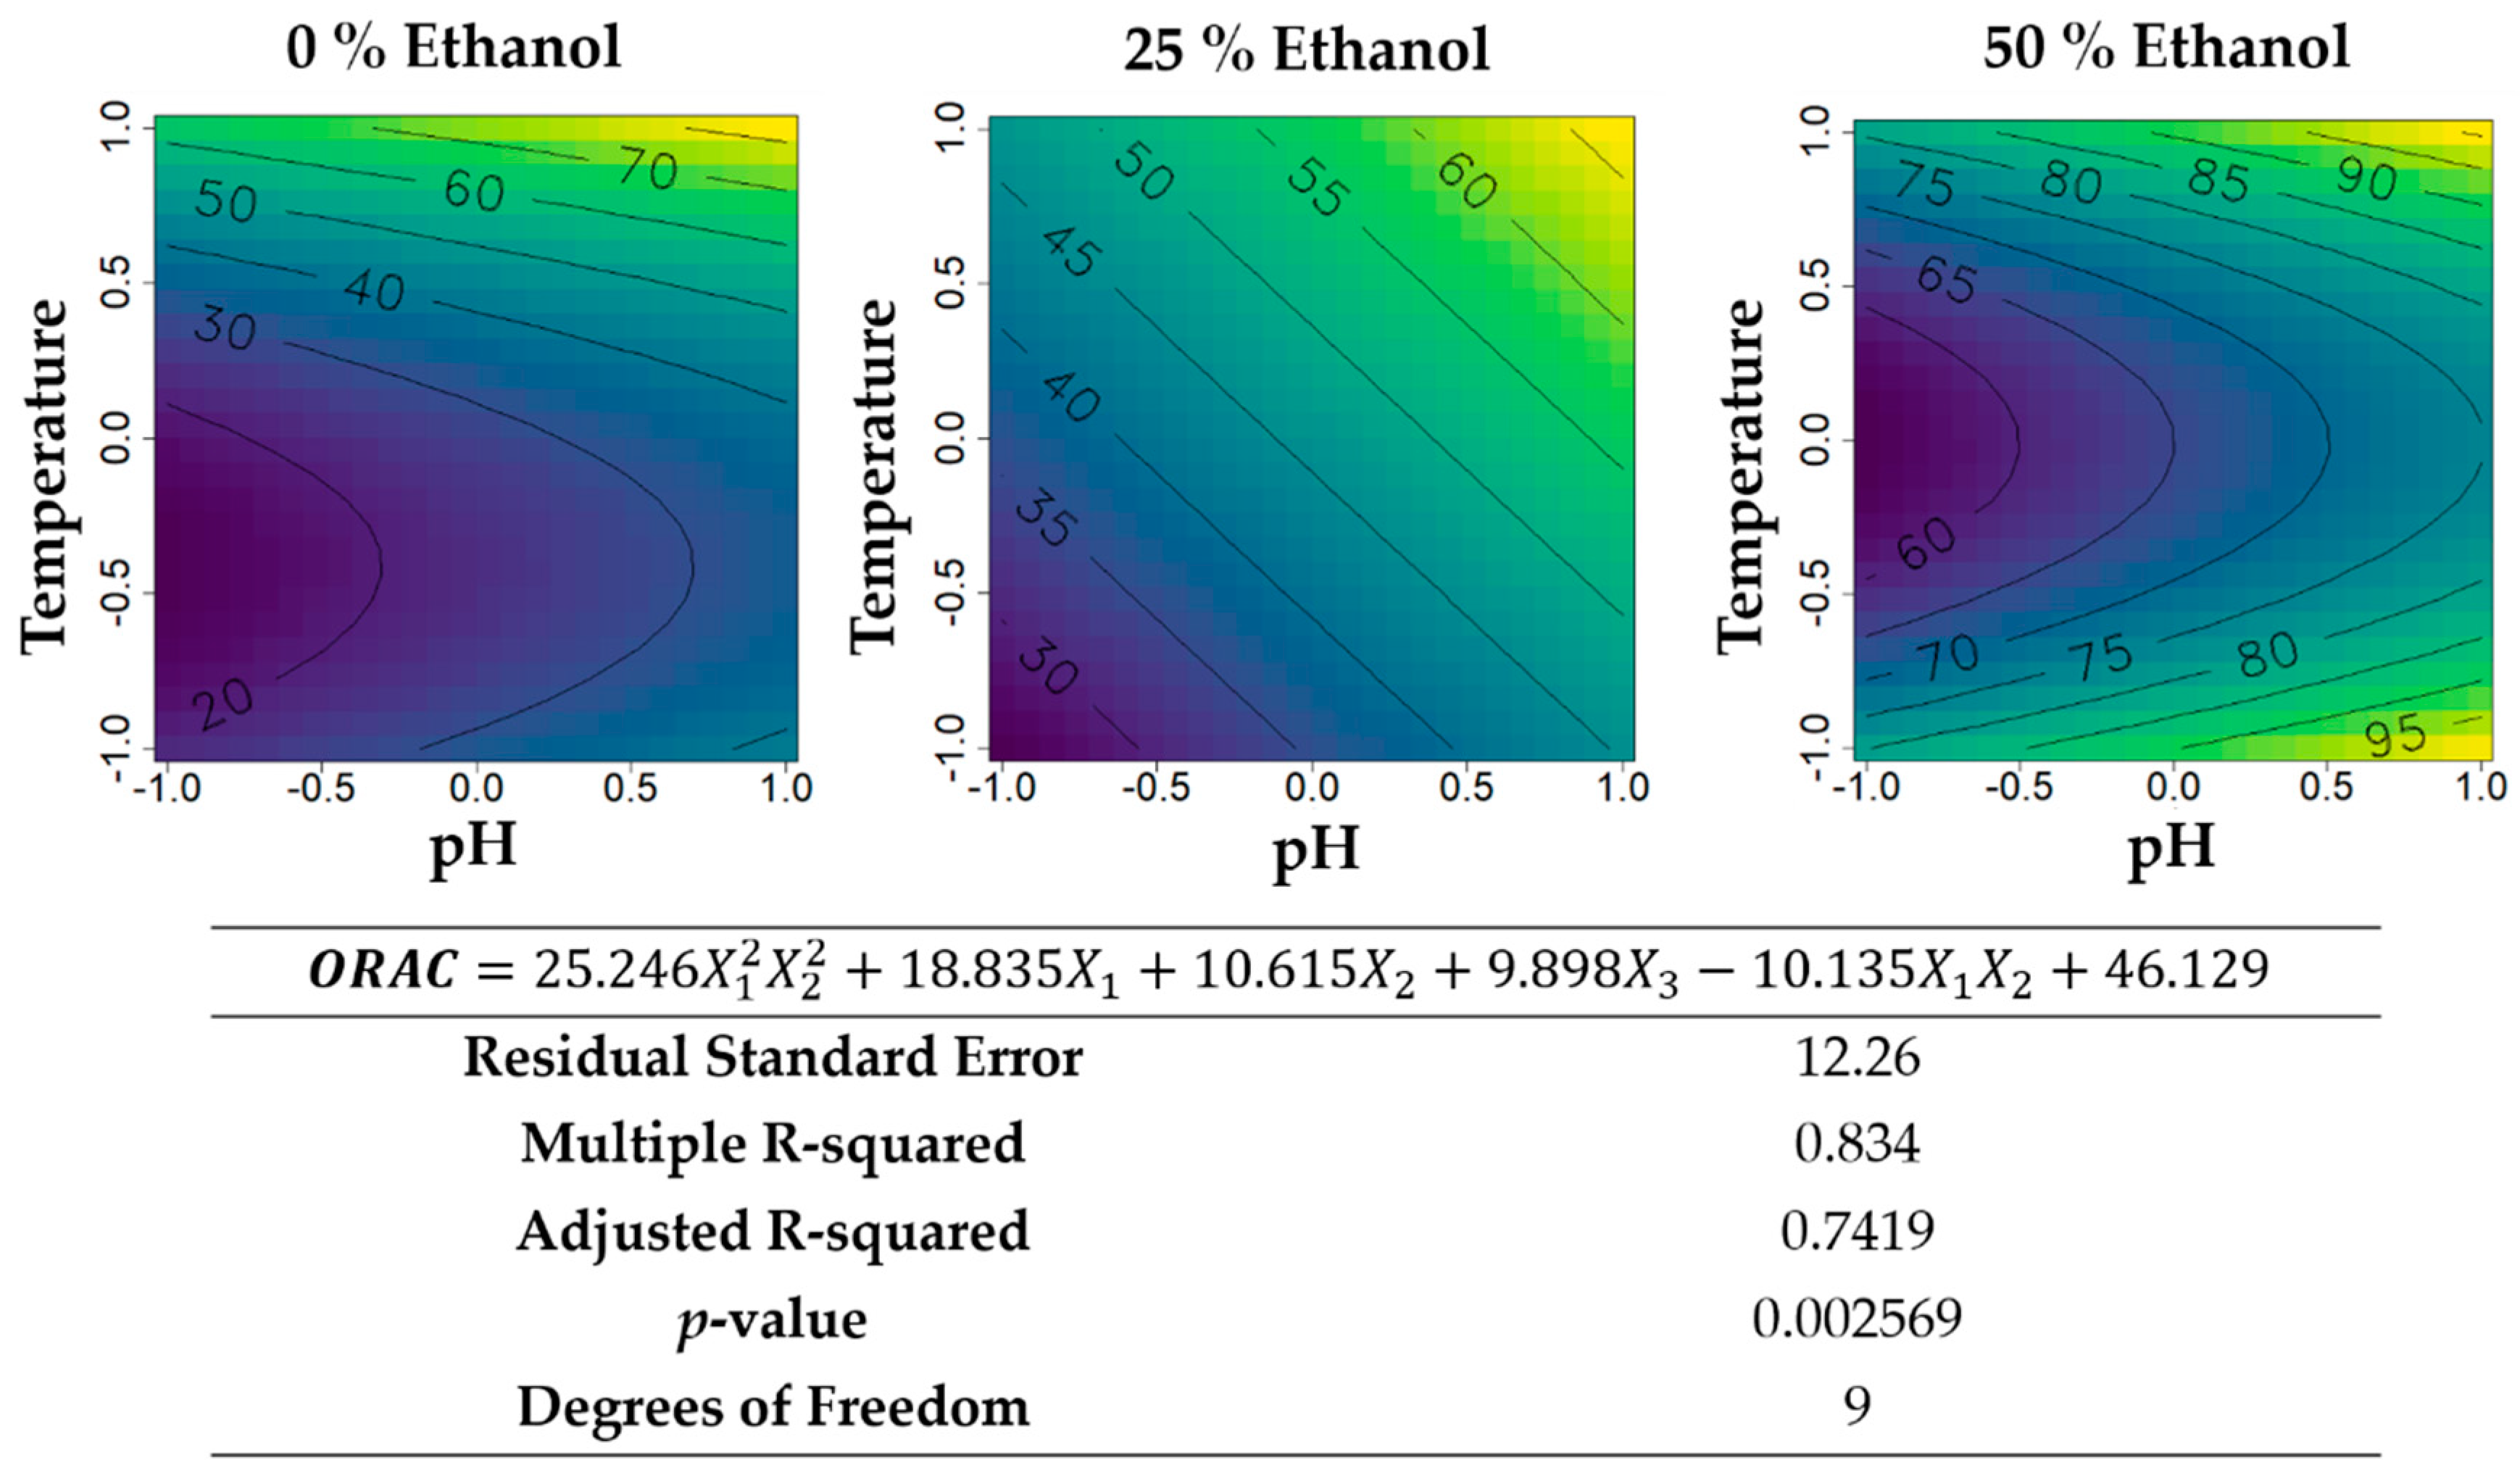
Finally, the antioxidant activity of the second Box–Behnken was addressed (Figure 9). Ethanol inclusion in the solvent of extraction, as expected, let to an increase in ORAC at room temperature. However, upon manipulation of temperature, pH, or both, ethanol led to a decrease in ORAC at low inclusion levels that only resumed the increasing trend with inclusions near 50% (v/v). It might be that pH and temperature manipulation leads to higher recovery of polysaccharides of different chemical natures, and that this recovery is different with high-, low-, and absent-ethanol. Regardless, at any given ethanol inclusion level, the effects of temperature and pH followed similar trends: an increase in pH led to a linear increase of ORAC; temperature, yield, and UV-absorbance had a minimum at the middle of the range, meaning either cold or hot extractions were privileged to medium-heat ones, possibly due to the phenomena of precipitation. The total ORAC analysis (
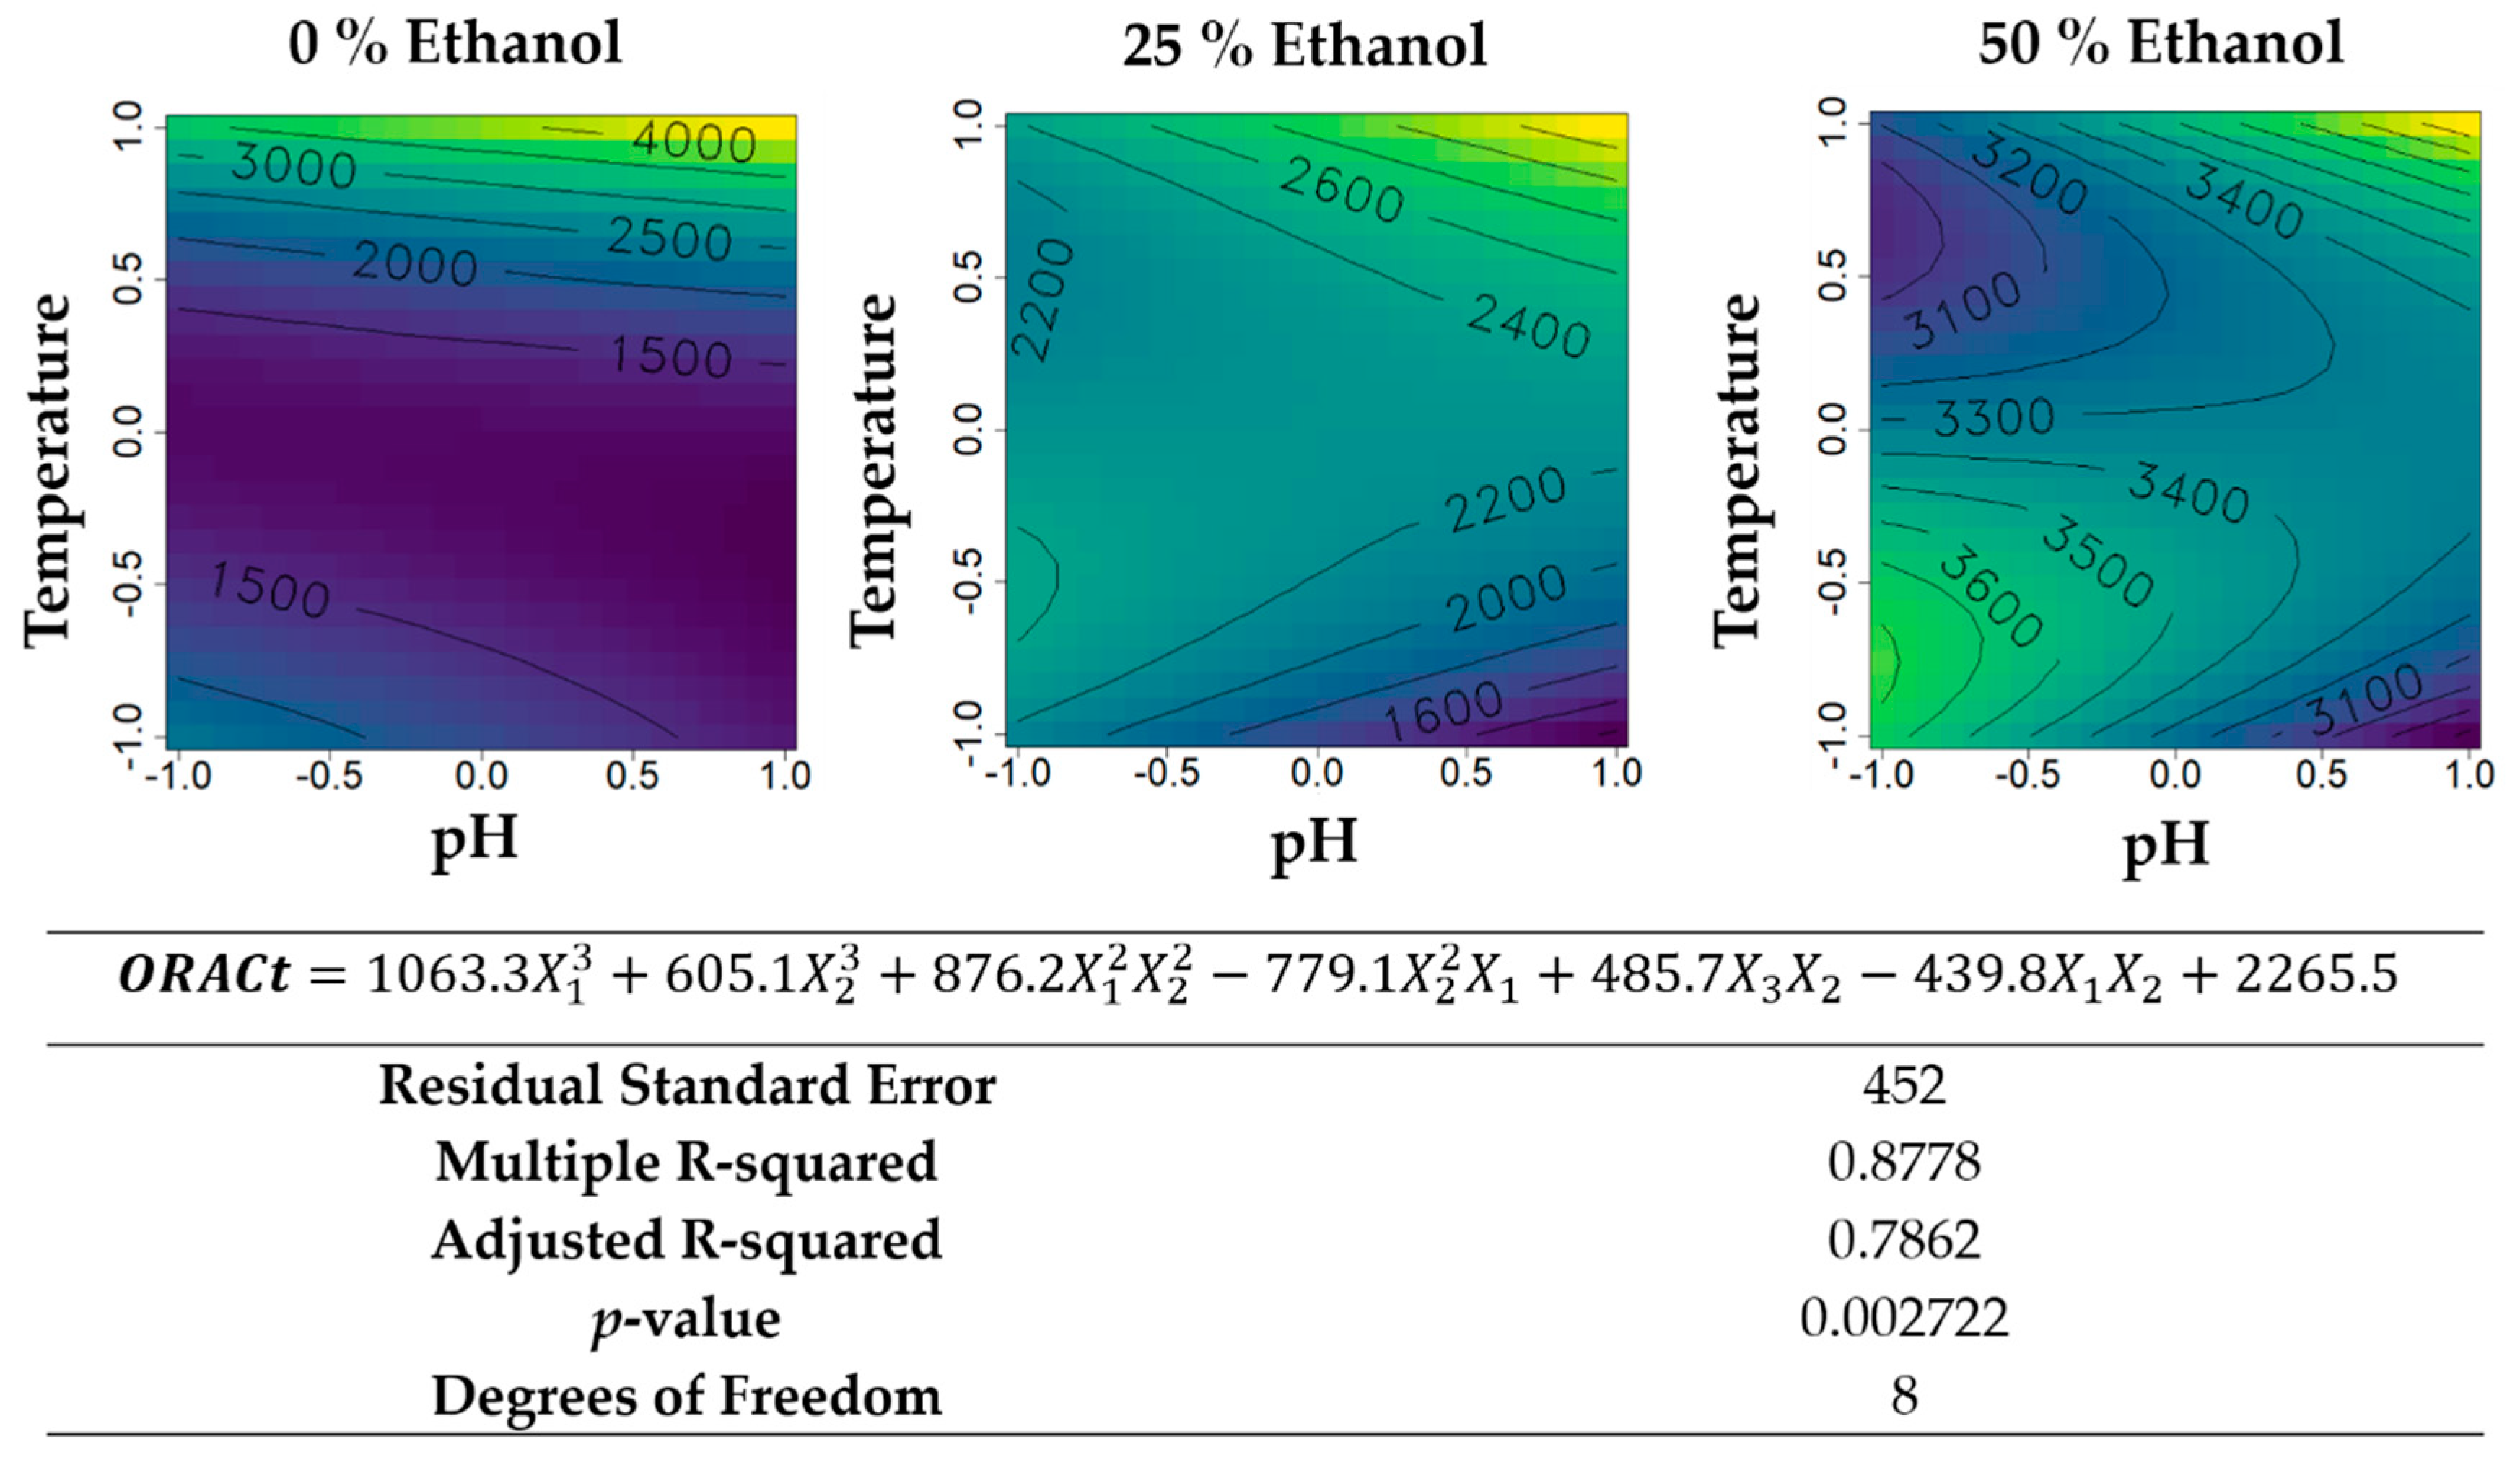
Figure 10) revealed skewed patterns of effects and interactions between temperature and pH. However, for all ethanol percentages, ORAC-reactive antioxidants were extracted most at near-boiling temperatures, with little to no effect of pH, suggesting that higher temperature (under pressure) hydroethanolic extraction of G. turuturu may lead to even higher recoveries than those obtained in this study. Probably of a different chemical nature, with 50% (v/v) ethanol, cooler acidic extractions also resulted in the accumulation of substantial amounts of ORAC-active compounds. If these extracts are intended to be subjected to purification, despite the relatively low specific ORAC values at these conditions (pH between 4 and 7, temperature between 25 and 60 °C), then this less-energy consuming extraction mode might be of interest. On the other hand, for purification purposes, the highly active extracts of alkaline ethanol 50% (v/v) at room temperature fall short of high quantitative recovery. These extracts may be more suitable for direct applications of the crude extract given their inherent higher potency/concentration of active components.

5. Conclusions

The hydroethanolic extraction of Grateloupia turuturu, an invasive red macroalgae in the Iberian Peninsula, recognized for its potential for the cosmeceutical industry, has been thoroughly characterized regarding the effects of ethanol percentage, liquid-solid-ratio, time of extraction, temperature, and pH of the solvent in the yield of extract, UV-shielding potential, and antioxidant activity. Several critical observations regarding the equilibrium between high-value extracts and costs of operation were possible to perform. For instance, it was possible to demonstrate that for certain conditions, shorter extraction times, the extraction at room temperature, and the use of lower volumes of solvent are likely to be industrially more profitable than their counterparts, despite being a priori considered conditions of lower recovery of compounds to the extracts. More importantly, the data relating these five variables to these three effects is now available to the scientific community, which allows for further academic- and industry-oriented studies concerning biomass valorization.

Supplementary Materials

The following are available online at https://www.mdpi.com/2076-3417/10/15/5304/s1, Figure S1: Fit-real plots for the 10 models of response surface associated to the hydroethanolic SLE of G. turuturu, Figure S2: Statistical parameters associated to each factor/coefficient in the 10 models of response surface associated to the hydroethanolic SLE of G. turuturu, Table S1: Raw experimental data on yield, antioxidant activity and UV-shielding activity of the extracts produced in the two Box–Behnken designs performed of G. turuturu hydroethanolic SLE.

Author Contributions

Conceptualization, R.F. and M.F.F.L.; methodology, A.M.C.; software, R.F.; formal analysis, R.F.; investigation, R.F., A.M.C., and C.F.; writing—original draft preparation, R.F. and C.F.; writing—review and editing, A.M.C., S.C.N., and M.F.L.L.; supervision, S.C.N. and M.F.L.L.; project administration, M.F.F.L.; funding acquisition, M.F.L.L. All authors have read and agreed to the published version of the manuscript.

Funding

This study was supported by UID/MAR/04292/2019 with funding from FCT/MCTES through national funds and by a grant awarded to Rafael Félix (SFRH/ BD/139763/2018). The authors also wish to acknowledge the support of the European Union through EASME Blue Labs project AMALIA, Algae-to-MArket Lab IdeAs (EASME/EMFF/2016/1.2.1.4/03/SI2.750419), project VALORMAR (Mobilizing R&TD Programs, Portugal 2020) co-funded by COMPETE (POCI-01-0247-FEDER-024517), the Integrated Programme of SR&TD “Smart Valorization of Endogenous Marine Biological Resources Under a Changing Climate” (reference Centro-01-0145-FEDER-000018), co-funded by Centro 2020 program, Portugal 2020, European Union, and through the European Regional Development Fund, SAICTPAC/0019/2015—LISBOA-01-0145-FEDER-016405 Oncologia de Precisão: Terapias e Tecnologias Inovadoras (POINT4PAC).

Conflicts of Interest

The authors declare no conflict of interest. The funders had no role in the design of the study; in the collection, analyses, or interpretation of data; in the writing of the manuscript, or in the decision to publish the results.

References

  1. Kim, S.K.; Ravichandran, Y.D.; Khan, S.B.; Kim, Y.T. Prospective of the cosmeceuticals derived from marine organisms. Biotechnol. Bioprocess Eng. 2008, 13, 511–523. [Google Scholar] [CrossRef]
  2. Stengel, D.B.; Connan, S. Marine Algae: A Source of Biomass for Biotechnological Applications of the chapter. In Natural Products From Marine Algae; Humana: Louisville, KY, USA, 2015; Volume 1308. [Google Scholar]
  3. Freitas, C.; Araújo, R.; Bertocci, I. Patterns of benthic assemblages invaded and non-invaded by Grateloupia turuturu across rocky intertidal habitats. J. Sea Res. 2016, 115, 26–32. [Google Scholar] [CrossRef]
  4. Denis, C.; Massé, A.; Fleurence, J.; Jaouen, P. Concentration and pre-purification with ultrafiltration of a R-phycoerythrin solution extracted from macro-algae Grateloupia turuturu: Process definition and up-scaling. Sep. Purif. Technol. 2009, 69, 37–42. [Google Scholar] [CrossRef]
  5. Araújo, R.; Violante, J.; Pereira, R.; Abreu, H.; Arenas, F.; Sousa-Pinto, I. Distribution and population dynamics of the introduced seaweed Grateloupia turuturu (Halymeniaceae, Rhodophyta) along the Portuguese coast. Phycologia 2011, 50, 392–402. [Google Scholar] [CrossRef]
  6. Stiger-Pouvreau, V.; Zubia, M. Macroalgal diversity for sustainable biotechnological development in French tropical overseas territories. Bot. Mar. 2020, 63, 17–41. [Google Scholar] [CrossRef] [Green Version]
  7. Santos, S.A.O.; Félix, R.; Pais, A.C.S.; Rocha, S.M.; Silvestre, A.J.D. The Quest for Phenolic Compounds from Macroalgae: A Review of Extraction and Identification Methodologies. Biomolecules 2019, 9, 847. [Google Scholar] [CrossRef] [Green Version]
  8. Abidin, Z.Z.; Biak, D.R.A.; Yusoff, H.M.; Harun, M.Y. Solid-Liquid Extraction in Biorefinery. In Separation and Purification Technologies in Biorefineries; Ramaswamy, S., Huang, H.-J., Ramarao, B.V., Eds.; Wiley: Hoboken, NJ, USA, 2013; pp. 351–374. [Google Scholar]
  9. Do, Q.D.; Angkawijaya, A.E.; Tran-Nguyen, P.L.; Huynh, L.H.; Soetaredjo, F.E.; Ismadji, S.; Ju, Y.-H. Effect of extraction solvent on total phenol content, total flavonoid content, and antioxidant activity of Limnophila aromatica. J. Food Drug Anal. 2014, 22, 296–302. [Google Scholar] [CrossRef] [Green Version]
  10. Cardoso, I.; Cotas, J.; Rodrigues, A.; Ferreira, D.; Osório, N.; Pereira, L. Extraction and Analysis of Compounds with Antibacterial Potential from the Red Alga Grateloupia turuturu. J. Mar. Sci. Eng. 2019, 7, 220. [Google Scholar] [CrossRef] [Green Version]
  11. Sady, S.; Matuszak, L.; Błaszczyk, A. Optimisation of ultrasonic-assisted extraction of bioactive compounds from chokeberry pomace using response surface methodology. Acta Sci. Pol. Technol. Aliment. 2019, 18, 249–256. [Google Scholar] [CrossRef]
  12. Marcos, A.B.; Ricardo, E.S.; Eliane, P.O.; Leonardo, S.V.; Luciane, A.E. Response surface methodology (RSM) as a tool for optimization in analytical chemistry. Talanta 2008, 76, 965–977. [Google Scholar] [CrossRef]
  13. Maciel, O.M.C.; Tavares, R.S.N.; Caluz, D.R.E.; Gaspar, L.R.; Debonsi, H.M. Photoprotective potential of metabolites isolated from algae-associated fungi Annulohypoxylon stygium. J. Photochem. Photobiol. B Biol. 2018, 178, 316–322. [Google Scholar] [CrossRef] [PubMed]
  14. Dávalos, A.; Gómez-Cordovés, C.; Bartolomé, B. Extending Applicability of the Oxygen Radical Absorbance Capacity (ORAC-Fluorescein) Assay. J. Agric. Food Chem. 2004, 52, 48–54. [Google Scholar] [CrossRef] [PubMed]
  15. R Core Team R: A Language and Environment for Statistical Computing 2013. Available online: https://www.R-project.org/ (accessed on 24 April 2020).
  16. Lenth, R.V. Response-Surface Methods in {R.}, Using {rsm}. J. Stat. Softw. 2009, 32, 1–17. [Google Scholar] [CrossRef] [Green Version]
  17. Garnier, S. viridis: Default Color Maps from “matplotlib” 2018. Available online: https://cran.r-project.org/web/packages/viridis/index.html/ (accessed on 26 April 2020).
  18. RStudio Team RStudio: Integrated Development for R. 2015. Available online: https://https://rstudio.com// (accessed on 2 April 2020).
  19. Tiwary, B.K. Seaweed Sustainability—Food and Non-Food Applications. In Seaweed Sustainability; Tiwari, B.K., Troy, D.J., Eds.; Academic Press: Cambridge, MA, USA, 2015. [Google Scholar]
  20. Cavazzuti, M. Optimization Methods: From Theory to Design Scientific and Technological Aspects in Mechanics; Springer: Cham, Switzerland, 2013. [Google Scholar]
  21. Yang, Z.; Yang, H.H.; Yang, H.H. Characterisation of rheology and microstructures of κ-carrageenan in ethanol-water mixtures. Food Res. Int. 2018, 107, 738–746. [Google Scholar] [CrossRef]
  22. Ye, D.; Jiang, Z.; Zheng, F.; Wang, H.; Zhang, Y.; Gao, F.; Chen, P.; Chen, Y.; Shi, G. Optimized Extraction of Polysaccharides from Grateloupia livida (Harv.) Yamada and Biological Activities. Molecules 2015, 20, 16817–16832. [Google Scholar] [CrossRef]
  23. Tang, L.; Chen, Y.; Jiang, Z.; Zhong, S.; Chen, W.; Zheng, F.; Shi, G. Purification, partial characterization and bioactivity of sulfated polysaccharides from Grateloupia livida. Int. J. Biol. Macromol. 2017, 94, 642–652. [Google Scholar] [CrossRef]
  24. Zuhong, X.; Shengyao, S.; Zhien, L.; Yucai, G.; Xhingjun, Z. Study on carrageenan from Grateloupia filicina, Grateloupia filicina var. lomentaria and Pachymeniopsis elliptica. Oceanol. Limnol. Sin. 1996, 27, 499–504. [Google Scholar]
  25. Denis, C.; Morançais, M.; Li, M.; Deniaud, E.; Gaudin, P.; Wielgosz-Collin, G.; Barnathan, G.; Jaouen, P.; Fleurence, J. Study of the chemical composition of edible red macroalgae Grateloupia turuturu from Brittany (France). Food Chem. 2010, 119, 913–917. [Google Scholar] [CrossRef]
  26. Guo, M.Q.; Hu, X.; Wang, C.; Ai, L. Polysaccharides: Structure and Solubility. In Solubility of Polysaccharides; Intechopen Ltd.: London, UK, 2017. [Google Scholar]
  27. Torres, P.; Santos, J.P.; Chow, F.; Pena Ferreira, M.J.; dos Santos, D.Y.A.C. Comparative analysis of in vitro antioxidant capacities of mycosporine-like amino acids (MAAs). Algal Res. 2018, 34, 57–67. [Google Scholar] [CrossRef]
  28. Miller, I.J. The structure of polysaccharides from selected New Zealand species of Grateloupia. Bot. Mar. 2005, 48, 157–166. [Google Scholar] [CrossRef]
  29. Sen, A.K.; Das, A.K.; Sarkar, K.K.; Siddhanta, A.K.; Takano, R.; Kamei, K.; Hara, S. An agaroid-carrageenan hybrid type backbone structure for the antithrombotic sulfated polysaccharide from Grateloupia indica Boergensen (Halymeniales, Rhodophyta). Bot. Mar. 2002, 45, 331–338. [Google Scholar] [CrossRef]
  30. Wang, S.C.; Bligh, S.W.A.; Shi, S.S.; Wang, Z.T.; Hu, Z.B.; Crowder, J.; Branford-White, C.; Vella, C. Structural features and anti-HIV-1 activity of novel polysaccharides from red algae Grateloupia longifolia and Grateloupia filicina. Int. J. Biol. Macromol. 2007, 41, 369–375. [Google Scholar] [CrossRef] [PubMed]
  31. Chaves-Peña, P.; de la Coba, F.; Figueroa, F.L.; Korbee, N. Quantitative and Qualitative HPLC Analysis of Mycosporine-Like Amino Acids Extracted in Distilled Water for Cosmetical Uses in Four Rhodophyta. Mar. Drugs 2019, 18, 27. [Google Scholar] [CrossRef] [PubMed] [Green Version]
  32. Huovinen, P.; Gómez, I.; Figueroa, F.L.; Ulloa, N.; Morales, V.; Lovengreen, C. Ultraviolet-absorbing mycosporine-like amino acids in red macroalgae from Chile. Bot. Mar. 2004, 47, 21–29. [Google Scholar] [CrossRef]
  33. Shalaby, E.A. Algae as promising organisms for environment and health. Plant Signal. Behav. 2011, 6, 1338–1350. [Google Scholar] [CrossRef] [PubMed] [Green Version]
  34. Jiang, Z.; Chen, Y.; Yao, F.; Chen, W.; Zhong, S.; Zheng, F.; Shi, G. Antioxidant, Antibacterial and Antischistosomal Activities of Extracts from Grateloupia livida (Harv). Yamada. PLoS ONE 2013, 8, e80413. [Google Scholar] [CrossRef] [Green Version]
  35. Athukorala, Y.; Lee, K.W.; Song, C.; Ahn, C.B.; Shin, T.S.; Cha, Y.J.; Shahidi, F.; Jeon, Y.J. Potential antioxidant activity of marine red alga grateloupia filicina extracts. J. Food Lipids 2003, 10, 251–265. [Google Scholar] [CrossRef]
  36. Meireles, M.A.A. Extracting Bioactive Compounds for Food Products: Theory and Applications; CRC Press: Boca Raton, FL, USA, 2009. [Google Scholar]
  37. Chemat, F.; Strube, J. Green Extraction of Natural Products: Theory and Practice; Wiley-VCH: Weinheim, Germany, 2014. [Google Scholar]
  38. Li, H.; Zhang, H.; Zhang, Z.; Cui, L. Optimization of ultrasound-assisted enzymatic extraction and in vitro antioxidant activities of polysaccharides extracted from the leaves of Perilla frutescens. Food Sci. Technol. 2020, 40, 36–45. [Google Scholar] [CrossRef] [Green Version]
  39. Che Sulaiman, I.S.; Basri, M.; Fard Masoumi, H.R.; Chee, W.J.; Ashari, S.E.; Ismail, M. Effects of temperature, time, and solvent ratio on the extraction of phenolic compounds and the anti-radical activity of Clinacanthus nutans Lindau leaves by response surface methodology. Chem. Cent. J. 2017, 11, 54. [Google Scholar] [CrossRef]
  40. Sultana, B.; Anwar, F.; Ashraf, M. Effect of extraction solvent/technique on the antioxidant activity of selected medicinal plant extracts. Molecules 2009, 14, 2167–2180. [Google Scholar] [CrossRef]
  41. Garcia-Vaquero, M.; Rajauria, G.; O’Doherty, J.V.; Sweeney, T. Polysaccharides from macroalgae: Recent advances, innovative technologies and challenges in extraction and purification. Food Res. Int. 2017, 99, 1011–1020. [Google Scholar] [CrossRef] [Green Version]
  42. Joana Gil-Chávez, G.; Villa, J.A.; Fernando Ayala-Zavala, J.; Basilio Heredia, J.; Sepulveda, D.; Yahia, E.M.; González-Aguilar, G.A. Technologies for Extraction and Production of Bioactive Compounds to be Used as Nutraceuticals and Food Ingredients: An Overview. Compr. Rev. Food Sci. Food Saf. 2013, 12, 5–23. [Google Scholar] [CrossRef]
  43. Gertenbach, D.D. Solid-liquid extraction technologies for manufacturing nutraceuticals. In Functional Foods: Biochemical and Processing Aspects; CRC Press: Boca Raton, FL, USA, 2016. [Google Scholar]
  44. Al-Nahdi, Z.M.; Al-Alawi, A.; Al-Marhobi, I. The Effect of Extraction Conditions on Chemical and Thermal Characteristics of Kappa-Carrageenan Extracted from Hypnea bryoides. J. Mar. Biol. 2019, 2019, 1–10. [Google Scholar] [CrossRef] [Green Version]
  45. Carreto, J.I.; Carignan, M.O. Mycosporine-like amino acids: Relevant secondary metabolites. chemical and ecological aspects. Mar. Drugs 2011, 9, 387–446. [Google Scholar] [CrossRef]
Figure 1. Contour plots of the modelled function regarding the yield obtained during the first optimization of Grateloupia turuturu hydroethanolic solid-liquid extraction (SLE) using a Box–Behnken design, in the presence of different concentrations of solvent (ethanol). For each plot, XX axis indicates the liquid-solid ratio (LSR) and YY axis indicates extraction time. Color gradients represents the increase (yellow color) and decrease (blue color) in yield according to the tested variables. Below, the equation and goodness-of-fit statistical parameters for the variable Yield (g extract·g−1 biomass) in the first optimization process, according to the ethanol concentration (X1), LSR (X2), and extraction time (X3) are presented.
Applsci 10 05304 g001
Figure 2. Contour plots of the modelled function regarding the UV absorbance (per gram of extract) obtained during the first optimization of Grateloupia turuturu hydroethanolic SLE using a Box–Behnken design, in the presence of different concentrations of solvent (ethanol). For each plot, XX axis indicates the LSR and YY axis indicates extraction time. Color gradients represents the increase (yellow color) and decrease (blue color) in UV absorbance according to the tested variables. Below, the equation and goodness-of-fit statistical parameters for the variable UV absorbance (mL·cm−1·g−1 extract) in the first optimization process, according to the ethanol concentration (X1), (X2), and extraction time (X3) are presented.
Applsci 10 05304 g002
Figure 3. Contour plots of the modelled function regarding the total UV absorbance (per gram of biomass) obtained during the first optimization of Grateloupia turuturu hydroethanolic SLE using a Box–Behnken design, in the presence of different concentrations of solvent (ethanol). For each plot, XX axis indicates the LSR and YY axis indicates extraction time. Color gradients represents the increase (yellow color) and decrease (blue color) in total UV absorbance according to the tested variables. Below, the equation and goodness-of-fit statistical parameters for the variable total UV absorbance (mL·cm−1·g−1 biomass) in the first optimization process, according to the ethanol concentration (X1), LSR (X2), and extraction time (X3) are presented.
Applsci 10 05304 g003
Figure 4. Contour plots of the modelled function regarding the oxygen radical absorbance capacity (ORAC) activity (per gram of extract) obtained during the first optimization of Grateloupia turuturu hydroethanolic SLE using a Box–Behnken design, in the presence of different concentrations of solvent (ethanol). For each plot, XX axis indicates the LSR and YY axis indicates extraction time. Color gradients represents the increase (yellow color) and decrease (blue color) in ORAC activity according to the tested variables. Below, the equation and goodness-of-fit statistical parameters for the variable antioxidant activity by ORAC method (µmol TE·g−1 extract) in the first optimization process, according to the ethanol concentration (X1), LSR (X2), and extraction time (X3) are presented.
Applsci 10 05304 g004
Figure 5. Contour plots of the modelled function regarding the total ORAC activity (per gram of biomass) obtained during the first optimization of Grateloupia turuturu hydroethanolic SLE using a Box–Behnken design, in the presence of different concentrations of solvent (ethanol). For each plot, XX axis indicates the LSR and YY axis indicates extraction time. Color gradients represents the increase (yellow color) and decrease (blue color) in total ORAC activity according to the tested variables. Below, the equation and goodness-of-fit statistical parameters for the variable total ORAC activity (µmol TE·g−1 biomass) in the first optimization process, according to the ethanol concentration (X1), LSR (X2), and extraction time (X3) are presented.
Applsci 10 05304 g005
Figure 6. Contour plots of the modelled function regarding the yield obtained during the second optimization of Grateloupia turuturu hydroethanolic SLE using a Box–Behnken design, in the presence of different concentrations of solvent (ethanol). For each plot, XX axis indicates the pH and YY axis indicates temperature. Color gradients represents the increase (yellow color) and decrease (blue color) in yield according to the tested variables. Below, the equation and goodness-of-fit statistical parameters for the variable yield (g extract·g−1 biomass) in the second optimization process, according to the ethanol concentration (X1), temperature (X2), and pH (X3) are presented.
Applsci 10 05304 g006
Figure 7. Contour plots of the modelled function regarding the UV absorbance (per gram of extract) obtained during the second optimization of Grateloupia turuturu hydroethanolic SLE using a Box–Behnken design, in the presence of different concentrations of solvent (ethanol). For each plot, XX axis indicates the pH and YY axis indicates temperature. Color gradients represents the increase (yellow color) and decrease (blue color) in UV absorbance according to the tested variables. Below, the equation and goodness-of-fit statistical parameters for the variable UV absorbance (mL·cm−1·g−1 extract) in the second optimization process, according to the ethanol concentration (X1), temperature (X2), and pH (X3) are presented.
Applsci 10 05304 g007
Figure 8. Contour plots of the modelled function regarding the total UV absorbance (per gram of biomass) obtained during the second optimization of Grateloupia turuturu hydroethanolic SLE using a Box–Behnken design, in the presence of different concentrations of solvent (ethanol). For each plot, XX axis indicates the pH and YY axis indicates temperature. Color gradients represents the increase (yellow color) and decrease (blue color) in total UV absorbance according to the tested variables. Below, the equation and goodness-of-fit statistical parameters for the variable total UV absorbance (mL·cm−1·g−1 biomass) in the second optimization process, according to the ethanol concentration (X1), temperature (X2), and pH (X3) are presented.
Applsci 10 05304 g008
Figure 9. Contour plots of the modelled function regarding the ORAC activity (per gram of extract) obtained during the second optimization of Grateloupia turuturu hydroethanolic SLE using a Box–Behnken design, in the presence of different concentrations of solvent (ethanol). For each plot, XX axis indicates the pH and YY axis indicates temperature. Color gradients represents the increase (yellow color) and decrease (blue color) in ORAC activity according to the tested variables. Below, the equation and goodness-of-fit statistical parameters for the variable antioxidant activity by ORAC method (µmol TE·g−1 extract) in the second optimization process, according to the ethanol concentration (X1), temperature (X2), and pH (X3) are presented.
Applsci 10 05304 g009
Figure 10. Contour plots of the modelled function regarding the total ORAC activity (per gram of biomass) obtained during the second optimization of Grateloupia turuturu hydroethanolic SLE using a Box–Behnken design, in the presence of different concentrations of solvent (ethanol). For each plot, XX axis indicates the pH and YY axis indicates temperature. Color gradients represents the increase (yellow color) and decrease (blue color) in total ORAC activity according to the tested variables. Below, the equation and goodness-of-fit statistical parameters for the variable total ORAC activity (µmol TE·g−1 biomass) in the second optimization process, according to the ethanol concentration (X1), temperature (X2), and pH (X3) are presented.
Applsci 10 05304 g010
Table 1. Independent variables tested during the first optimization of the extraction process using a Box–Behnken design: ethanol percentage (X1), liquid-solid ratio (LSR) (X2), and extraction time (X3).
RunCoded VariablesActual Variable Values
(X1)(X2)(X3)% EtOH (v/v) (X1)LSR (mL·g−1) (X2)Time (Minutes) (X3)
1−10−102520
210−1502520
3−101025100
41015025100
5−1−1001060
6−11004060
71−10501060
8110504060
90−1−1251020
100−112510100
1101−1254020
120112540100
13000252560
14000252560
15000252560
Table 2. Independent variables tested during the second optimization of the extraction process using a Box–Behnken design: ethanol percentage (X1), extraction temperature (X2), and pH (X3).
RunCoded VariablesActual Variable Values
(X1)(X2)(X3)% EtOH (v/v) (X1)Temperature (°C) (X2)pH (X3)
10−1−125254
20−11252510
301−125954
4011259510
5−10−10604
610−150604
7−10106010
8101506010
9−1−100257
10−1100957
111−1050257
1211050957
1300025607
1400025607
1500025607

