Article

Mineral Carbonation of CO2 in Mafic Plutonic Rocks, II—Laboratory Experiments on Early-Phase Supercritical CO2‒Brine‒Rock Interactions

1
Departamento de Geociências, Escola de Ciências e Tecnologia, Universidade de Évora, Rua Romão Ramalho 59, 7000-671 Évora, Portugal
2
Laboratório HERCULES, Universidade de Évora, Largo Marquês de Marialva 8, 7000-809 Évora, Portugal
3
Instituto Geológico y Minero de España, C/Matemático Pedrayes 25, 33005 Oviedo, Spain
4
Instituto de Ciências da Terra, Universidade de Évora, Rua Romão Ramalho 59, 7000-671 Évora, Portugal
5
Departamento de Química, Escola de Ciências e Tecnologia, Universidade de Évora, Rua Romão Ramalho 59, 7000-671 Évora, Portugal
*
Author to whom correspondence should be addressed.
Appl. Sci. 2020, 10(15), 5083; https://doi.org/10.3390/app10155083
Submission received: 16 June 2020 / Revised: 20 July 2020 / Accepted: 21 July 2020 / Published: 23 July 2020

Abstract

:
The potential for mineral carbonation of CO2 in plutonic mafic rocks is addressed through a set of laboratory experiments on cumulate gabbro and gabbro-diorite specimens from the Sines Massif (Portugal). The experiments were conducted in an autoclave, for a maximum of 64 days, using a CO2 supersaturated brine under pressure and temperature conditions similar to those expected around an injection well during early-phase CO2 injection. Multiple techniques for mineralogical and geochemical characterization were applied ante- and post-carbonation experiments. New mineralogical phases (smectite, halite and gypsum), roughness increase and material loss were observed after exposure to the CO2 supersaturated brine. The chemical analysis shows consistent changes in the brine and rock specimens: (i) increases in iron (Fe) and magnesium (Mg) in the aqueous phase and decreases in Fe2O3 and MgO in the specimens; (ii) a decrease in aqueous calcium (Ca) and an increase in CaO in the cumulate gabbro, whereas in the gabbro-diorite aqueous Ca increased and afterwards remained constant, whereas CaO decreased. The geochemical model using the CrunchFlow code was able to reproduce the experimental observations and simulate the chemical behavior for longer times. Overall, the study indicates that the early-stage CO2 injection conditions adopted induce mainly a dissolution phase with mineralogical/textural readjustments on the external area of the samples studied.

Graphical Abstract

1. Introduction

The International Energy Agency, in its flagship report “Energy Technology Perspectives”, has demonstrated that CO2 capture, utilization and storage (CCUS) is a key technology for CO2 emissions reduction, essential to achieve the targets set in the Paris Agreement [1].
In the CCUS chain of technologies, CO2 is captured in large stationary sources and transported to a utilization or permanent storage in deep geological formations [2,3]. Adequate geological environments for CO2 storage are provided by depleted hydrocarbon reservoirs, uneconomic coal seams, deep saline aquifers or mafic and ultramafic rocks [4,5,6,7,8]. The latter relies on the effectiveness of mineral carbonation, in which the CO2 reacts with the enriched calcium (Ca), magnesium (Mg) and iron (Fe) minerals, to precipitate as carbonate minerals, thus ensuring safe and permanent sequestration of the CO2 in solid phases.
Most subsurface carbon storage projects to date have injected CO2 into sedimentary formations, either deep saline aquifers or hydrocarbon fields, but the exciting results obtained at two pilot sites where CO2 is injected in basalts, the Carbfix and Wallula projects [9,10], have raised the profile of mafic and ultramafic rocks as suitable candidates for in situ mineral carbonation.
Although at a less developed research stage than other CO2 storage environments, the possibility of using mafic and ultramafic rock massifs should be considered when they occur near major CO2 emission sources. That is the case of the main industrial clusters in Sines and Setúbal. As described in an accompanying article [11], mafic and ultramafic rock massifs in southern Portugal may present a valid alternative for mineral carbonation (be it in situ, ex situ, or even enhanced weathering) of CO2 captured in that cluster. The interested reader is directed to that paper for details on the rationale for selecting the rock massifs and their characterization.
CO2–brine–rock interaction experiments are a well-established method to understand and explore the mechanisms and processes of geological storage [12,13]. However, unlike most previous experiments, this article focuses on mafic plutonic rocks. These have seldom been considered for in situ mineral carbonation, given the low porosity and permeability, but previous experiments on ex situ or enhanced weathering applications have been published (e.g., [14,15]).
This study deals with mineral carbonation experiments, in the laboratory, to assess the rate of reaction between CO2 and rock samples from the Sines Massif, a subvolcanic massif mainly composed of gabbros, diorites and subordinated syenites. The laboratory experiments were designed to replicate the early stages of interaction between the mineral phases and a brine supersaturated in CO2, as one would expect around an injection well. Indeed, we attempted to understand the initial dissolution of the rock minerals that should provide the cations to react with the dissolved CO2.
The possible mineralogical‒textural changes of the rock after interaction with brine‒CO2 was studied by a multi-analytical approach (optical microscopy (OM); scanning electron microscopy with X-ray detector (SEM-EDS); X-ray diffraction (XRD); and infrared Fourier transform spectroscopy (FTIR)) and the chemical compositional evolution of the brine and whole rock by comparative analyses (inductively coupled plasma optical emission spectrometry (ICPM-OES) and X-ray fluorescence (XRF)) before and after the experiment. Finally, numerical geochemical computation (CrunchFlow code) was used to interpret, replicate and predict the system’s behavior for periods of time longer than 64 days, the maximum duration of the experiments.
The article is organized as follows: a brief background on mineral carbonation experiments and tests is presented, followed by a description of the methodology applied to characterize the rock samples and conduct the laboratory experiments. The results are then interpreted and discussed in terms of the chemical and mineral changes observed in the brine and rock surface, and according to a numerical model that reproduces the laboratory experiments and extrapolates them to longer times.

2. Background on Mineral Carbonation Experiments and Tests

During mineral carbonation, the conversion of CO2 to stable minerals starts with the CO2 dissolution in the aqueous phase, a function of the fluid ionic strength, pressure and temperature [16]. The resulting carbonic acid (H2CO3) decomposition releases hydrogen protons (H+), lowering the pH (Equation (1)). Subsequent consumption of the H+ due to reaction with the Mg‒Ca‒Fe-rich minerals releases the metallic cations and increases the pH of the solution (Equations (2) to (6)). At suitable pH and saturation conditions, cations combine with hydrogen carbonate and form (Ca, Mg, Fe) CO3.
CO2 (g) + H2O (aq) = H2CO3 (aq) = H+ (aq) + HCO3 (aq)
(Forsterite) Mg2SiO4 (s) + 4H+ (aq) = 2Mg2+ (aq) + SiO2(aq) + 2H2O (l)
(Ca-plagioclase) CaAl2Si2O8 (s) + 8H+(aq) = Ca2+ (aq) + 2Al3+ (aq) + 2SiO2(aq) + 4H2O (l)
(Clinopyroxene) CaMgSi2O6 (s) + 4H+ (aq) = Ca2+ (aq) + Mg2+ (aq) + 2SiO2(aq) + 2H2O (l)
Mg2+ (aq) + HCO3 (aq) = MgCO3 (s) + H+ (aq)
Mg2+ (aq)+ Ca2+ (aq) + 2HCO3 (aq) = (Ca,Mg)CO3 (s) + 2H+ (aq)
Numerous laboratory experiments have been performed to study the reactivity of olivine, serpentine, pyroxene, amphibole and plagioclase mineral groups, and glass basalt lavas with CO2-enriched solutions [17,18,19,20]. Most of these experiments were conducted in batch conditions at controlled pressure, temperature and PCO2, using crushed rock. Sodium hydrogen carbonate (NaHCO3) is often added in the reactor to increase the hydrogen carbonate concentration in solution and buffer the pH up to 7.7 and 8.0 [21]. This pH range, temperatures from 155 °C to 185 °C and total pressures from 11.5 MPa to 19 MPa [21,22,23] provide the optimal conditions for carbonation enhancement.
In general, the parameters that affect the rate of carbonate minerals’ precipitation are brine composition, temperature, pressure and, principally, pH [24]. Mineral carbonation is favored over a higher pH—for instance, above 6.5 pH for Ca‒Mg carbonates [25] or above 9.0 pH for CaCO3 [9].
In the CarbFix project, the water in the Hellisheidi carbon injection site has a temperature ranging from 15 to 35 °C and the in situ pH ranges from 8.4 to 9.8 [26]. The injected water (with dissolved CO2) has a temperature of 25 °C and a pH of 3.7 to 4.0 [27]. According to. [28], during the injection phase, the water with CO2 will create porosity in the near vicinity of the injection by dissolving primary and secondary minerals. Furthermore, away from the injection well, secondary minerals will precipitate due to the reaction with the Ca‒Mg‒Fe-rich reservoir rocks.
Other authors [14,29,30] observed a decrease in the permeability of the carbonated rock. Inter- and intragranular pores (10 μ m pore throats) were filled with magnesite and characterized using μ Raman and SEM-TEM images. SEM-TEM observations [14] showed a magnesite layer separated from the olivine by submicron siderite grains, and poorly crystallized phyllosilicates. Iron oxide and amorphous silica are also observed as secondary phases in batch and flow-through experiments [14,22,29]. Phyllosilicates and chalcedony affect both the porosity and permeability, causing a decrease in the carbonation rate due to the creation of an exfoliated passivation layer rich in silica.
Carbonation experiments have been performed by [31] on continental flood basalt (CFB) samples (10.3 MPa and 90 °C) from eastern Washington, and by Schaef and McGrail [32] in basalt samples representing formations from North America, India and Africa.
Both studies noted that calcite was the first mineral to precipitate. For instance, Schaef and McGrail [32] observed small calcite nodules precipitating after 86 days. Post-reacted samples from Deccan basalts [32] displayed larger and opaque precipitates (after 280 days) and more reddish-brown grains containing a large calcite component (66.0–82.0 wt. %) and minor magnesite (9.1–22.0 wt. %) or siderite (3.1–15.0 wt. %) components. The basalt grains representing Southern Africa (Karoo) were insignificantly reactive, displaying very few carbonate nodules with high Mg (31.0 wt. %) and Fe (29.0 wt. %) contents. More recent basalt carbonation experiments have been performed by [33] on recent Auckland basalt (0.3 Ma). After 140-day experiments (100 °C and 5.5 MPa), they observed ankerite and aluminosilicates as secondary precipitation and an increase in both porosity and permeability. This observation contrasts with the major reported carbonation studies [29,30], where the permeability was observed to decrease due to carbonate growth. Theoretical and experimental studies of rock‒CO2 interactions in wet conditions and low temperature (25–90 °C) and first phases (0.5–100 days) indicate the presence of chemical reactions and, consequently, textural‒mineralogical‒chemical changes [25]. However, according to [25], in order to optimize low-temperature mineral carbonations, an “equilibrium” between initial CO2 (acid supply), rock to water ratio and temperature needs to be adjusted in order to effectively mineralize CO2 within a reasonable time scale.

3. Methodology

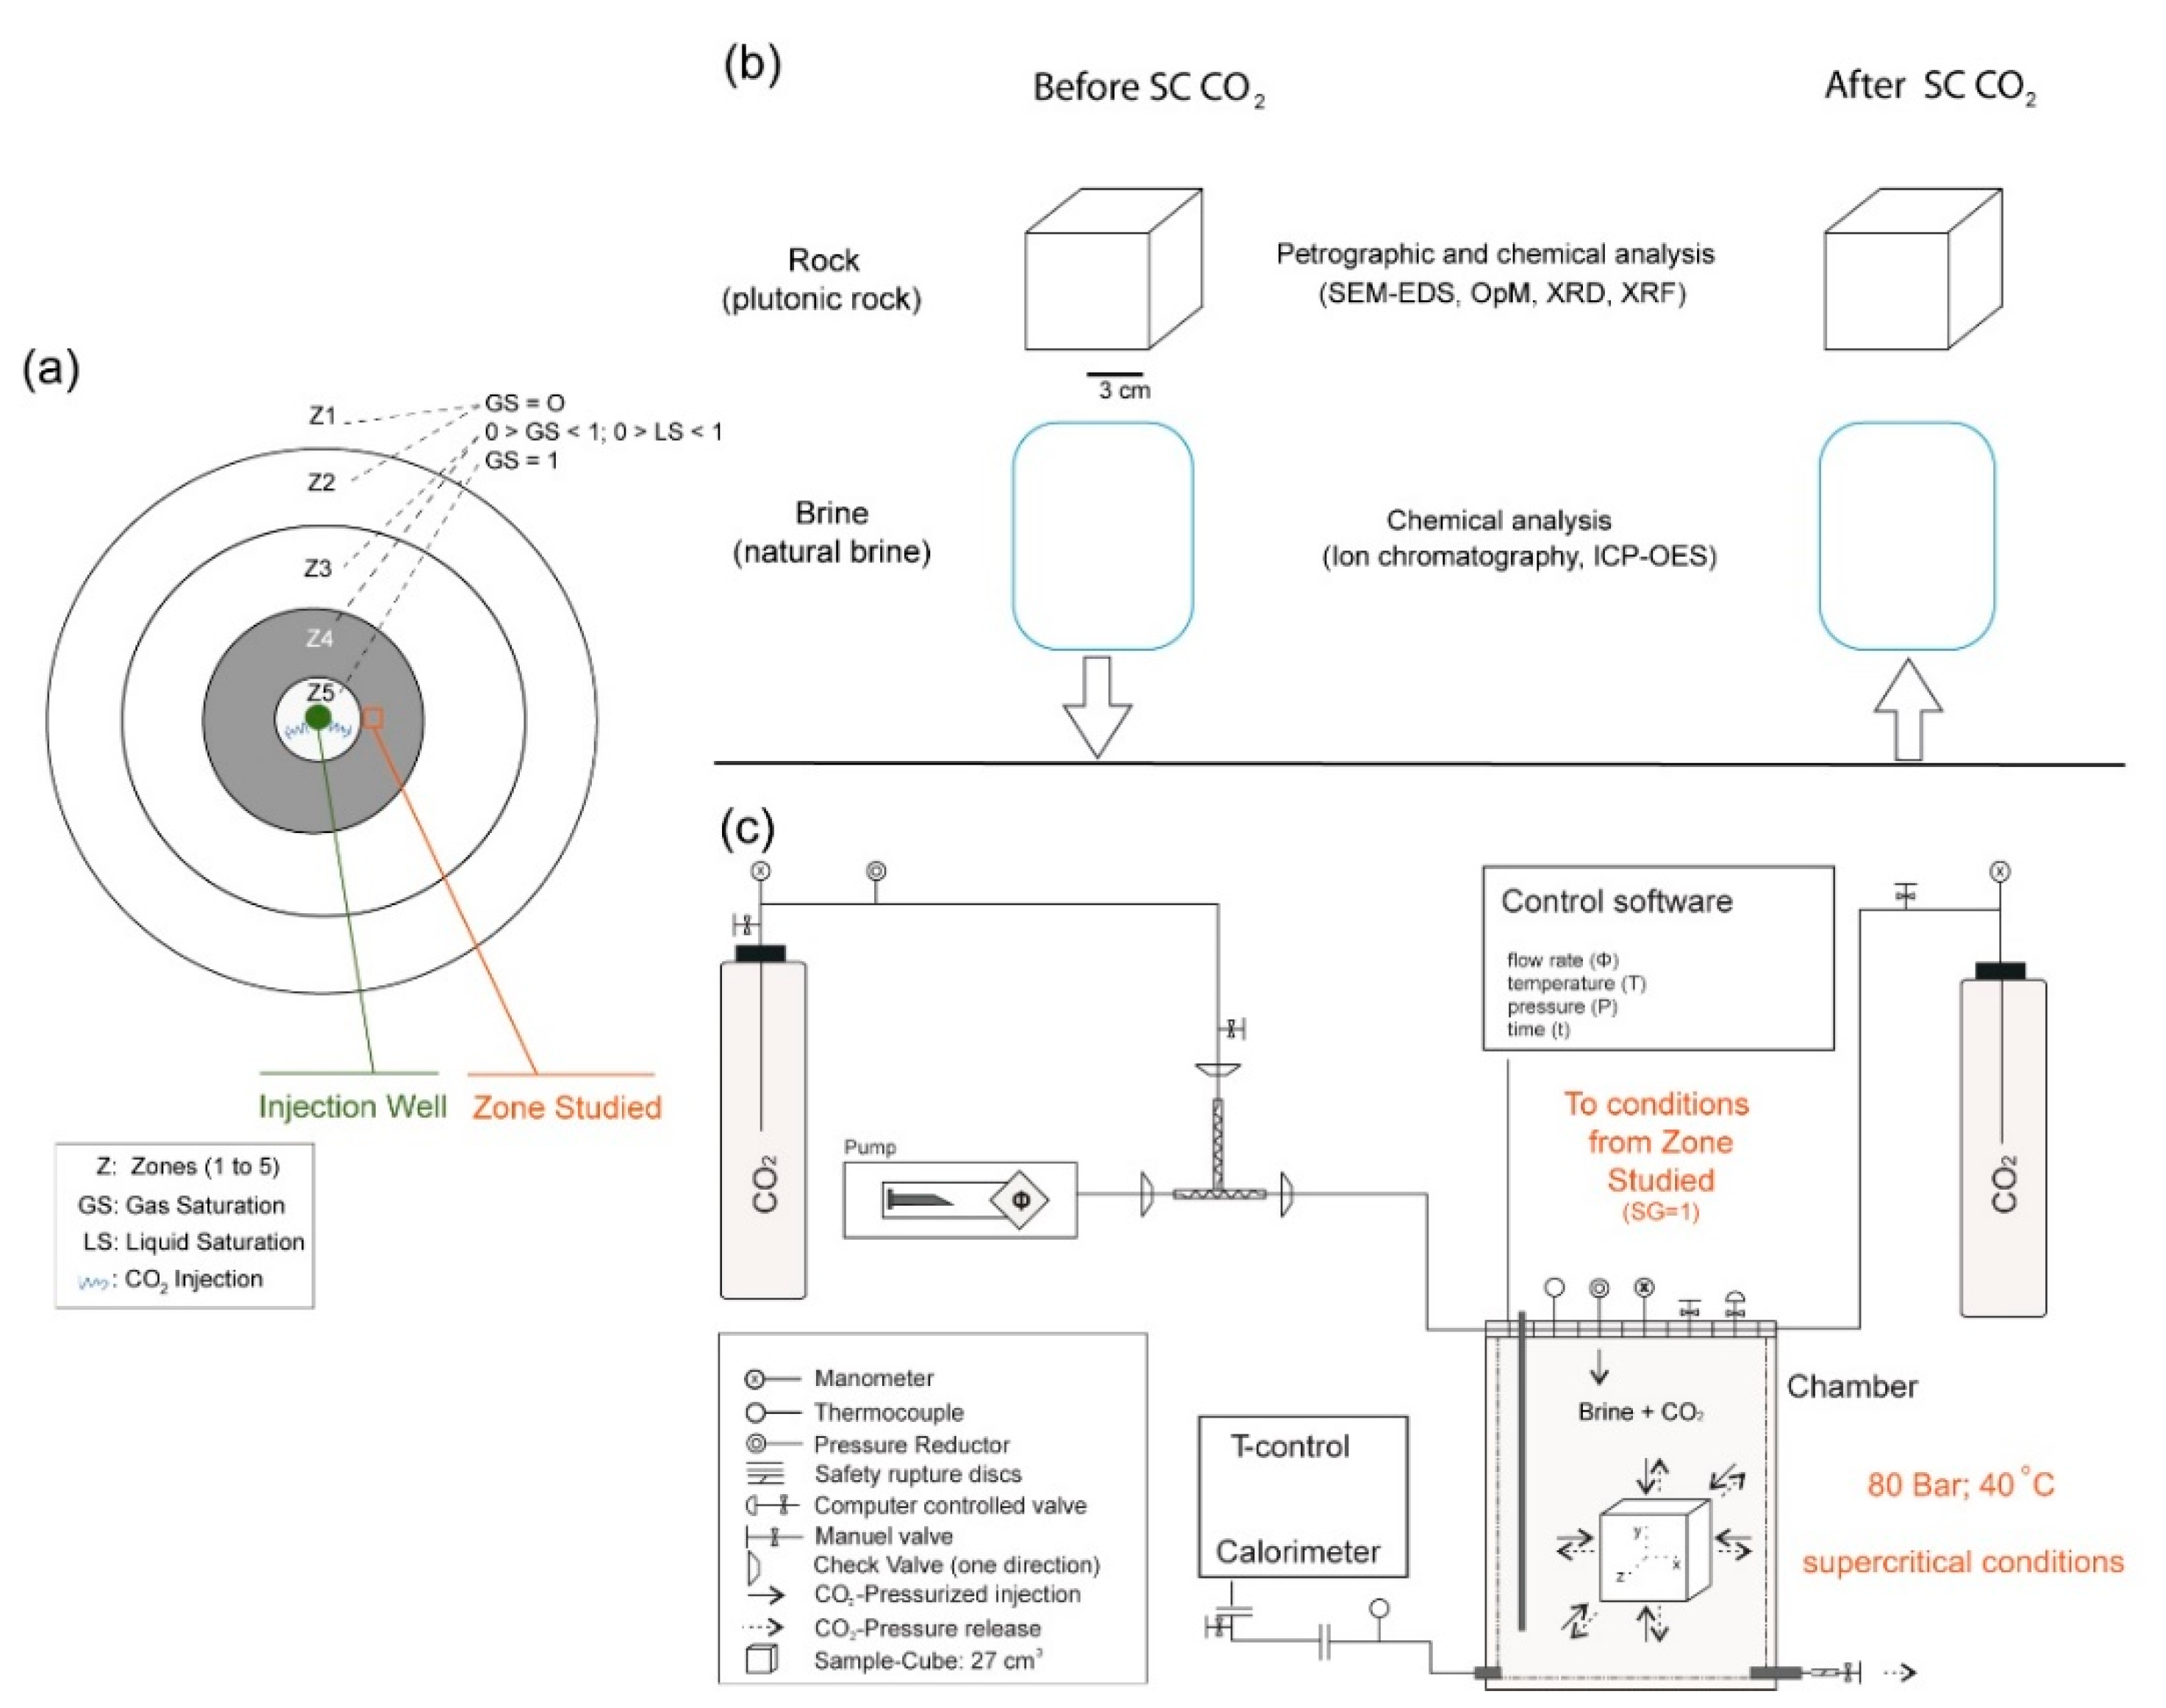
To evaluate the potential for mineral carbonation in plutonic mafic rocks, a six-step methodology was followed (Figure 1):
  • Selection of representative samples for study and definition of conceptual conditions (rock‒brine‒CO2) to be studied (Figure 1 and Figure 2a).
  • Mineralogical, textural and chemical characterization of the specimens before exposure to brine and supercritical CO2 (SC CO2) (Figure 1 and Figure 2b).
  • Exposure of the specimens to CO2 supersaturated brine at selected conditions (supercritical CO2: 8 MPa and 40 °C) in the autoclave (Figure 1 and Figure 2c): (a) Stage 1—CO2 pressurized injection (3 h); (b) Stage 2—CO2 pressurized stabilization (1, 4, 16 and 64 days) and (c) Stage 3 CO2—pressure release (3 h).
  • Upon conclusion of the laboratory experiments in Step 3, mineralogical, textural and chemical characterization of specimens and brine chemical analysis were conducted.
  • Geochemical modelling of the mineral carbonation experiments using CrunchFlow.
  • Interpretation of results and correlation of experimental and modelling data.

3.1. Materials

Two different lithologies of igneous rock from the Sines Massif, Portugal were sampled and used in the experiments: (i) Experiment 1 with a cumulate gabbro (CG) from a cliff near Praia do Norte and (ii) Experiment 2 with a gabbro-diorite (GD) sampled at quarry Monte Chãos [11].
The CG displays a medium to coarse cumulate texture and is formed of clinopyroxene (45–55%), olivine (15–20%), brown amphibole (10–15%), plagioclase (5–10%) and primary ilmenite (5%); it occasionally shows accessory alteration products (e.g., chlorite, actinolite, serpentine). The GD exhibits a layered medium to coarse texture and is composed of plagioclase (50–60%), clinopyroxene (20–25%), subordinate olivine (5–10%), biotite (10–15%) and ilmenite (5–10%). Despite some fractures with chlorite and incipient sericitization, the sample has no significant alteration.
The coarse-grained CG sample was cut into 40 subsample cubes of 27 cm3 each and four of 1 cm3. They were divided in four run sets and one reference set (0-day set). For Experiment 1, each set of specimens had seven cubes of 27 cm3, two parallelepipeds of 27/2 cm3 and one of 1 cm3 (Table 1). The coarse-grained gabbro-diorite sample was cut into 80 subsamples cubes of 27 cm3 each and four of 1 cm3. For Experiment 2, each set of specimens had 15 cubes of 27 cm3, two parallelepipeds of 27/2 cm3 and one of 1 cm3 (Table 1).
The brine used in the experiments is a natural brine sampled from an old borehole in a saline aquifer (see Section 4.2).

3.2. Experimental Procedure (Autoclave)

The experimental setup of the autoclave employed in this experiment (Figure 2c) is based on similar systems described by [37] and [38]. Specific initial conditions in the autoclave were considered due to the planned target: sample material (rock-type and representative sample size), geological environment (pressure, temperature and salinity) and technical equipment (materials for chamber, software, pumps, etc.) for the final arrangement of the experimental device and run conditions. The autoclave (Figure 2c) [36,39] has two CO2 cylinders (standard industrial CO2 at 4.5 MPa) that are linked to the other elements of the system by steel connectors (diameter: 5 mm). The first CO2 cylinder is directly connected with the chamber. The second CO2 cylinder is connected to a piston pump that operates with a flow of 0.01 g/s. In case of gas leakage in the chamber during the experiment, this pump maintains the experimental pressure defined for the test. The inside of the chamber has a capacity of 2 dm3. This is coated with polytetrafluoroethylene (PTFE) to protect the material against corrosion. At the bottom of the chamber, a thermostat controls the internal temperature. The calorimeter and pump are linked to the chamber with pressure and temperature sensors and are connected to a computer.
In detail, the experiment consisted of exposure of mafic rocks to CO2-supersaturated brine (i.e., SC CO2-rich brine) in the autoclave to a pressure (P) of 8 MPa and to a temperature (T) of 40 °C without flow. The P and T conditions were selected to exceed the CO2 supercritical (SC CO2) point [40,41] and to simulate the conditions of injection and storage of CO2 [2,42]. These conditions are representative to a depth of approx. 800 m. The selected exposure time (1, 4, 16 and 64 days) was chosen to identify possible changes in the rock (dissolutions and/or precipitation) during the first injection phases.
The experiments began with the immersion of specimen rocks within natural brine in the chamber. Once the rock is introduced and fully immersed in the brine, CO2 is injected (Table 1).
The experimental runs comprised: (a) a pressurized CO2 injection (3 h, from 4.5 MPa and 20 °C conditions to the SC condition); (b) a pressurized stabilization (period of test, no CO2 flow inside the chamber) and (c) CO2 pressure release (3 h, from supercritical conditions to ambient conditions). The final volume of CO2 in chamber to 80 bar and 40 °C was (i) 1184 cm3 in experiment with CG and (ii) 218 cm3 in experiment with gabbro-diorite. The times of filling and emptying the chamber with SC CO2 were the same (3 h, from ambient conditions to supercritical conditions and supercritical conditions to ambient conditions, respectively), following the chamber manufacturer’s recommendations. This is the time required to reach the target pressure and temperature values from the initial ambient conditions.

3.3. Material Characterization

To obtain a precise characterization of the rock specimens and to evaluate the changes after SC CO2 exposure, in mineralogy, texture and chemistry, a set of complementary analytical techniques was repeatedly applied.
Petrography on thin-sections, by optical microscopy (OM), was performed by a Leica bright-field microscope (LEICA DM 2500P, Wetzlar, Germany).
The X-ray powder and in situ diffractograms were produced using a Bruker AXS-D8 Advance (Bruker Corp., Billerica, MA, USA), with Cu-Kα radiation (λ = 0.1540598 nm), under the following conditions: scanning between 3° and 75° (2θ), scanning velocity of 0.05° 2θ/s, accelerating voltage of 40 kV, and current of 40 mA. In order to evaluate the mineralogical composition of the specimen surface, in situ grazing incidence geometry experiments were conducted, with incidence of 1.5° and 2θ scanning from 8 to 60°.
A Hitachi S-3700N SEM (Hitachi High Technologies, Berlin, Germany), coupled with a Bruker XFlash 5010 SDD detector (Bruker Corp, Billerica, MA, USA), was used for the surface sample chemical analysis. The analysis was performed under a low vacuum at 40 Pa, with a current of 20 kV. An infrared spectrometer Bruker Hyperion 3000 equipped with a single-point MCT detector cooled with liquid nitrogen and a 20 × ATR objective with a Ge crystal of 80 μm diameter was used.
An infrared spectrometer Brüker Hyperion 3000 equipped with a single-point MCT detector cooled with liquid nitrogen and a 20 × an attenuated total reflectance (ATR) objective with a Ge crystal of 100 μm diameter was used. The infrared spectra were acquired with a spectral resolution of 4 cm−1, 32 scans, in the 4000‒650 cm−1 region. In order to ensure the representativeness of the data, each cube was analysed in nine different spots, screening the most exposed surface, and each spot was analysed three times.
The whole-rock geochemistry analysis was provided by XRF, which allows for the quantification of major oxides (SiO2, TiO2, Al2O3, Na2O, K2O, CaO, MgO, MnO, FeO, P2O5), sulfur and some minor elements (Rb, Sr, Y, Zr, Nb, Th, Cr, Co, Ni, Cu, Zn, Ga, As, Pb, Sn, V, U, Cl). Analyses were performed with an S2 Puma energy-dispersive X-ray spectrometer (Bruker), using a methodology similar to that adopted by [43]. A description of the standard reference materials (SRM) utilized in the calibration method can be found elsewhere [44]. After the determination of loss on ignition (LOI), samples were fused on a Claisse LeNeo heating chamber, using a flux (Li‒tetraborate) to prepare fused beads (ratio sample/flux = 1/10). The software utilized for acquisition and data processing was Spectra Elements 2.0, which reported the final oxide/element concentrations and the instrumental statistical error (Stat. error) associated to the measurement.
OM, XRD, XRF, FTIR and SEM-EDS analyses were performed at HERCULES Laboratory (University of Évora, Portugal).
Linear roughness was measured by a homemade microprofilometer consisting of 55 parallel needles put in contact. The spacing between the needles’ center-line is 500 µm for a total measurable length of 3.5 mm. After the profile measure, a photo of the needles’ position was taken. Profiles of the samples were detected by drawing a line joining all the extremities of the needles, with the help of Adobe Photoshop CC 2018. The profile line in JPG format was uploaded on online software (WebPlotDigitizer, https://apps.automeris.io/wpd/) that allowed us to identify the X and Y values of the line according to the pixels composing the JPG photo. Pixel values were later converted to microns according to a scale.
The brine analyses were performed at IGME (Madrid, Spain) by ion chromatography (Dionex 600 de Vertex) and ICP-OES (Varian Vista MPX) before and after the experiment on each run. Iron and magnesium brine content determination, from Experiment 1, was performed at HERCULES Laboratory (Évora, Portugal) with an Agilent 8800 ICP Triple Quad (ICP-QQQ), operating with an RF power of 1550 W, RF matching of 1.7 V, a sample depth of 10 mm, carrier gas (Ar) of 1.1 L/min and plasma gas (Ar) of 15 L/min. Prior to the analysis, the equipment was calibrated with a tuning solution from Agilent, and the sensitivity and resolution were optimized and the doubly charged ions (< 1.84%) and oxides (< 1.10%) were minimized.

3.4. Geochemical Modelling

3.4.1. Code Descriptions and Capabilities

The simulations were performed using CrunchFlow [45,46], a multicomponent reactive flow and transport code for studying fluid rock interactions in porous media. The reactive transport code has many advantages such as a complete equilibrium thermodynamic treatment, flexible kinetic rate law formulations for each mineral depending on the reaction mechanism, and a range of 3D flow capabilities. The reactive transport code [47] numerically solves the mass balance of solutes, as shown in Equation (7):
( ϕ C j ) t = · ( D C j ) ( q C j ) + R j   ( j = 1 ,   2 ,   3 n )
where ϕ is the updated porosity, Cj is the concentration of component j (mol m−3), q is the Darcy velocity (m s−1), Rj is the total reaction rate affecting component j (mol m−3 s−1) and D is the combined dispersion‒diffusion coefficient (m2 s−1). The carbonation experiments were conducted in closed batch conditions, that is, without flow, so that Equation (7) can be simplified as Equation (8):
( ϕ C j ) t = R j   ( j = 1 ,   2 ,   3 n )
The reaction rate is only described as function of time. The mineral dissolution to aqueous phases and precipitation of secondary phases are kinetically controlled, thus a reaction rate is given in term of primary species. The reaction kinetic is treated based on the rate law types including the transition state theory (TST), irreversible, monod, dissolution only and precipitation only [46]. In this work, a common theoretical framework provided by the TST rate law [48,49,50] is adopted. The dissolution and precipitation are treated as reversible at equilibrium, by explicitly including a dependence on Gibbs energy or saturation state (Equation (9)):
R m = A m k m (   a n ) | ( Q m K e q ) n 1 | m
where Rm is the rate of precipitation (rate > 0) or dissolution (rate < 0) of mineral m in mol L−1 s−1, Am is the reactive surface area and km the kinetic constant of mineral m (in mol.m−2.s−1). The sign of the saturation index Ω = log ( Q m K e q ) determines the sign of the reaction rate. Negative means dissolution and positive means precipitation. The kinetic constant at given temperature T (K) is calculated from Equation (10):
k = k 25 Exp [ E a R ( 1 T + 1 298.15 ) ]
where k25 is the kinetic constant at 25 °C, Ea is the apparent activation energy (KJ mol−1) and R is the gas constant (J mol−1K−1). The change in initial porosity ( ϕ i ) and mineral bulk surface area (Am) owing to dissolution is computed from Equation (11):
A m = A initial ( ϕ m ϕ ( i ) m ) 2 3 ( ϕ ϕ i )
and the change due to precipitation is computed from Equation (12):
A m = A initial ( ϕ ϕ i ) .

3.4.2. Input Conditions for Rock and Fluid Composition

The numerical simulations presented in this article only describe the CG experiments; modelling of the gabbro-diorite experiments is ongoing and will be described elsewhere. The initial mineral composition of the rock was derived from Canilho [51] and adjusted with petrography and mineral chemistry, obtained through SEM-EDS [11]. For the numerical simulations, it was assumed that CG is mainly composed of clinopyroxene and olivine, associated with minor amounts of amphibole and calcic plagioclase. Iron oxides and small retrogradation mineral phases were not considered. As in the autoclave experiments, the modelling considered a closed system in which the solid rock takes 20% of the volume and the remaining space is taken up by the brine. As a requirement of the code database, the CG mineral phases are described with the endmembers of the solid solutions, as represented in Table 2. The reactive surface area for each mineral was calculated based on a random variable of the specific surface areas (SSA), defined in the literature as ranging from 10 to 250 cm2/g (e.g., applying Brunauer‒Emmett‒Teller (BET) measurements) for mafic and ultramafic rock [25,52,53,54,55,56] from Equation (13):
A bulk = φ m SSAM w V m + SA .
The term SA (geometric surface area = 0.67 cm2/g) is the ratio between the rock area and the rock volume = 1.68 cm2/cm3. Because the dissolution reactions depend on the minerals’ surface areas, we adjusted the SA with the first term in Equation (13), in order to reproduce the ideal conditions for CO2 mineralization. In fact, mineral surface area is the most uncertain and complex kinetic parameter and the evolution (especially for multimineral systems) is not quantitatively understood at present [53]. The definition of this parameter requires random values as the measured values using BET overestimates the reaction rates [53,55,57].
The kinetic constants for the reacting minerals were taken from the literature [52,53]. The fit of the model to the experimental data (aqueous calcium, silica, magnesium and iron) concentrations and pH) was performed based on Table 2. The initial concentration of dissolved CO2 was calculated to be 5.5 × 10⁻¹ mol kgw−1 according to the Duan and Sun [16] model, with an imposed total pressure of 80 bars. From the thermodynamic and kinetic point of view, 73 aqueous species were considered in the simulations. The equilibrium constants were taken from the EQ3/6 thermodynamic database [58] included in CrunchFlow. The activity coefficients were calculated using the extended Debye‒Hückel formulation (b-dot model) [59], with parameters from the same database. The brine composition in the simulations is similar to that of the brine used in the experiments, with pH = 6.85 (before CO2 addition). The brine is enriched in Ca and Mg (5.12 × 10⁻² and 2.62 × 10⁻² mol.kgw−1) and contains important amounts of sulfur and sodium chloride (Table 3).

4. Results

4.1. Petrographic and Chemical Characterisation of Rocks before and after SC CO2 Exposure

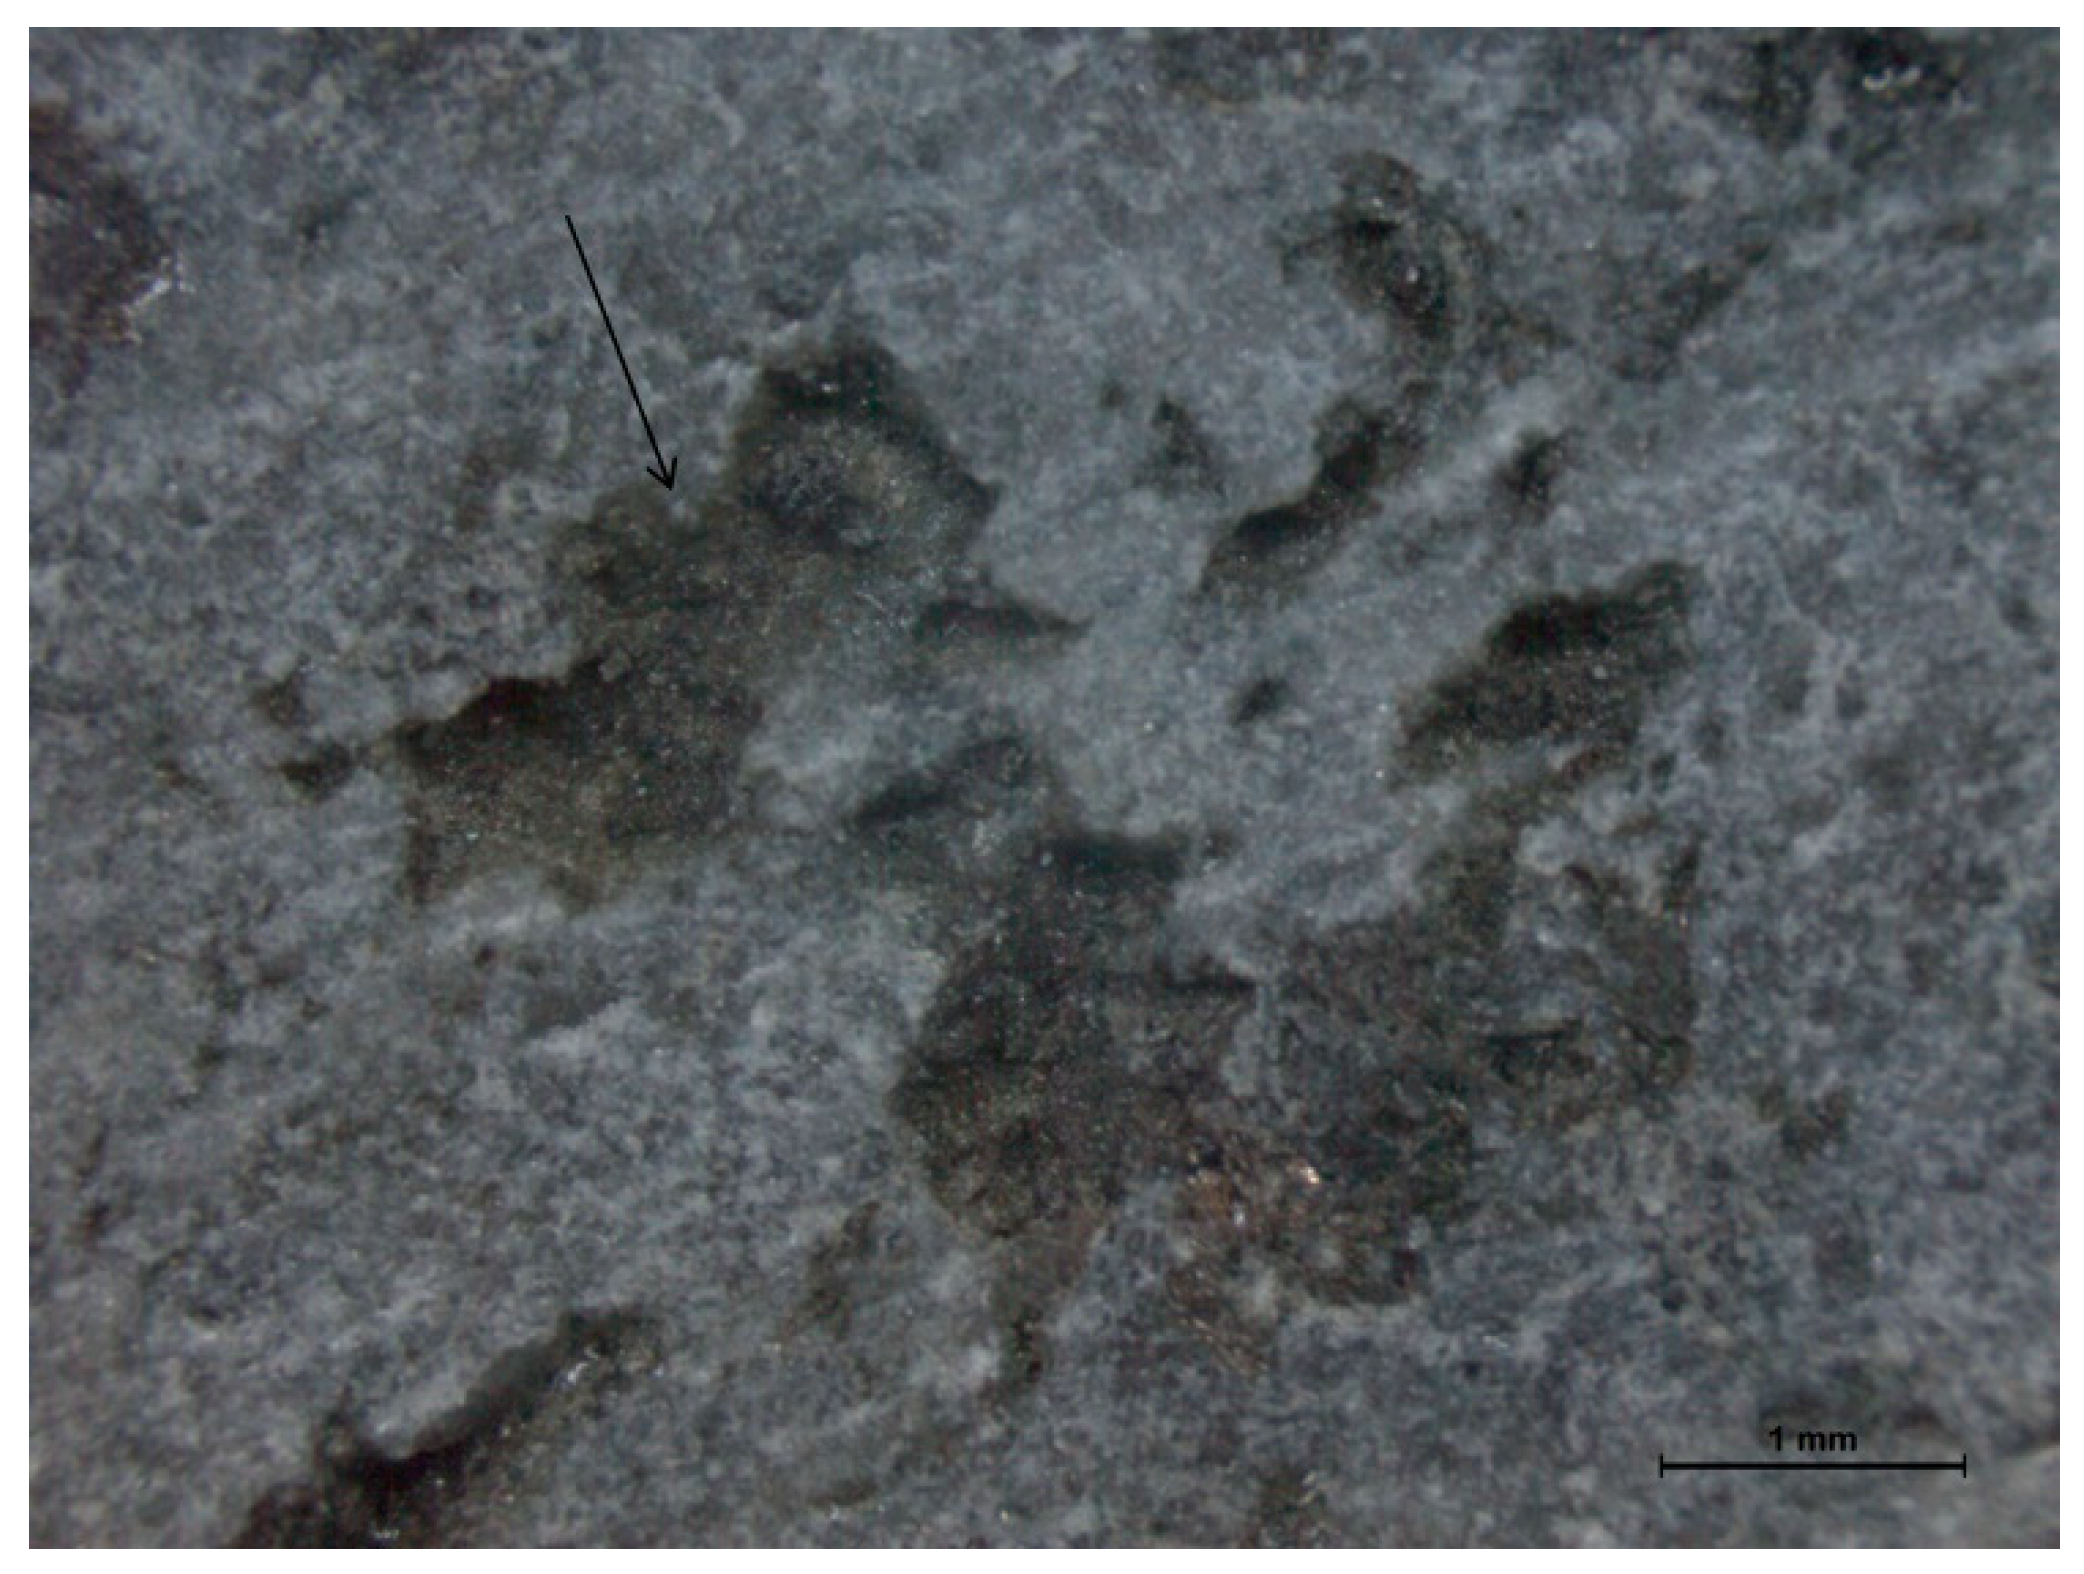
The two lithologies (CG and GD) used in experiments and tested as described above show similar textural and mineralogical results. After interaction of the rock specimens with the SC CO2 supersaturated brine in the autoclave chamber, an increase in the dissolution of specimens can be perceived; after the one-day run there is a noticeable surface roughness, which increases for the longer runtimes and eventually leads to material fragmentation for 16-day and 64-day runs (Figure 3). The mean linear roughness (Ra) is higher on CG from 14.80 µm to 21.89 µm for 16 and 64 days, respectively, whereas for GD the Ra increases from 1.01 µm to 1.85 µm for 16 and 64 days, respectively.
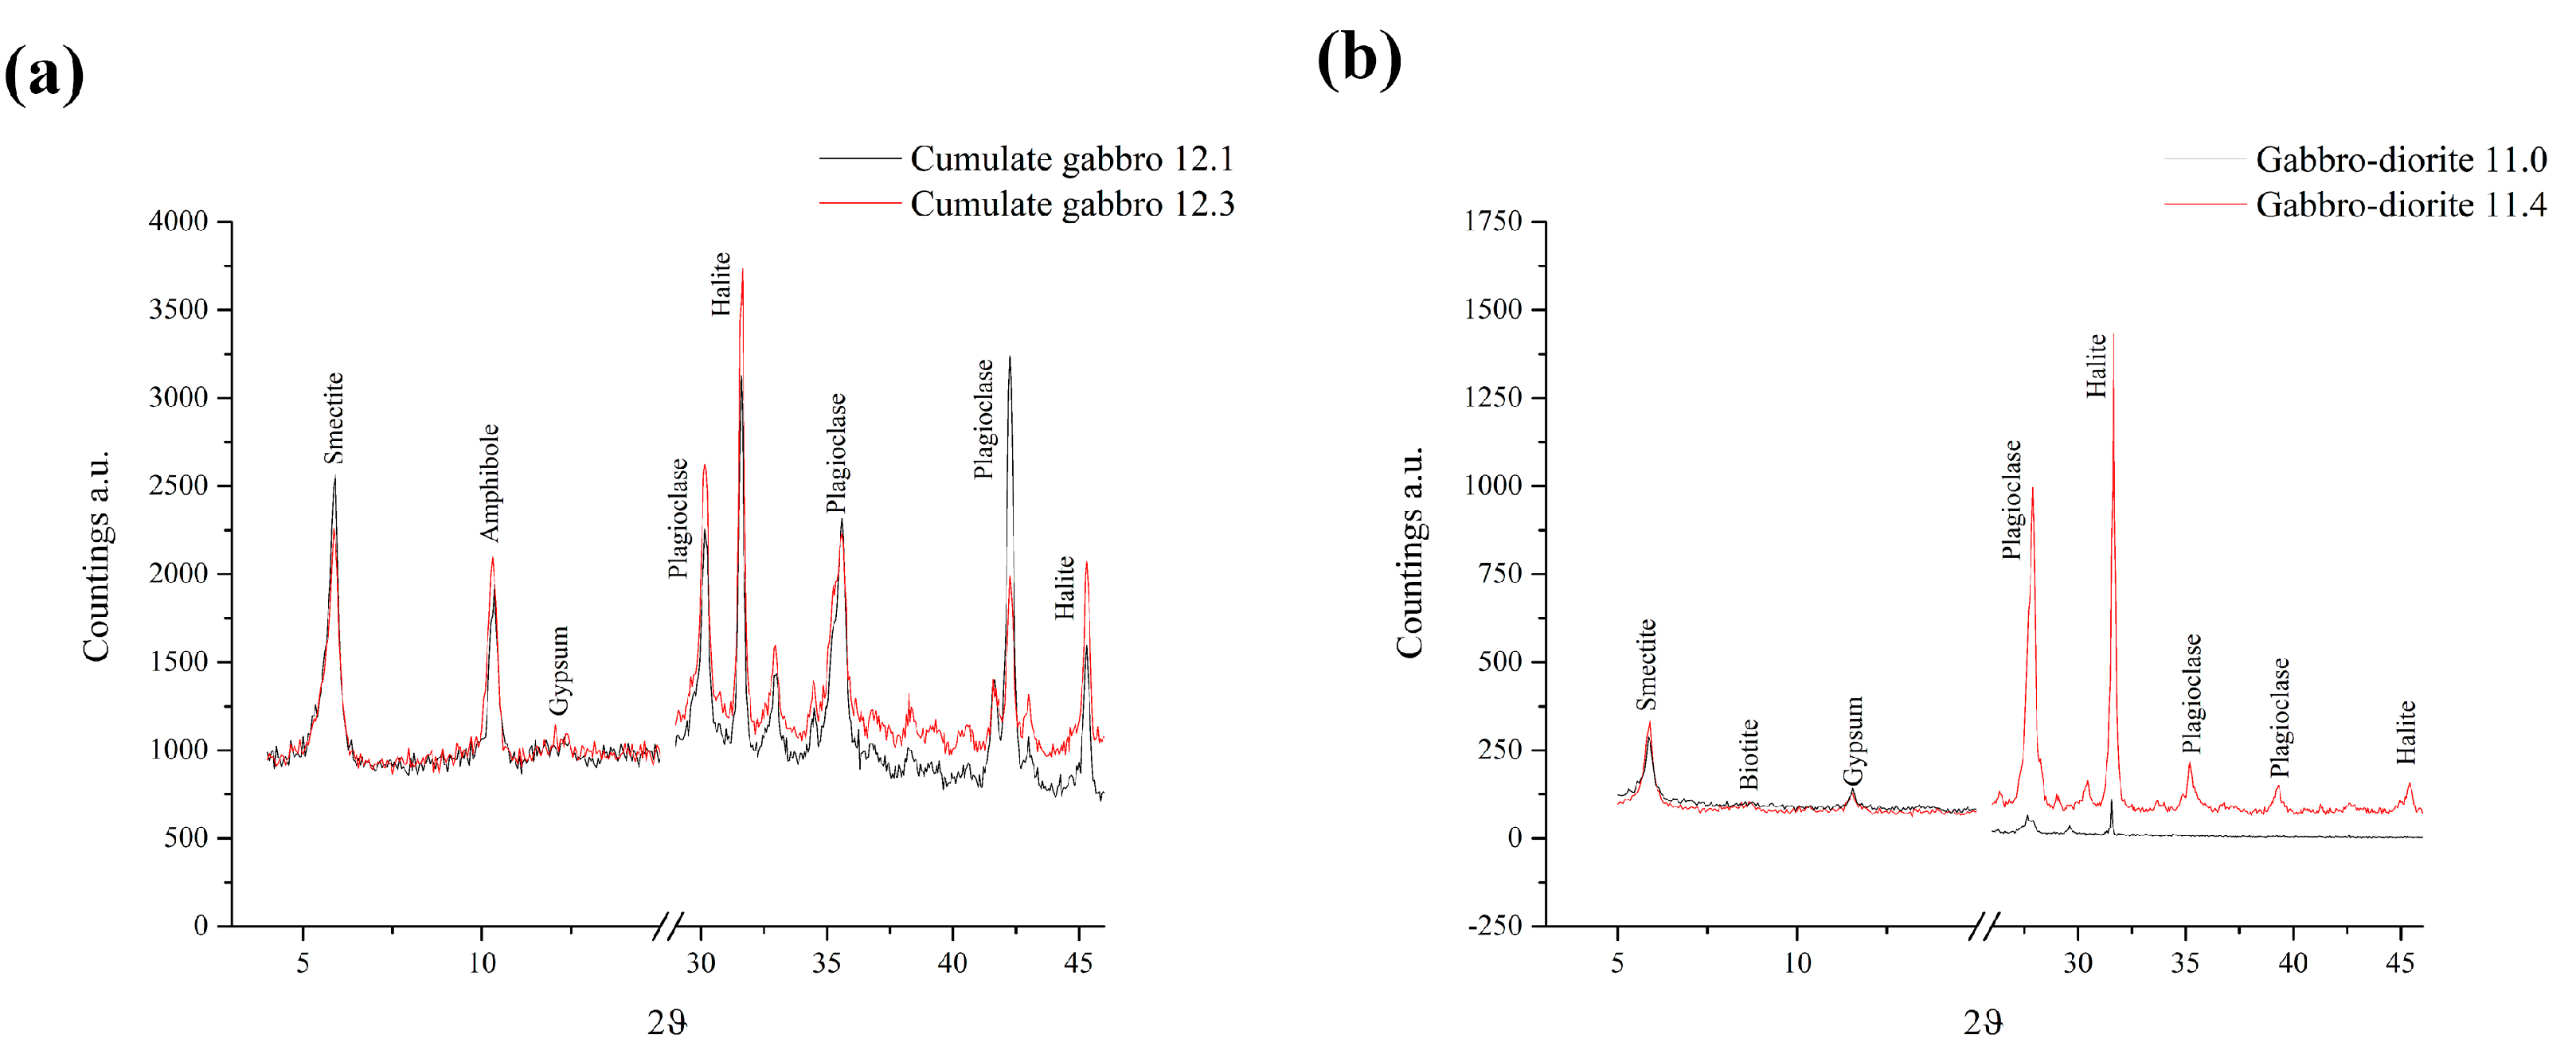
The petrographic analyses, through transmitted light microscopy, did not show significant mineralogical or textural differences after the experiments. It is important to note that even if there were any changes, they should be located on the surface and the thin section production process could have eliminated them. The powder-XRD performed on global fraction before immersion [11] reflects the modal igneous composition given by clinopyroxene, olivine, amphibole, plagioclase and magnetite for CG and plagioclase, clinopyroxene, olivine and mica for the GD (Table 4). Clinochlore has been identified on both rock samples and probably derived from the alteration of the mafic mineralogical phases. After the 1-, 4-, 16- and 64-day runs, the obtained powder diffractograms (Table 4) shows besides the igneous mineralogy the new presence of talc, vermiculite, and halite on both CG and GD in most specimens. Moreover, XRD performed on the surface of CG and GD 64-days specimens, through grazing incidence (Figure 4), additionally reveals the presence of smectite and gypsum, which were not detected in 0-day specimens.
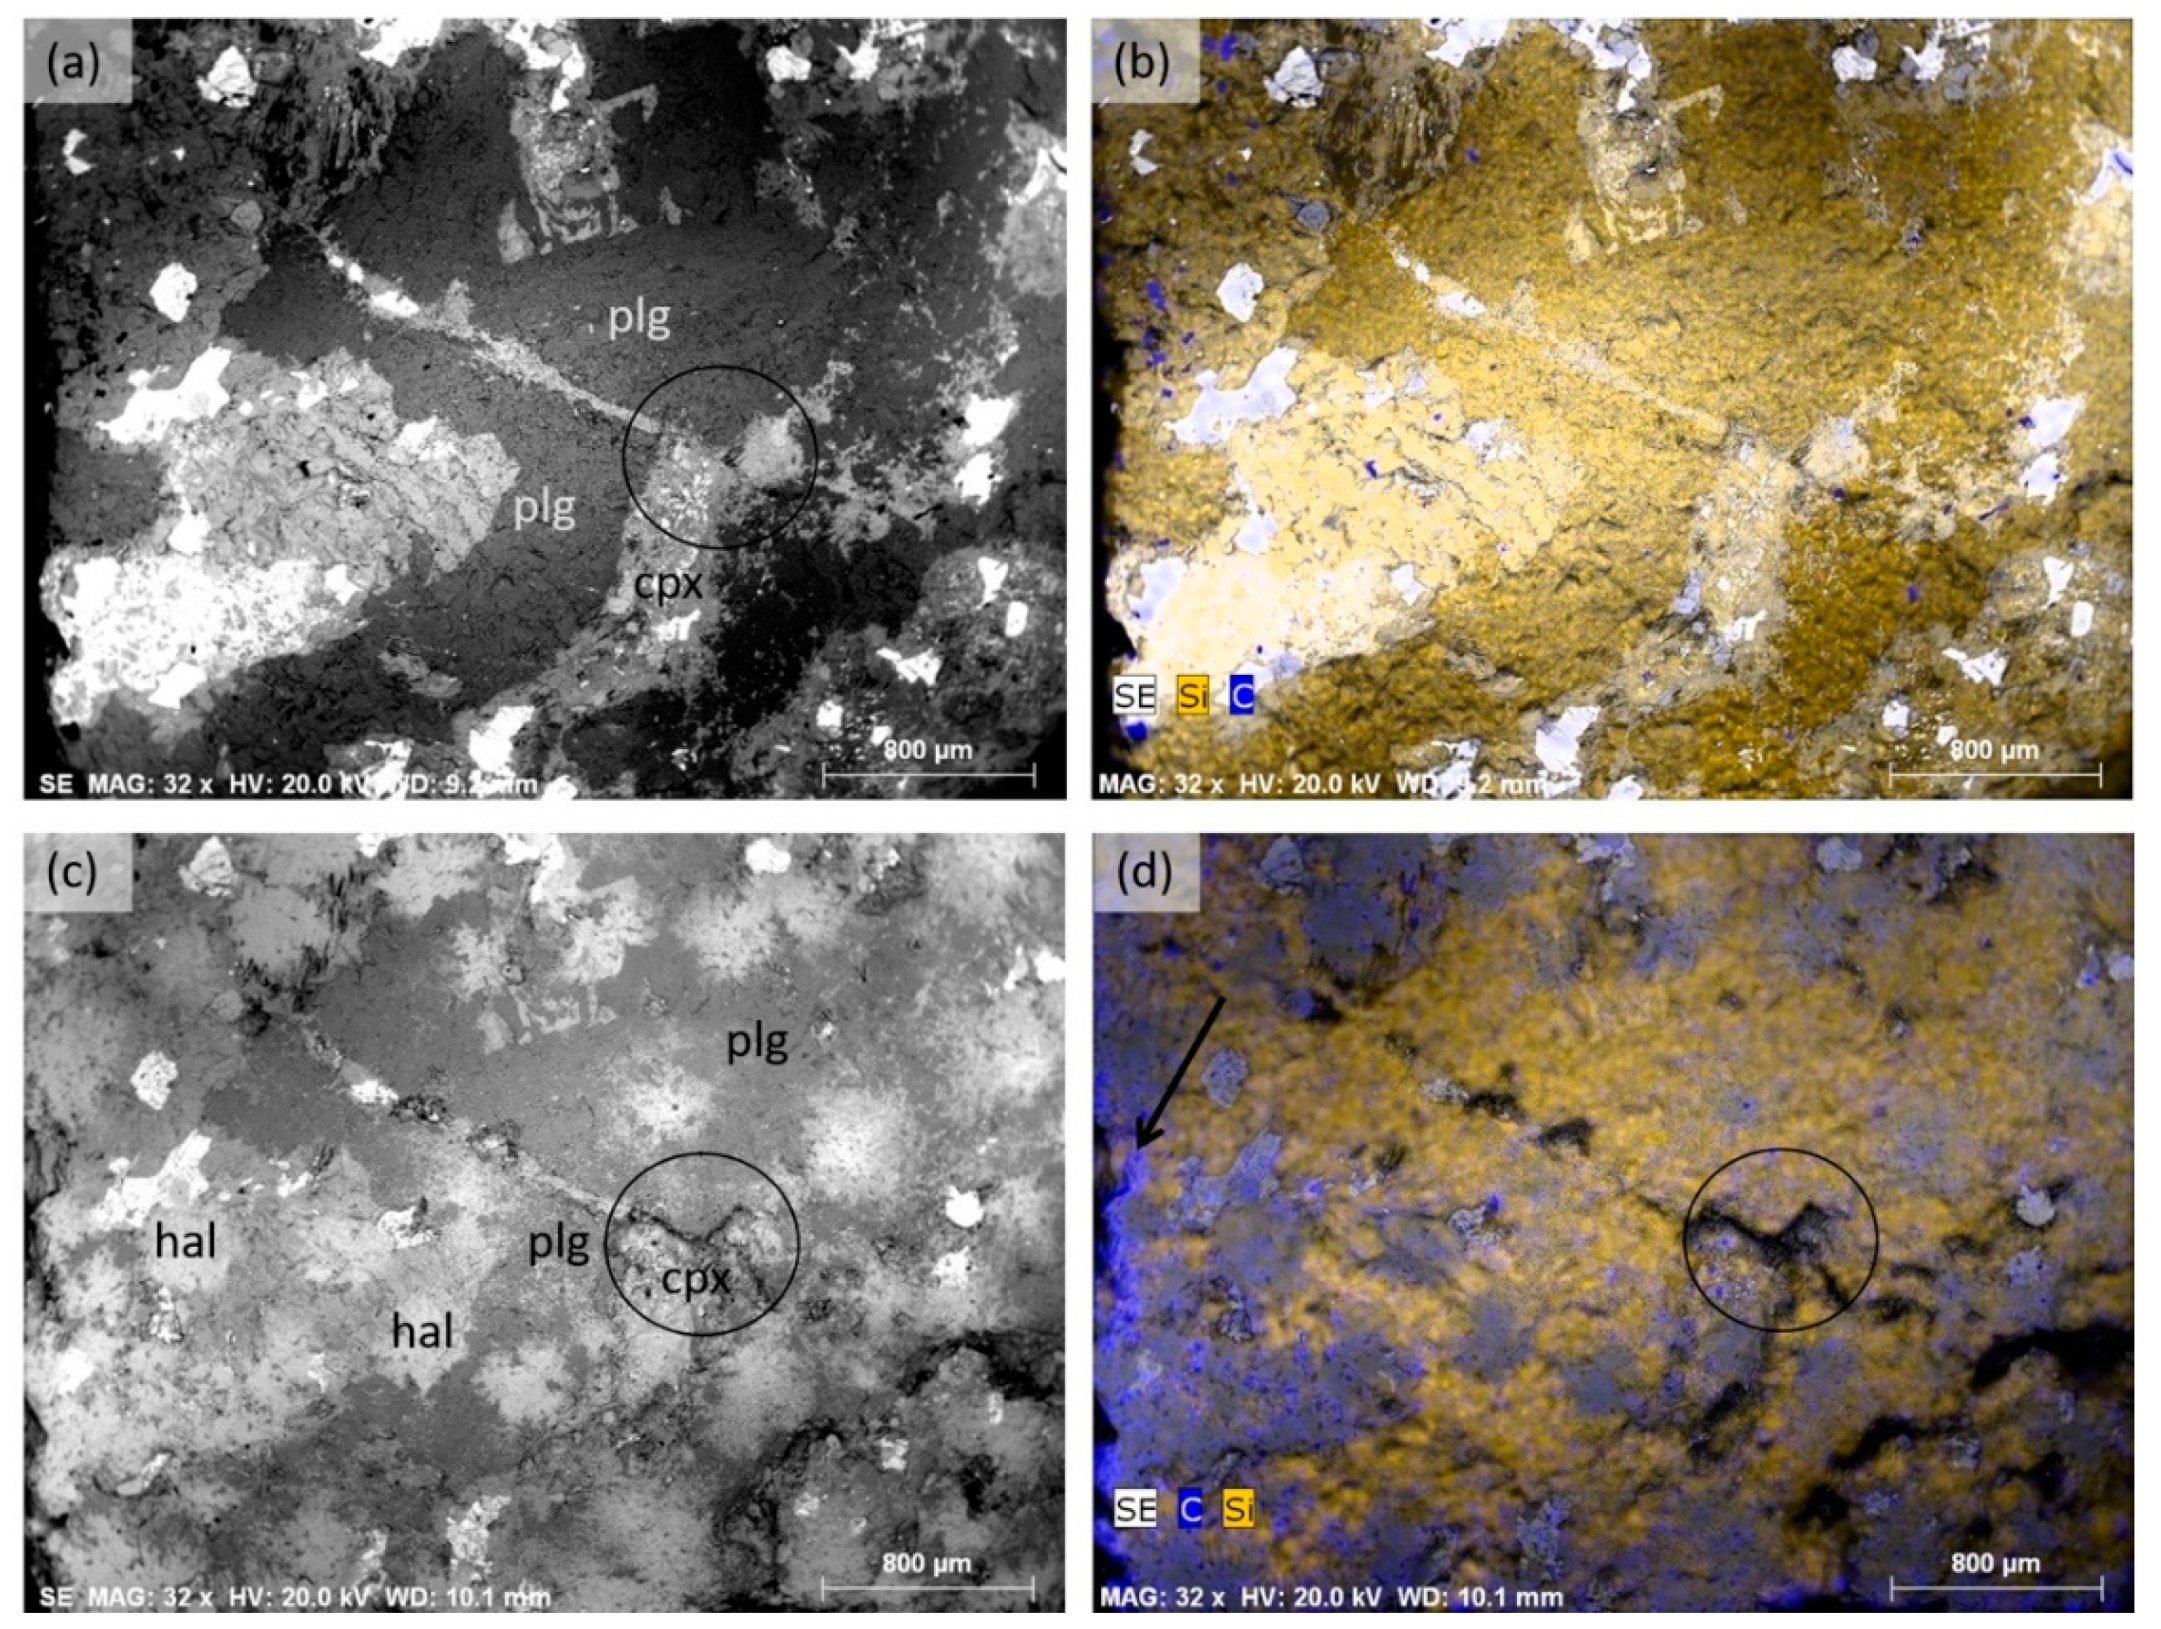
As described for the CG [60], the SEM images obtained before and after each experiment on GD (Figure 5a,b) essentially show an increase in ferromagnesian minerals’ dissolution, reflected in the higher surface roughness, as reported by other authors [61]. The added phases show different reflectance on backscattered electron (BSE) images and, according to EDS elemental map distribution (Figure 5c,d), correspond to significant enrichment in chlorine (Cl), sodium (Na), sulfur (S) and carbon (C). The precipitation of salts in the form of efflorescence covers a large part of the surface of the specimens and the cavities generated by the dissolution.
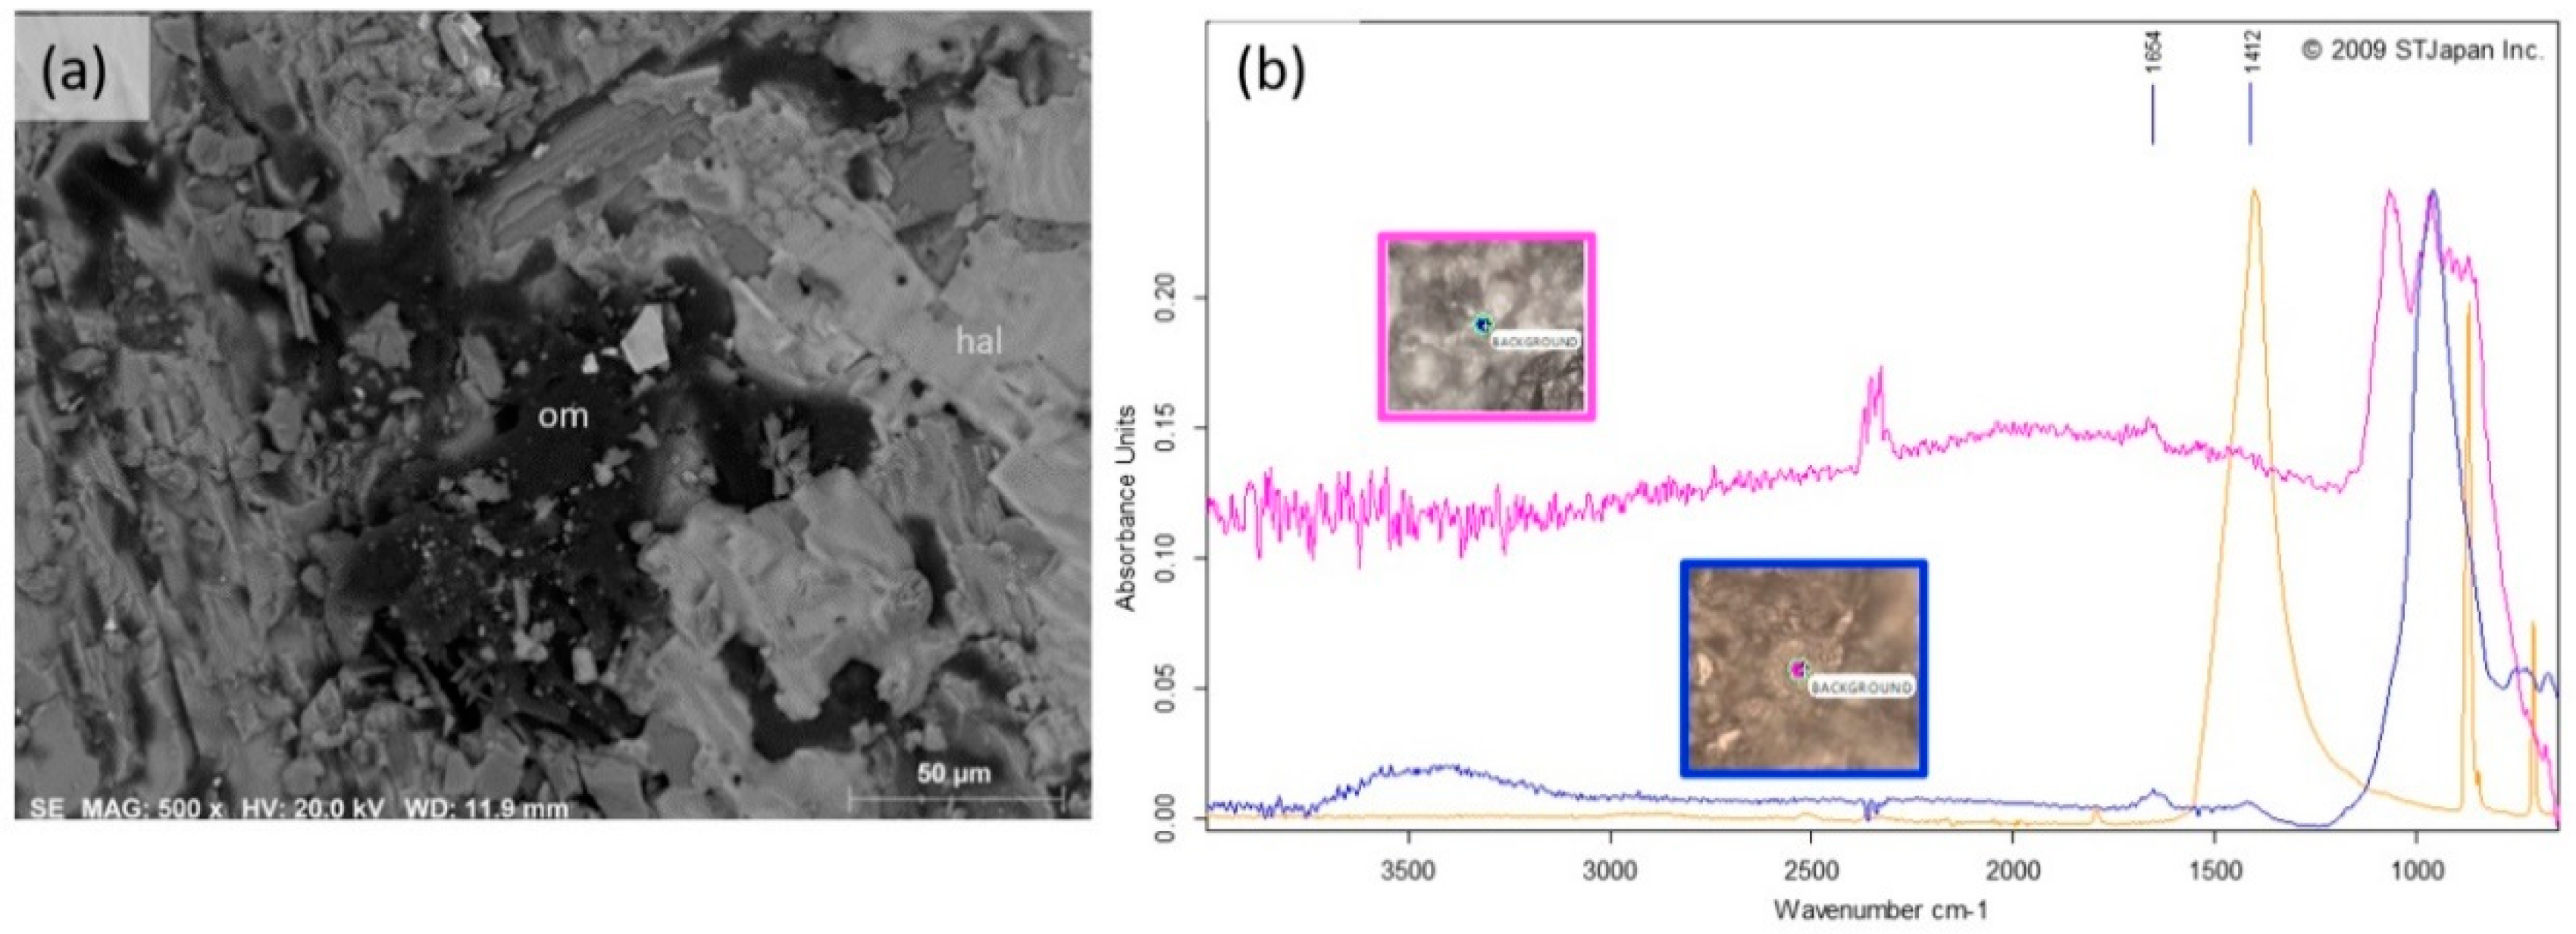
The carbon enrichment observed on the edge of 64-day specimens (CG and GD) and associated with salts (Figure 5d and Figure 6a) corresponds to organic material, which accumulates due to runoff during the drying process at 40 °C. The origin of this material remains to be identified, but is probably related to the presence of organic material (hydrocarbon) within the original brine.
In fact, the carbon particles observed at the surface (Figure 6a) are not related to the crystallization of carbonates or any other mineral phase [60]. The ATR-FTIR spectra of these carbon-enriched areas present infrared fingerprints pointing to the presence of triglyceride-enriched areas whose origin is still to be determined [58]. In addition, the analysis by ATR-FTIR of CG and GD after 16 days (Figure 6b) of interaction with CO2 revealed a decrease in the intensity of the absorption band
Whole-rock geochemistry data for CG and GD before and after 64 days within a SC CO2-brine solution are shown in Table 5. For CG the most significant variations after a six-day run were an increase in CaO (+0.4 wt. %) and a decrease in Fe2O3 (−0.4 wt. %), whereas in GD CaO and Fe2O3 decreased (−0.42 wt. % and −0.3 wt. %, respectively). The enrichment in sodium was more evident in GD specimens after 64 days within SC CO2-brine (+0.13 wt. % vs. 0.04 wt. % for CG). Sulfur increased in both samples after 64 days (+0.05 wt. % and +0.08 wt. % for GB and GD, respectively).

4.2. Brine Evolution

Before starting the carbonation experiments, the composition of the brine was analysed using a combination of techniques (see Table 6 and Table 7, “Pure Brine” column). The brine used in each run of experiments was recovered immediately after the end of the run for a comparative chemical analysis.
The variation in the brine chemistry with time for both experiments—Experiment 1 with CG and Experiment 2 with GD—is shown in Table 6 and Table 7. The pH, measured just after concluding each run, is more acidic for Experiment 1 (with CG). In fact, the initial pH of 6.85 dropped to 4.5, 4.87, 5.1 and 5.5, after one, four, 16 and 64 days, respectively, in the brine‒rock‒CO2 system (Table 1) whereas for Experiment 2 (with GD) the pH decreased from 7 (brine without CO2) to 5.81, 5.61, 6.38 and 6.61. In Experiment 2, the number of specimens was doubled (higher rock/brine ratio), but there was not a clear increase in the concentration of ions in solution, as suggested by similar values of conductivity for both experiments.
For Experiment 1 (CG), in general, the behavior of cations in solution was variable, despite the tendency of Ca2+ decreasing, whereas K+, Mg2+, SiO2 and total Fe increased.
For Experiment 2 (GD), besides Na+, all other analysed cations had lower concentrations in solution when compared to Experiment 1. Furthermore, the analysed elements did not always show the same behavior as described for Experiment 1. After an increase until the four-day run, Ca2+ tended to stabilize. K+ showed an increase, whereas Mg2+ concentrations tended to stay the same or increase slightly. SiO2 clearly increased, but the 64-day run saw a decrease in silica.
In both experiments, SO42− had similar behavior: a smooth enrichment, followed by a decrease for the 64-day run; Na+ and Cl had more unpredictable behavior, displaying either enrichment or impoverishment trends along the four runs.

4.3. Geochemical Modelling of Experiments with Cumulate Gabbro

4.3.1. Outlet Solution Composition

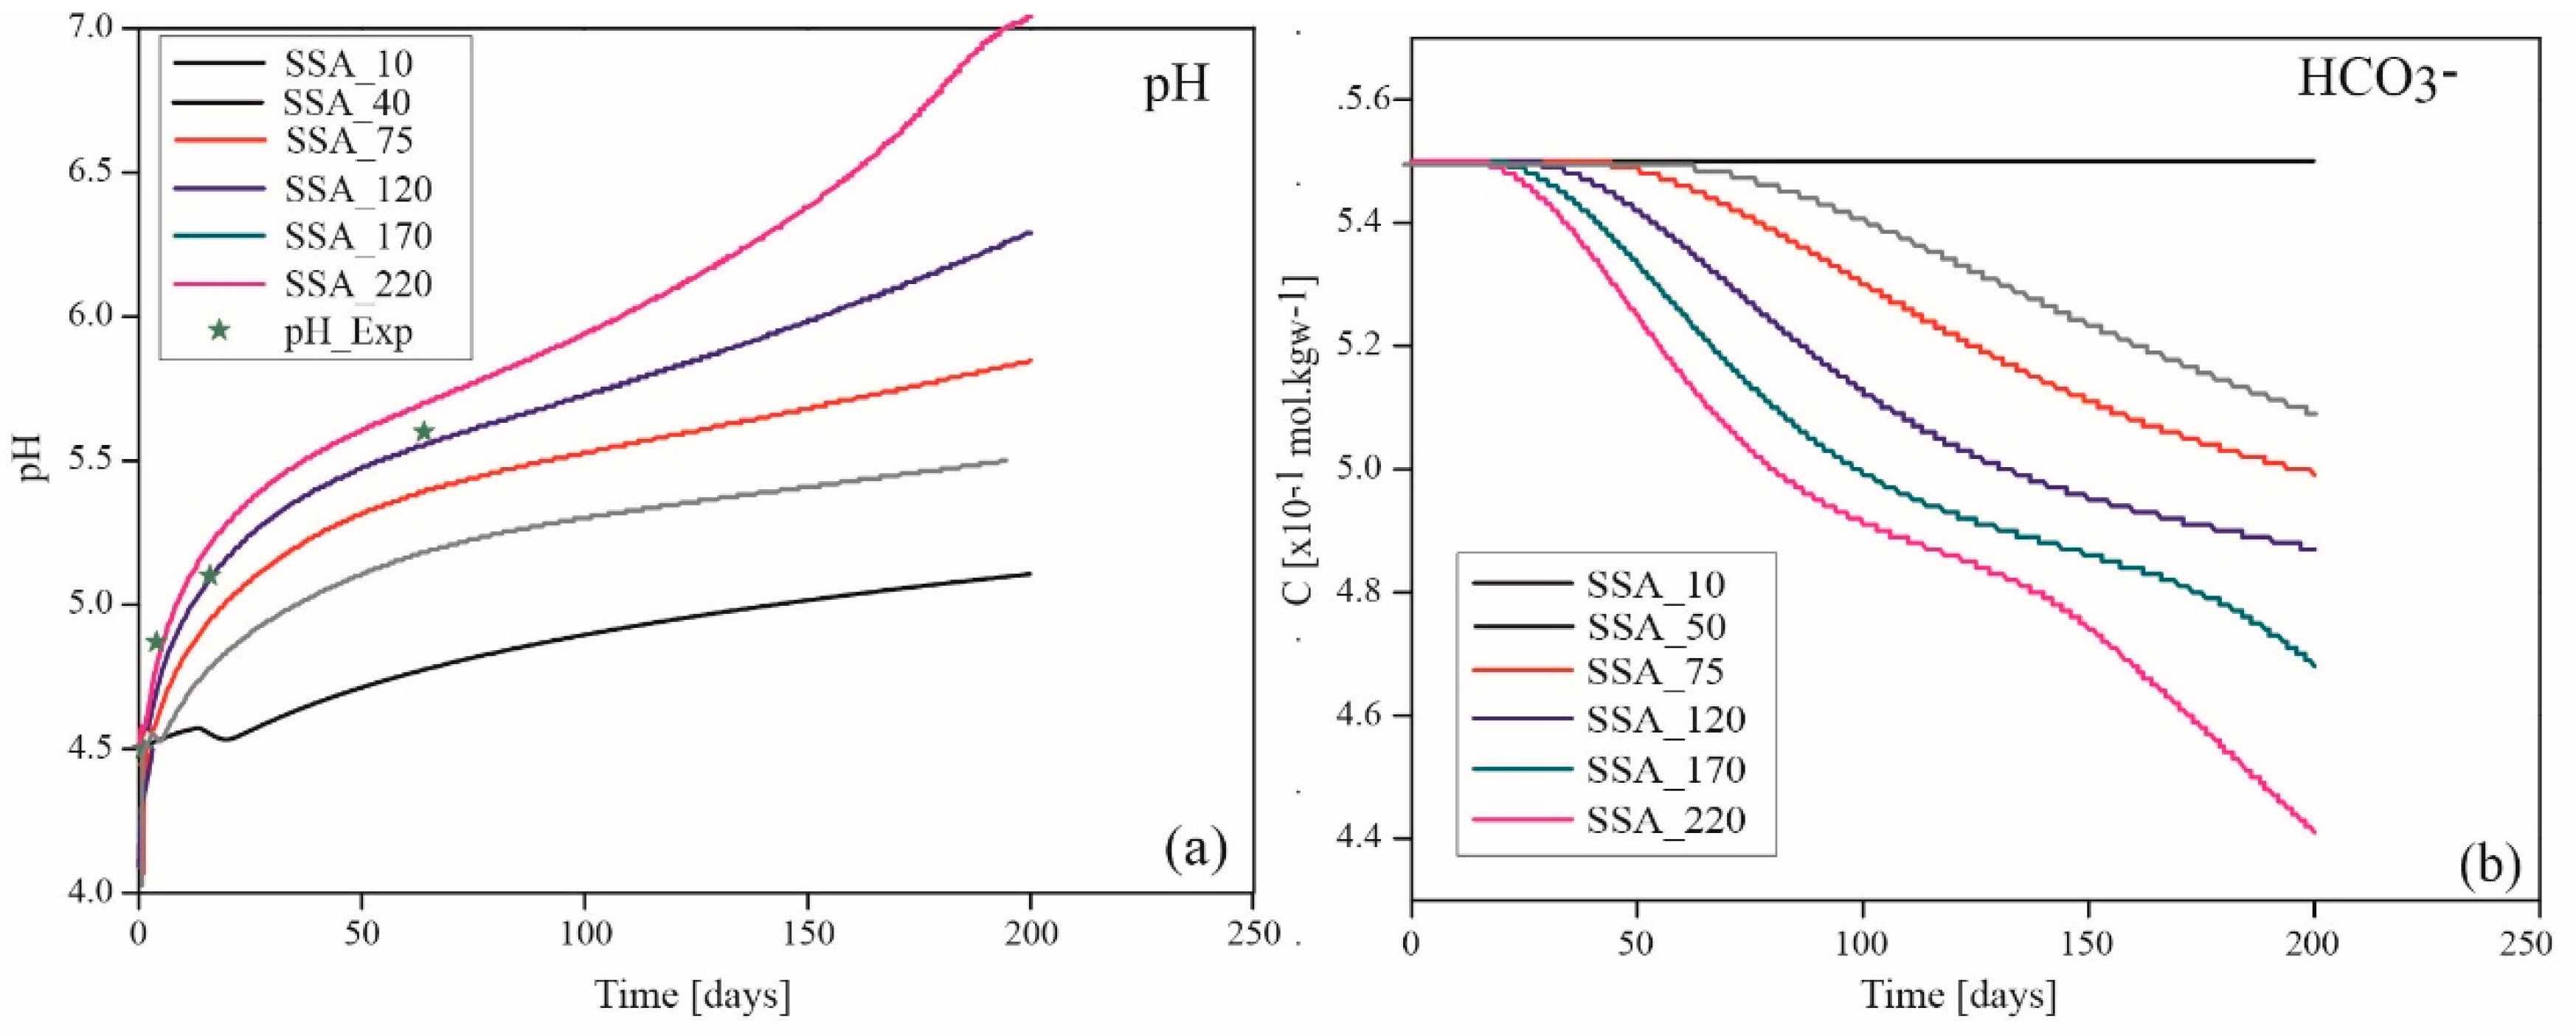
The results of the experimental and simulated variations and tendencies in the output concentration over time are shown in Figure 7. The measured and simulated pH in brine supersaturated with CO2 are presented as a function of the reactive surface area (Figure 7a) and compared to the variation of dissolved CO2 (Figure 7b).
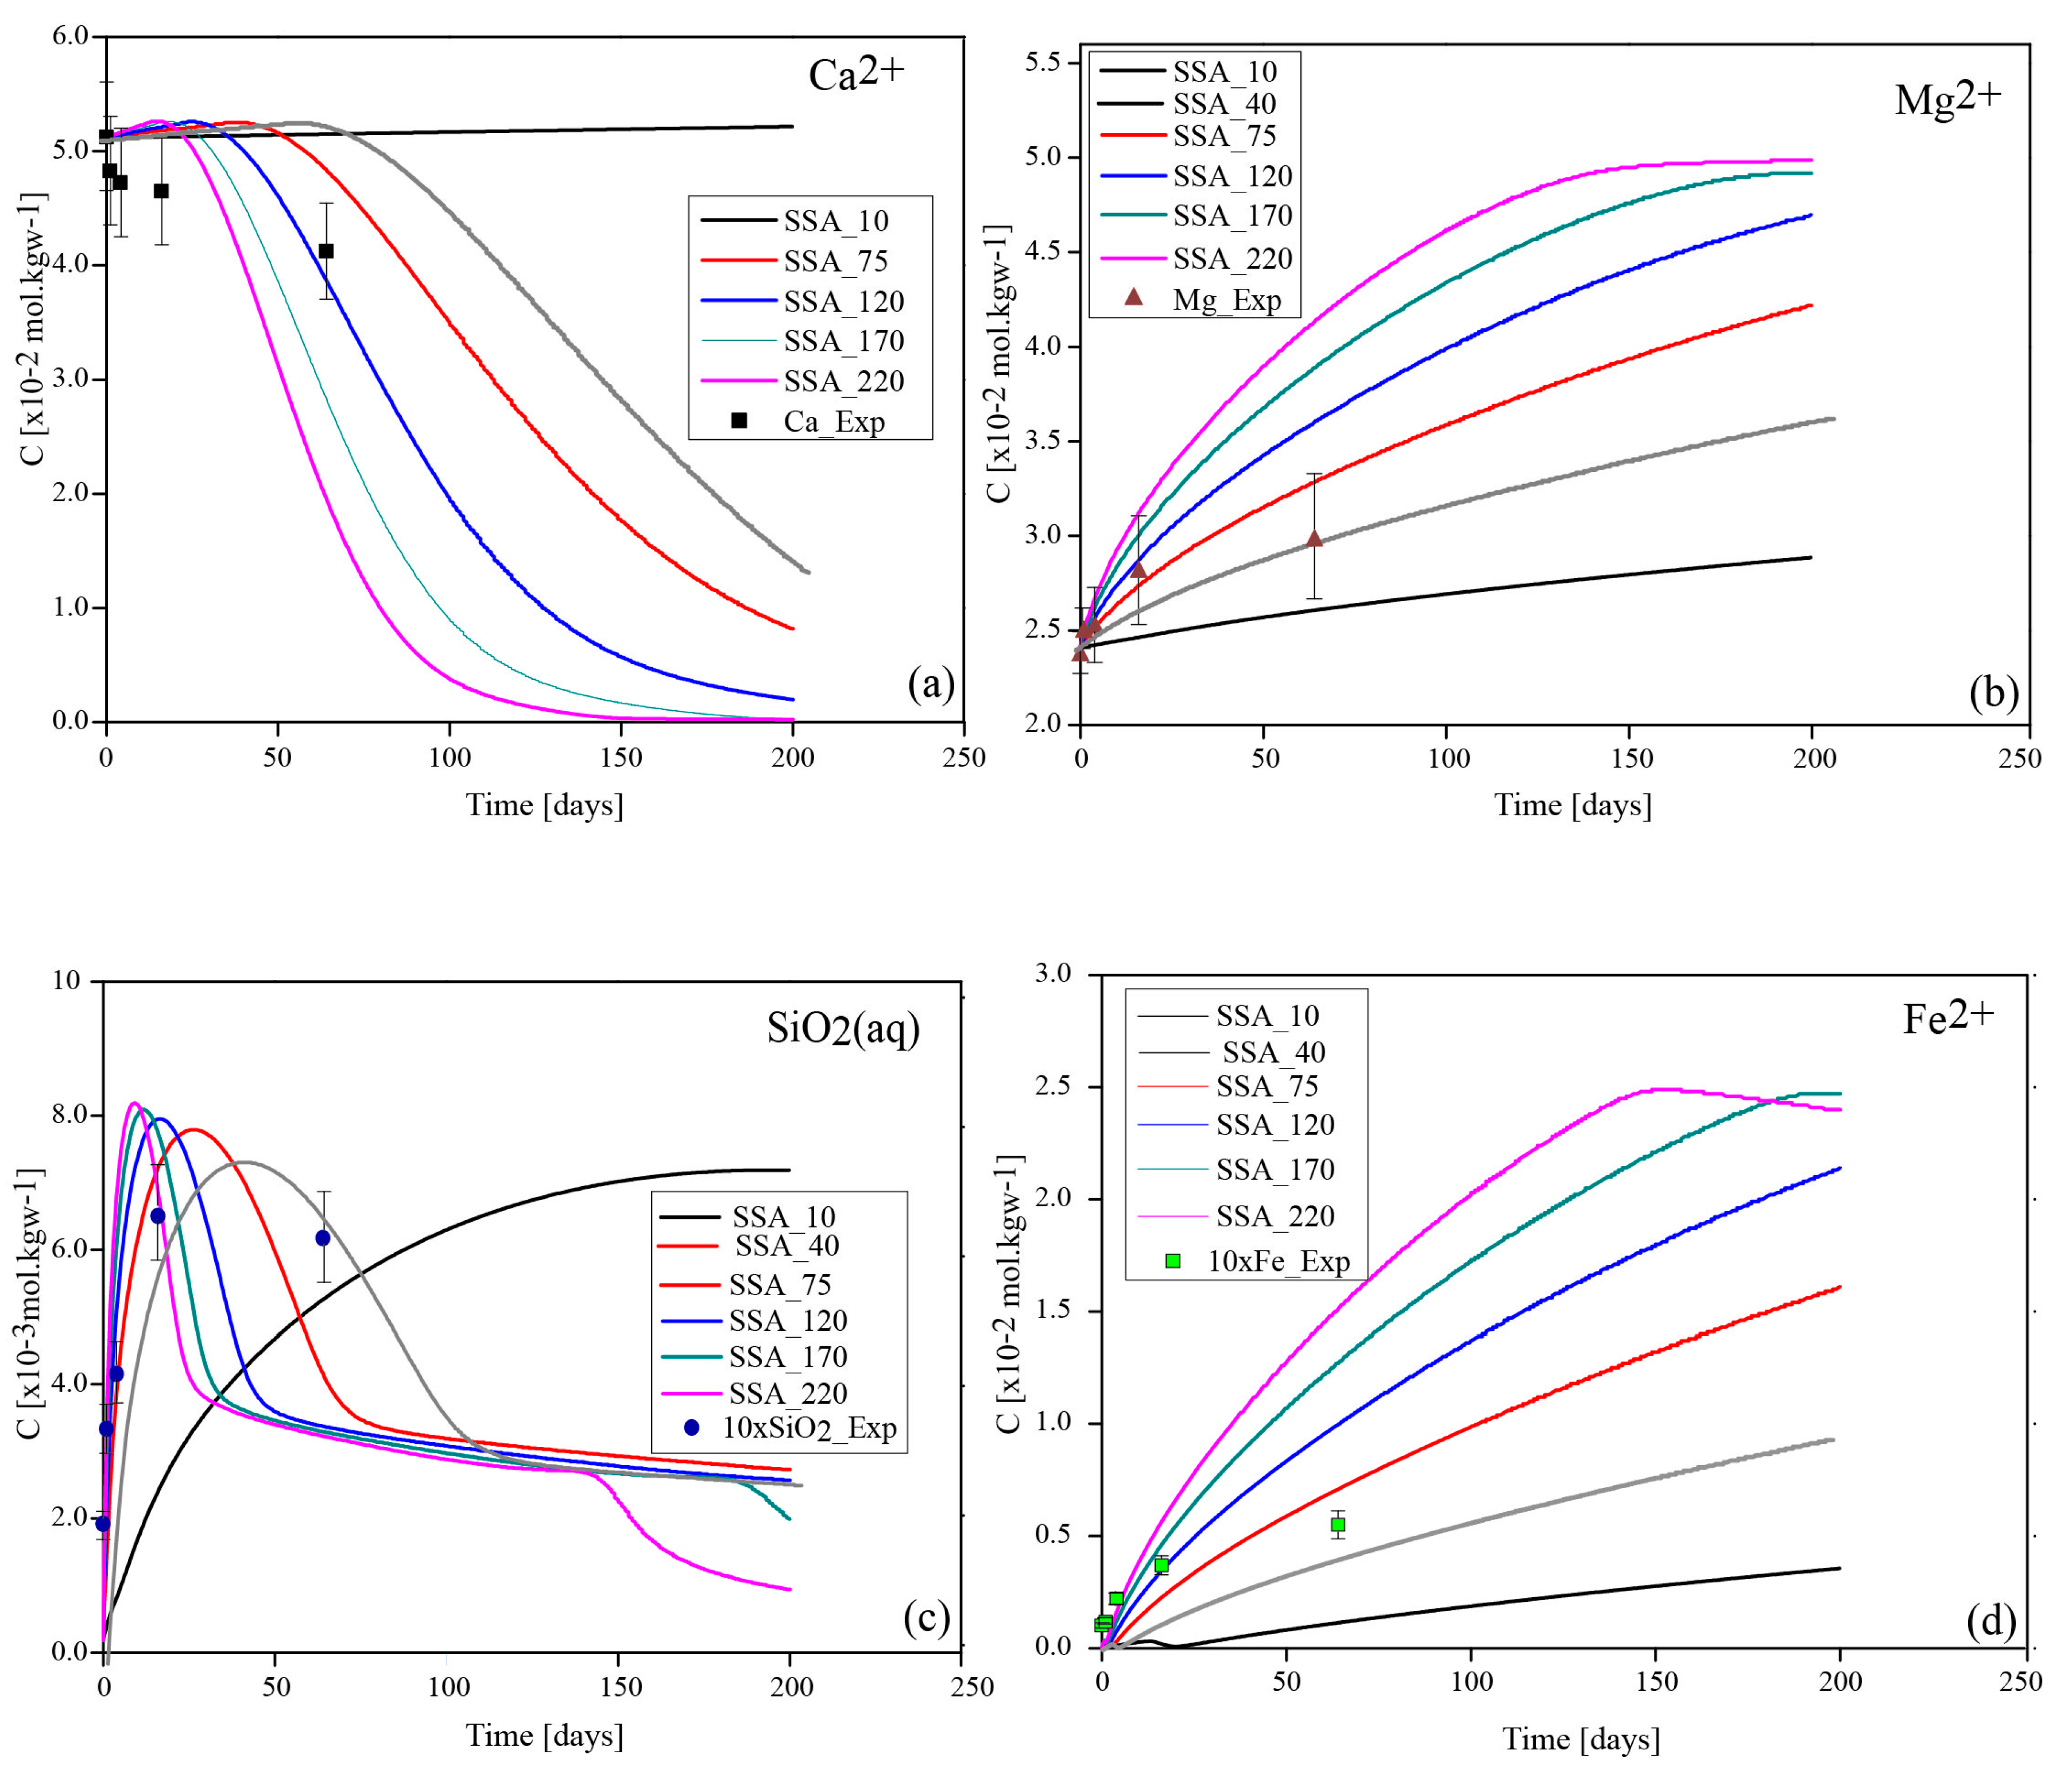
Initially, the fluid pH at the onset of the modelling was 4.0 and increased rapidly to 4.5, and then gradually to 7.0, in the range of the measured values. Clearly, over the simulated time (0 to 200 days), pH ranged from 4.0 to 5.1 for the low SSA, increasing up to 7 for high SSA (170–220 cm2.g−1). The interaction between the rock and acidified fluid is a function of the dissolved CO2 and the reactive surface area, since the decrease in HCO3 is inversely correlated to the increase in pH. Hence, the increase in pH above 5.5 was correlated to the consumption of the dissolved CO2. As a result, at t < 50 days for SSA < 75 cm2.g−1, and t < 10 days, for SSA = 170–220 cm2.g−1, the pH remains lower than 5.0 and the dissolved CO2 concentration remained constant. The constant concentration of HCO3 at a low pH denotes a dominant dissolution phase, where the concentration of the primary aqueous species (Ca, Mg, Fe, SiO2) increases with time (Figure 8). However, at moderate and high pH values, CO2 consumption is inferred from the decline in HCO3 concentration (below 0.48 mol.kgw−1), triggering CO2 mineralization into carbonates.
Simulated aqueous silica, Ca, Mg and Fe were observed to initially increase and then level off or decrease over increasing time. For instance, a minor increase in Ca concentration with respect to the initial concentration (ΔCCa = 0.14 mol·kgw−1) was observed for t < 40 days before a continuous decrease began. The pattern of increase and decrease match perfectly with the evolution of dissolved CO2, and are in agreement with the observations in previous studies [14,25,29,55].
The simulated magnesium concentration doubled before levelling off (after 100 days). Moreover, the SiO2(aq) concentration stabilized shortly before a sharp and progressive decrease, indicating quantitatively important secondary silicate phases’ precipitation. A steady increase in iron concentration was observed; the simulation indicates levelling off occurred later, after 150 days, and was attributed to fayalite dissolution. Aluminum values, initially 1.0 × 10⁻⁴ mol/kg, dropped sharply by five orders of magnitude, following the albite, Ca zeolite and kaolinite precipitation observed in the first simulation.
Because of the assumptions made in the initial mineralogy, the simulation could not reproduce the potassium and SO4 behaviors.

4.3.2. Minerals’ Dissolution and Precipitation

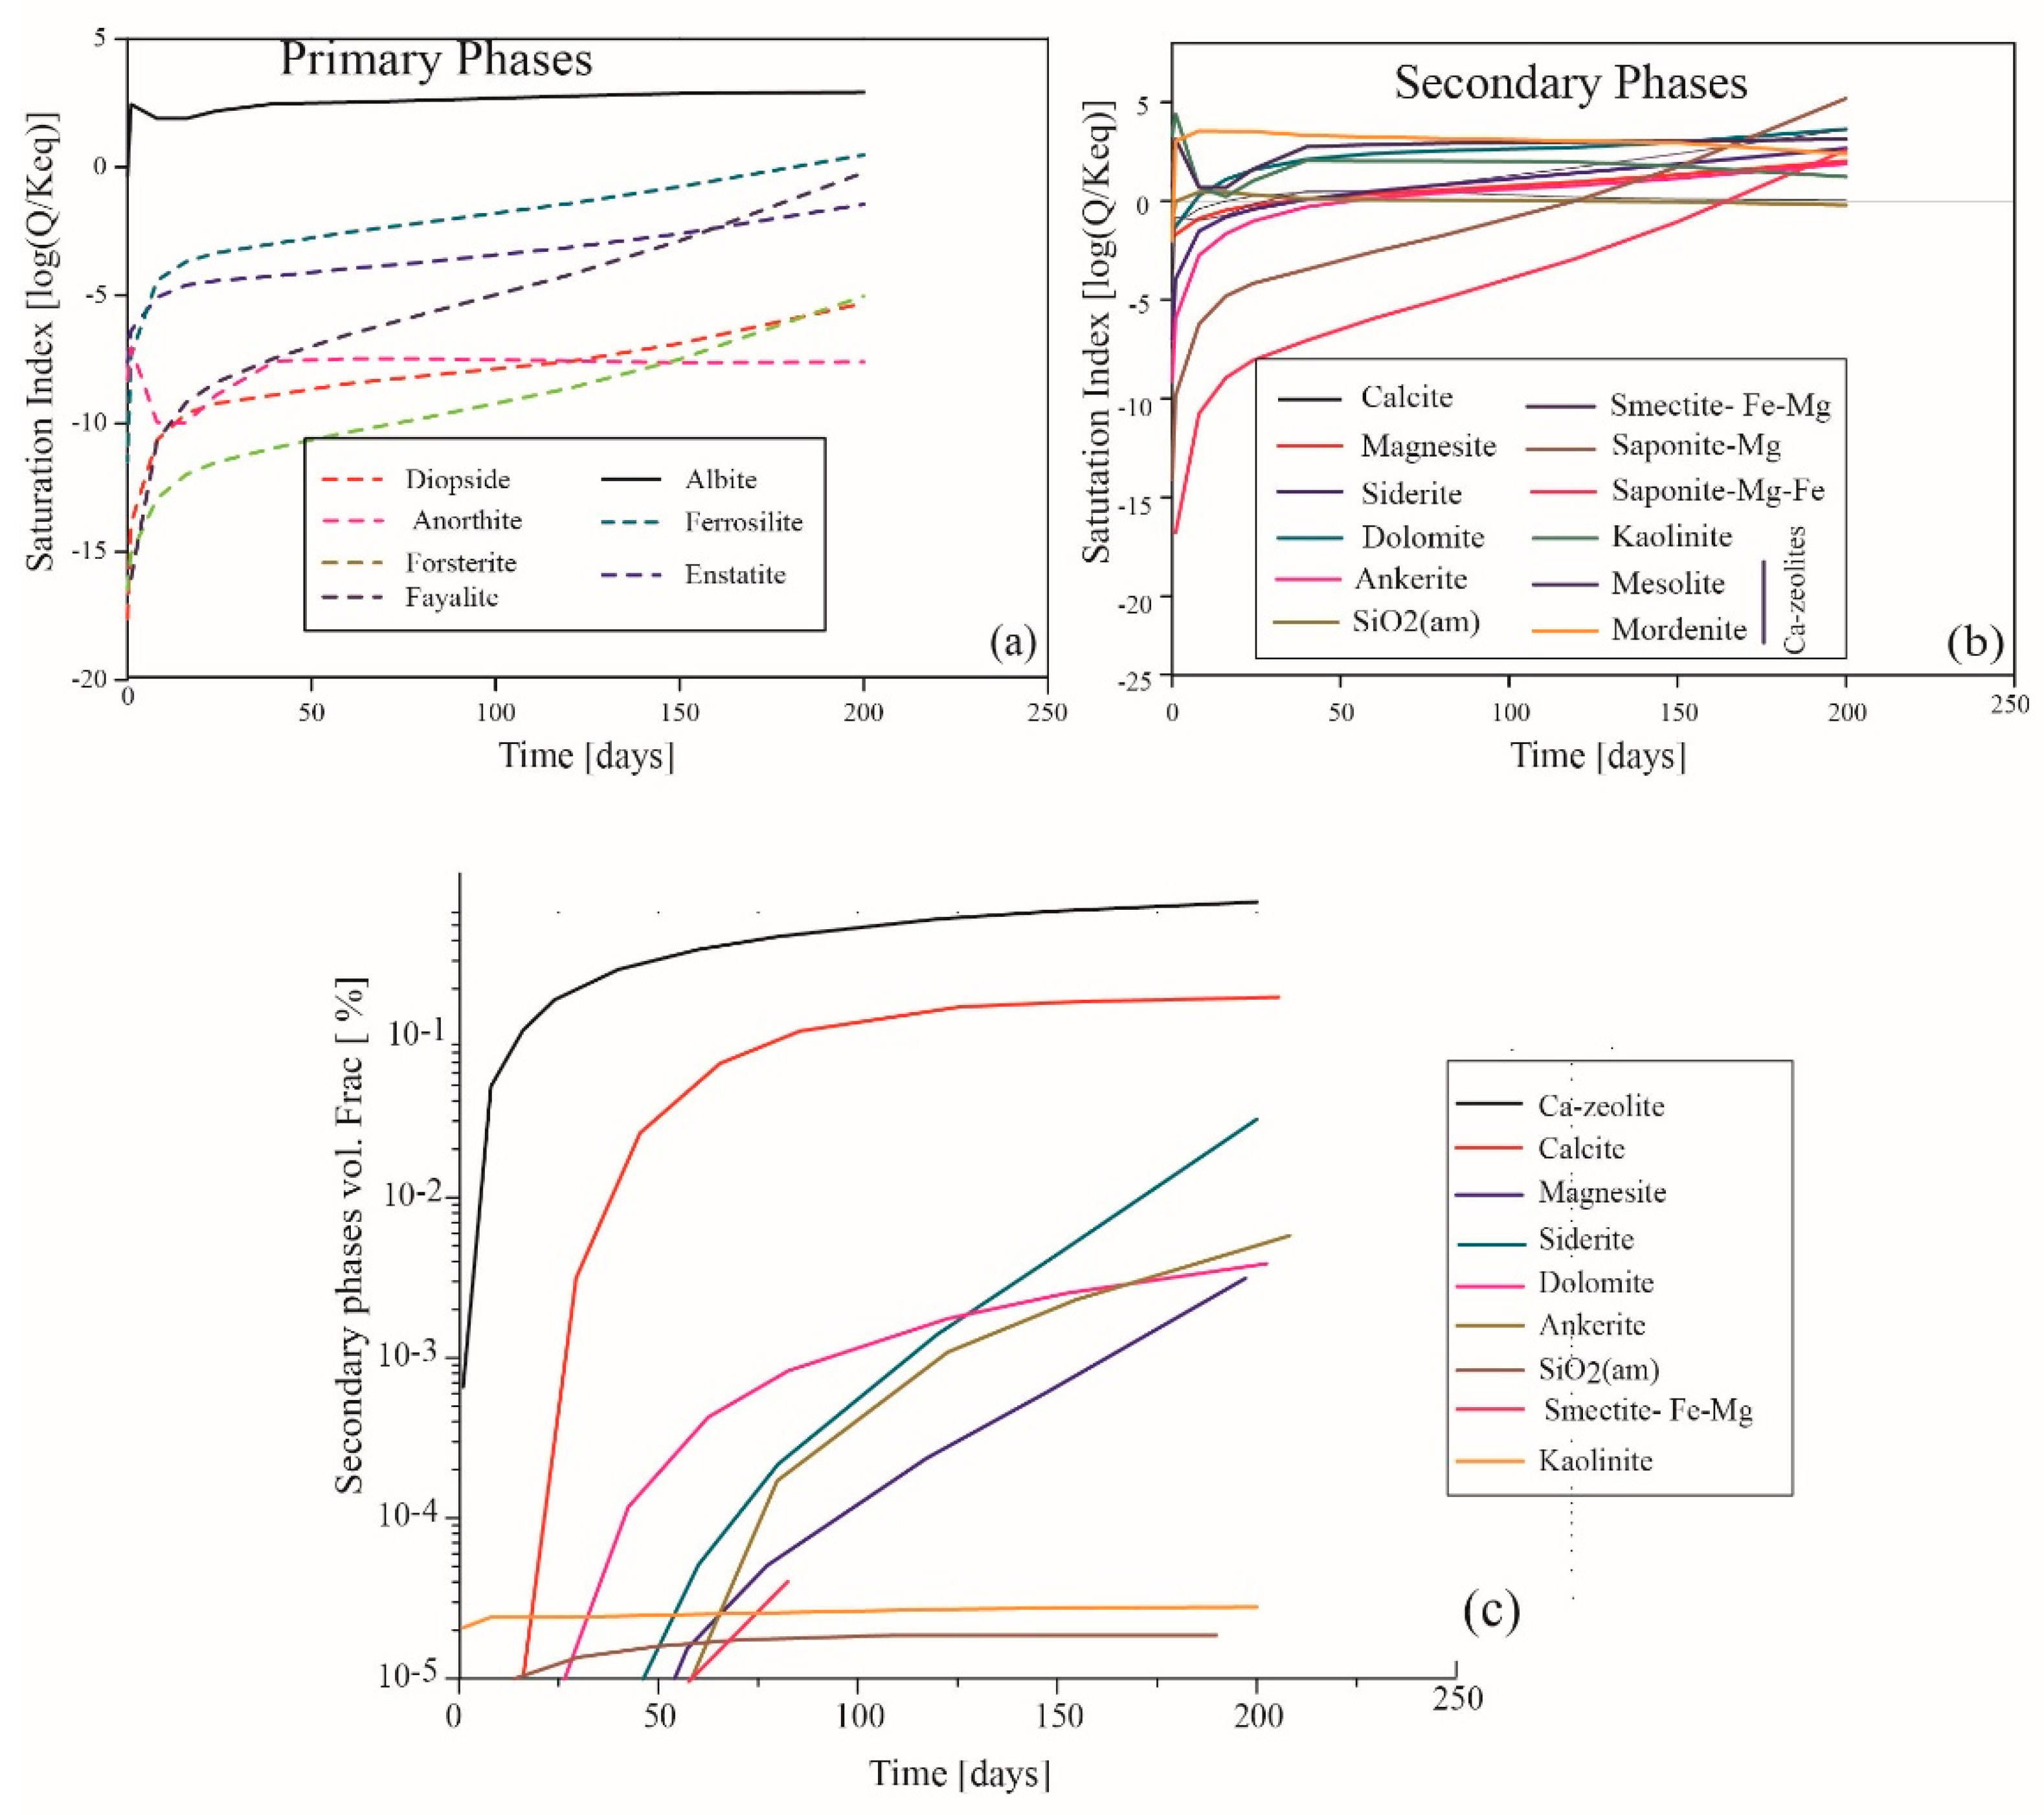
Simulated primary and secondary minerals saturation indices (SI) are shown in Figure 9a,b. All primary minerals (except albite) are seen to dissolve (negative saturation index and rate, Table 3). SI of albite remains positive over time, implying that the modest decrease in Na+ (from 0.371 to 3.69 mol.kgw−1) is a consequence of albite volume increase. The dissolution rates (Table 8) indicate that olivine, plagioclase and diopsidic minerals are the most reactive phases.
Two mineral assemblages resulting from the CG alteration are predicted by the geochemical model. A Ca and Fe‒Mg carbonate assemblage and another composed of Ca‒Mg‒Fe silicates (and aluminum) such as calcium-rich zeolites, clay minerals and amorphous silica. Ca‒zeolites (mesotile and mordenite) and kaolinite are the first secondary minerals to form simultaneously with albite volume increase, followed by the amorphous silica (Figure 9c). The Si‒Al-rich assemblage formation results in a sudden decrease in aluminum and silicon from the outlet solution. The carbonates’ mineral phases correspond to calcite, dolomite, magnesite, siderite and ankerite. Calcite and dolomite appear in the simulations after 16 days, followed by siderite and magnesite (after 40 days). Ankerite was the last carbonate phase to precipitate, concomitant with Fe‒Mg‒smectite.

5. Discussion

5.1. Experimental Results

The petrographic study of the two samples, with SEM-EDS, did not reveal any carbonate phase precipitation. However, an increase in textural roughness in the samples was detected with the number of days of exposure into brine SC CO2, as also mentioned in [61]. The diffractograms on global powdered fractions for the two experimental specimens are not considerably different between 0 and 64 days. Nevertheless, they reflect trace amounts of talc and vermiculite, as alteration products, after most experimental runs of mafic silicates. Also present is halite. The grazing incidence diffraction of CG and GD specimens, which helps to detect the mineralogy overlaid on the face specimens, additionally indicated the presence of gypsum and smectite (Table 9). Considering that talc and vermiculite were not detected by this technique within 64 days, those mineral phases should already be present before the experiments, resulting from the replacement of iron‒magnesium igneous phases. Their trace amounts may justify the fact that they are not systematically detected in powder XRD. The absence of significant differences in the global mineralogical and chemical compositions of samples from the two experiments allows us to conclude that the reactions between minerals and fluids were not significant. On the other hand, the mineralogical and physical changes are limited to external areas of the CG and GD specimens exposed to CO2-rich brine. The changes could be due to local precipitations/dissolutions at the specimen surface and could represent the early effects of influence of the CO2-rich brine on the rock.
The measure of pH values in the brine is conditioned by the release of CO2 during depressurization after chamber opening, and thus the acidity during the experiments should be even lower than that measured when the chamber is decompressed (Table 6 and Table 7). However, the increase in pH correlates positively with the time of rock‒brine interaction (Table 6 and Table 7). The trends of the pH measurements correspond to those found in previous experimental works carried out in an autoclave [25,37,38,39].
The variability of the concentration of elements in the brine (Table 6 and Table 7) reflects the reaction dynamics imposed by the composition of the high-salinity brine, the rock composition (Table 5) and the experimental conditions. In general, the concentrations of the experimental solutions, with higher Na and lower Ca and Mg concentrations for GD, agree with the less mafic composition of this lithotype when compared to the CG. The correlation of the measurements of Ca2+, Mg2+ and total Fe in the brine and CaO, MgO and Fe2O3 in the rock is as follows:
  • In the case of CG, the Ca2+ concentration measured in the brine shows a decrease after each run. This decrease in Ca2+ is not described elsewhere [14,25]. On the contrary, and in line with the behavior of Mg2+ and total Fe, what is generally described is an increase in its concentration. This was also observed with the GD experiments.
  • The Ca2+ (aqueous) decrease can be explained by the high content of this ion in the initial brine. Under the experimental conditions, Ca2+ should be consumed when forming secondary minerals (Ca‒Al‒Si; calcium aluminum silicates), as predicted by the modelling. The hypothesis that precipitation of gypsum within the autoclave could account for the Ca2+ decrease should be discarded, since the sulphate ion concentration is not sufficiently high. Modelling results indicate that for gypsum to precipitate the sulphate concentration should be at least double.
  • The 0.4 wt. % increase in CaO in the total rock composition after a 64-day run seems to reflect not only its incorporation in the structure of Al‒silicates but also the crystallization of gypsum during the drying process, after concluding the run.
  • Increases of iron and magnesium in solution are in accordance with the decrease, albeit reduced, of these elements (0.4 wt. % FeO and 0.1 wt. % MgO) in the whole rock composition after 64 days. These observations are also in agreement with the textural observations, where the Fe‒Mg mineral phases are the first to react with acidified brine, releasing these components into the solution.
Regarding the experiment with GD, the variation of Ca2+ and Mg2+ concentrations in brine shows a very small increase, or a tendency to remain constant. The increase is in line with what is described in the literature [25]. Such an increase in solution is reflected in the decreasing concentrations of CaO (0.42 wt. %) and MgO (0.21 wt. %) in total rock for the 64-day run specimens. FeO shows a similar trend, decreasing by 0.3 wt. % in the same specimens.

5.2. Numerical Simulation and Correlation with Experimental Results

Observations on fluid chemistry and pH changes over time indicate that, under similar conditions of PCO2 and temperature, the simulation with SSA = 120 cm2/g shows a relative agreement with the experimental data (Figure 7 and Figure 8). The considered SSA is in the range of the specific area of olivine, plagioclase and pyroxene used in [53]. The predicted mobility of calcium is higher than for other components, with a slight increase in concentration for the first 24 days, before being incorporated within the secondary phases. As mentioned above, this increase is not reflected in Experiment 1.
The model also shows that Ca2+ has been consumed in Ca‒zeolites and/or carbonates; for instance, mesolite and mordenite are the first phases to consume calcium at a low pH < 5.5. Moreover, the gradual increase in Mg concentration is justified by the progressive dissolution of diopside and forsterite, accompanied by a moderate precipitation of dolomite and later of magnesite. The results of the newly formed mineralogy (Table 9) indicate the presence of early neoformation phases (e.g., smectite) that can capture calcium within its structure. Nevertheless, no carbonates were observed or detected during the experiment. In CG specimens, most likely, the secondary phases might be local and covered by the considerable amount of salts lining the rock surface.
The simulation also indicates that the Δ ( Mg/Si) and Δ ( Ca/Si) ratios are 1.45 and 0.35, respectively, and suggests that olivine, diopside and Ca‒plagioclase (the main CG minerals) dissolve stoichiometrically [25]. Therefore, the high ratio between silicon in the simulation and the experiment (Si/Si* = 10) testify to the nonstoichiometric dissolution of CG in the experiment. Furthermore, ( Δ ( Mg*/Si*) = 4) is significantly higher and denotes that magnesium dissolves faster than silica (incongruent dissolution). At pH > 5.5, Ca‒Mg carbonates (namely, calcite and dolomite) start precipitating and continue up to a neutral/alkaline pH, consistent with the observations from other authors [25,55]. Calcite remains the dominant carbonate phase at a high pH, indicating its stability under alkaline conditions. Iron displayed a similar trend to Mg2+, showing a high release rate. Consequently, a tiny fraction of siderite and Fe‒Mg-rich smectite was precipitated, concomitant with the dissolution of the primary Fe-rich minerals (fayalite) and followed by ankerite (Ca (Fe, Mg) (CO3)2). The calculated silica and iron concentrations are significantly higher compared to Experiment 1.
Besides the incongruent dissolution observed in the experiments, CG rocks are less reactive than basaltic rocks. As a matter of comparison, Gysi and Stefánsson [25] measured elevated PCO2, ion and Si values in glass basalts, in the same range of the simulations (2 mmol/kgw). Note that the brine used in Experiment 1 has a CO2 concentration 1.5 times higher than that used previously by Gysi and Stefánsson [55], and thus, according to the those authors’ results, further secondary phases are expected, since dissolved CO2 is available during the time of the experiment. The limitation in secondary phases (in CG) is due to the rock reactivity. The experiment’s duration is another factor influencing the secondary phases’ precipitation.
The total volume of secondary minerals predicted is 0.8 vol %, dominated mostly by zeolites (0.61% in rock volume), carbonates, especially calcite (0.172% in rock volume), and insignificant amount of clays. The small amounts of secondary phases render their identification in SEM very difficult, as reported in previous studies [62]. After 50 days, the Δ ( Ca) < 0 corresponds to a stage where zeolites and carbonates competed with a dominant volume of Ca‒zeolites. The Mg/Si and Fe/Si ratios increased over time, resulting from the continuous dissolution of clinopyroxene and olivine and precipitating trace amounts of Mg‒Fe-rich carbonates, as well as clay minerals.
SEM and XRD observations showed a significant amount of salt crystals lining the samples’ surfaces. However, small amounts of Na2O were measured in the rock, contrasting with the noticeable quantity of crystals observed in SEM images. The Na and Cl concentrations also showed a cyclic decrease and increase in concentration, not consistent with an unlikely continuous evaporation of the brine during the experiments. We believe that halite and gypsum crystallized after opening the chamber and degassing, or during drying.
As discussed in Section 2, other authors with similar experimental approaches have observed mineral carbonation occurring in time frames comparable to those applied in our experiments. Still, the lack of noticeable precipitation of carbonate minerals during our experiments was not unexpected, since the experiment was designed to look at early-phase dissolution conditions. The proportion of SC CO2/brine/rock, was defined to ensure that the brine would always be supersaturated CO2 during the experiments, as is expected in early-phase injections when dissolution is the dominant process. Such proportions imply that, during the whole duration of the experiments, the pH remained very low in the autoclave, and carbonates could not precipitate. Exposure of the samples to the CO2-supersaturated brine for longer periods would probably result in consumption of the CO2, pH increase and precipitation of carbonate minerals. Given the time constraints of the project, for the second run of experiments, with the gabbro-diorite sample, the duration of the runs was kept constant, but the CO2/brine/rock proportion was changed. The volume of CO2 was decreased and the mass of rock increased, to see if mineral carbonation would be observed during at least the 64-day runs. The results of this second round of experiments have not yet been fully explored as geochemical modelling is still being done, but they will be the basis for defining the physical conditions and duration of the next set of experiments.

6. Conclusions

The results obtained reveal, in the first analysis, the complexity of the systems considered: not only the mineralogy observed in the CG and GD but also the composition of the highly saline brine used in the experiments. Thus, a full fit between modelling and experimental results was not always verified.
The preliminary results of the numerical modelling indicate that carbonate precipitation is possible in a batch reactor at a low temperature and pressure (40 °C and 80 kbar). However, the amount of carbonated minerals is very small. In all the tests conducted, Ca‒Mg‒Fe types of carbonates (calcite, dolomite, magnesite, siderite and ankerite) are predicted, mostly after 64 days (about 0.18% in volume). At this time, carbonates are coupled with the secondary silicates (0.62 vol %) namely zeolites, clays and amorphous silica. Zeolites and amorphous silica were the first predicted phases, forming just after two days.
After 64 days, the experimental data are in line with the modelling as far as the Ca‒Al‒Si mineral phases. The presence of smectite was verified by grazing XRD. However, calcite, or any other carbonate also predicted by the model in small quantities, was not recorded by any of the analysis techniques (SEM-EDS, XRD, FTIR). Both experiments detected a large amount of salt (gypsum and halite) lining on specimens’ surfaces that was not reproduced by the model. Those should have precipitated after opening the chamber/during drying. Some vestigial secondary phases not detected by XRD can be hidden under the salts and not observed by SEM-EDS.
Experiment 2 with GD was not modelled, but the experimental results are in line with the observations from Experiment 1: textural features, given enhanced dissolution of ferromagnesian minerals and increased roughness with run time, and secondary mineralogy precipitation (smectite, halite and gypsum).
The measured complex variations in brine composition and total rock compositions reflect the dissolution under SC CO2 conditions but also the contribution of the high-salinity brine.
The sensitive analysis conducted on the reactive surface area demonstrated that, for the cumulate gabbros, a specific surface area of 120 cm2/g is required to fit the geochemical model instead of the 250 cm2/g reported for basalt glass. Alternatively, the BET method can be applied. This preliminary model’s results will provide interesting benchmarking, and other alternatives are being considered to adequately match the laboratory results.
The experimental and modelling results for 64 days essentially reflect a dissolution mechanism. For higher pH values, and for 64-day runs, the prevailing mechanism changes and significant carbonation occurs. Although in small amounts, the carbonate precipitation would be significant if upscaled to a reservoir scale. Subsequent experiments within the INCARBON project will attempt to replicate the conditions under which mineral precipitation will be the prevailing process, in order to establish a clear picture of the mineral carbonation potential in the target rocks.

Supplementary Materials

The following are available online at https://www.mdpi.com/2076-3417/10/15/5083/s1, Figure S1: Variations of brine SC-CO2 composition, during experiment with cumulate-gabbro: (a) Ca2+, (b) Mg2+ and K+; (c) total Fe and SiO2; (d) SO42−; (e) Na+; (f) Cl. Figure S2: Variations of brine SC-CO2 composition, during experiment with gabbro-diorite: (a) Ca2+, (b) Mg2+ and K+; (c) SiO2; (d) SO42−; (e) Na+; (f) Cl.

Author Contributions

E.B., P.M., J.P. and J.C. were responsible for the experimental design applied in this study; H.A. was responsible for the numerical modelling characterization; E.B. was responsible for the carbonation experiments. P.M., J.P. and M.B. obtained and interpreted the SEM-EDS data; J.M., M.B., P.M. and C.G. obtained and interpreted the XRD data; C.M. obtained and interpreted the ATR-FTIR data; P.B. obtained and interpreted brine data with ICP-MS. F.S. determined the roughness; E.B., H.B., P.M., J.P. and J.C. interpreted the data and planned this paper. All the authors discussed the results and edited the manuscript. All authors have read and agreed to the published version of the manuscript.

Funding

This work was supported by national funds through the Portuguese FCT—Fundação Para a Ciência e Tecnologia—in the scope of project INCARBON (contract PTDC/CTA-GEO/31853/2017).

Acknowledgments

APS—Ports of Sines and the Algarve Authority, S.A.—is gratefully acknowledged for cooperation on the collection of rock samples from the Monte Chãos quarry. The two anonymous reviewers of the submitted manuscript are acknowledgment for their very constructive comments and suggestions that greatly contributed to the improvement of the final version of this article.

Conflicts of Interest

The authors declare no conflicts of interest. The funders had no role in the design of the study; in the collection, analyses, or interpretation of data; in the writing of the manuscript, or in the decision to publish the results.

References

  1. IEA. Energy Technology Perspectives 2017: Catalysing Energy Technology Transformations; IEA/OECD, Ed.; IEA: Paris, France, 2017; p. 443. [Google Scholar] [CrossRef] [Green Version]
  2. Bachu, S. Sequestration of CO2 in geological media: Criteria and approach for site selection in response to climate change. Energy Convers. Manag. 2000, 41, 953–970. [Google Scholar] [CrossRef]
  3. Benson, S.M.; Cole, D.R. CO2 Sequestration in Deep Sedimentary Formations. Elements 2008, 4, 325–331. [Google Scholar] [CrossRef]
  4. Sayegh, S.; Krause, F.; Girard, M.; DeBree, C. Rock/Fluid Interactions of Carbonated Brines in a Sandstone Reservoir: Pembina Cardium, Alberta, Canada. SPE Form. Eval. 1990, 5, 399–405. [Google Scholar] [CrossRef]
  5. Izgec, O.; Demiral, B.; Bertin, H.; Akin, S. CO2 injection into saline carbonate aquifer formations I: Laboratory investigation. Transp. Porous Media 2008, 72, 1–24. [Google Scholar] [CrossRef]
  6. Gaus, I. Role and impact of CO2-rock interactions during CO2 storage in sedimentary rocks. Int. J. Greenh. Gas Control 2010, 4, 73–89. [Google Scholar] [CrossRef]
  7. Saeedi, A.; Rezaee, R.; Evans, B.; Clennell, B. Multiphase flow behaviour during CO2 geo-sequestration: Emphasis on the effect of cyclic CO2–brine flooding. J. Pet. Sci. Eng. 2011, 79, 65–85. [Google Scholar] [CrossRef]
  8. Klein, F.; McCollom, T. From serpentinization to carbonation: New insights from a CO2 injection experiment. Earth Planet. Sci. Lett. 2013, 379, 137–145. [Google Scholar] [CrossRef]
  9. Druckenmiller, M.L.; Maroto-Valer, M.M. Carbon sequestration using brine of adjusted pH to form mineral carbonates. Fuel Process. Technol. 2005, 86, 1599–1614. [Google Scholar] [CrossRef]
  10. McGrail, B.P.; Spane, F.A.; Amonette, J.E.; Thompson, C.R.; Brown, C.F. Injection and Monitoring at the Wallula Basalt Pilot Project. Energy Procedia 2014, 63, 2939–2948. [Google Scholar] [CrossRef] [Green Version]
  11. Pedro, J.; Araújo, A.A.; Moita, P.; Beltrame, M.; Lopes, L.; Chambel, A.; Berrezueta, E.; Carneiro, J. Mineral carbonation of CO2 in Mafic Plutonic Rocks, I – Screening criteria and application to a case study in SW Portugal. Appl. Sci. 2020, 10, 4879. [Google Scholar] [CrossRef]
  12. Rosenbauer, R.; Koksalan, T.; Palandri, J. Experimental investigation of CO2-brine-rock interactions at elevated temperature and pressure: Implications for CO2 sequestration in deep-saline aquifers. Fuel Process. Technol. 2005, 86, 1581–1597. [Google Scholar] [CrossRef]
  13. Liu, Q.; Maroto-Valer, M. Investigation of the pH effect of a typical host rock and buffer solution on CO2 sequestration in synthetic brines. Fuel Process. Technol. 2010, 91, 1321–1329. [Google Scholar] [CrossRef]
  14. Andreani, M.; Luquot, L.; Gouze, P.; Godard, M.; Hoisé, E.; Gibert, B. Experimental Study of Carbon Sequestration Reactions Controlled by the Percolation of CO2-Rich Brine through Peridotites. Environ. Sci. Technol. 2009, 43, 1226–1231. [Google Scholar] [CrossRef]
  15. Romão, I.S.; Gando-Ferreira, L.M.; da Silva, M.M.V.G.; Zevenhoven, R. CO2 sequestration with serpentinite and metaperidotite from Northeast Portugal. Miner. Eng. 2016, 94, 104–114. [Google Scholar] [CrossRef]
  16. Duan, Z.; Sun, R. An improved model calculating CO2 solubility in pure water and aqueous NaCl solutions from 273 to 533 K and from 0 to 2000 bar. Chem. Geol. 2003, 193, 257–271. [Google Scholar] [CrossRef]
  17. Chizmeshya, A.V.G.; McKelvy, M.J.; Squires, K.; Carpenter, R.W.; Bearat, H. A Novel Approach to Mineral Carbonation: Enhancing Carbonation While Avoiding Mineral Pretreatment Process Cost; Arizona State Univ: Tempe, AZ, USA, 2007. [Google Scholar] [CrossRef]
  18. Daval, D.; Martinez, I.; Corvisier, J.; Findling, N.; Goffé, B.; Guyot, F. Carbonation of Ca-bearing silicates, the case of wollastonite: Experimental investigations and kinetic modeling. Chem. Geol. 2009, 265, 63–78. [Google Scholar] [CrossRef]
  19. Daval, D.; Sissmann, O.; Menguy, N.; Saldi, G.D.; Guyot, F.; Martinez, I.; Corvisier, J.; Garcia, B.; Machouk, I.; Knauss, K.G.; et al. Influence of amorphous silica layer formation on the dissolution rate of olivine at 90 °C and elevated pCO2. Chem. Geol. 2011, 284, 193–209. [Google Scholar] [CrossRef]
  20. Sissmann, O.; Daval, D.; Brunet, F.; Guyot, F.; Verlaguet, A.; Pinquier, Y.; Findling, N.; Martinez, I. The deleterious effect of secondary phases on olivine carbonation yield: Insight from time-resolved aqueous-fluid sampling and FIB-TEM characterization. Chem. Geol. 2013, 357, 186–202. [Google Scholar] [CrossRef]
  21. O.´Connor, W.; Dahlin, D.; Nilsen, D.; Rush, G.E.; Walters, R.; Turner, P. Carbon Dioxide Sequestration by Direct Mineral Carbonation: Results from Recent Studies and Current Status. In Proceedings of the First National Conference on Carbon Sequestration, Washington, DC, USA, 14–17 May 2001. [Google Scholar]
  22. Béarat, H.; McKelvy, M.J.; Chizmeshya, A.V.G.; Gormley, D.; Nunez, R.; Carpenter, R.W.; Squires, K.; Wolf, G.H. Carbon Sequestration via Aqueous Olivine Mineral Carbonation:  Role of Passivating Layer Formation. Environ. Sci. Technol. 2006, 40, 4802–4808. [Google Scholar] [CrossRef]
  23. Gerdemann, S.J.; O’Connor, W.K.; Dahlin, D.C.; Penner, L.R.; Rush, H. Ex Situ Aqueous Mineral Carbonation. Environ. Sci. Technol. 2007, 41, 2587–2593. [Google Scholar] [CrossRef]
  24. Soong, Y.; Fauth, D.L.; Howard, B.H.; Jones, J.R.; Harrison, D.K.; Goodman, A.L.; Gray, M.L.; Frommell, E.A. CO2 sequestration with brine solution and fly ashes. Energy Convers. Manag. 2006, 47, 1676–1685. [Google Scholar] [CrossRef]
  25. Gysi, A.P.; Stefánsson, A. CO2-water-basalt interaction. Low temperature experiments and implications for CO2 sequestration into basalts. Geochim. Cosmochim. Acta 2012, 81, 129–152. [Google Scholar] [CrossRef]
  26. Alfredsson, H.A.; Oelkers, E.H.; Hardarsson, B.S.; Franzson, H.; Gunnlaugsson, E.; Gislason, S.R. The geology and water chemistry of the Hellisheidi, SW-Iceland carbon storage site. Int. J. Greenh. Gas Control 2013, 12, 399–418. [Google Scholar] [CrossRef] [Green Version]
  27. Matter, J.M.; Stute, M.; Snaebjornsdottir, S.O.; Oelkers, E.H.; Gislason, S.R.; Aradottir, E.S.; Sigfusson, B.; Gunnarsson, I.; Sigurdardottir, H.; Gunnlaugsson, E.; et al. Rapid carbon mineralization for permanent disposal of anthropogenic carbon dioxide emissions. Science 2016, 352, 1312–1314. [Google Scholar] [CrossRef] [Green Version]
  28. Kaszuba, J.; Janecky, D.; Snow, M. Carbon dioxide reaction processes in a model brine aquifer at 200°C and 200 bars: Implications for geologic sequestration of carbon. Appl. Geochem. 2003, 18, 1065–1080. [Google Scholar] [CrossRef]
  29. Peuble, S.; Godard, M.; Luquot, L.; Andreani, M.; Martinez, I.; Gouze, P. CO2 geological storage in olivine rich basaltic aquifers: New insights from reactive-percolation experiments. Appl. Geochem. 2015, 52, 174–190. [Google Scholar] [CrossRef]
  30. Peuble, S.; Godard, M.; Gouze, P.; Leprovost, R.; Martinez, I.; Shilobreeva, S. Control of CO2 on flow and reaction paths in olivine-dominated basements: An experimental study. Geochim. Cosmochim. Acta 2019, 252, 16–38. [Google Scholar] [CrossRef]
  31. McGrail, B.P.; Schaef, H.T.; Ho, A.M.; Chien, Y.J.; Dooley, J.J.; Davidson, C.L. Potential for carbon dioxide sequestration in flood basalts. J. Geophys. Res. Solid Earth 2006, 111, B12. [Google Scholar] [CrossRef]
  32. Schaef, H.T.; McGrail, B.P. Dissolution of Columbia River Basalt under mildly acidic conditions as a function of temperature: Experimental results relevant to the geological sequestration of carbon dioxide. Appl. Geochem. 2009, 24, 980–987. [Google Scholar] [CrossRef]
  33. Kanakiya, S.; Adam, L.; Esteban, L.; Rowe, M.C.; Shane, P. Dissolution and secondary mineral precipitation in basalts due to reactions with carbonic acid. J. Geophys. Res. Solid Earth 2017, 122, 4312–4327. [Google Scholar] [CrossRef]
  34. André, L.; Audigane, P.; Azaroual, M.; Menjoz, A. Numerical modeling of fluid–rock chemical interactions at the supercritical CO2–liquid interface during CO2 injection into a carbonate reservoir, the Dogger aquifer (Paris Basin, France). Energy Convers. Manag. 2007, 48, 1782–1797. [Google Scholar] [CrossRef]
  35. Gaus, I.; Audigane, P.; Andre, L.; Lions, J.; Jacquemet, N.; Dutst, P.; Czernichowski-Lauriol, I.; Azaroual, M. Geochemical and solute transport modelling for CO2 storage, what to expect from it? Int. J. Greenh. Gas Control 2008, 2, 605–625. [Google Scholar] [CrossRef] [Green Version]
  36. Berrezueta, E.; González-Menéndez, L.; Breitner, D.; Luquot, L. Pore system changes during experimental CO2 injection into detritic rocks: Studies of potential storage rocks from some sedimentary basins of Spain. Int. J. Greenh. Gas Control 2013, 17, 411–422. [Google Scholar] [CrossRef]
  37. Luquot, L.; Gouze, P. Experimental determination of porosity and permeability changes induced by injection of CO2 into carbonate rocks. Chem. Geol. 2009, 265, 148–159. [Google Scholar] [CrossRef]
  38. Tarkowski, R.; Wdowin, M.; Manecki, M. Petrophysical examination of CO2-brine-rock interactions—results of the first stage of long-term experiments in the potential Zaosie Anticline reservoir (central Poland) for CO2 storage. Environ. Monit. Assess. 2014, 187, 4215. [Google Scholar] [CrossRef] [Green Version]
  39. Berrezueta, E.; Ordoñez Casado, B.; Quintana, L. Qualitative and quantitative changes in detrital reservoir rocks caused by CO2 – brine – rock interactions during first injection phases (Utrillas sandstones, northern Spain). Solid Earth 2016, 7, 37–53. [Google Scholar] [CrossRef] [Green Version]
  40. Lake, L.W. Enhanced Oil Recovery; Prentice Hall: Englewood Cliffs, NJ, USA, 1989. [Google Scholar]
  41. Span, R.; Wagner, W. A New Equation of State for Carbon Dioxide Covering the Fluid Region from the Triple-Point Temperature to 1100 K at Pressures up to 800 MPa. J. Phys. Chem. Ref. Data 1996, 25, 1509–1596. [Google Scholar] [CrossRef] [Green Version]
  42. Holloway, S. An overview of the underground disposal of carbon dioxide. Energy Convers. Manag. 1997, 38, S193–S198. [Google Scholar] [CrossRef]
  43. Georgiou, C.D.; Sun, H.J.; McKay, C.P.; Grintzalis, K.; Papapostolou, I.; Zisimopoulos, D.; Panagiotidis, K.; Zhang, G.; Koutsopoulou, E.; Christidis, G.E.; et al. Evidence for photochemical production of reactive oxygen species in desert soils. Nat. Commun. 2015, 6, 7100. [Google Scholar] [CrossRef] [Green Version]
  44. Beltrame, M.; Liberato, M.; Mirão, J.; Santos, H.; Barrulas, P.; Branco, F.; Gonçalves, L.; Candeias, A.; Schiavon, N. Islamic and post Islamic ceramics from the town of Santarém (Portugal): The continuity of ceramic technology in a transforming society. J. Archaeol. Sci. Rep. 2019, 23, 910–928. [Google Scholar] [CrossRef]
  45. Steefel, C.; Lasaga, A. A Coupled Model for Transport of Multiple Chemical-Species and Kinetic Precipitation Dissolution Reactions with Application to Reactive Flow in Single-Phase Hydrothermal Systems. Am. J. Sci. 1994, 294, 529–592. [Google Scholar] [CrossRef]
  46. Steefel, C.I. CrunchFlow Software for Modeling Multicomponent Reactive Flow and Transport; User’s Manual; Earth Sciences Division, Lawrence Berkeley, National Laboratory: Berkeley, CA, USA, 2009; pp. 12–91. [Google Scholar]
  47. Steefel, C.; Appelo, T.; Arora, B.; Jacques, D.; Kalbacher, T.; Kolditz, O.; Lagneau, V.; Lichtner, P.; Mayer, K.; Meeussen, J.; et al. Reactive transport codes for subsurface environmental simulation. Comput. Geosci 2014, 19. [Google Scholar] [CrossRef] [Green Version]
  48. Lasaga, A.C. Rate laws of chemical reactions. In kinetics of geochemical processes; Lasaga, A., Kirkpatrick, R., Eds.; Mineralogical Society of America: Washington DC, USA, 1981; Volume 8, pp. 1–68. [Google Scholar]
  49. Lasaga, A. Chemical Kinetics of Water-Rock Interaction. J. Geophys. Res. 1984, 89, 4009–4025. [Google Scholar] [CrossRef]
  50. Aagaard, P.; Helgeson, H.C. Thermodynamic and kinetic constraints on reaction rates among minerals and aqueous solutions; I, Theoretical considerations. Am. J. Sci. 1982, 282, 237–285. [Google Scholar] [CrossRef]
  51. Canilho, M.H. Elementos de geoquímica do maciço ígneo de Sines; Ciências da Terra UNL: Caparica, Portugal, 1989; pp. 65–80. [Google Scholar]
  52. Palandri, J.; Kharaka, Y. A Compilation of Rate Parameters of Water-Mineral. Interaction Kinetics for Application to Geochemical Modeling; Geological Survey: Reston, VA, USA, 2004; p. 71. [Google Scholar]
  53. Xu, T.; Apps, J.A.; Pruess, K. Numerical simulation of CO2 disposal by mineral trapping in deep aquifers. Appl. Geochem. 2004, 19, 917–936. [Google Scholar] [CrossRef]
  54. Geloni, C.; Giorgis, T.; Battistelli, A. Modeling of Rocks and Cement Alteration due to CO2 Injection in an Exploited Gas Reservoir. Transp. Porous Media 2011, 90, 183–200. [Google Scholar] [CrossRef]
  55. Gysi, A.P.; Stefánsson, A. CO2–water–basalt interaction. Numerical simulation of low temperature CO2 sequestration into basalts. Geochim. Cosmochim. Acta 2011, 75, 4728–4751. [Google Scholar] [CrossRef]
  56. Geloni, C.; Giorgis, T.; Biagi, S.; Previde Massara, E.; Battistelli, A. Modeling of Well Bore Cement Alteration as a Consequence of CO2 Injection in an Exploited Gas Reservoir. In Proceedings of the 5th Meeting of the Wellbore Integrity Network, Calgary, AB, Canada, 12–13 May 2009. [Google Scholar]
  57. Koenen, M.; Wasch, L. Reactive Surface Area in Geochemical Models-Lessons Learned from a Natural Analogue. In Proceedings of the Second EAGE Sustainable Earth Sciences (SES) Conference and Exhibition, Pau, France, 30 September–4 October 2013. [Google Scholar]
  58. Wolery, T.J.; Jackson, K.J.; Bourcier, W.L.; Bruton, C.J.; Viani, B.E.; Knauss, K.G.; Delany, J.M. Current Status of the EQ3/6 Software Package for Geochemical Modeling. In Chemical Modeling of Aqueous Systems II; American Chemical Society: Washington, DC, USA, 1990; Volume 416, pp. 104–116. [Google Scholar]
  59. Helgeson, H.C.; Garrels, R.M.; MacKenzie, F.T. Evaluation of irreversible reactions in geochemical processes involving minerals and aqueous solutions—II. Applications. Geochim. Cosmochim. Acta 1969, 33, 455–481. [Google Scholar] [CrossRef]
  60. Moita, P.; Berrezueta, E.; Pedro, J.; Miguel, C.; Beltrame, M.; Galacho, C.; Mirão, J.; Araújo, A.; Lopes, L.; Carneiro, J. Experiments on mineral carbonation of CO2 in gabbro’s from the Sines massif-first results from project InCarbon. Comunicações Geológicas 2020, 107, 91–96. [Google Scholar]
  61. Wells, R.K.; Xiong, W.; Giammar, D.; Skemer, P. Dissolution and surface roughening of Columbia River flood basalt at geologic carbon sequestration conditions. Chem. Geol. 2017, 467, 100–109. [Google Scholar] [CrossRef]
  62. Dávila, G.; Luquot, L.; Soler, J.M.; Cama, J. 2D reactive transport modeling of the interaction between a marl and a CO2-rich sulfate solution under supercritical CO2 conditions. Int. J. Greenh. Gas Control 2016, 54, 145–159. [Google Scholar] [CrossRef]
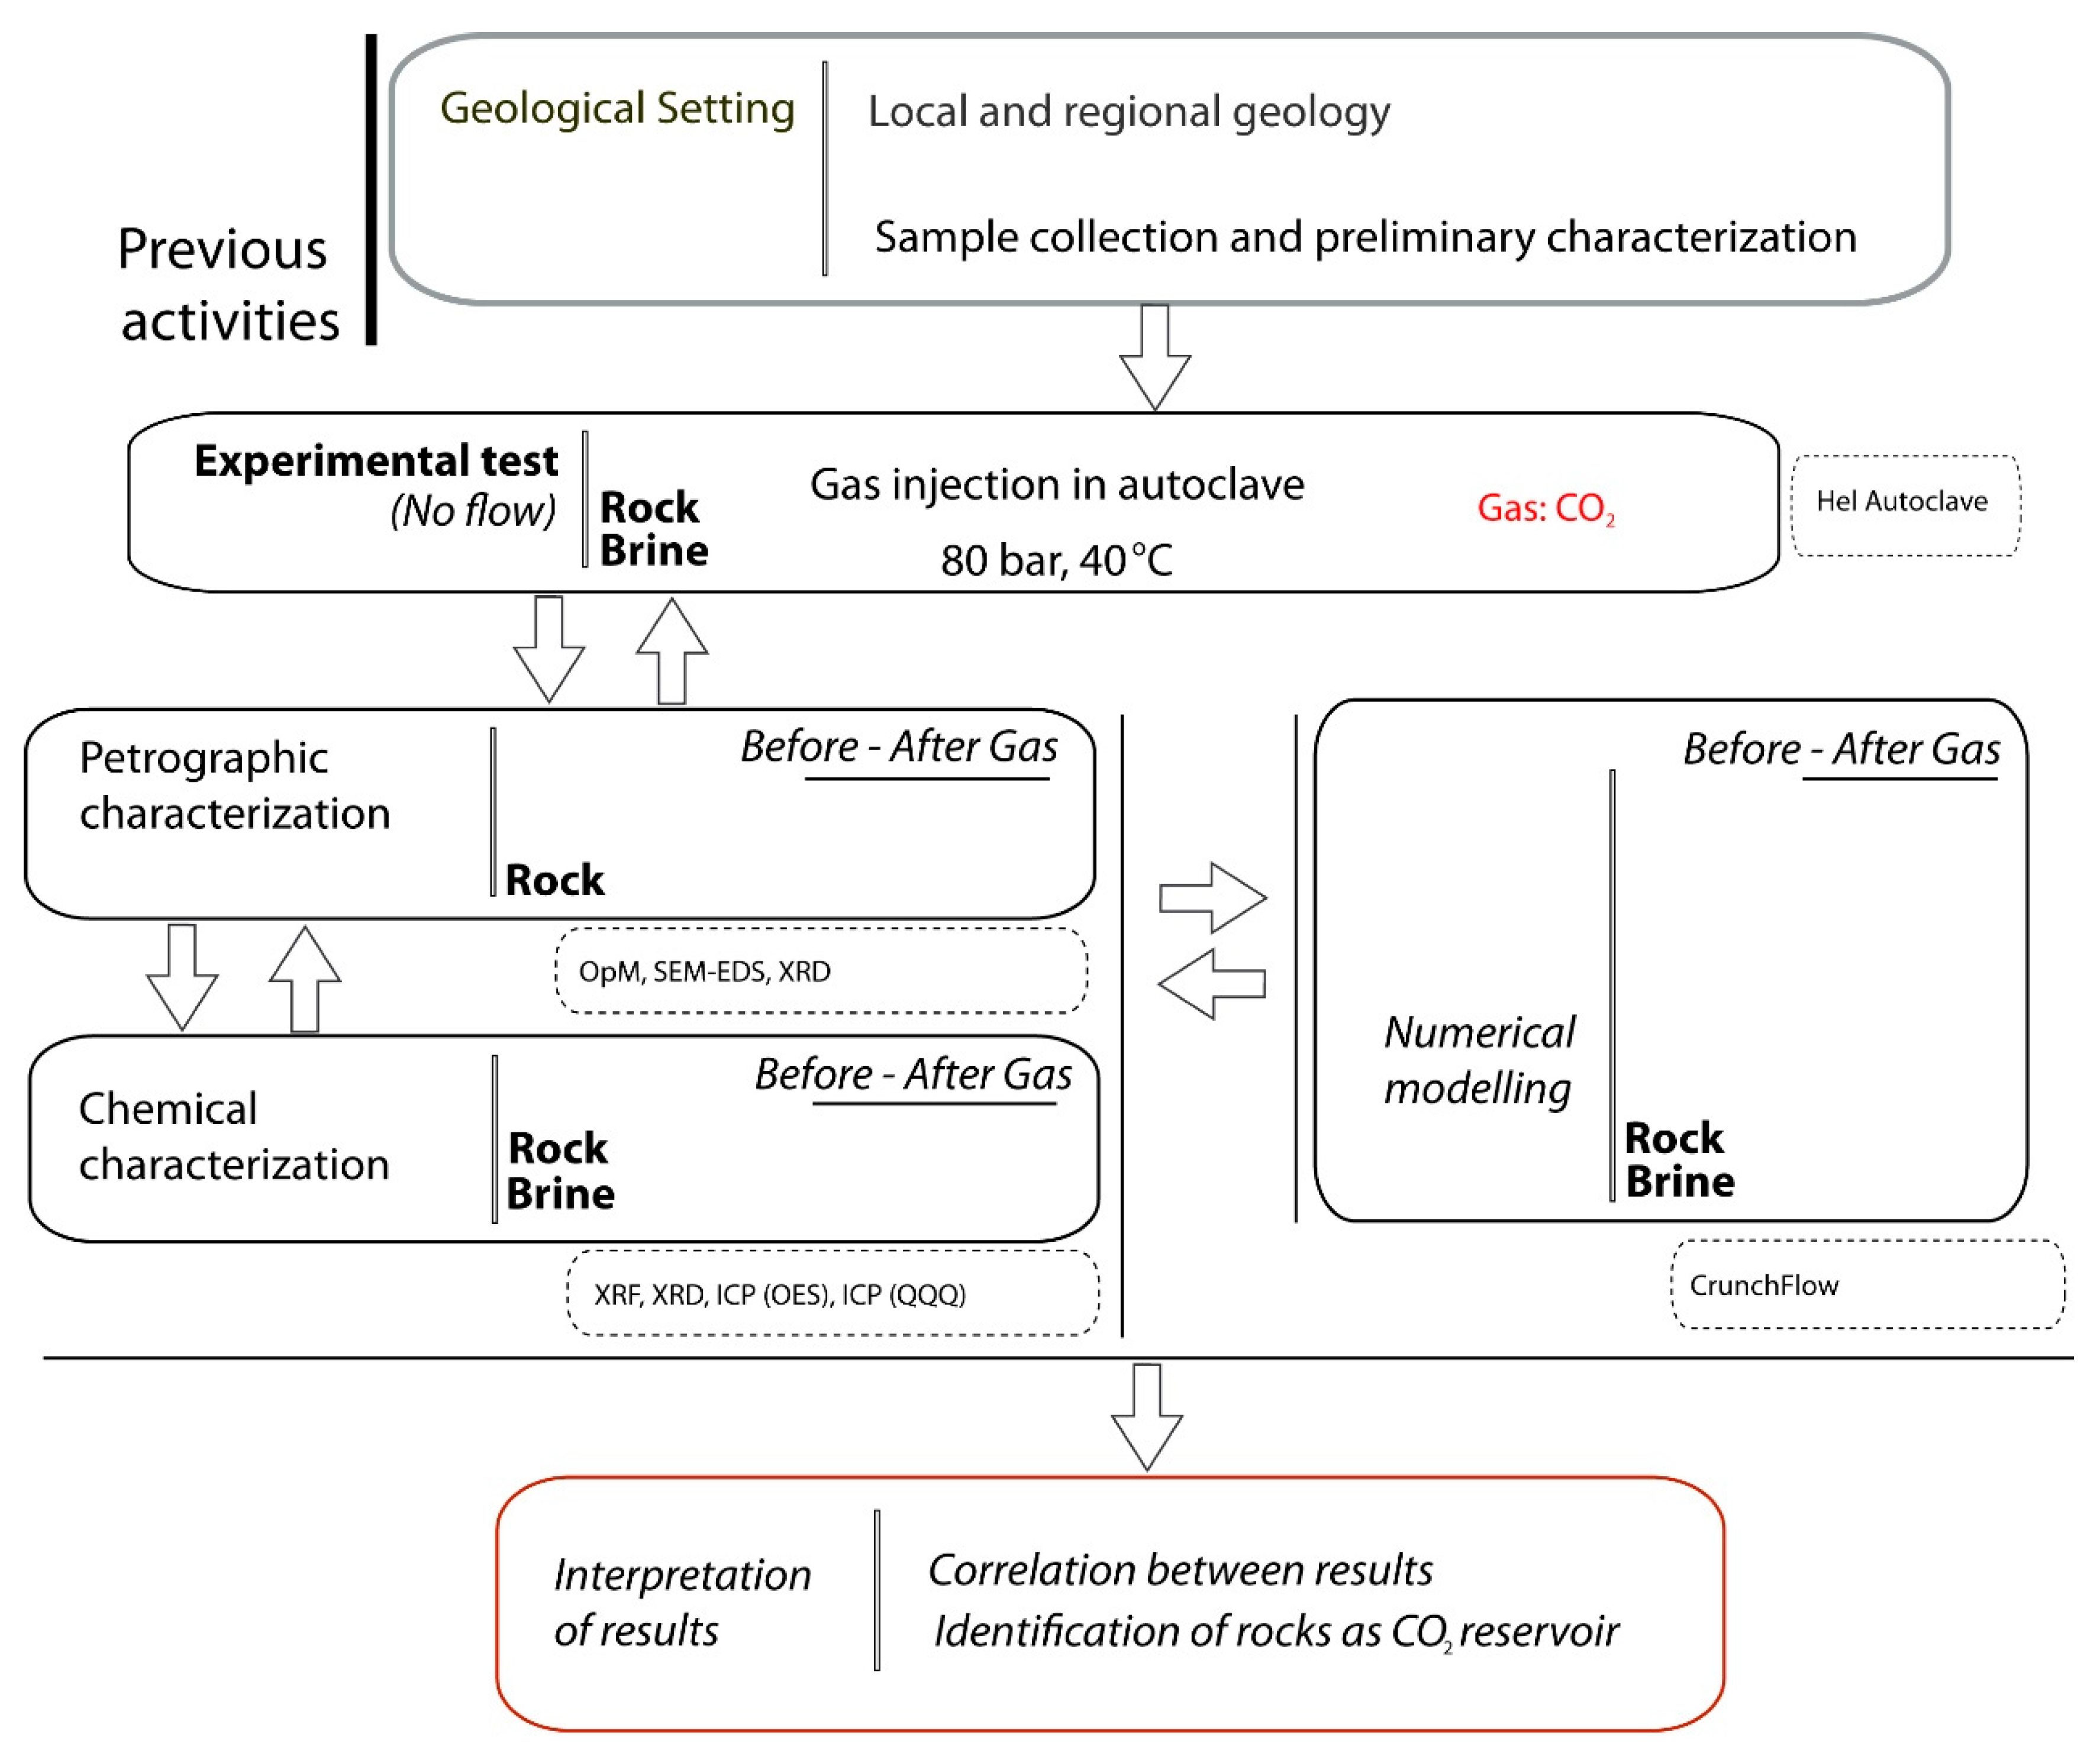
Figure 1. Schematic representation of the work sequence followed in this study.
Applsci 10 05083 g001
Figure 2. (a) Conceptual diagram of the reactive zones (Z1, Z2, Z3, Z4 and Z5) around the injection well according to [34] and [35]. (b) Sample preparation for mineralogical and geochemical analyses before and after SC CO2 exposition. (c) Layout of the experimental setup. Reactor system used for the pressurized CO2 injection (modified from. [36]).
Applsci 10 05083 g002
Figure 3. Stereo-zoom image that displays the effect of minerals dissolution (arrow) on the surface of a gabbro-diorite specimen after 64 days within brine.
Applsci 10 05083 g003
Figure 4. Diffractograms obtained through grazing apparatus on specimens after 64 days within brine: (a) cumulate gabbro; and (b) gabbro-diorite. For each we present diffractograms obtained at two distances, where the highest value is nearest the surface of the specimen.
Applsci 10 05083 g004
Figure 5. SEM images of a gabbro-diorite specimen before (upper) and after (lower) SC CO2 brine: (a) backscattered electron (BSE) images at 0 days; (b) BSE and EDS elemental maps distribution for silicon and carbon at 0 days; (c) BSE images after 64 days; and (d) BSE and EDS elemental maps distribution for silicon and carbon after 64 days, with preferential dissolution of clinopyroxene (circle) and carbon enrichment (organic accumulation) on the edge of specimen (arrow). plg—plagioclase, cpx—clinopyroxene, hal—halite.
Applsci 10 05083 g005
Figure 6. (a) Backscattered electron image of a detail of carbon-rich particles (om—organic matter) associated with halite (hal); (b) ATR-FTIR spectra of gabbro-diorite (GD) at 0 days (blue) and 16 days (pink). The calcite reference spectrum is also shown for comparison (yellow; STJapan Inc. database). The insets are the spots of analysis.
Applsci 10 05083 g006
Figure 7. (a) Simulated pH variations of the outlet fluid compared with the measured pH; (b) simulated dissolved CO2 (as HCO3) variations as a function of time computed with different specific surfaces. The measured HCO3 values are obtained after opening the chamber and are not relevant for comparison.
Applsci 10 05083 g007
Figure 8. Variation in the solution composition with time compared to the experimental data. (a) Ca2+; (b) Mg2+; (c) SiO2(aq); (d) Fe2+.
Applsci 10 05083 g008
Figure 9. Evolution of the simulated saturation index: for the primary (a) and secondary minerals (b) and the variation of minerals’ volume fraction (in m3 mineral/m3 rock) vs. time (c).
Applsci 10 05083 g009
Table 1. Experimental conditions of rock‒brine‒CO2 exposure in autoclave.
ExperimentSampleSamples of 27 cm3Samples of 27/2 cm3Samples of 1 cm3Brine (cm3)CO2 (cm3)Run (Days)
1Cumulate gabbro (CG)72160011841, 4, 16, 64
2Gabbro-diorite (GD)152113502181, 4, 16, 64
Table 2. Considered modal composition assumed for cumulate gabbro modelling and reactive surface area considered for the calculations.
Rock CompositionVol. Fraction (%)10 cm2/g75 cm2/g120 cm2/g170 cm2/g220 cm2/g
Reactive Surface Area (m2/m3) (or Ainitial)
Albite, NaAlSi3O8)
Anorthite, CaAl2Si2O8
Diopside, CaMgSi2O6
Forsterite, Mg2SiO4
Fayalite, Fe2SiO4
Enstatite, MgSiO3
Ferrosilite, FeSiO3
0.35
3.25
10.8
2.42
2.21
0.56
0.41
9.15
88.32
3.53 × 10²
77.1
96.63
19.97
16.0
68.65
6.62 × 10²
2.64 × 10³
5.78 × 10²
7.24 × 10²
1.34 × 10²
1.2 × 10²
1.09 × 10²
1.06 × 10³
4.23 × 10³
9.25 × 10²
1.16 × 10²
2.15 × 10²
1.92 × 10²
1.55 × 10²
1.5 × 10³
5.9 × 10³
1.31 × 10³
1.64 × 10³
3.05 × 10²
2.72 × 10²
2.01 × 10²
1.94 × 10³
7.76 × 10³
1.69 × 10³
2.12 × 10³
3.95 × 10²
3.52 × 10²
Φ (brine fraction)80
Total100
Table 3. Chemical composition of solution used as input in the simulation.
Components(mg kgw−1) (mol kgw−1)
Ca2+20505.12 × 10−2
Mg2+5602.33 × 10−2
Fe2+5.161.01 × 10−4
SiO2(aq)11.51.55 × 10−4
K+2606.64 × 10−3
Na+85,4503.7
SO4254005.62 × 10−2
Cl1133,5003.56
Table 4. Mineralogical composition obtained through powder XRD. Tr: trace amount.
Sample/DaysClinopyroxeneAmphibolePlagioclaseClinochloreVermiculiteTalcMicaOlivineHaliteRutileIlmeniteMagnetite
Experiment 1CG_03224134 25 2
CG_13828174 Tr381 2
CG_42629244TrTr3101 2
CG_163721213TrTr2121 2
CG_643424263TrTr281 2
Experiment 2GD_016469Tr 63 3
GD_1124731 Tr511 2
GD_4124731TrTr511 2
GD_16105731TrTr51111
GD_64164692 Tr421 1
Table 5. Whole-rock geochemistry before and after runs of 64 days for cumulate gabbro (CG) and gabbro-diorite (GD).
CG 0 (wt. %)Stat. ErrorCG 64 (wt. %)Stat. ErrorGD 0 (wt. %)Stat. ErrorGD 64 (wt. %)Stat. Error
SiO242.30± 0.034442.20± 0.034549.00± 0.035649.50± 0.0356
TiO23.34± 0.01753.20± 0.01753.26± 0.01763.16± 0.0176
Al2O39.40± 0.02959.50± 0.030016.20± 0.036816.40± 0.0369
Fe2O315.50± 0.013315.10± 0.013511.20± 0.011510.90± 0.0115
P2O50.28± 0.004270.34± 0.004390.85± 0.005060.74± 0.00494
MnO0.40± 0.0050.40± 0.0050.32± 0.0050.31± 0.005
MgO12.90± 0.050612.80± 0.05034.48± 0.03494.27± 0.0344
CaO12.70± 0.042813.10± 0.04448.33± 0.03757.91± 0.0371
BaO0.23± 0.0130.20± 0.0130.28± 0.0130.27± 0.013
Na2O0.84± 0.05190.88± 0.05123.46± 0.06073.59± 0.0612
K2O0.19± 0.03450.23± 0.03561.42± 0.03951.42± 0.0396
S0.19%± 0.001720.24%± 0.001780.15%± 0.001620.23%± 0.00174
LOI0.89 0.95% 0.03% 0.25%
total99.17 99.14% 98.98% 98.95%
(ppm) (ppm) (ppm) (ppm)
Rb9± 2.0810± 2.1440± 2.2439± 2.27
Sr286± 2.57313± 2.67748± 3.09763± 3.13
Y15± 2.3015± 2.3734± 2.4635± 2.49
Zr80± 2.8274± 2.90199± 3.14208± 3.19
Nb20± 2.5214± 2.6062± 2.6565± 2.68
Th9± 2.9413± 3.0210± 3.1010± 3.15
Cr478± 29.0526± 30.520± 25.465± 25.9
Co198± 5.65198± 5.76139± 5.02134± 5.00
Ni117± 4.12135± 4.297± 3.4214± 3.54
Cu62± 4.8264± 4.9142± 4.8849± 5.01
Zn103± 6.07100± 6.19108± 6.37101± 6.26
Ga14± 4.3015± 4.4125± 4.6719± 4.70
As7± 4.292± 4.398± 4.5310± 4.61
Pb0± 02± 16.712± 17.20± 0
Sn7± 27.30± 00± 013± 28.0
V479± 68.0505± 68.9323± 68.0249± 67.8
U0± 0.2091± 0.2152± 0.2212± 0.225
Cl43± 0.36454± 0.37153± 0.35970± 0.383
Table 6. Chemical analysis of pure brine and brine taken from the reaction chambers (one, four, 16 and 64 days) for Experiment 1 with CG (Figure S1 as supplementary material).
Pure Brine (mg/L)Brine Post Test (mg/L)Brine Post Test (mg/L)Brine Post Test (mg/L)Brine Post Test (mg/L)
0 Days1 Day4 Days16 Days64 Days
Na+85.45 × 10³
± 11.96 × 10³
67.11 × 10³
± 93.96 × 10³
86.02 × 10³
± 12.04 × 10³
84.05 × 10³
± 11.77 × 10³
79.68 × 10³
± 11.16 × 10³
K+260 ± 31260 ± 31305 ± 37310 ± 37415 ± 50
Mg2+ 560 ± 100590 ± 106590 ± 106610 ± 109680 ± 122
Ca2+2050 ± 2051900 ± 1901890± 1891860 ± 1861650 ± 165
SO42−5400 ± 7565400 ± 7565600 ± 7845700 ± 7985300 ± 742
Cl13.35 × 104
± 1.6 × 10⁴
10.40 × 10⁴
± 1.3 × 10⁴
13.30104
± 1.6 × 10⁴
12.40 × 10⁴
± 1.5 × 10⁴
11.90 × 10⁴
± 1.4 × 10⁴
HCO340 ± 4.035 ± 3.538 ± 3.835 ± 3.533 ± 3.3
Fe (total)5.2 ± 0.36 ± 0.311.3 ± 0.618.9 ± 0.926.4 ± 1.3
NO3 00000
SiO211.5 ± 1.220 ± 2.824.9 ± 3.539 ± 5.537 ± 5.2
pH (pH Unit.)6.9 ± 0.24.5 ± 0.14.9 ± 0.15.1 ± 0.25.5 ± 0.2
Cond (mS/cm)80,00085,00080,00075,00075,000
Table 7. Chemical analysis of pure brine and brine taken from the reaction chambers (1, 4, 16 and 64 days) with GD (Figure S2 as supplementary material).
Pure Brine (mg/L)Brine Post Test (mg/L)Brine Post Test (mg/L)Brine Post Test (mg/L)Brine Post Test (mg/L)
0 Days1 Day4 Days16 Days64 Days
Na+87.61 × 10³
± 12.26 × 10³
10.25 × 10³
± 14.35 × 10³
99.72 × 10³
± 13.96 × 10³
10.70 × 10³ ± 14.98 × 10378.54 × 103 ± 11.00 × 10³
K+235 ± 28.2250± 30240 ± 28.8270 ± 32.4275 ± 33
Mg2+ 580 ± 116560 ± 112560 ± 112580 ± 116600 ± 120
Ca2+1520 ± 1521640 ± 1641680 ± 1681660 ± 1661650 ± 165
SO42−6900 ± 9667200 ± 10087300 ± 10227600 ± 10646400 ± 896
Cl9.70 × 104
± 1.2 × 10⁴
11.70 × 10⁴
± 1.4 × 10⁴
12.70 × 10⁴
± 1.5 × 10⁴
11.20 × 10⁴
± 1.3 × 10⁴
11.10 × 10⁴
± 1.3 × 10⁴
HCO340 ± 440 ± 450 ± 5110 ± 11100 ± 10
NO3 00000
SiO28 ± 0.810 ± 139 ± 3.959 ± 5.919 ± 1.9
pH
(pH Unit.)
7 ± 0.25 ± 0.25.2 ± 0.25.4 ± 0.25.6 ± 0.2
Cond. (mS/cm)80,00077,50077,00077,00080,000
Table 8. Simulated dissolution and precipitation rate at t = 200 days (simulation with specific surface areas (SSA) = 120 cm2·g−1).
Primary MineralsReaction Rate (mol·L−1·s−1)Secondary MineralsReaction Rate (mol·L−1·s−1)
Albite2.77 × 10−11Siderite4.13 × 10−9
Anorthite−1.08 × 10⁻⁹Calcite5.01 × 10−10
Fayalite−1.24 × 10⁻¹⁰Magnesite4.01 × 10−10
Forsterite−1.64 × 10⁻¹⁰Ca_zeolites2.41 × 10−10
Enstatite−1.73 × 10⁻¹⁰Ankerite8.58 × 10−11
Diopside−6.48 × 10⁻¹¹Dolomite4.84 × 10−11
Ferrosilite−2.57 × 10⁻¹⁴Smectite1.31 × 10−12
Kaolinite5.37 × 10−15
SiO22.14 × 10−16
Table 9. Comparative summary of modelled and experimental mineral phases from cumulate gabbro (GXRD: grazing incidence geometry XRD; phases expressed as vol %).
0 days1 Day4 Days16 Days64 Days
Primary Phases Secondary Phases
Modelling Clinopyroxene (52)
Orthopyroxene (1.2)
Olivine (10)
Plagioclase (11)
Kaolinite
(2.07 × 10⁻⁵)
Ca-zeolites
(2.82 × 10⁻³)
SiO2 am.
(2.13 × 10⁻⁶)
Kaolinite
(2.4 × 10⁻⁵)
Ca-zeolites
(4.16 × 10⁻³)
Calcite
(4.8 × 10⁻⁵)
Dolomite
(5.28 × 10⁻⁶)
SiO2 am
(5.92 × 10⁻⁶)
Kaolinite
(2.42 × 10⁻⁵)
Ca-zeolites
(4.36 × 10⁻³)
Smectite (2.13 × 10⁻⁶)
Calcite (8.85 × 10⁻²)
Dolomite (8.32 × 10⁻⁴)
Magnesite (5.92 × 10⁻⁵)
Siderite (2.17 × 10⁻⁴)
Ankerite (3.95 × 10⁻⁴)
Ca-zeolites (5.54 × 10⁻²)
SiO2 am. (1.31 × 10⁻⁵)
Kaolinite (2.75 × 10⁻⁵)
Experimental Clinopyroxene (45–55)
Olivine (15–20)
Amphibole (10–15)
Plagioclase (5–10)
Ilmenite (5)
Gypsum
(SEM-EDS)
Halite
(XRD + SEM-EDS)
Gypsum
(SEM-EDS)
Halite
(SEM-EDS)
Gypsum
(SEM-EDS)
Halite
(SEM-EDS)
Smectite
(GXRD)
Gypsum
(GXRD + SEM-EDS)
Halite
(GXRD + SEM-EDS)