Article

Application of Tooth Gear Impact-Echo System for Repeated and Rapid Data Acquisition

1
School of Architecture, Soongsil University, Seoul 06978, Korea
2
Department of Safety Engineering, Incheon National University, Incheon 22012, Korea
3
Research Institute for Engineering and Technology, Incheon National University, Incheon 22012, Korea
*
Authors to whom correspondence should be addressed.
Appl. Sci. 2020, 10(14), 4784; https://doi.org/10.3390/app10144784
Submission received: 23 June 2020 / Revised: 9 July 2020 / Accepted: 10 July 2020 / Published: 12 July 2020
(This article belongs to the Special Issue Non-destructive Testing in Civil Engineering)

Abstract

:
Developments in air-coupled testing hardware in impact-echo (IE) tests have enabled new levels of scanning tests for concrete bridge decks. A tooth gear IE system has been developed using tooth gears as impactors and microelectromechanical systems (MEMS). Since the tooth gear moves and generates impacts itself, this system collects a large amount of test data across the field continuously. The contact duration of two different tooth gears is evaluated and the contact mechanism is compared to a conventional steel ball impactor by a high-speed camera. The data measurements were carried out on concrete slabs, where artificial delaminations were embedded at different depths. Based on our IE experiments, reducing the pitch or increasing the number of teeth was required to decrease the contact duration and generate the thickness mode frequency from deep delaminations. Rapidly obtained time domain data were transferred to the frequency-time domain using spectrograms to identify the dominant frequency band of the signal set. The results show that the developed system enabled us to acquire high-quality data during air-coupled IE tests and spectrogram analysis provided meaningful frequency information and verified its repeatability.

1. Introduction

Delamination-like defects are a major concrete bridge-deck deterioration concern. The internal delamination causes degradation of the structural elements in bridges as well as problems of serviceability by exposing the surface. Therefore, early detection of the internal defects is required to repair bridge decks. Impact-echo (IE) tests are a well-used non-destructive testing (NDT) method to evaluate delamination-like defects in concrete. Compared to other NDT methods, the IE test is a relatively simple testing configuration, which includes a hammer-type source and a vibration sensor. The hammer-type source literally makes an impact onto the surface of the concrete and the corresponding echo is measured. The IE test identifies the presence of delamination with depth information, and so it has been applied to bridge-deck inspection [1].
Since the IE test has proven its potential for internal damage detection [2,3], various studies have been conducted to understand the damage mechanism as well as to improve measuring systems. Gibson and Popovics discovered the physical relationship between the measured frequency and the depth of a plate-like structure, suggesting the effect of Poisson’s ratio [4]. Zhu and Popovics proposed adding air-coupled sensing to the IE test, demonstrating the leakage of the vibration mode into the air [5]. Oh et al. investigated the application of the air-coupled IE test in the case of shallow delamination and the visualization of its vibration modes [6]. Kee et al. also explained the boundary condition effect on shallow delamination [7]. Further efforts have been made on the application of air-coupled sensing through the combination of different automated systems [8,9], their research reaching into efficient impact sources with air-coupled sensing. Mazzeo et al. showed chain dragging as an impact source while Sun et al. used a ball-chain system to filter out dragging noise [10,11].
Studies on impact sources are crucial for rapid examination of the field. Mazzeo et al. presented an interesting ice ball as an impactor [10]. The disposal of ice into concrete generated mechanical vibrations indicating that shallow delamination had been detected. Evani and Popovics also demonstrated the potential of a rolling impactor for the air-coupled IE test [12]. As established from previous studies, impact sources for the IE test could be found from surrounding products. In this study, a commercially available tooth gear was used as an impactor, generating continuous vibrational forces. A hand-controlled IE system was developed, including microelectromechanical systems (MEMS) as receivers. The aim of this paper is to demonstrate that tooth gears can be applied to air-coupled IE tests and to propose a rapid scanning test configuration including acoustic noise reduction by IE system development, measurement of thickness mode frequency and data visualization. To generate IE vibration modes, the contact duration onto the surface of concrete was experimentally evaluated and excited modes were measured from intact and delamination cases in concrete slabs. Consequently, system designs will improve and extend the understanding of field applications of the IE method.

2. Theoretical Background

2.1. Impact-Echo Vibration

The IE method provides the thickness information of a concrete slab or its delamination by measuring the dominant frequency of vibration. After applying an impact source onto the surface of the concrete, the measured vibration is analyzed in the frequency domain where the frequency at the highest amplitude corresponds to the thickness mode. The relationship between the measured frequency ( f t h i c k n e s s ) and the thickness ( h ) is
f t h i c k n e s s = β V L 2 h
where β is the correction factor (usually taken to be 0.96) and V L is the longitudinal wave velocity in the concrete. Gibson and Popovics demonstrated that the thickness mode frequency was at a zero-group velocity motion of the first symmetric vibration (S1-ZGV) governed by plate guided waves [4]. Moreover, a correction factor was required to compensate for the shear motion of the plate, depending on a ratio between the shear and longitudinal waves or Poisson’s ratio. Many studies have utilized the concept of the S1-ZGV to detect internal defects using depth information [13,14,15,16]. Using Equation (1), the thickness of internal delamination-like defects can be estimated using information of the apparent velocity ( β V L ) .
However, in the case of shallow delamination, the thickness mode frequency is difficult to measure. This is because the impact source excitation frequencies have limited range up to the thickness mode frequency of shallow delamination. Instead, low frequencies from the flexural vibration of the plate are much more dominant compared to the thickness mode frequency. Oh investigated the excitability of thickness mode frequencies based on a ratio between the diameter ( a ) and thickness ( h ) of the plate under certain boundary conditions, demonstrating that the thickness mode frequency becomes dominant when the ratio ( a / h ) is lower than 2. Therefore, the IE testing results from shallow delamination mostly exhibit low frequencies [17]. The fundamental flexural vibration mode frequency ( f f l e x u r a l ) of rectangular delamination is presented as
f t h i c k n e s s = k D L 2 π 2 h 2 E h 2 12 ρ ( 1 v 2 )
where E is the elastic modulus, v is the Poisson’s ratio, ρ is the density, and k D L 2 is the dimensionless frequency based on width to depth ratio of the delamination [18].
The excitation frequencies are directly related to the contact duration ( t c ) of impactors onto the concrete surface. The shorter contact duration generates a higher frequency range of excitation. Based on contact mechanics [19], the contact duration is calculated by the sphere (impactor) and half-space (concrete) interaction, as follows:
t c = 2.536 D ρ i 2 / 5 V i 1 / 5 [ ( 1 v i 2 ) E i + ( 1 v c 2 ) E c ] 2 / 5
where D is the diameter of the impactor, ρ i is the density of the impactor, V i is the impact velocity, v i and E i are the Poisson’s ratio and elastic modulus of the impactor, respectively, and v c and E c are the Poisson’s ratio and elastic modulus of concrete, respectively. Equation (3) expresses that the contact duration is directly related to the size of the impactor, beyond its material properties. The smaller size of the impactor reduces the contact duration, corresponding to a higher frequency range of excitation.

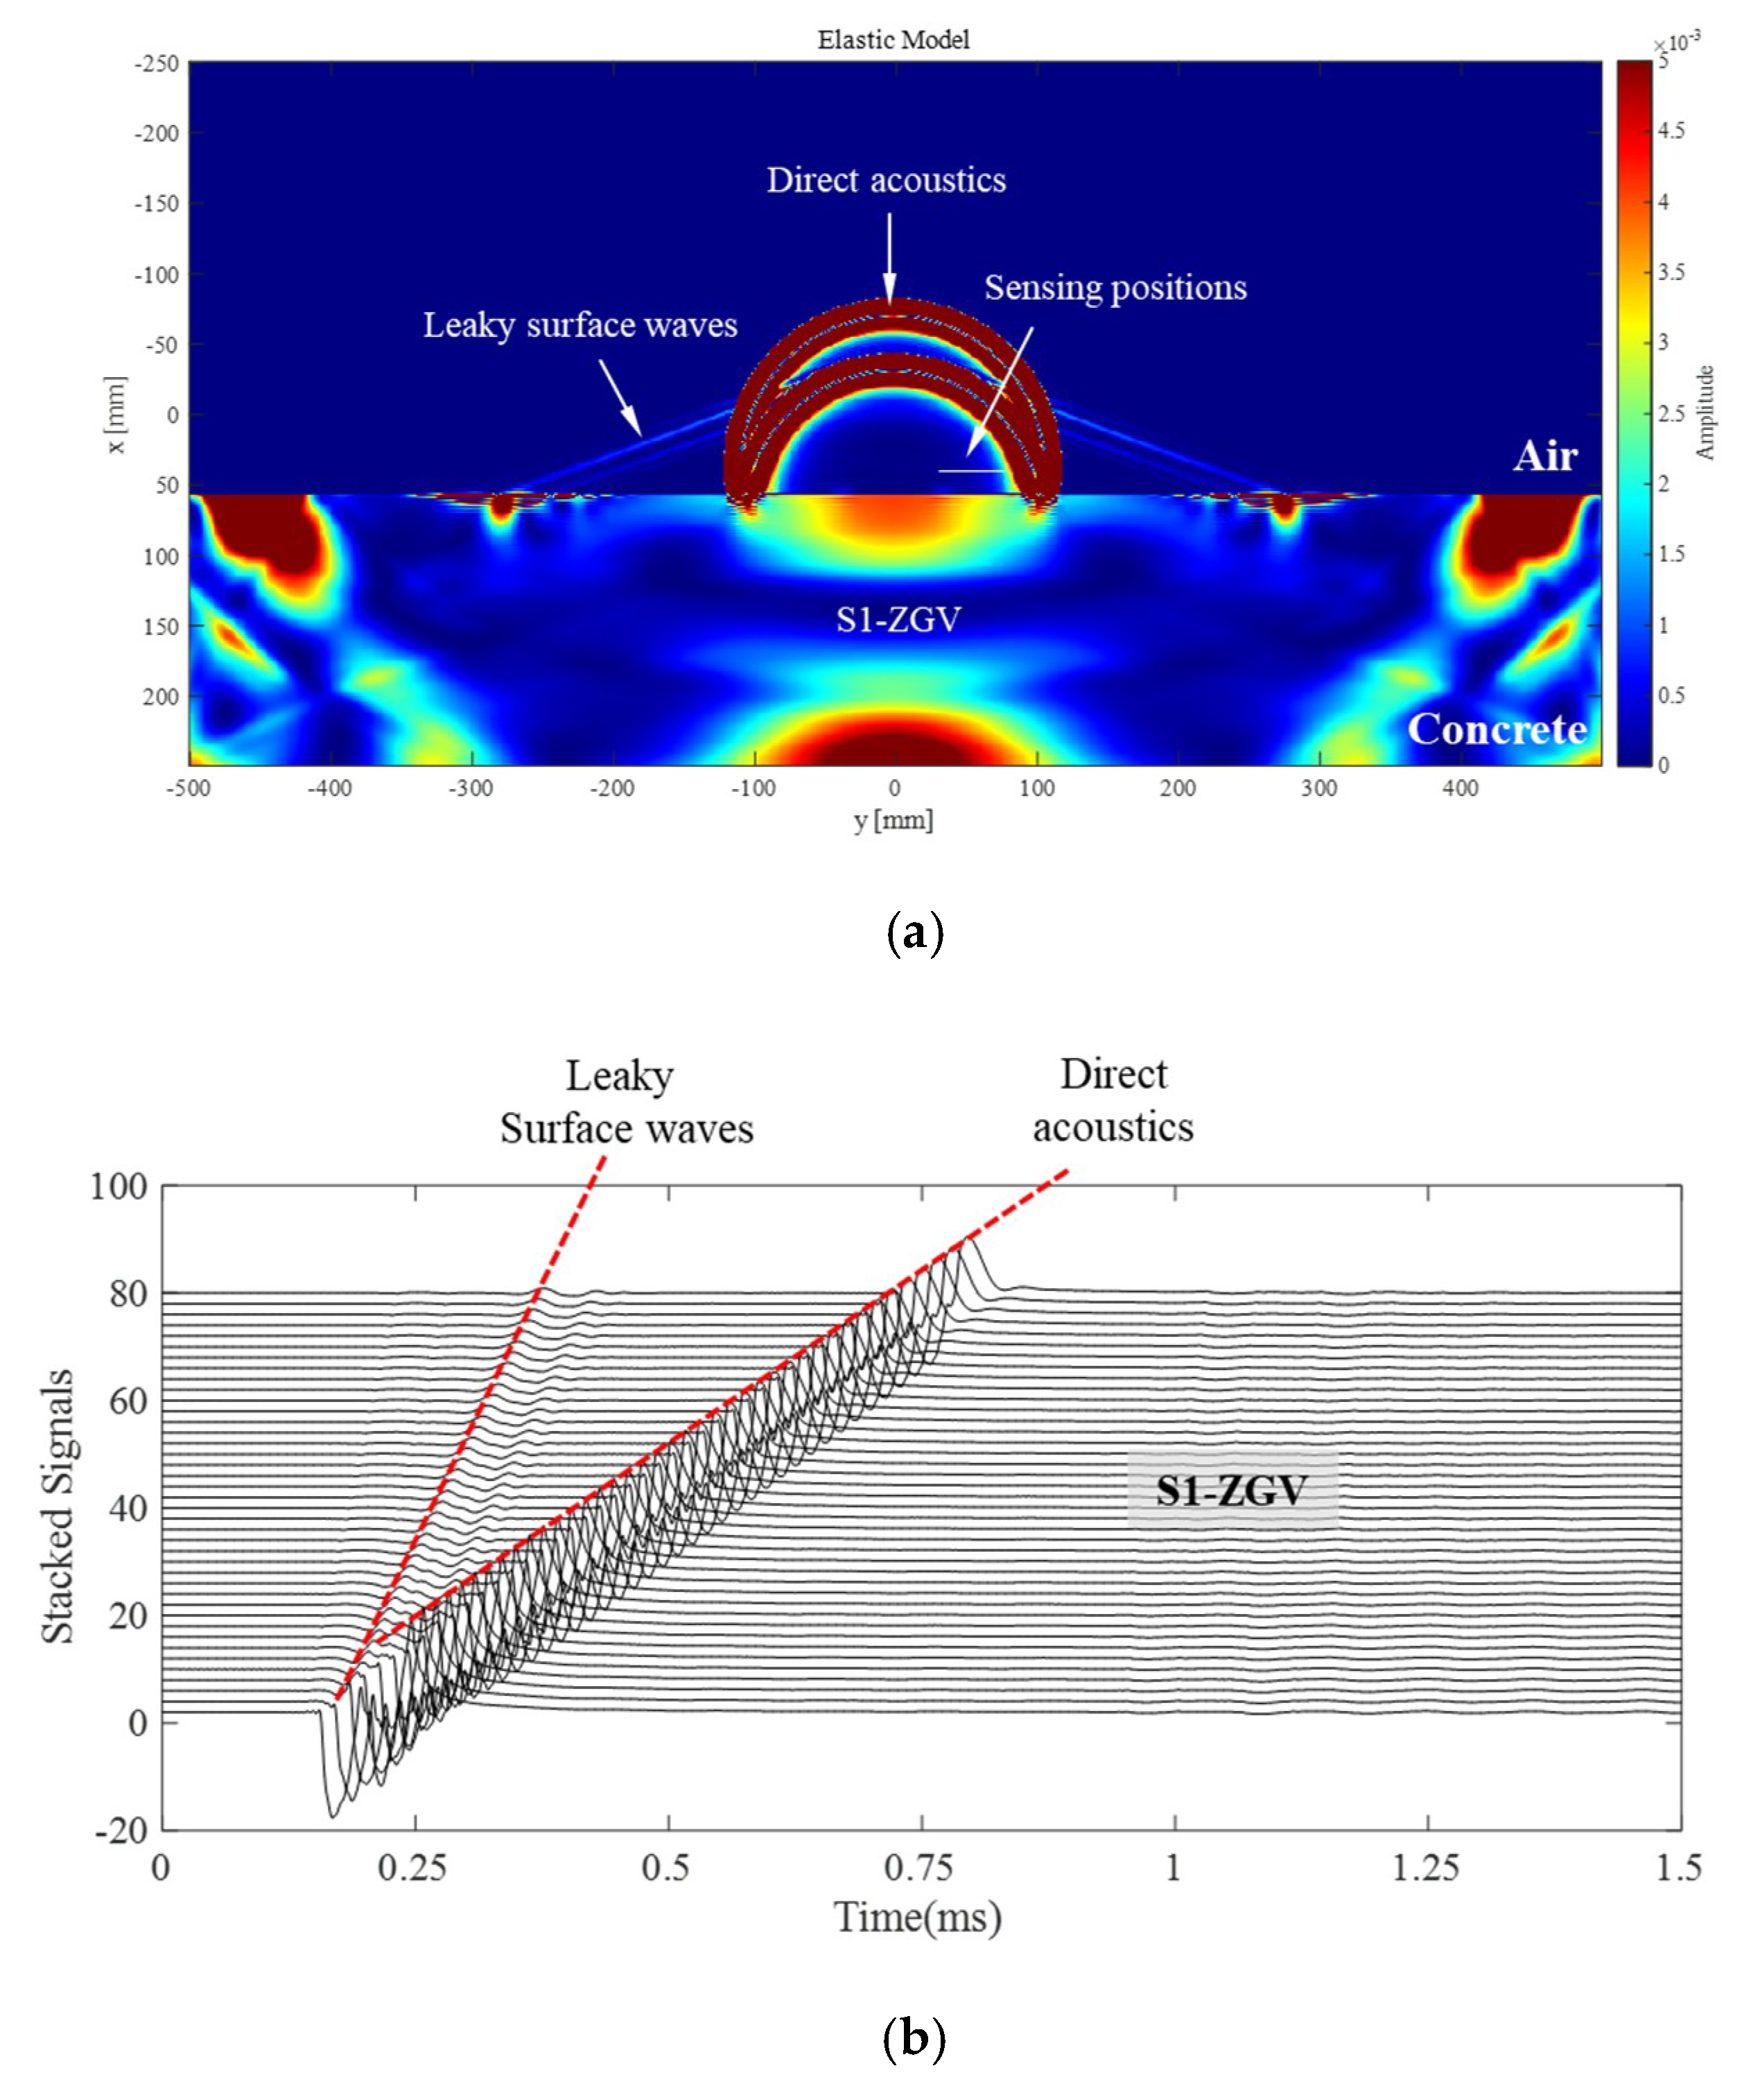
2.2. Air-Coupled Sensing Technology

The IE frequency components generated from concrete are measurable in air without touching the surface of the concrete. Zhu and Popovics theoretically and experimentally demonstrated that such vibration modes including the S1-ZGV mode and flexural mode could be measured by microphone [5]. In a half-space (air-concrete), the vibration modes were leaked into the air and an air-coupled sensor measured the same frequency components.
To confirm the theoretical background of the air-coupled IE method, wave propagation in the half-space was simulated using the k-wave toolbox in Matlab [20,21]. A half sine wave simulating a hammer-type impact was applied to the surface of concrete, and the corresponding stress wave field of air and concrete was solved. Forty sensors were continuously placed in air 20 mm above the surface of the concrete, 5 mm apart. The in-plane normal stress was analyzed as the output data. The details of the simulation are shown in Table 1. Figure 1a shows the wave field image of the air-coupled IE test, where the Von Mises stress is shown. From the image, the non-propagating S1-ZGV mode (thickness mode) was generated inside the concrete after the impact source was applied at the center of the concrete slab. In air, the leaky portion of the propagating waves (mainly Rayleigh waves) exhibited much greater velocity compared to the direct acoustics (semi-circle shape) generated by the impactor. Inside the semi-circle, the leaky portion of the thickness mode, measurable using air-coupled sensors, is shown. The signals obtained, as shown in Figure 1b, conveyed that the majority of frequencies were from the thickness mode vibration (S1-ZGV) while the propagating waves (including the leaky waves and direct acoustics) had a much higher amplitude, which were noise components of the air-coupled IE test. In fact, acoustic system noise has been reported during air-coupled sensing [11,12,16] so that efforts have been made to carefully measure the appropriate frequencies from the IE testing. Therefore, the impactor was required not to generate system noise itself while propagating leaky waves were quickly damped.

3. Tooth Gear Testing System

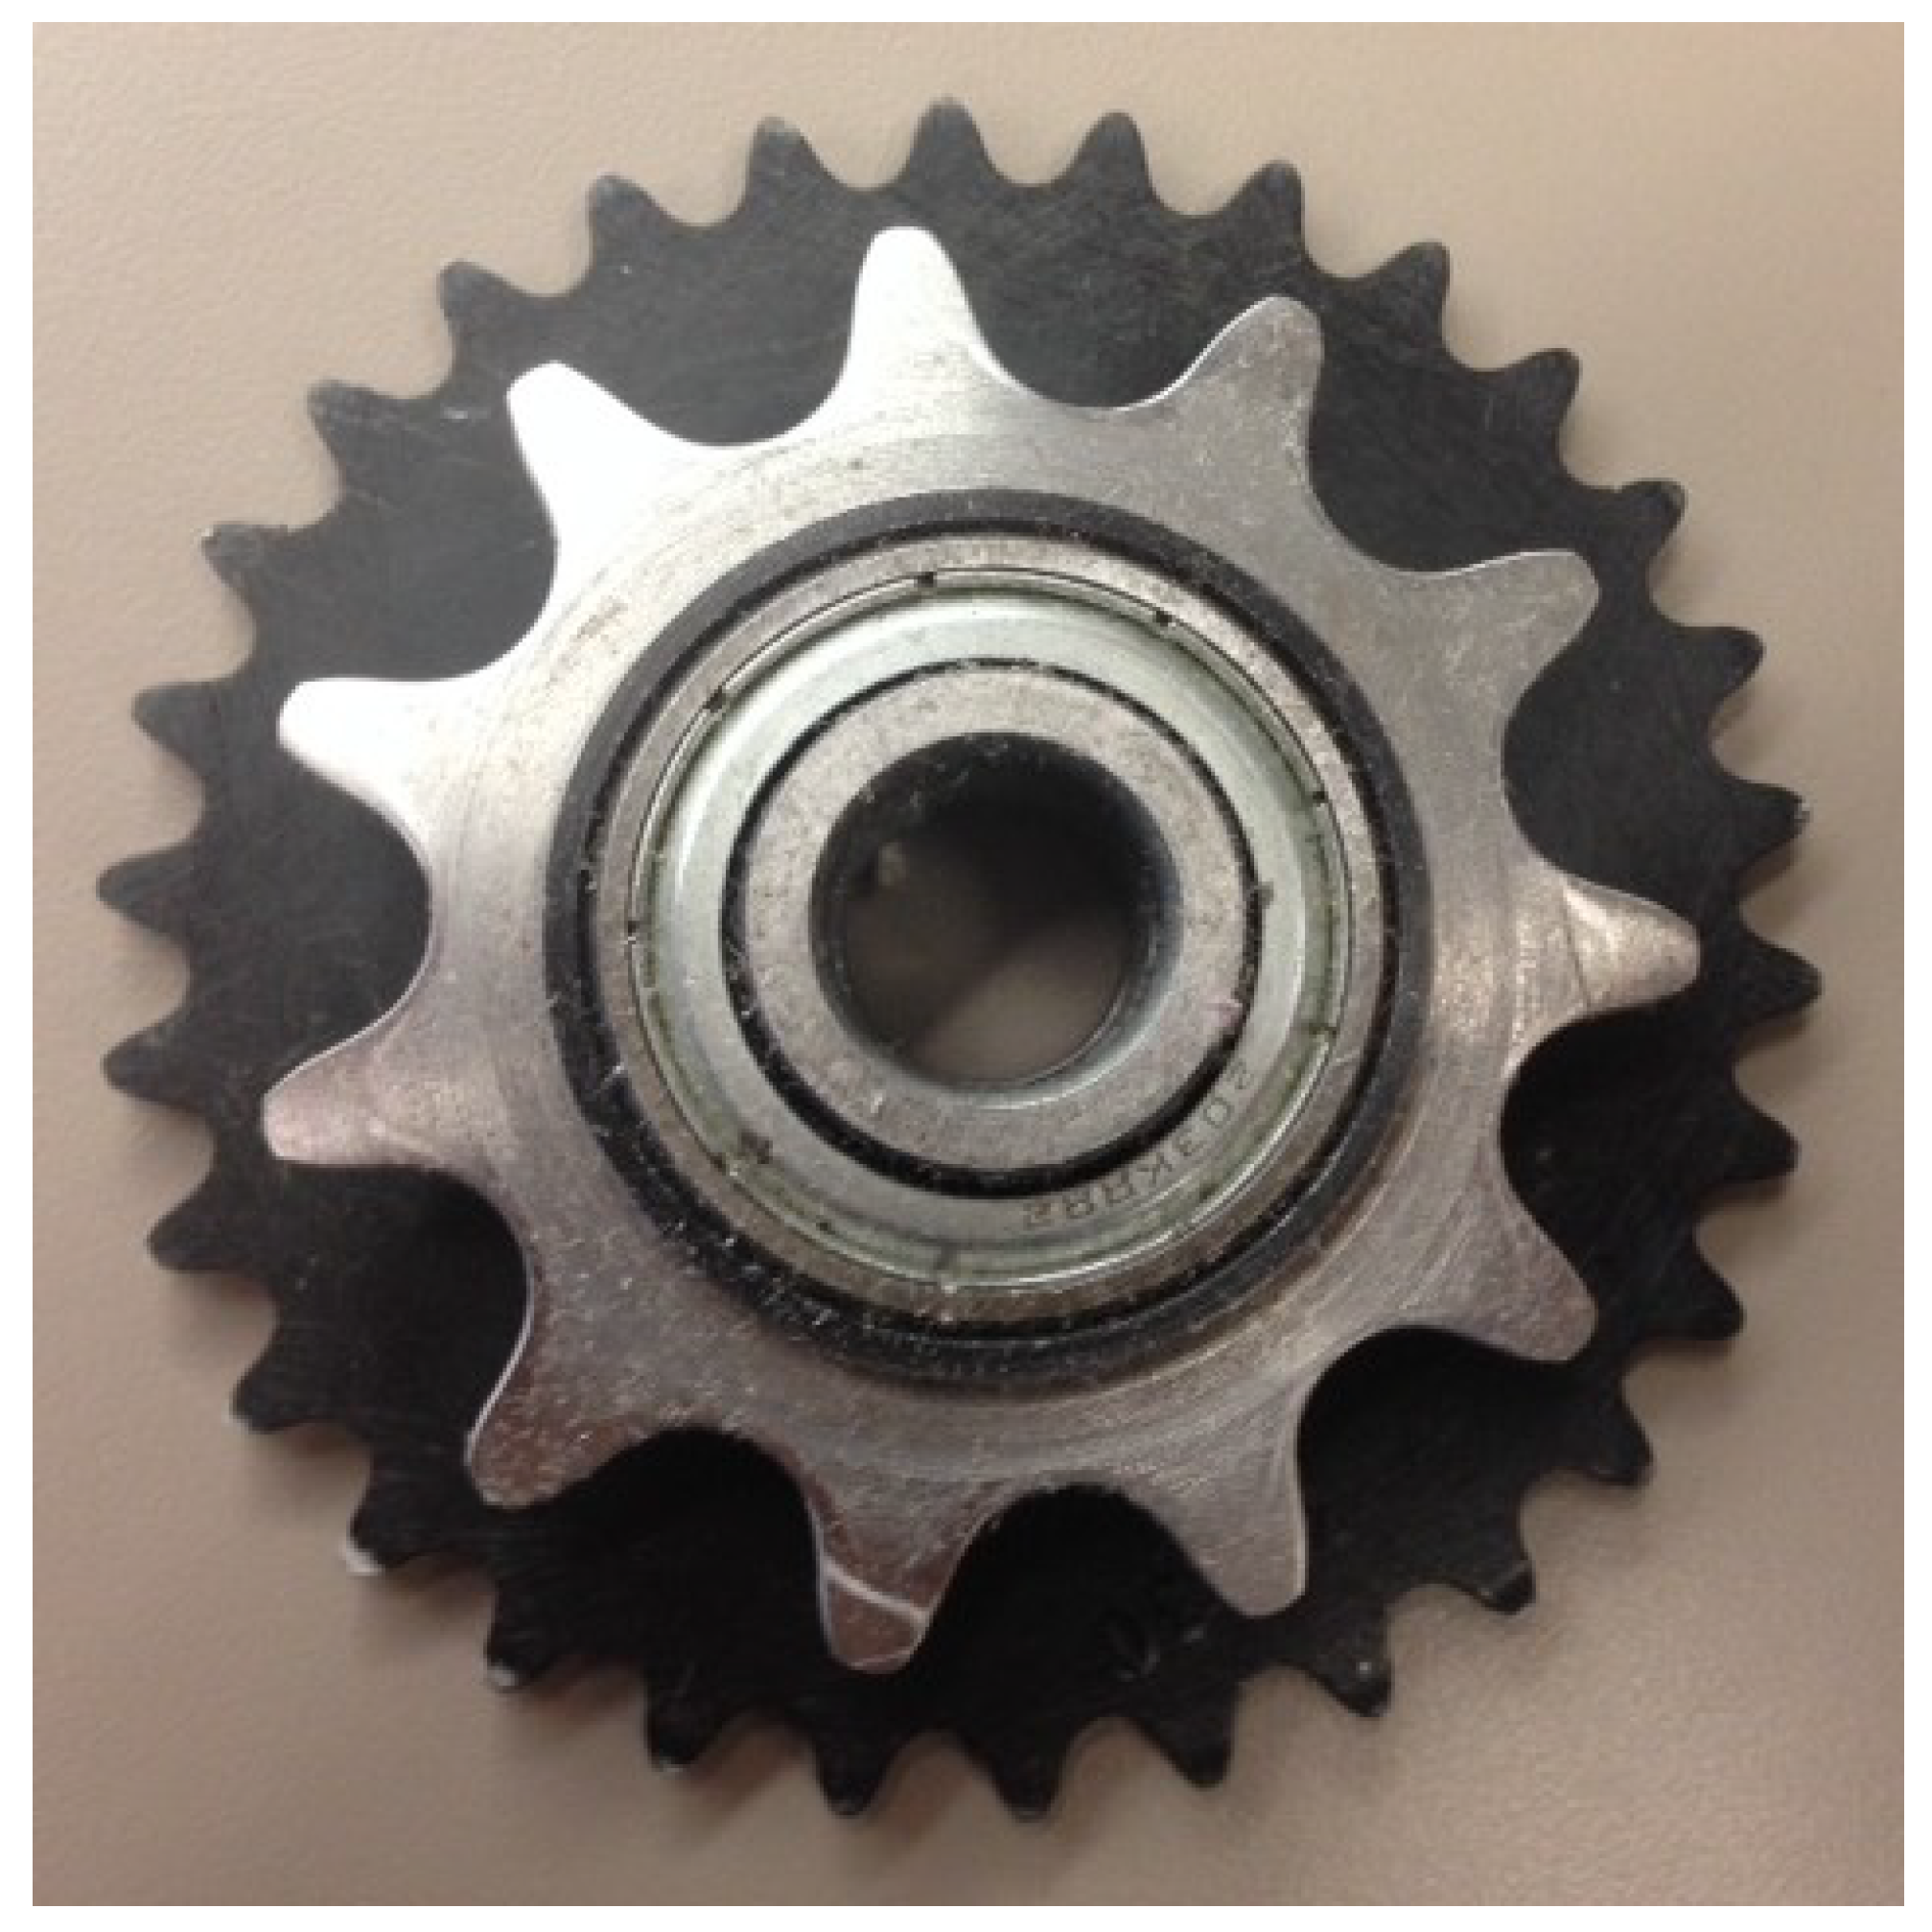
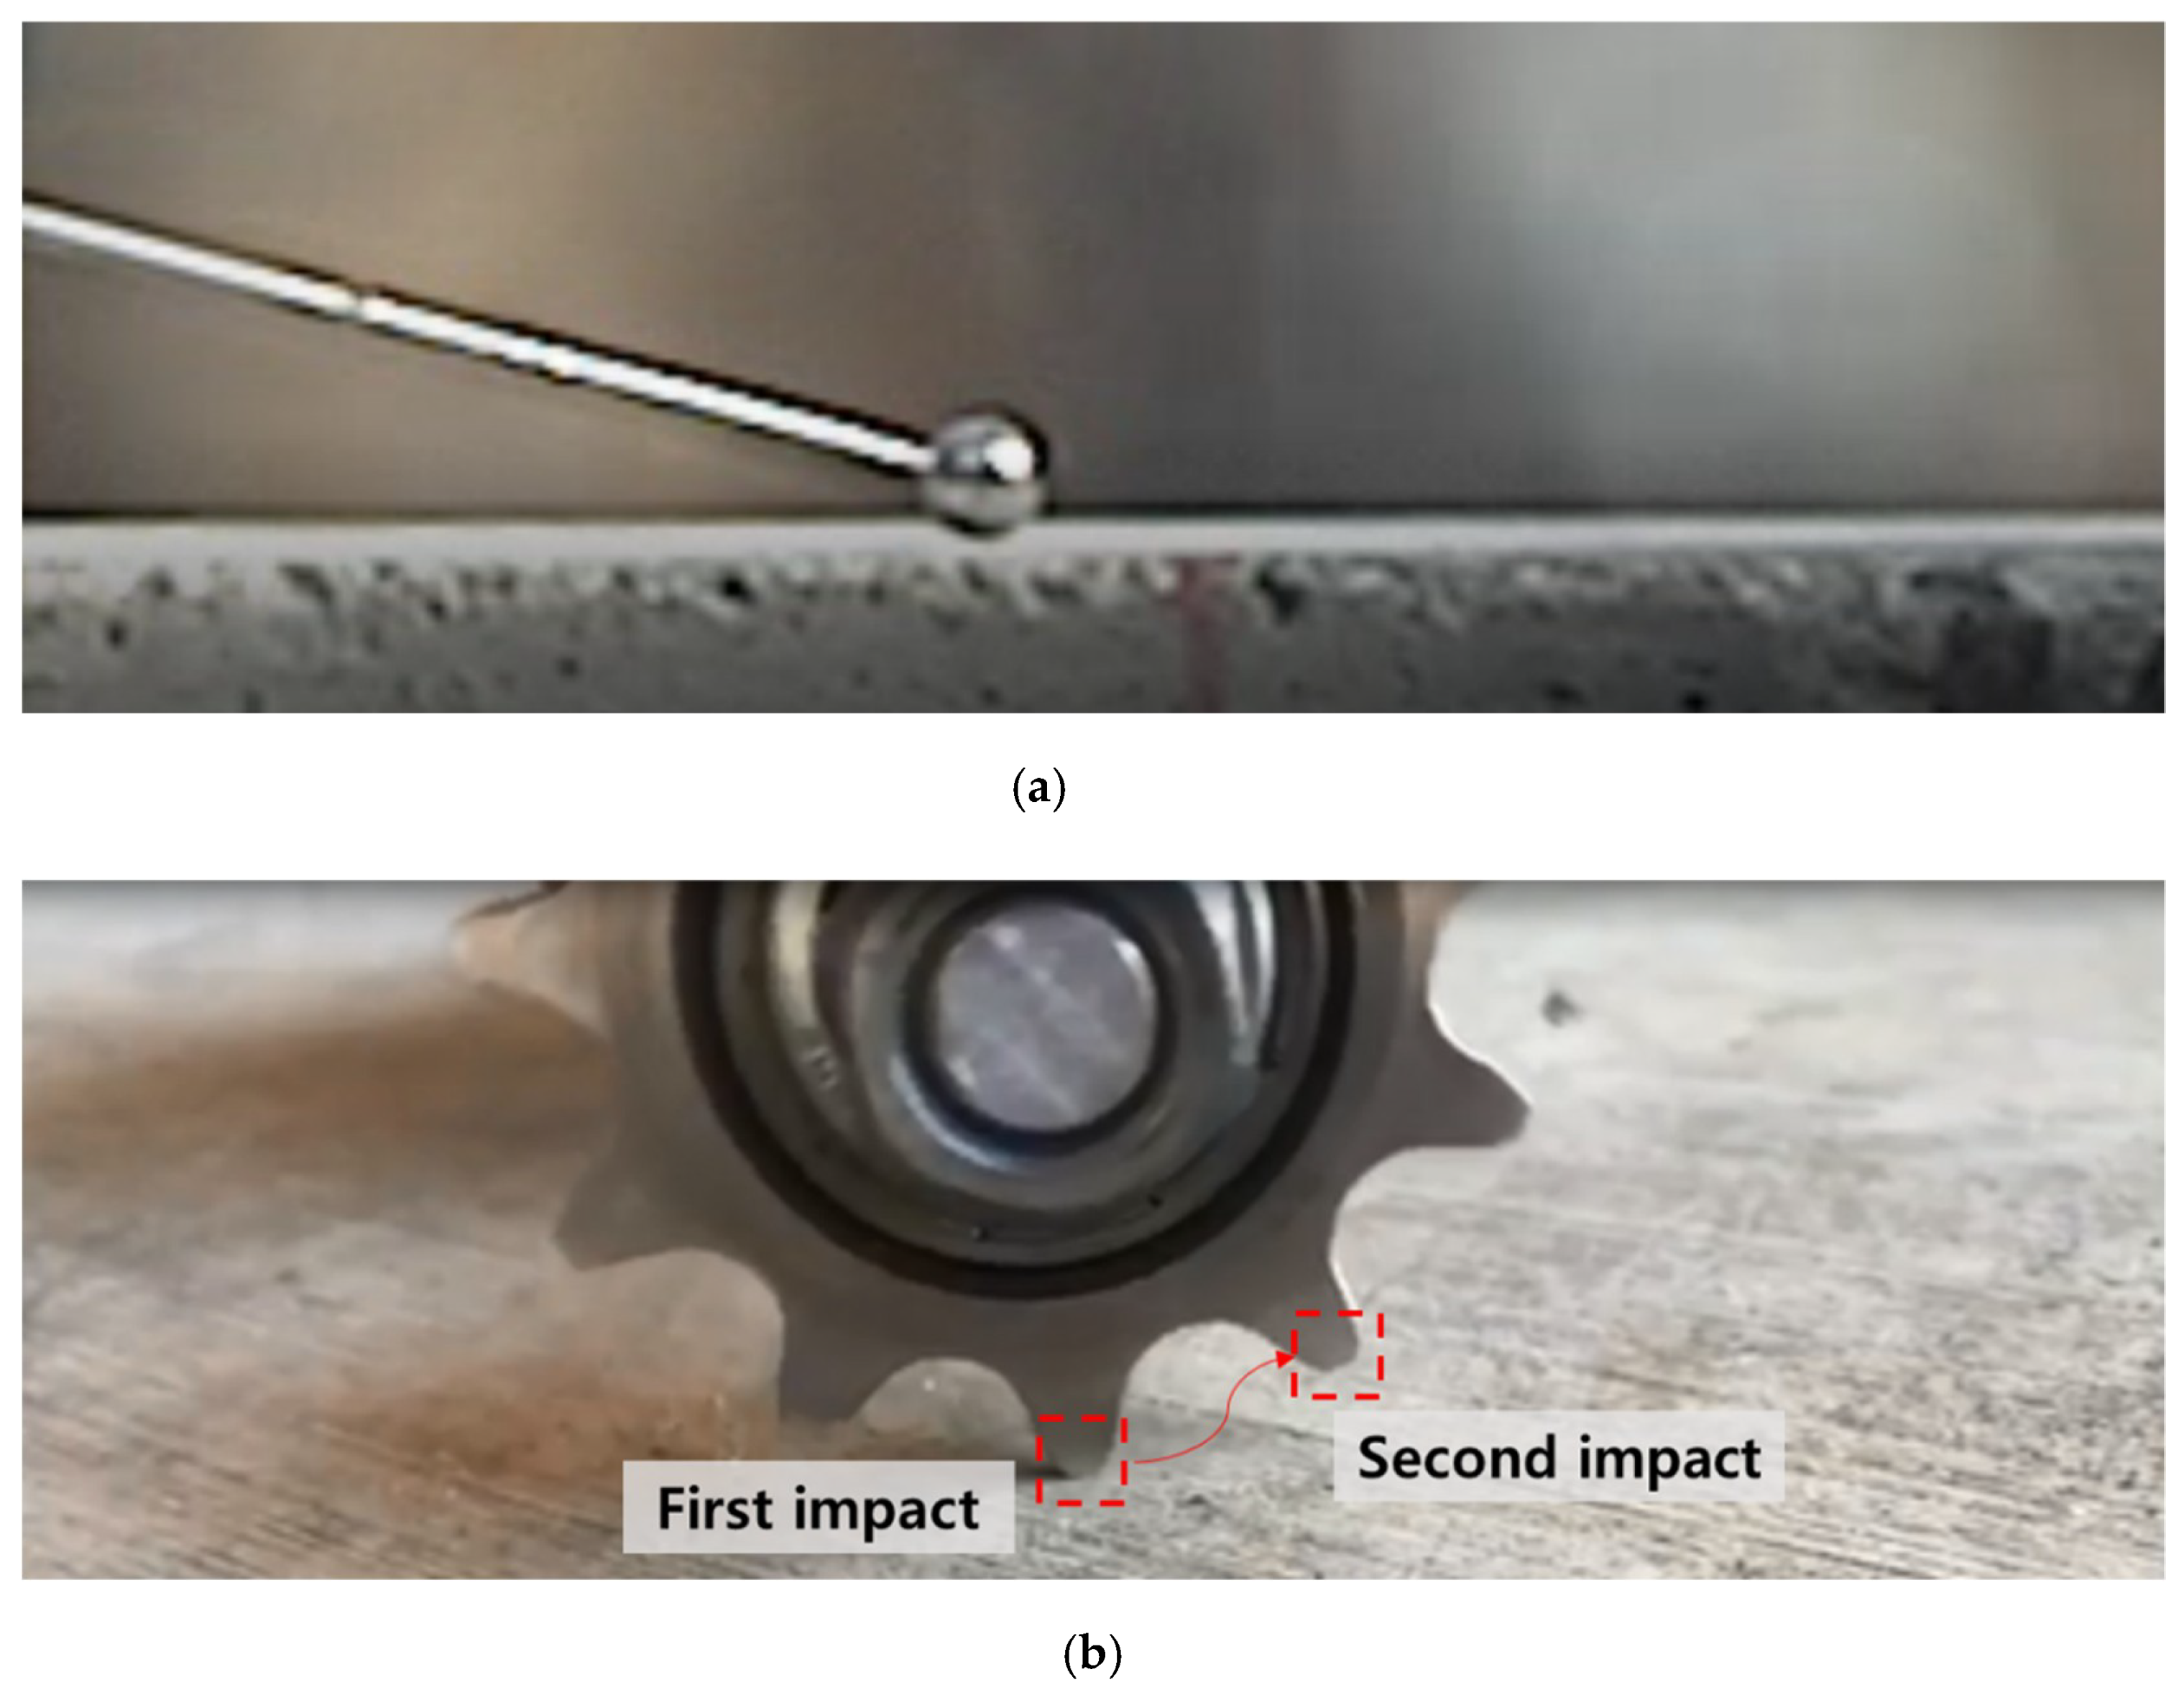
3.1. Impact Source Excitation by Tooth Gear

In this study, tooth gears were used as impactors for the air-coupled IE test. While the gear rolls and moves, continuous contact on the surface of concrete generates an impact source. Therefore, the gear has the advantage of a moving platform where the impactor itself moves and generates sources simultaneously. Moreover, the impact position is regular, based on the pitch of the gear.
Two different tooth gears were used to evaluate the excitability as impactors, including 11 and 30 teeth gears, respectively, as shown in Figure 2. The tooth width and thickness were 5.8 and 2.5 mm for the 11-tooth gear and 4.2 and 1.1 mm for the 30-tooth gear. Therefore, the potential contact area of the gears was 14.5 and 4.6 mm2, respectively. The contact duration of the tooth gears was compared with that of a conventional steel ball impactor. The diameter of the steel ball was 12 mm. The motion of impact onto the surface of a concrete element was recorded using a high-speed camera (MEMRECAM GX-1). The videos were captured at 10,000 fps (320 × 240 resolution). Each frame was analyzed manually, and the contact duration and velocity of each impactor was estimated. The contact durations obtained were 0.1, 32, and 16 ms for the steel ball, the 11-tooth gear, and the 30-tooth gear, respectively. It is noted that the sampling rate was limited to measure the contact duration accurately; however, the different mechanism from the impactors were clearly shown. Using Equation (3), the contact duration of the steel ball was calculated as 0.08 ms (assuming the density of the steel ball to be 7850 kg/m3, and the elastic modulus to be 200 at 30 GPa for steel ball and concrete, respectively).
As shown in Figure 3, the contact mechanism of the tooth gears is somewhat different from a hammer-type impactor. While the tooth gear continuously moves, the contact is sequentially made from one tooth to another. It is noted that the second contact was executed after waiting for the finish of the first contact. Therefore, the contact duration was longer than the contact duration from a conventional hammer-type impactor, implying low frequency excitation. The contact duration of a tooth gear depends on the pitch of the tooth (or the number of teeth) and the moving speed of the gear. The pitch of the gear ( p ) is defined by the radius of the gear ( r ) and the numbers of teeth ( N ), as follows:
p = 2 π r N
Therefore, increasing the number of teeth reduces the pitch and the contact duration. From Equation (4), the pitches of the 11- and 30-tooth gears are 22.9 and 10.1 mm. With the same moving speed, the contact duration of the 30-tooth gear is 2.3 time shorter than that of the 11-tooth gear, implying that much a higher frequency range is excitable using the 30-tooth gear. With practical assumption of rolling speed as 250 m/s, the contact duration of 11- and 30-tooth gears are 0.09 and 0.04 ms, where corresponding excitation frequency ranges are 16.9 and 36.4 kHz.

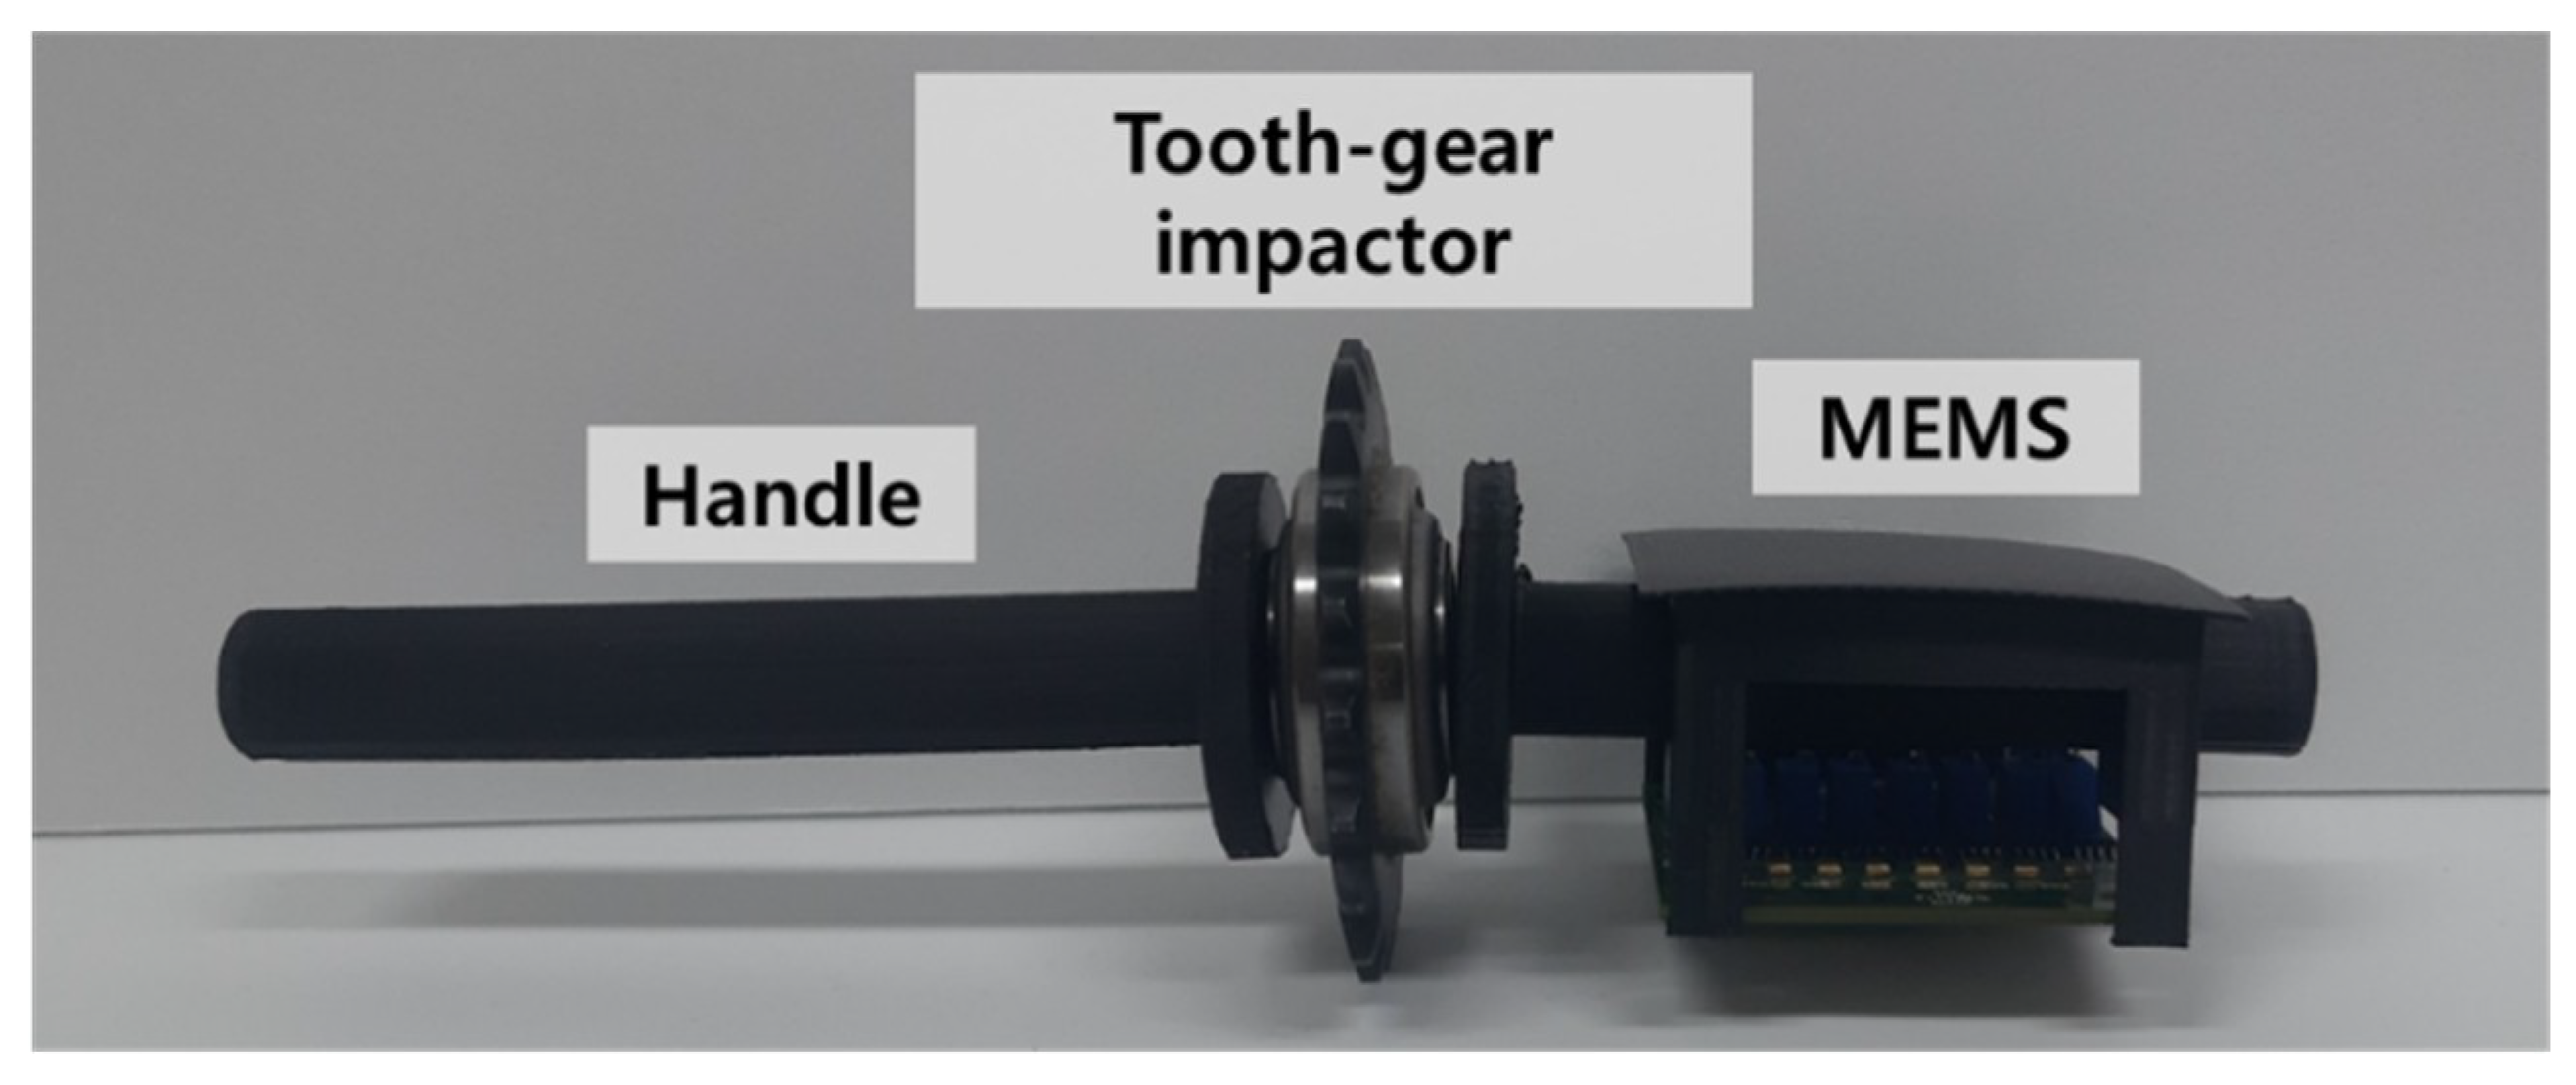
3.2. Tooth Gear IE System Design and Data Acquisition

Based on the background information of the contact mechanism, a tooth gear IE system was designed as shown in Figure 4. For the receiver, a microelectromechanical system (MEMS, SPU0410LR5H-QB, Knowles) was used with a circuit amplified 2000 times, able to measure acoustic pressure with a sensitivity of −38 dBV/Pa. The location of the MEMS was in the same line as the impact source, 65 mm away from the tooth gear. The holder was manufactured using a three-dimensional (3-D) printer, and the system was manually controlled using a handle. The total length of the system was 200 mm so that inspectors could easily use the system in the field. While the system moves backwards and forwards, numerous signal data were measured. For data acquisition, the signals were digitized using the NI 6366, at a sampling rate of 200 kHz, and 2000 samples were collected. The total length of a signal was 10 ms. As shown in Figure 5, the testing equipment (including the laptop, data acquisition, and IE system) was placed on the concrete slab. Based on the test results, more than 100 data signals were recorded within one minute, while the system was moving.

4. Experiment and Results

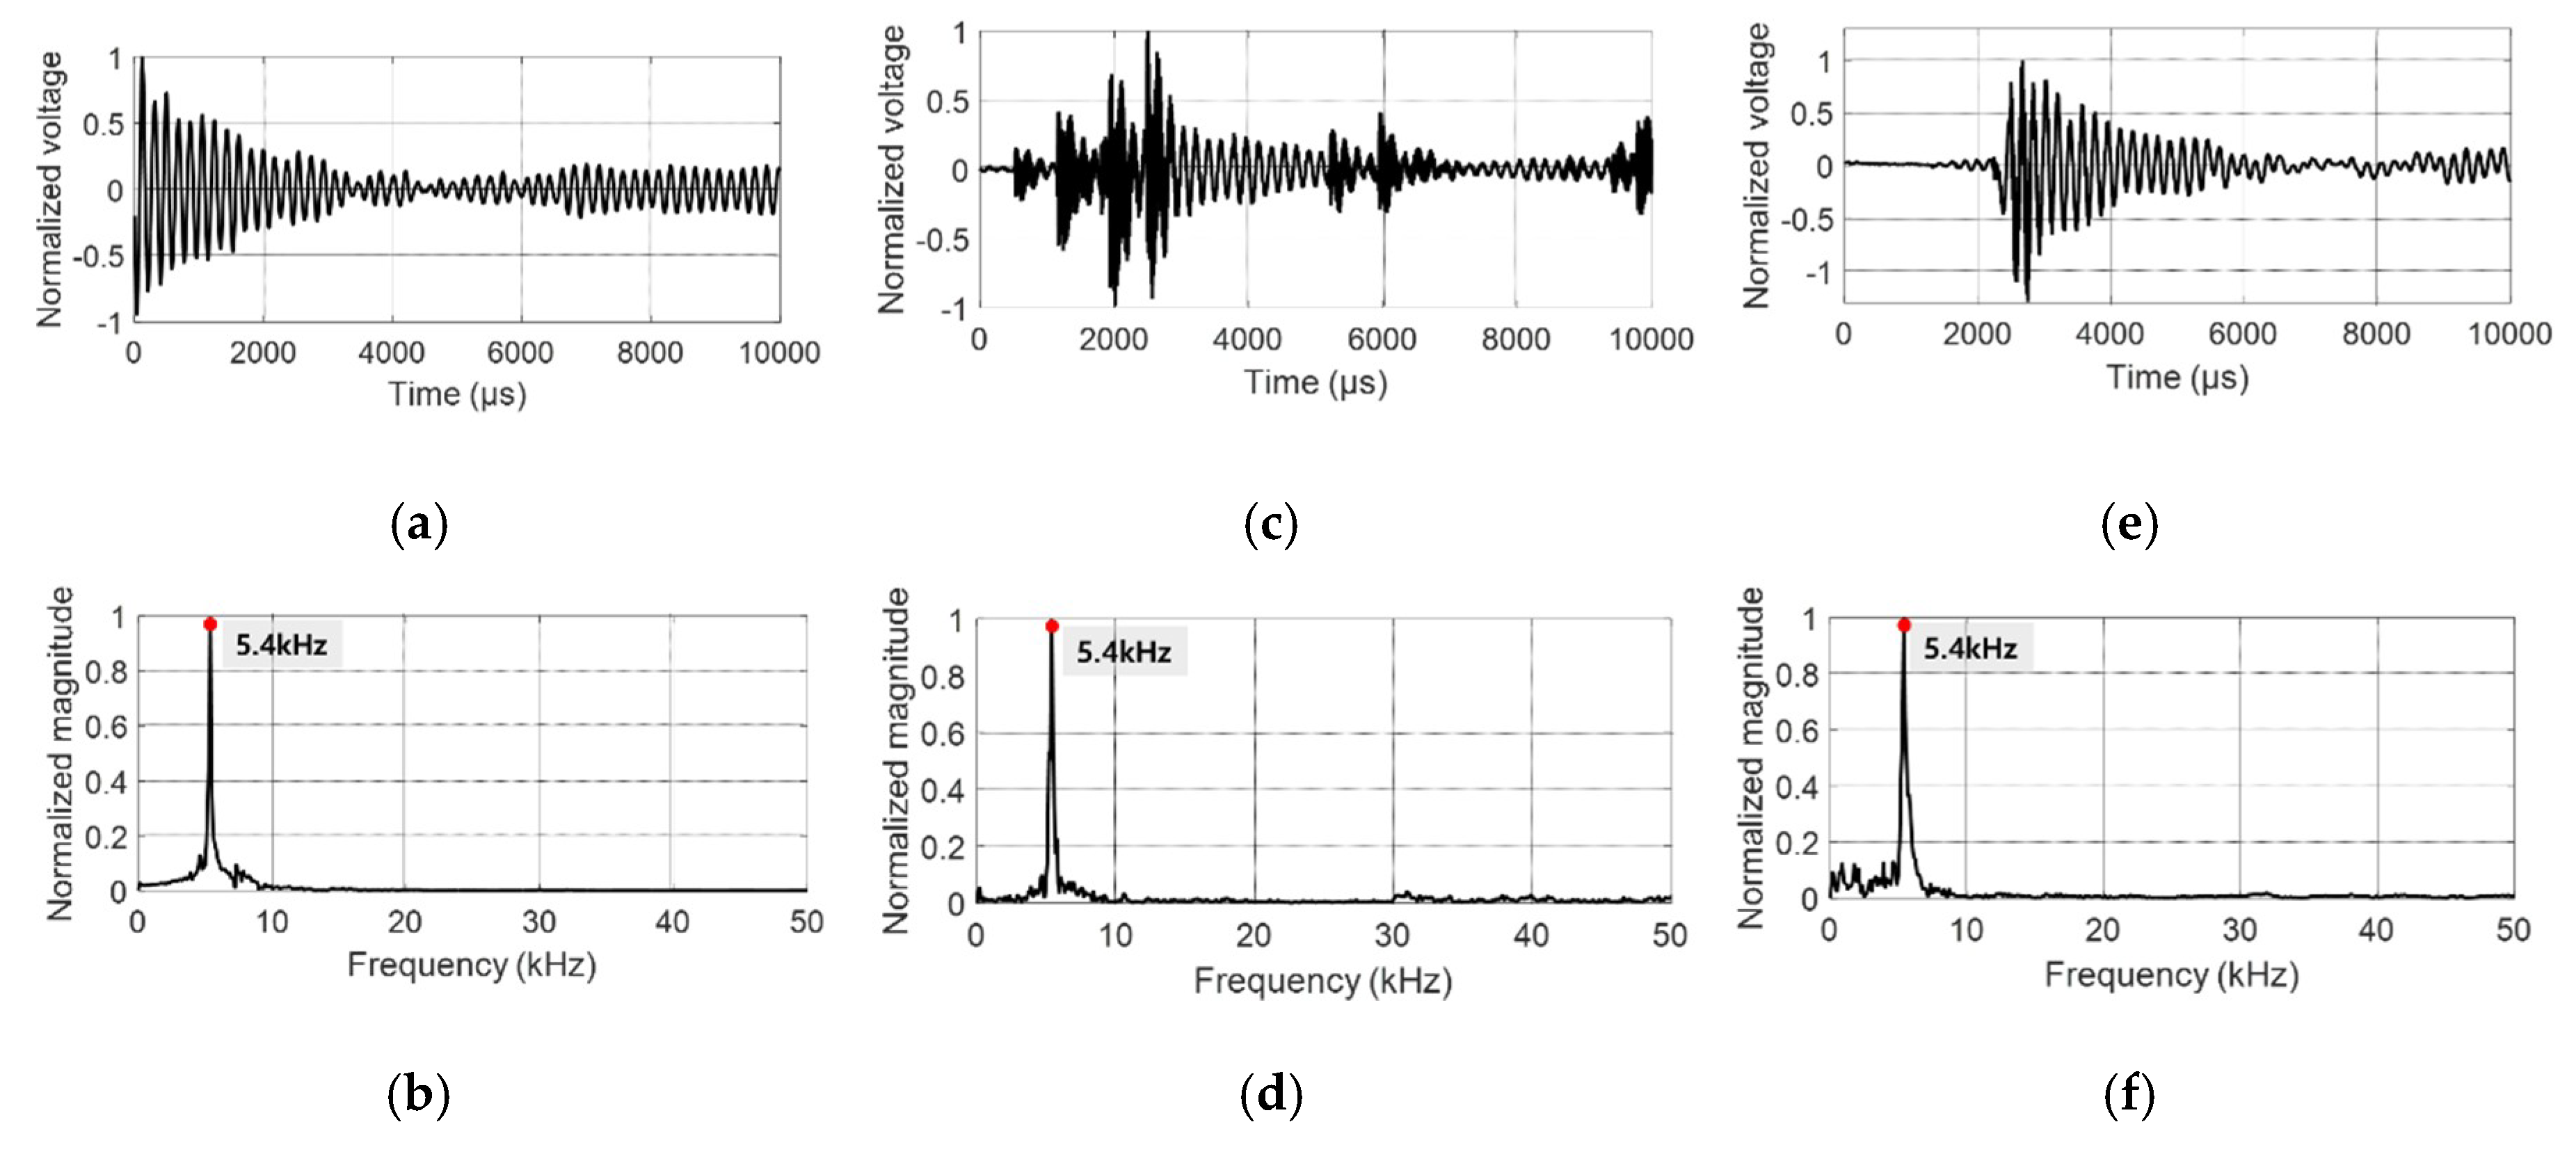
4.1. Testing Slab and the IE Results

The developed tooth gear IE system was evaluated using a reinforced concrete slab, where artificial delamination-like defects were embedded. As shown in Figure 6, the testing slab had a depth of 250 mm and the depth of the artificial delaminations were 60 (shallow) and 200 mm (deep), respectively. The artificial delamination was made from acrylic sheet (2 mm thickness), which was embedded before casting the concrete. The IE testing was performed on the testing slab using the 11 and 30-tooth gears. A 12 mm steel ball impactor was also used to perform conventional IE testing as a reference. Two locations, including the deep and shallow delaminations, were tested, where the thickness mode and the flexural mode, respectively, were obtained. Based on the Equations (1) and (2), thickness mode frequency is about 10 kHz with conventional longitudinal wave velocity of concrete ( V L ) as 4250 m/s while flexural mode frequency is about 5.5 kHz with the dimensionless frequency ( k D L 2 ) as 0.2. It is noted that the width (300 mm) to depth (60 mm) ratio of shallow delamination is 0.5. In the case of the steel ball impactor, repeated impact sources were generated at the same position while the vibration was measured using an accelerometer (PCB, 352C15). Using the tooth gear IE system, a rapid scanning test was performed while the system simply moved backwards and forwards.
The results of the frequencies obtained are summarized in Table 2, and examples of the signals obtained from the shallow and deep delaminations are shown in Figure 7 and Figure 8, respectively. In the case of the shallow delamination, the measured frequency from the impactors was identified as 5.4 kHz (Figure 7). Although the waveforms from the tooth gears were noisy, the dominant frequency was clearly shown. This is because the excited frequency range of the impactors covers the low frequency range from the flexural vibration of plate, and the flexural mode is loud enough to be measured as the dominant frequency among the impactors. Based on the results from the steel ball impactor (Figure 8), the thickness mode frequency was detected as 10.2 kHz, which corresponded well with the depth of the deep delamination with an apparent velocity of 4080 m/s. In the case of the 11-tooth gear, low frequency noise was dominant. As expected from the long contact duration, the excited frequency range was clearly limited to the generation of the thickness mode. The results from the 30-tooth gear showed that reducing the pitch creates a shorter contact duration and the thickness mode becomes dominant.

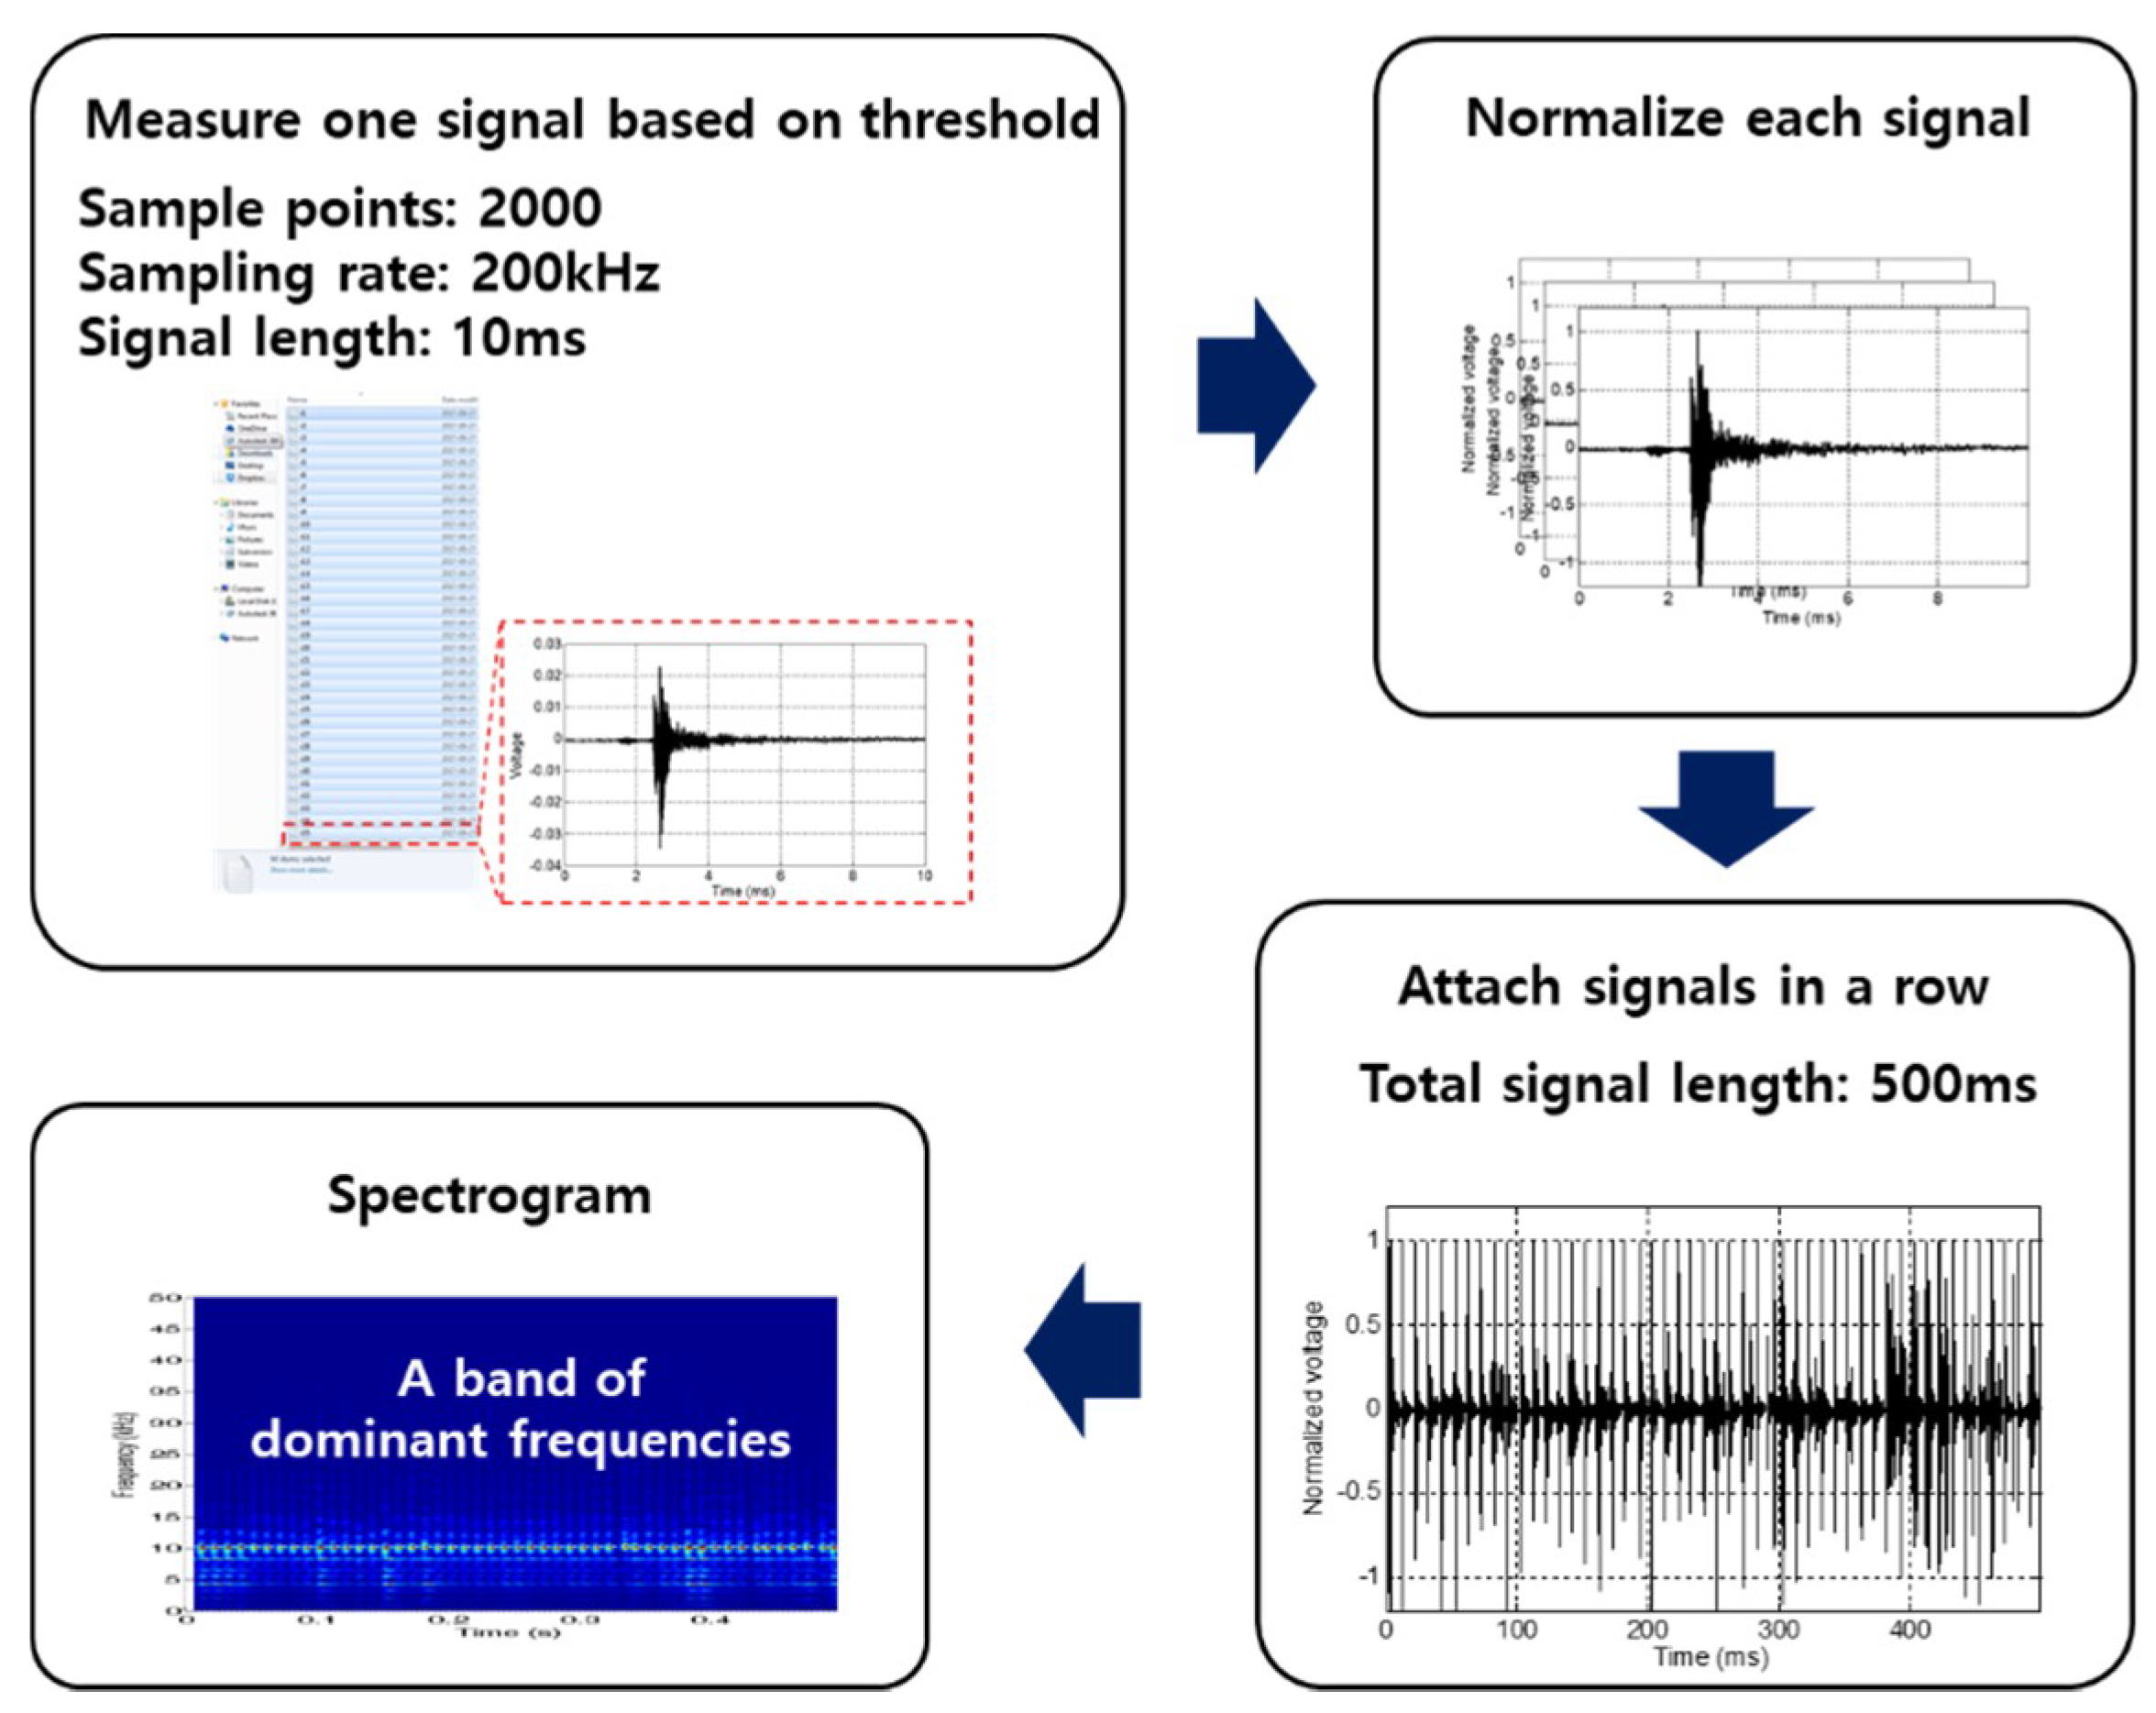
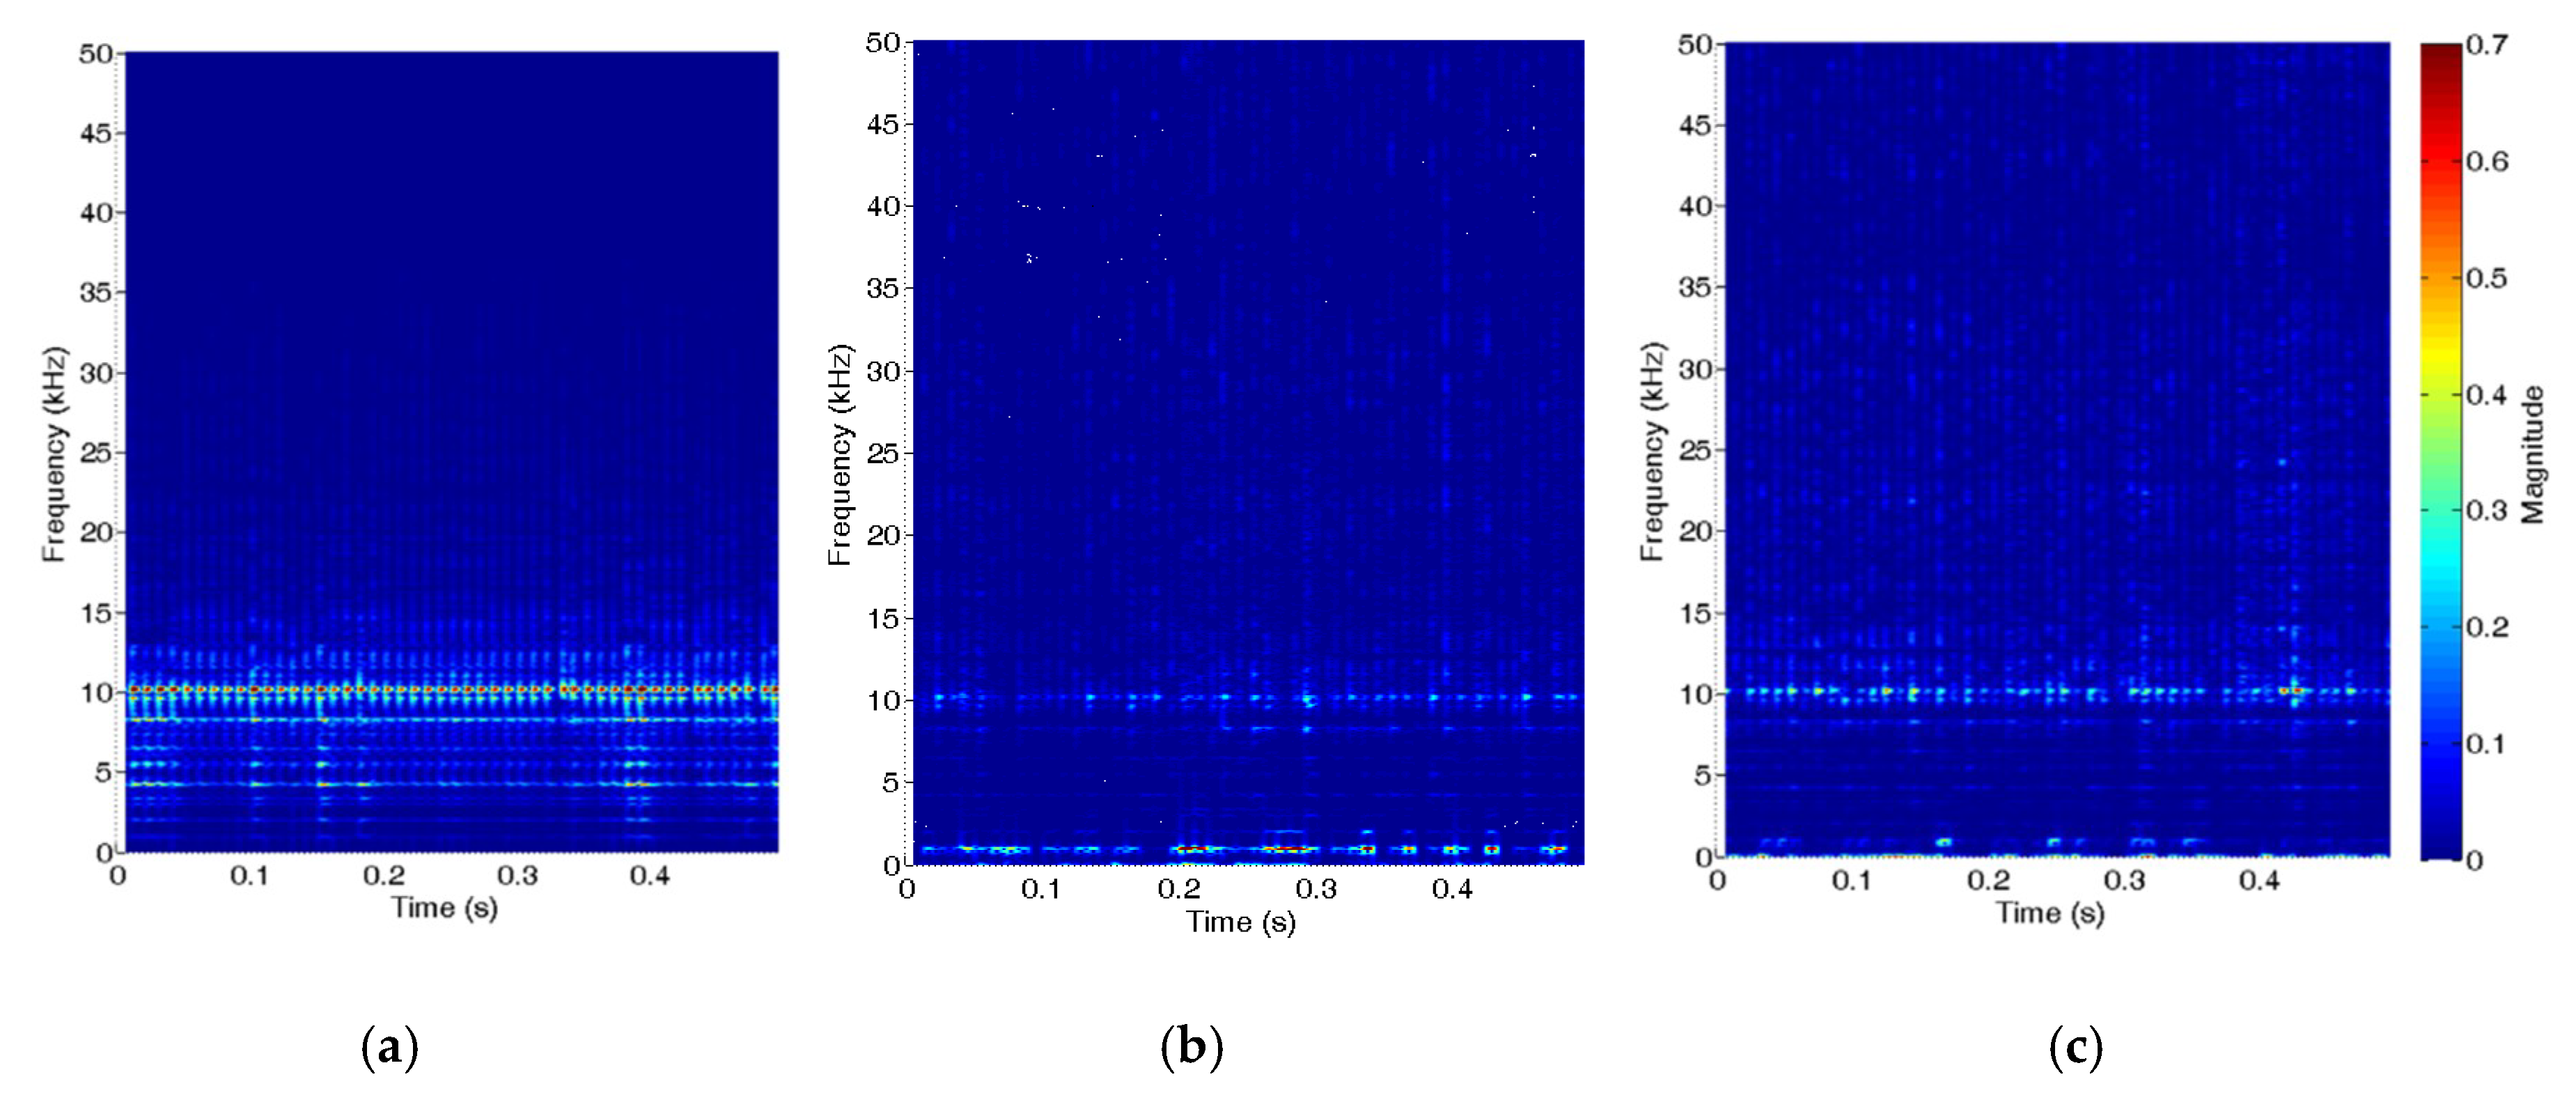
4.2. Data Visualization

The speed of data acquisition by the tooth gear IE system was much faster than the conventional IE test. Based on numerous data, the visualized images help the operator make decisions [22,23]. The signal-processing scheme using a spectrogram was applied to visualize the obtained data from the tooth gear IE system as shown in Figure 9. After each 10 ms long signal was obtained from the tooth gear IE system, the amplitude of the signal was normalized. Next, the signals were added in the time domain—50 signals were used in this study. Spectrogram analysis was performed on the total signal set, based on a short-time Fourier transform, representing the time-frequency information with a color scheme. The dominant frequencies from the total signal set are clearly shown as a band. In addition to the data visualization, the analysis of the total signal set demonstrated the repeatability of the vibration modes during the IE testing. For a signal set of 500 ms length, the windowing samples and numbers of overlap were set to 2048 and 1900 respectively.
Figure 10 and Figure 11 show the spectrograms from the shallow and deep delaminations between the impactors. From the shallow delamination, a band of 5.4 kHz is clearly shown from all impactors. In the case of the 11-tooth gear, a little noise content was found from the signal set. However, the band of flexural mode frequencies were clearly shown. The thickness mode frequencies from the steel ball were clearly shown in the spectrogram. In the case of the 30-tooth gear, the frequency band was detected while a portion of noise content was also captured. However, the 11-tooth gear exhibited limited results of thickness mode detection due to its long contact duration.
In terms of repeatability, the tooth gear showed great potential for the air-coupled IE test. Air-coupled sensing technology inherently contains noise contents from the field (traffic noise). The impacts of tooth gears are easily repeatable while the system moves and generates the source simultaneously. The large quantity of data obtained improves the decision-making process in the field. In fact, delamination in the field has arbitrary boundary conditions so that the vibration modes and frequency components can be many. Under those conditions, repeatable data with rapid data acquisition helps the analysis of the IE test.

5. Conclusions

This study demonstrated that tooth gears have great potential to produce impact sources of IE testing and generate IE vibration modes including thickness and flexural modes where the results are comparable with conventional steel ball impactors. To perform a rapid scanning test, tooth gears were used as impactors and their performance was evaluated. The contact duration of each impactor was theoretically and experimentally analyzed and a tooth gear IE system was developed. The developed system was evaluated using a testing slab, which included both shallow and deep delaminations. A further signal-processing scheme was used to visualize the signal set obtained by the rapid scanning test. The findings and conclusions of the research are summarized as follows:
  • the developed tooth gear IE system is possible to apply to an impact-echo test with low acoustic noise and provides fast data collection with continuous matter. A signal set of 100 data points was measurable within one min. Using the system, the thickness mode frequencies are measurable beyond flexural mode frequencies, and measured thickness mode frequencies corresponded well with the depth of the deep delamination;
  • by analyzing different contact mechanism from conventional hammer-type impact, reducing the pitch or increasing the number of teeth decreased the contact duration and provided higher frequency excitation. Based on our experimental results, the 11-tooth gear was limited at generating the thickness mode from the 200 mm depth delamination, while the 30-tooth gear was successful;
  • based on the contact mechanism, the contact duration of a conventional steel ball and two tooth gears was analyzed. The theoretical contact duration corresponded well with the actual contact duration measured using a high-speed camera, implying an excited frequency range;
  • data visualization using spectrogram showed a band of dominant frequencies (repeated frequency modes) from the signal set, which helps operators to make decisions based on repeatable vibration modes.

Author Contributions

H.C. conceived and designed the experiments; J.H. and H.C. performed the experiments and analyzed the data; J.H., H.C., and T.K.O. contributed device/analysis tools; J.H., H.C., and T.K.O. wrote the paper. All authors have read and agreed to the published version of the manuscript.

Funding

This research was supported by the Incheon National University Research Grant in 2018.

Acknowledgments

Authors thank Popovics for valuable discussion of the tooth-gear application on the air-coupled impact-echo.

Conflicts of Interest

The authors declare no conflict of interest.

References

  1. Carino, N.J.; Sansalone, M.; Hsu, N.N. A point source-point receiver, pulse-wcho technique for flaw detection in concrete. ACI J. 1986, 83, 199–208. [Google Scholar]
  2. Cheng, C.; Sansalone, M. The impact-echo response of concrete plates containing delaminations: Numerical, experimental and field studies. Mater. Struct. 1993, 26, 274–285. [Google Scholar] [CrossRef]
  3. Sansalone, M.J.; Streett, W.B. Impact-Echo: Nondestructive Evaluation of Concrete and Masonry; Bullbrier Press: Ithica, NY, USA, 1997. [Google Scholar]
  4. Gibson, A.; Popovics, J.S. Lamb wave basis for impact-echo method analysis. J. Eng. Mech. 2015, 131, 438–443. [Google Scholar] [CrossRef]
  5. Zhu, J.; Popovics, J.S. Imaging concrete structures using air-coupled impact-echo. J. Eng. Mech. 2007, 133, 628–640. [Google Scholar] [CrossRef]
  6. Oh, T.; Popovics, J.S.; Sim, S.-H. Analysis of vibration for regions above rectangular delamination defects in solids. J. Sound Vib. 2013, 332, 1766–1776. [Google Scholar] [CrossRef]
  7. Kee, S.-H.; Gucunski, N. Interpretation of flexural vibration modes from impact-echo testing. J. Infrastruct. Syst. 2016, 22, 04160009. [Google Scholar] [CrossRef]
  8. Gucunski, N.; Yan, M.; Wang, Z.; Fang, T.; Maher, A. Rapid bridge deck condition assessment using three-dimensional visualization of impact echo data. J. Infrastruct. Syst. 2011, 18, 12–24. [Google Scholar] [CrossRef] [Green Version]
  9. Zhang, G.; Harichandran, R.S.; Ramuhalli, P. An automatic impact-based delamination detection system for concrete bridge decks. NDT E Int. 2012, 45, 120–127. [Google Scholar] [CrossRef]
  10. Mazzeo, B.A.; Patil, A.N.; Hurd, R.C.; Klis, J.M.; Truscott, T.T.; Guthrie, W.S. Air-coupled impact-echo delamination detection in concrete using spheres of ice for excitation. J. Nondestruct. Eval. 2014, 33, 317–326. [Google Scholar] [CrossRef]
  11. Sun, H.; Zhu, J.; Ham, S. Automated Acoustic Scanning System for Delamination Detection in Concrete Bridge Decks. J. Bridge Eng. 2018, 23, 04018027. [Google Scholar] [CrossRef]
  12. Evani, S.H.; Popovics, J.S. Utility of Rolling Impactor as a Source of Excitation for Impact-Echo Tests. SMT 2016, American Society for Nondestructive Testing. August 2016. Available online: https://publish.illinois.edu/saikalyanevani/previous-projects/07112020 (accessed on 11 July 2020).
  13. Clorennec, D.; Prada, C.; Royer, D. Local and noncontact measurements of bulk acoustic wave velocities in thin isotropic plates and shells using zero group velocity Lamb modes. J. Appl. Phys. 2007, 101, 034908. [Google Scholar] [CrossRef]
  14. Prada, C.; Clorennec, D. Influence of the anisotropy on zero-group velocity lamb modes. J. Acoust. Soc. Am. 2009, 126, 620–625. [Google Scholar] [CrossRef] [PubMed] [Green Version]
  15. Gomez, P.; Fernandez-Alvarez, J.P.; Ares, A.; Fernandez, E. Guided-wave approach for Spectral peaks characterization of impact-echo tests in layered systems. J. Infrastruct. Syst. 2017, 1, 0417009. [Google Scholar] [CrossRef]
  16. Choi, H.; Azari, H. Guided wave analysis of air-coupled impact-echo in concrete slab. Comput. Concr. 2017, 20, 257–262. [Google Scholar]
  17. Oh, T. Defect Characterization in Concrete Elements Using Vibration Analysis and Imaging. Ph.D. Dissertation, University of Illinois at Urbana-Champaign, Champaign, IL, USA, 2012. [Google Scholar]
  18. Leissa, A.W. The free vibration of rectangular plates. J. Sound Vib. 1973, 31, 257–293. [Google Scholar] [CrossRef]
  19. Stronge, W.J. Impact Mechanics; Cambridge University Press: Cambridge, UK; New York, NY, USA, 2000. [Google Scholar]
  20. Firouzi, K.; Cox, B.T.; Treeby, B.E.; Saffari, N. A first-order k-space model for elastic wave propagation in heterogeneous media. J. Acoust. Soc. Am. 2012, 132, 1271–1283. [Google Scholar] [CrossRef] [PubMed] [Green Version]
  21. Treeby, B.E.; Jaros, J.; Rohrbach, D.; Cox, B.T. Modelling Elastic Wave Propagation Using the k-Wave MATLAB Toolbox. In Proceedings of the 2014 IEEE International Ultrasonics Symposium, Chicago, IL, USA, 3–6 September 2014; pp. 146–149. [Google Scholar]
  22. Matsuyama, K.; Yamada, M.; Ohtsu, M. On-site measurement of delamination and surface crack in concrete structure by visualized NDT. Constr. Build. Mater. 2010, 24, 2381–2387. [Google Scholar] [CrossRef]
  23. Ohtsu, M.; Watanabe, T. Stack imaging of spectral amplitudes based on impact-echo for flaw detection. NDT E Int. 2002, 35, 189–196. [Google Scholar] [CrossRef]
Figure 1. Illustration of air-coupled impact-echo (IE) test; (a) Field image of simulation, (b) synthetic signal data of simulation.
Applsci 10 04784 g001
Figure 2. Tooth gears used as impactors including the 11-tooth (silver) and 30-tooth (black) gears.
Applsci 10 04784 g002
Figure 3. Photo of the contact mechanism: (a) 12 mm ball hammer, (b) 11-tooth gear.
Applsci 10 04784 g003
Figure 4. Designed IE system including tooth gear and microelectromechanical systems (MEMS).
Applsci 10 04784 g004
Figure 5. Data acquisition and experimental set-up for the IE system.
Applsci 10 04784 g005
Figure 6. The details of the testing slab; (a) plan view (b) sectional view (the unit as mm).
Applsci 10 04784 g006
Figure 7. Obtained signals from the shallow delamination. Steel ball impactor (a) time signal and (b) frequency spectrum. 11-tooth gear (c) time signal and (d) frequency spectrum. 30-tooth gear (e) time signal and (f) frequency spectrum.
Applsci 10 04784 g007
Figure 8. Obtained signals from the deep delamination. Steel ball impactor (a) time signal and (b) frequency spectrum. 11-tooth gear (c) time signal and (d) frequency spectrum. 30-tooth gear (e) time signal and (f) frequency spectrum.
Applsci 10 04784 g008
Figure 9. Applied signal processing scheme to visualize frequency information.
Applsci 10 04784 g009
Figure 10. Results of spectrogram from the shallow delamination; (a) steel ball hammer, (b) 11-tooth gear, (c) 30-tooth gear.
Applsci 10 04784 g010
Figure 11. Results of spectrogram from the deep delamination; (a) steel ball hammer, (b) 11-tooth gear, (c) 30-tooth gear.
Applsci 10 04784 g011
Table 1. Numerical simulation details.
Simulation ParametersValueSimulation ParametersValue
CFL0.1Input sourceTypeHalf sine wave
Number of grids (Nx)500Range of frequency30 kHz
Number of grids (Ny)1000Location(290, 500)
Mesh size (dx)1 mmSensorNumber of sensors40
Mesh size (dy)1 mmSpacing5 mm
Length of gridConcrete190 × 1000 mmConcreteElastic modulus30 GPa
Air310 × 1000 mm
Operation time1.5 msDensity2400 kg/m3
dt5 0 nsAirDensity240 kg/m3
Table 2. Results of obtained frequency.
Testing LocationsDepth (mm)Measured Frequency (kHz)
12 mm Ball Hammer11-Tooth Gear30-Tooth Gear
Shallow delamination605.4
Deep delamination20010.21.510.2

