Atlas of Defects within a Global Building Inspection System


Abstract
1. Introduction
1.1. Background, Problem and Purpose
1.2. Expeditious Tools to Assess Building Pathology
2. Materials and Methods
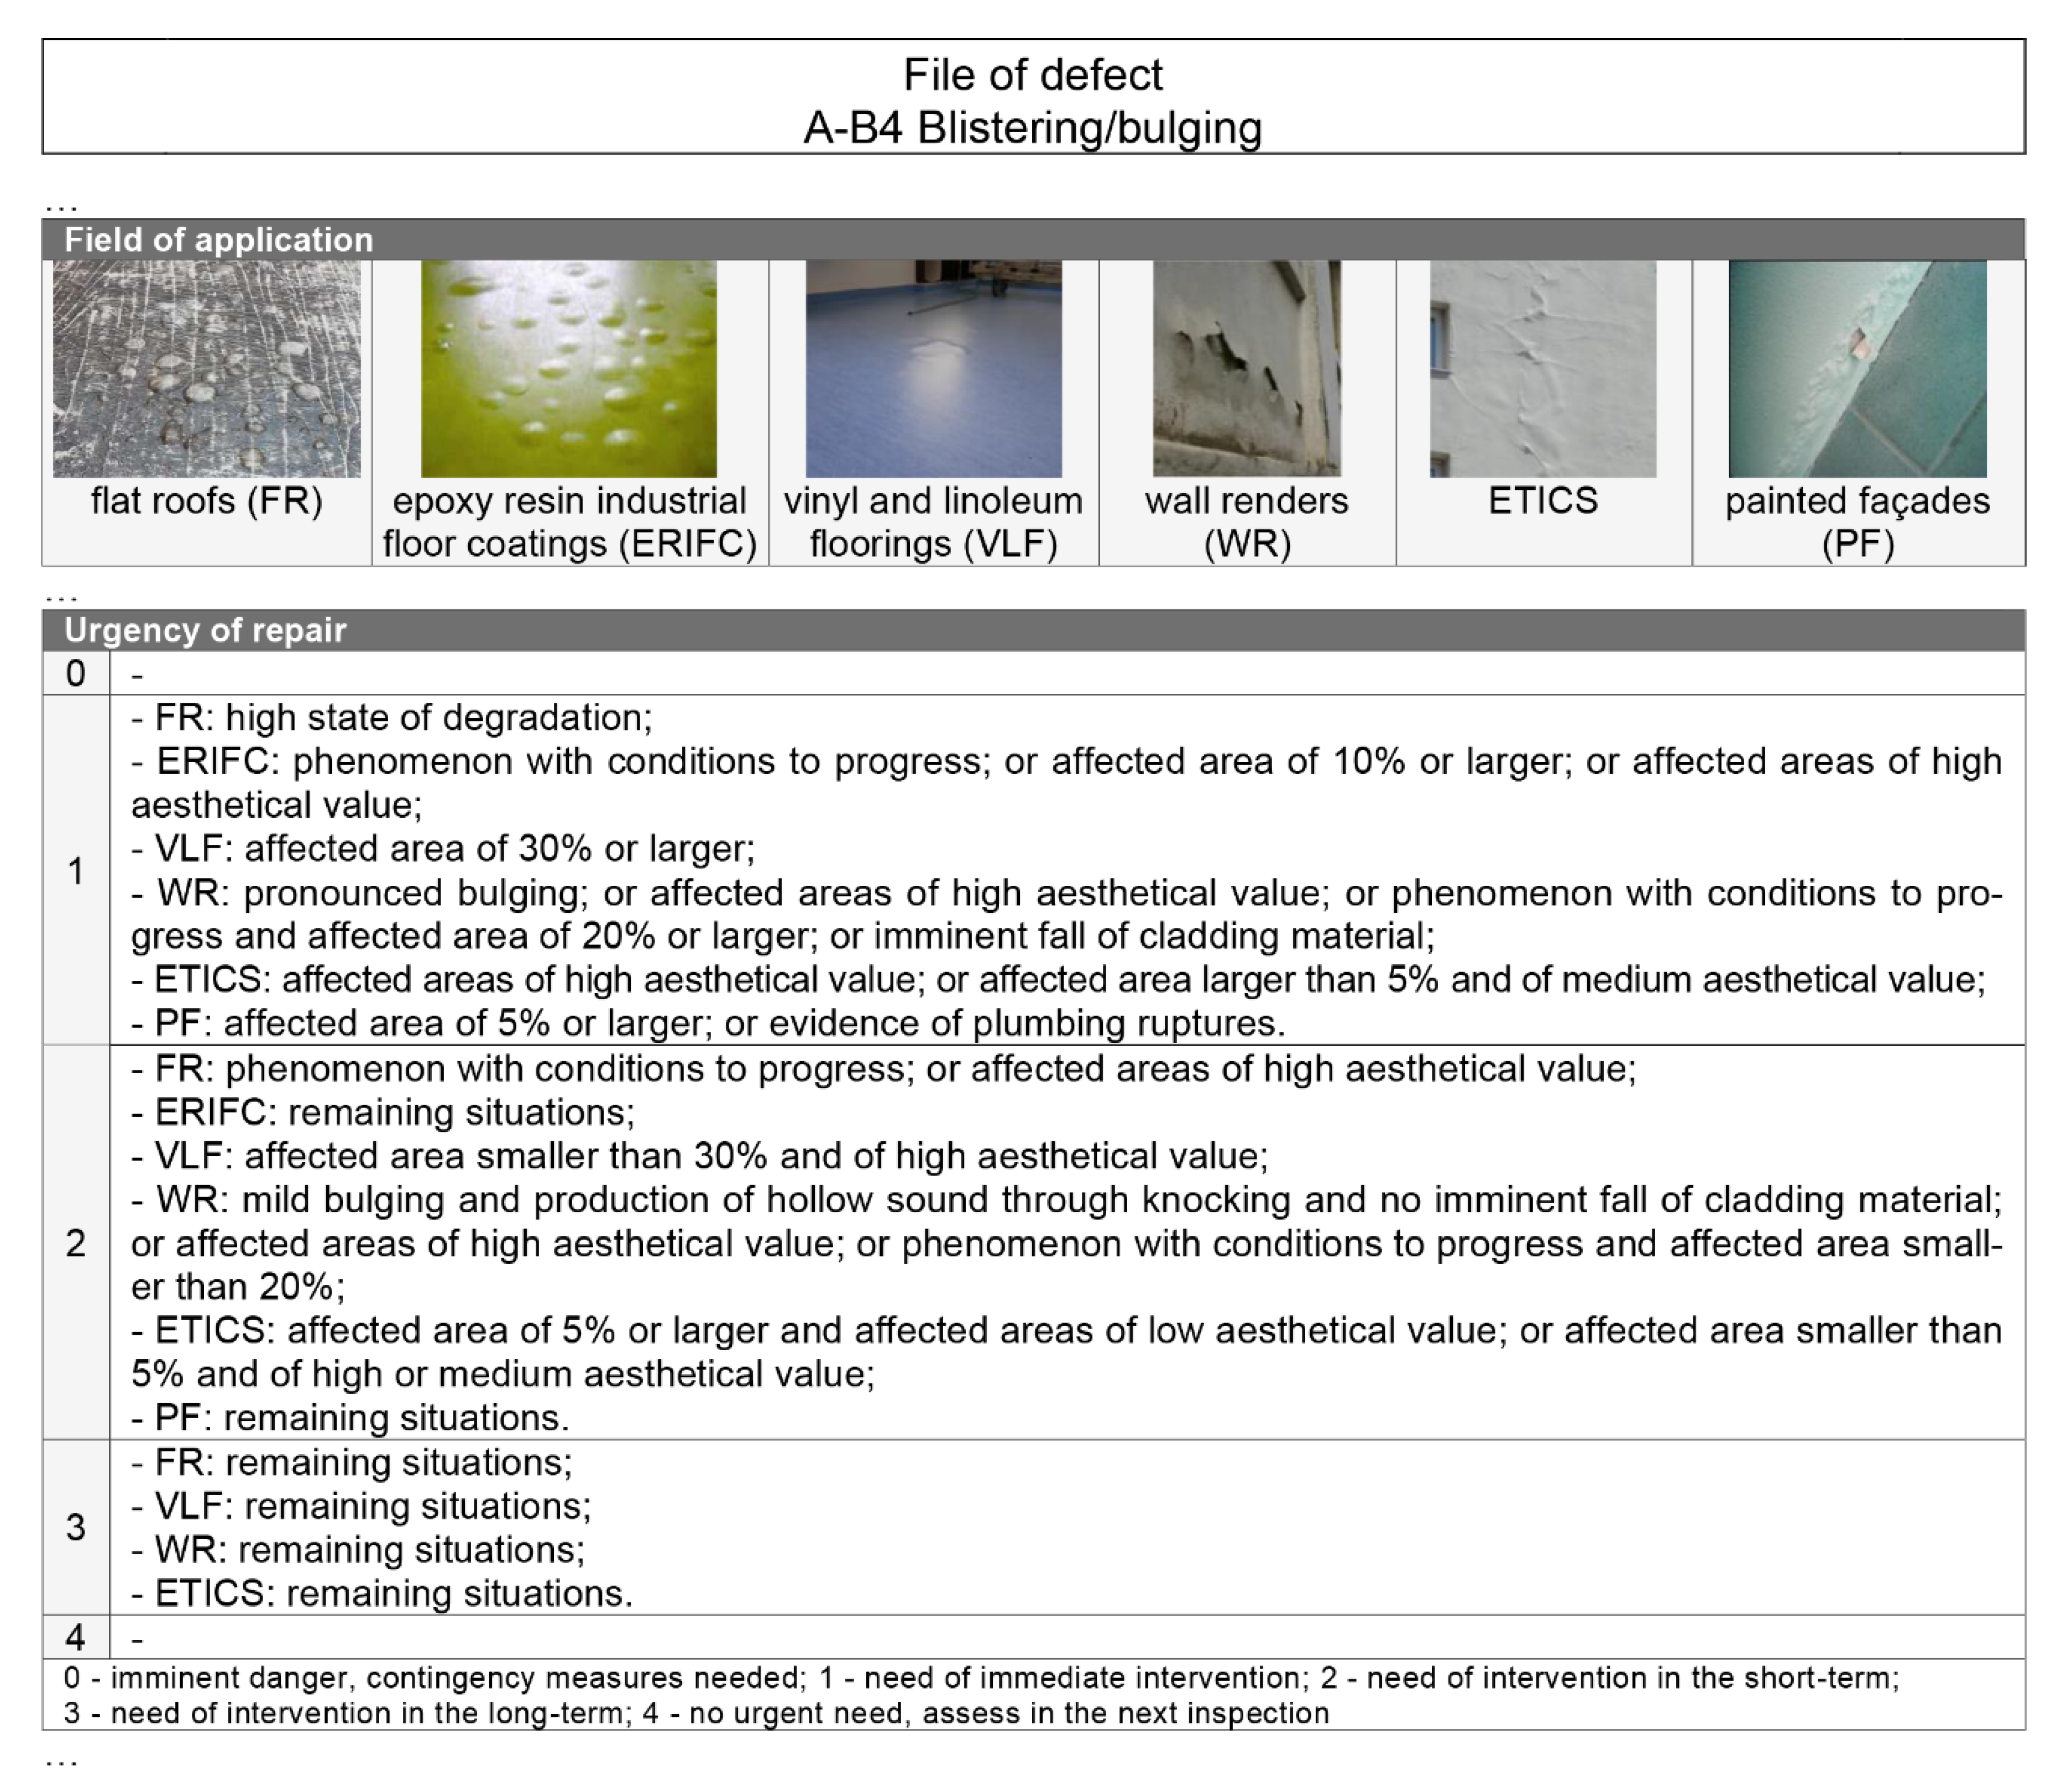
- 0: imminent danger, contingency measures needed;
- 1: need for immediate intervention;
- 2: need for intervention in the short-term;
- 3: need for intervention in the long-term;
- 4: no urgent need, assess in the next inspection.
3. Results
4. Discussion
5. Conclusions
Author Contributions
Funding
Acknowledgments
Conflicts of Interest
References
- Kohler, N.; Yang, W. Long-Term management of building stocks. Build. Res. Inf. 2007, 35, 351–362. [Google Scholar] [CrossRef]
- Palmer, R.D. Maintenance Planning and Scheduling Handbook, 2nd ed.; McGraw Hill: New York, NY, USA, 2006; Volume 111, ISBN 007150155X. [Google Scholar]
- Flores-Colen, I.; de Brito, J. A systematic approach for maintenance budgeting of buildings façades based on predictive and preventive strategies. Constr. Build. Mater. 2010, 24, 1718–1729. [Google Scholar] [CrossRef]
- Flores-Colen, I.; de Brito, J. Discussion of proactive maintenance strategies in façades’ coatings of social housing. J. Build. Apprais. 2010, 5, 223–240. [Google Scholar] [CrossRef]
- de Brito, J.; Pereira, C.; Silvestre, J.D.; Flores-Colen, I. Expert Knowledge-Based Inspection Systems. Inspection, Diagnosis and Repair of the Building Envelope; Springer: Cham, Switzerland, 2020; ISBN 9783030424459. [Google Scholar]
- Robertsen, E. Design for durability–A practical approach. In Durability of Building Materials and Components 8; Lacasse, M.A., Vanier, D.J., Eds.; Institute for Research in Construction: Ottawa, ON, Canada, 1999; pp. 2107–2117. [Google Scholar]
- Khan, F.I.; Haddara, M.M. Risk-Based maintenance (RBM): A quantitative approach for maintenance/inspection scheduling and planning. J. Loss Prev. Process. Ind. 2003, 16, 561–573. [Google Scholar] [CrossRef]
- Teo, E.A.-L.; Harikrishna, N. A quantitative model for efficient maintenance of plastered and painted façades. Constr. Manag. Econ. 2006, 24, 1283–1293. [Google Scholar] [CrossRef]
- Ruiz, F.; Aguado, A.; Serrat, C.; Casas, J.R. Optimal metric for condition rating of existing buildings: Is five the right number? Struct. Infrastruct. Eng. 2019, 15, 740–753. [Google Scholar] [CrossRef]
- Goyet, J.; Straub, D.; Faber, M.H. Risk-Based inspection planning of offshore installations. Struct. Eng. Int. 2002, 12, 200–208. [Google Scholar] [CrossRef]
- Pereira, C.; Silva, A.; de Brito, J.; Silvestre, J.D. Urgency of repair of building elements: Prediction and influencing factors in façade renders. Constr. Build. Mater. 2020, 249, 118743. [Google Scholar] [CrossRef]
- Pereira, C.; de Brito, J.; Silvestre, J.D. Harmonising the classification of the causes of defects in a global building inspection system: Proposed methodology and analysis of fieldwork data. Sustainability 2020, 12, 5564. [Google Scholar] [CrossRef]
- Pereira, C.; de Brito, J.; Silvestre, J.D. Harmonising the classification of diagnosis methods within a global building inspection system: Proposed methodology and analysis of fieldwork data. Eng. Fail. Anal. 2020, 115, 104627. [Google Scholar] [CrossRef]
- Pereira, C.; de Brito, J.; Silvestre, J.D. Harmonised classification of repair techniques in a global inspection system: Proposed methodology and analysis of fieldwork data. J. Perform. Constr. Facil. 2020, in press. [Google Scholar]
- Flores-Colen, I.; de Brito, J.; de Freitas, V.P. Expedient in situ test techniques for predictive maintenance of rendered façades. J. Build. Apprais. 2006, 2, 142–156. [Google Scholar] [CrossRef]
- Elcometer Inspection Equipment: Elcometer 143—Crack Width Ruler. Available online: https://www.elcometer.com/images/stories/PDFs/Datasheets/English/143.pdf (accessed on 18 November 2019).
- Johnson, R.W. The significance of cracks in low-rise buildings. Struct. Surv. 2002, 20, 155–161. [Google Scholar] [CrossRef]
- Akbari, R. Crack survey in unreinforced concrete or masonry abutments in short- and medium-span bridges. J. Perform. Constr. Facil. 2013, 27, 203–208. [Google Scholar] [CrossRef]
- Hård, A.; Sivik, L.; Tonnquist, G. NCS, natural color system—From concept to research and applications. Part I Color Res. Appl. 1996, 21, 180–205. [Google Scholar] [CrossRef]
- ASTM International. ASTM D1535-14(2018) Standard Practice for Specifying Color by the Munsell System; ASTM International: West Conshohocken, PA, USA, 2018. [Google Scholar]
- Tyler, J.E.; Hardy, A.C. An analysis of the original Munsell color system. J. Opt. Soc. Am. 1940, 30, 587–590. [Google Scholar] [CrossRef]
- Garcez, N.; Lopes, N.; de Brito, J.; Silvestre, J. System of inspection, diagnosis and repair of external claddings of pitched roofs. Constr. Build. Mater. 2012, 35, 1034–1044. [Google Scholar] [CrossRef]
- Garcez, N.; Lopes, N.; de Brito, J.; Sá, G. Pathology, diagnosis and repair of pitched roofs with ceramic tiles: Statistical characterisation and lessons learned from inspections. Constr. Build. Mater. 2012, 36, 807–819. [Google Scholar] [CrossRef]
- Walter, A.; de Brito, J.; Lopes, J.G. Current flat roof bituminous membranes waterproofing systems–Inspection, diagnosis and pathology classification. Constr. Build. Mater. 2005, 19, 233–242. [Google Scholar] [CrossRef]
- Conceição, J.; Poça, B.; de Brito, J.; Flores-Colen, I.; Castelo, A. Inspection, diagnosis, and rehabilitation system for flat roofs. J. Perform. Constr. Facil. 2017, 31, 04017100. [Google Scholar] [CrossRef]
- Conceição, J.; Poça, B.; de Brito, J.; Flores-Colen, I.; Castelo, A. Data analysis of inspection, diagnosis, and rehabilitation of flat roofs. J. Perform. Constr. Facil. 2019, 33, 04018100. [Google Scholar] [CrossRef]
- Santos, A.; Vicente, M.; de Brito, J.; Flores-Colen, I.; Castelo, A. Analysis of the inspection, diagnosis, and repair of external door and window frames. J. Perform. Constr. Facil. 2017, 31, 04017098. [Google Scholar] [CrossRef]
- Santos, A.; Vicente, M.; de Brito, J.; Flores-Colen, I.; Castelo, A. Inspection, diagnosis, and rehabilitation system of door and window frames. J. Perform. Constr. Facil. 2017, 31, 04016118. [Google Scholar] [CrossRef]
- Sá, G.; Sá, J.; de Brito, J.; Amaro, B. Statistical survey on inspection, diagnosis and repair of wall renderings. J. Civ. Eng. Manag. 2015, 21, 623–636. [Google Scholar] [CrossRef]
- Sá, G.; Sá, J.; de Brito, J.; Amaro, B. Inspection and diagnosis system for rendered walls. Int. J. Civ. Eng. 2014, 12, 279–290. [Google Scholar]
- Amaro, B.; Saraiva, D.; de Brito, J.; Flores-Colen, I. Statistical survey of the pathology, diagnosis and rehabilitation of ETICS in walls. J. Civ. Eng. Manag. 2014, 20, 511–526. [Google Scholar] [CrossRef]
- Amaro, B.; Saraiva, D.; de Brito, J.; Flores-Colen, I. Inspection and diagnosis system of ETICS on walls. Constr. Build. Mater. 2013, 47, 1257–1267. [Google Scholar] [CrossRef]
- Pires, R.; de Brito, J.; Amaro, B. Inspection, diagnosis, and rehabilitation system of painted rendered façades. J. Perform. Constr. Facil. 2015, 29, 04014062. [Google Scholar] [CrossRef]
- Pires, R.; de Brito, J.; Amaro, B. Statistical survey of the inspection, diagnosis and repair of painted rendered façades. Struct. Infrastruct. Eng. 2015, 11, 605–618. [Google Scholar] [CrossRef]
- da Silva, C.; Coelho, F.; de Brito, J.; Silvestre, J.; Pereira, C. Inspection, diagnosis, and repair system for architectural concrete surfaces. J. Perform. Constr. Facil. 2017, 31, 04017035. [Google Scholar] [CrossRef]
- da Silva, C.; Coelho, F.; de Brito, J.; Silvestre, J.; Pereira, C. Statistical survey on inspection, diagnosis and repair of architectural concrete surfaces. J. Perform. Constr. Facil. 2017, 31, 04017097. [Google Scholar] [CrossRef]
- Silvestre, J.D.; de Brito, J. Ceramic tiling inspection system. Constr. Build. Mater. 2009, 23, 653–668. [Google Scholar] [CrossRef]
- Silvestre, J.D.; de Brito, J. Ceramic tiling in building façades: Inspection and pathological characterization using an expert system. Constr. Build. Mater. 2011, 25, 1560–1571. [Google Scholar] [CrossRef]
- Silvestre, J.D.; de Brito, J. Inspection and repair of ceramic tiling within a building management system. J. Mater. Civ. Eng. 2010, 22, 39–48. [Google Scholar] [CrossRef]
- Neto, N.; de Brito, J. Validation of an inspection and diagnosis system for anomalies in natural stone cladding (NSC). Constr. Build. Mater. 2012, 30, 224–236. [Google Scholar] [CrossRef]
- Neto, N.; de Brito, J. Inspection and defect diagnosis system for natural stone cladding. J. Mater. Civ. Eng. 2011, 23, 1433–1443. [Google Scholar] [CrossRef]
- Delgado, A.; Pereira, C.; de Brito, J.; Silvestre, J.D. Defect characterization, diagnosis and repair of wood flooring based on a field survey. Mater. Constr. 2018, 68, 1–13. [Google Scholar] [CrossRef]
- Delgado, A.; de Brito, J.; Silvestre, J.D. Inspection and diagnosis system for wood flooring. J. Perform. Constr. Facil. 2013, 27, 564–574. [Google Scholar] [CrossRef]
- Garcia, J.; de Brito, J. Inspection and diagnosis of epoxy resin industrial floor coatings. J. Mater. Civ. Eng. 2008, 20, 128–136. [Google Scholar] [CrossRef]
- Carvalho, C.; de Brito, J.; Flores-Colen, I.; Pereira, C. Inspection, diagnosis, and rehabilitation system for vinyl and linoleum floorings in health infrastructures. J. Perform. Constr. Facil. 2018, 32, 04018078. [Google Scholar] [CrossRef]
- Carvalho, C.; de Brito, J.; Flores-Colen, I.; Pereira, C. Pathology and rehabilitation of vinyl and linoleum floorings in health infrastructures: Statistical survey. Buildings 2019, 9, 116. [Google Scholar] [CrossRef]
- European Committee for Standardization. EN ISO 4628-4:2016 Paints and Varnishes–Evaluation of Degradation of Coatings–Designation of Quantity and Size of Defects, and of Intensity of Uniform Changes in Appearance–Part. 4: Assessment of Degree of Cracking (ISO 4628-4:2016); European Committee for Standardization: Brussels, Belgium, 2016. [Google Scholar]
- European Committee for Standardization. EN ISO 4628-2:2016 Paints and varnishes–Evaluation of Degradation of Coatings–Designation of Quantity and Size of Defects, and of Intensity of Uniform Changes in Appearance–Part. 2: Assessment of Degree of Blistering (ISO 4628-2:2016); European Committee for Standardization: Brussels, Belgium, 2016. [Google Scholar]
- van Winden, C.; Dekker, R. Rationalisation of building maintenance by Markov decision models: A pilot case study. J. Oper. Res. Soc. 1998, 49, 928–935. [Google Scholar] [CrossRef]
- Flourentzou, F.; Brandt, E.; Wetzel, C. MEDIC—A method for predicting residual service life and refurbishment investment budgets. Energy Build. 2000, 31, 167–170. [Google Scholar] [CrossRef]
- Brandt, E.; Wittchen, K.B.; Faist, A.; Genre, J.L. EPIQR—A new surveying tool for maintenance and refurbishment. In Durability of Building Materials and Componentes 8; Lacasse, M.A., Vanier, D.J., Eds.; National Research Council Canada: Ottawa, ON, Canada, 1999; pp. 1576–1584. [Google Scholar]
- Flourentzos, F.; Droutsa, K.; Wittchen, K.B. EPIQR software. Energy Build. 2000, 31, 129–136. [Google Scholar] [CrossRef]
- Allehaux, D.; Tessier, P. Evaluation of the functional obsolescence of building services in European office buildings. Energy Build. 2002, 34, 127–133. [Google Scholar] [CrossRef]
- National Aeronautics and Space Administration. Reliability-Centered Maintenance Guide for Facilities and Collateral Equipment; National Aeronautics and Space Administration: Washington, DC, USA, 2008.
- Rodrigues, M.F.S.; Teixeira, J.M.C.; Cardoso, J.C.P. Buildings envelope anomalies: A visual survey methodology. Constr. Build. Mater. 2011, 25, 2741–2750. [Google Scholar] [CrossRef]
- Elhakeem, A.; Hegazy, T. Building asset management with deficiency tracking and integrated life cycle optimisation. Struct. Infrastruct. Eng. 2012, 8, 729–738. [Google Scholar] [CrossRef]
- Morgado, J.; Flores-Colen, I.; de Brito, J.; Silva, A. Maintenance planning of pitched roofs in current buildings. J. Constr. Eng. Manag. 2017, 143, 05017010. [Google Scholar] [CrossRef]
- Morgado, J.; Flores-Colen, I.; de Brito, J.; Silva, A. Maintenance programs for flat roofs in existing buildings. Prop. Manag. 2017, 35, 339–362. [Google Scholar]
- Uzarski, D.R.; Grussing, M.N.; Mehnert, B.B. ERDC/CERL SR-18-7 Knowledge-Based Condition Assessment Reference Manual for Building Component-Sections. For. Use with BUILDER™ and BuilderRED™ (v. 3 Series); Construction Engineering Research Laboratory, US Army Engineer Research and Development Center: Champaign, IL, USA, 2018. [Google Scholar]
- Lee, J.-S. Value engineering for defect prevention on building façade. J. Constr. Eng. Manag. 2018, 144, 04018069. [Google Scholar] [CrossRef]
- Bortolini, R.; Forcada, N. Building inspection system for evaluating the technical performance of existing buildings. J. Perform. Constr. Facil. 2018, 32, 04018073. [Google Scholar] [CrossRef]
- Silva, A.; de Brito, J.; Gaspar, P.L. Green Energy and Technology. In Methodologies for Service Life Prediction of Buildings. With a Focus on Façade Claddings; Springer: Cham, Switzerland, 2016; ISBN 978-3-319-33288-8. [Google Scholar]
- Ruiz, F.; Aguado, A.; Serrat, C.; Casas, J.R. Condition assessment of building façades based on hazard to people. Struct. Infrastruct. Eng. 2019, 15, 1346–1365. [Google Scholar] [CrossRef]
- Fernandes, D.; de Brito, J.; Silva, A. Methodology for service life prediction of window frames. Can. J. Civ. Eng. 2019, 46, 1010–1020. [Google Scholar] [CrossRef]
- van Hees, R.P.J.; Binda, L.; Papayianni, I.; Toumbakari, E. Characterisation and damage analysis of old mortars. Mater. Struct. 2004, 37, 644–648. [Google Scholar] [CrossRef]
- Blocken, B.; Derome, D.; Carmeliet, J. Rainwater runoff from building facades: A review. Build. Environ. 2013, 60, 339–361. [Google Scholar] [CrossRef]
- Júnior, C.M.M.; Carasek, H. Relationship between the deterioration of multi story buildings facades and the driving rain. Rev. Constr. 2014, 13, 64–73. [Google Scholar]
- National Precast Concrete Association. Precast Concrete Architectural Repair Guide; National Precast Concrete Association: Carmel, IN, USA, 2013. [Google Scholar]
- Gaspar, P.L. End of the service life of ceramic cladding: Lessons from the Girasol Building in Madrid. J. Perform. Constr. Facil. 2017, 31, 04016088. [Google Scholar] [CrossRef]


| References | Building Elements/Materials | Validation Sample | |
|---|---|---|---|
| [22,23] | roofs | external claddings of pitched roofs (ECPR) | 207 surfaces 164 buildings |
| [24,25,26] | flat roofs (FL) | 105 surfaces 105 buildings | |
| [27,28] | façade elements | door and window frames (DWF) | 295 frames 96 buildings |
| [29,30] | façade claddings | wall renders (WR) | 150 surfaces 55 buildings |
| [31,32] | external thermal insulation composite systems (ETICS) | 146 façades 14 buildings | |
| [33,34] | painted façades (PF) | 105 façades 41 buildings | |
| [35,36] | architectural concrete surfaces (ACS) | 110 surfaces 53 buildings | |
| [37,38,39] | façade claddings and floorings | adhesive ceramic tiling (ACT) | 88 surfaces 46 buildings |
| [40,41] | natural stone claddings (NSC) | 128 surfaces 59 buildings | |
| [42,43] | floorings | wood floorings (WF) | 98 floorings 35 buildings |
| [44] | epoxy resin industrial floor coatings (ERIFC) | 29 floorings 23 buildings | |
| [45,46] | vinyl and linoleum floorings (VLF) | 101 floorings 6 buildings | |
| Reference | Measure | Levels | Use |
|---|---|---|---|
| [49] | state of a building component | 1–6 (excellent to very bad) | direct assignment |
| [50] | deterioration state of elements | a, b, c and d (from the least to the most severe) | direct assignment |
| [53] | obsolescence criteria ratings for elements of office buildings | A, B and C (from good to poor or not sufficient) | algorithm |
| [54] | condition assessment ratings of building systems | 5, 4, 3, 2 and 1 (from excellent to bad) | direct assignment |
| [55] | level of severity of degradation of building elements | 3–10 (8 levels, from the most to the least severe) | algorithm |
| [56] | inspected severity of deficiencies | 0–100 (from the least to the most severe) | direct assignment |
| [57,58] | degradation condition of building elements | 0, 1, 2 and 3 (from not visible to generalised degradation) | direct assignment |
| [57,58] | severity of defects | A, B, C, D and E (from the least to the most severe) | direct assignment |
| [59] | distress severity (detailed distress survey) | low, medium or high | algorithm |
| [59] | direct rating of serviceability problems due to degradation | from Green (+) to Red (-) (9 levels, from the least to the most severe) | direct assignment |
| [60] | severity rating (seriousness) of defects | 1, 2, 3, 4 and 5 (from extremely minor to extremely major) | direct assignment |
| [61] | severity rating of defects (effects and urgency of repair) | 1, 2 and 3 (from low to severe impact) | direct assignment |
| [8,11,14,16,18,19,21,25,27,29,30,31] | severity/repair urgency level of defects | 0, 1 and 2 (from the most to the least severe) | algorithm |
| [62] | defects’ condition | 0, 1, 2, 3 and 4 (from the least to the most severe) | algorithm |
| [62] | severity of degradation of building elements | A, B, C, D and E (from the least to the most severe) | algorithm |
| [9] | severity of degradation of building elements | 0, 1, 2, 3 and 4 (from the least to the most severe) | direct assignment |
| Cases of Defects | Urgency of Repair (Atlas of Defects) 1 | Severity Grade (Ruiz et al. [9]) 2 | Comparison Using a Unified Scale 3 | |
|---|---|---|---|---|
| Figure 5 | a | 2 (III) | 3 (II) | one level difference |
| b | 2 (III) | 1 (IV) | one level difference | |
| c | 3 (IV) | 2 (III) | one level difference | |
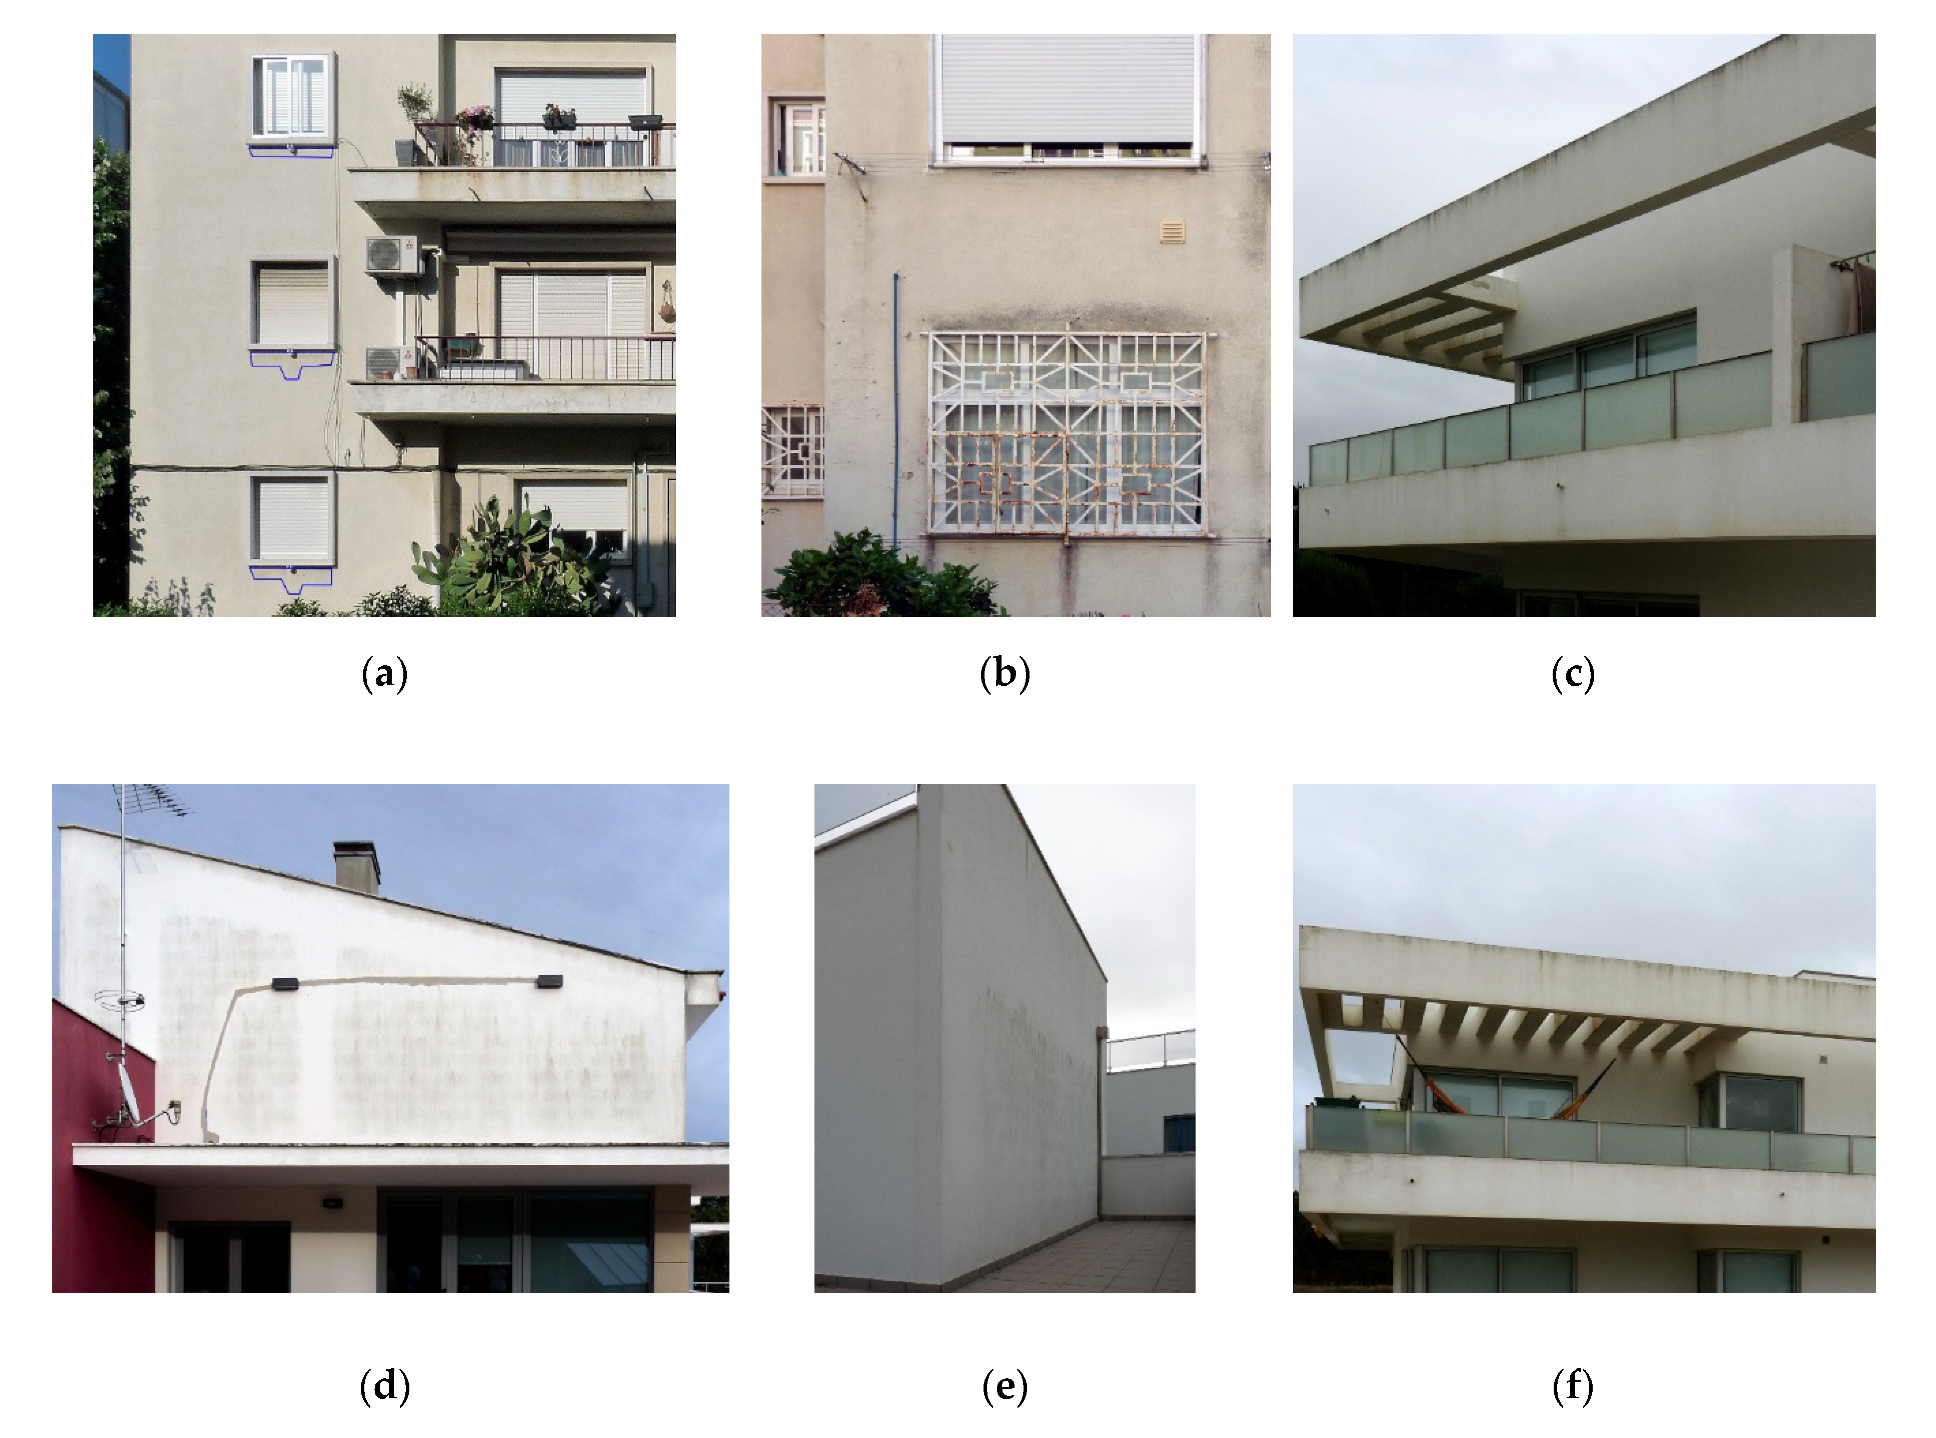
| Figure 6 | a | 1 (II) | 1 (IV) | two levels difference |
| b | 3 (IV) | 2 (III) | one level difference | |
| c | 3 (IV) | 1 (IV) | match | |
| d | 1 (II) | 2 (III) | one level difference | |
| e | 2 (III) | 2 (III) | match | |
| f | 1 (II) | 1 (IV) | two levels difference | |
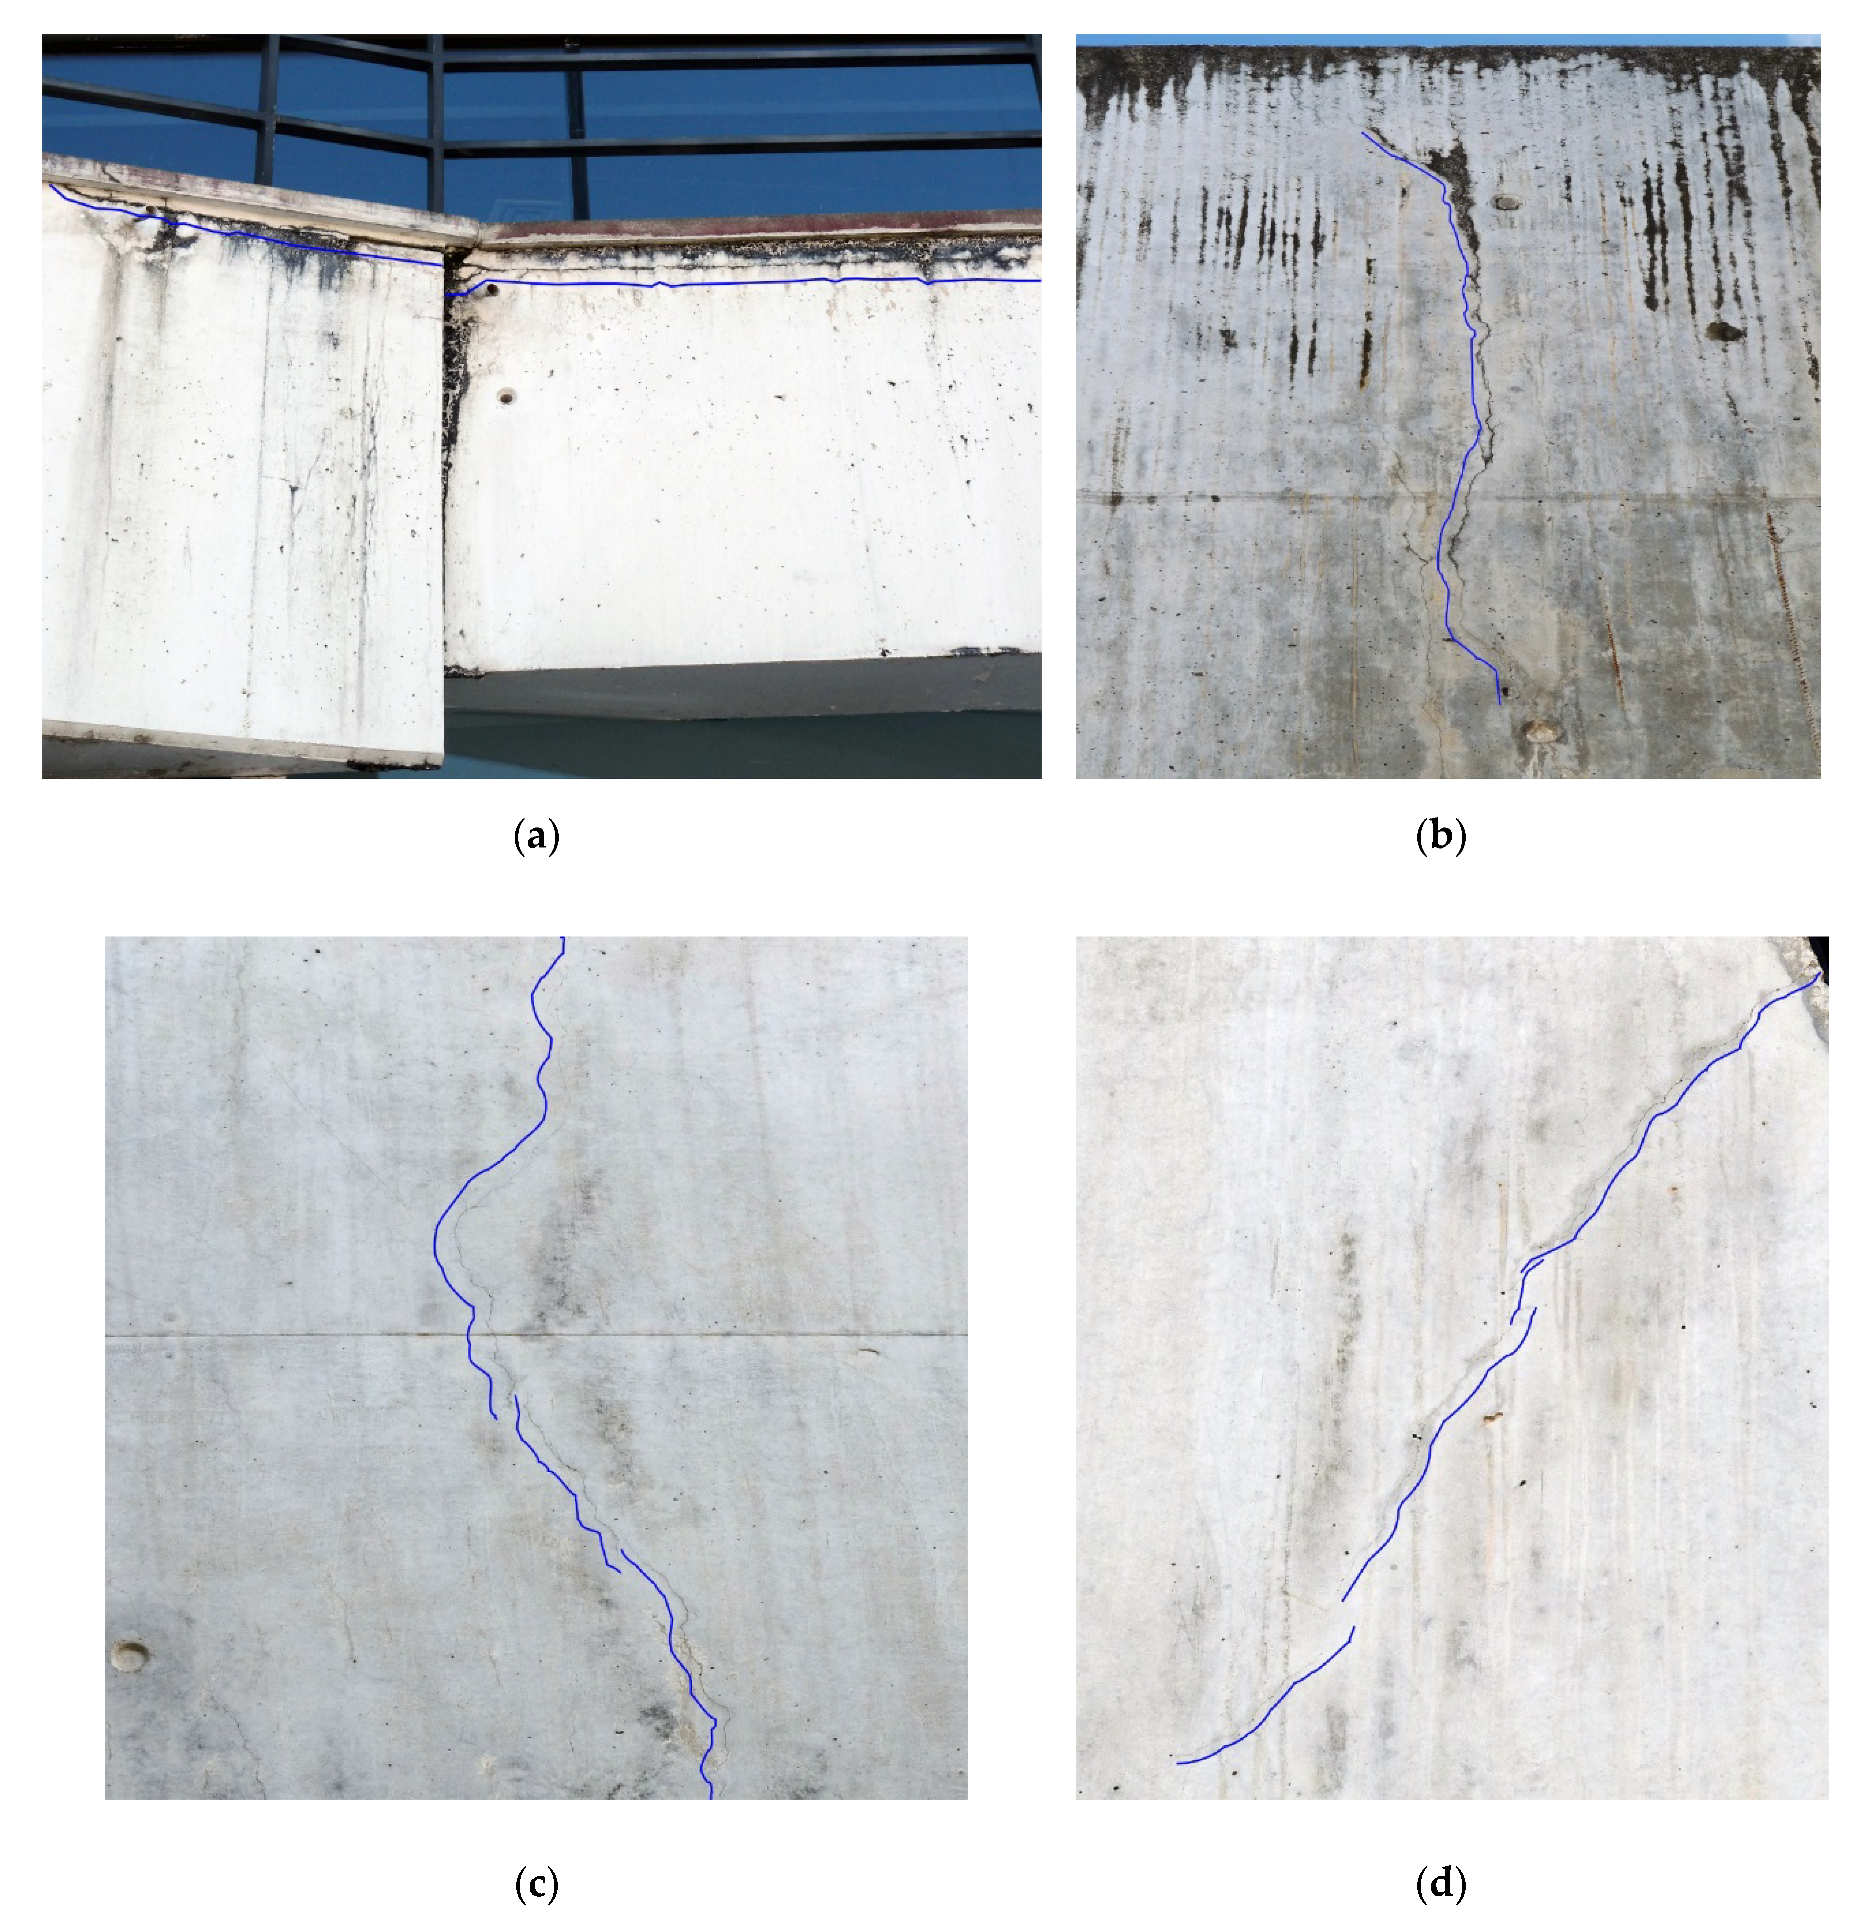
| Figure 7 | a | 1 (II) | 3 (II) | match |
| b | 1 (II) | 2 (III) | one level difference | |
| c | 2 (III) | 1 (IV) | one level difference | |
| d | 3 (IV) | 1 (IV) | match | |
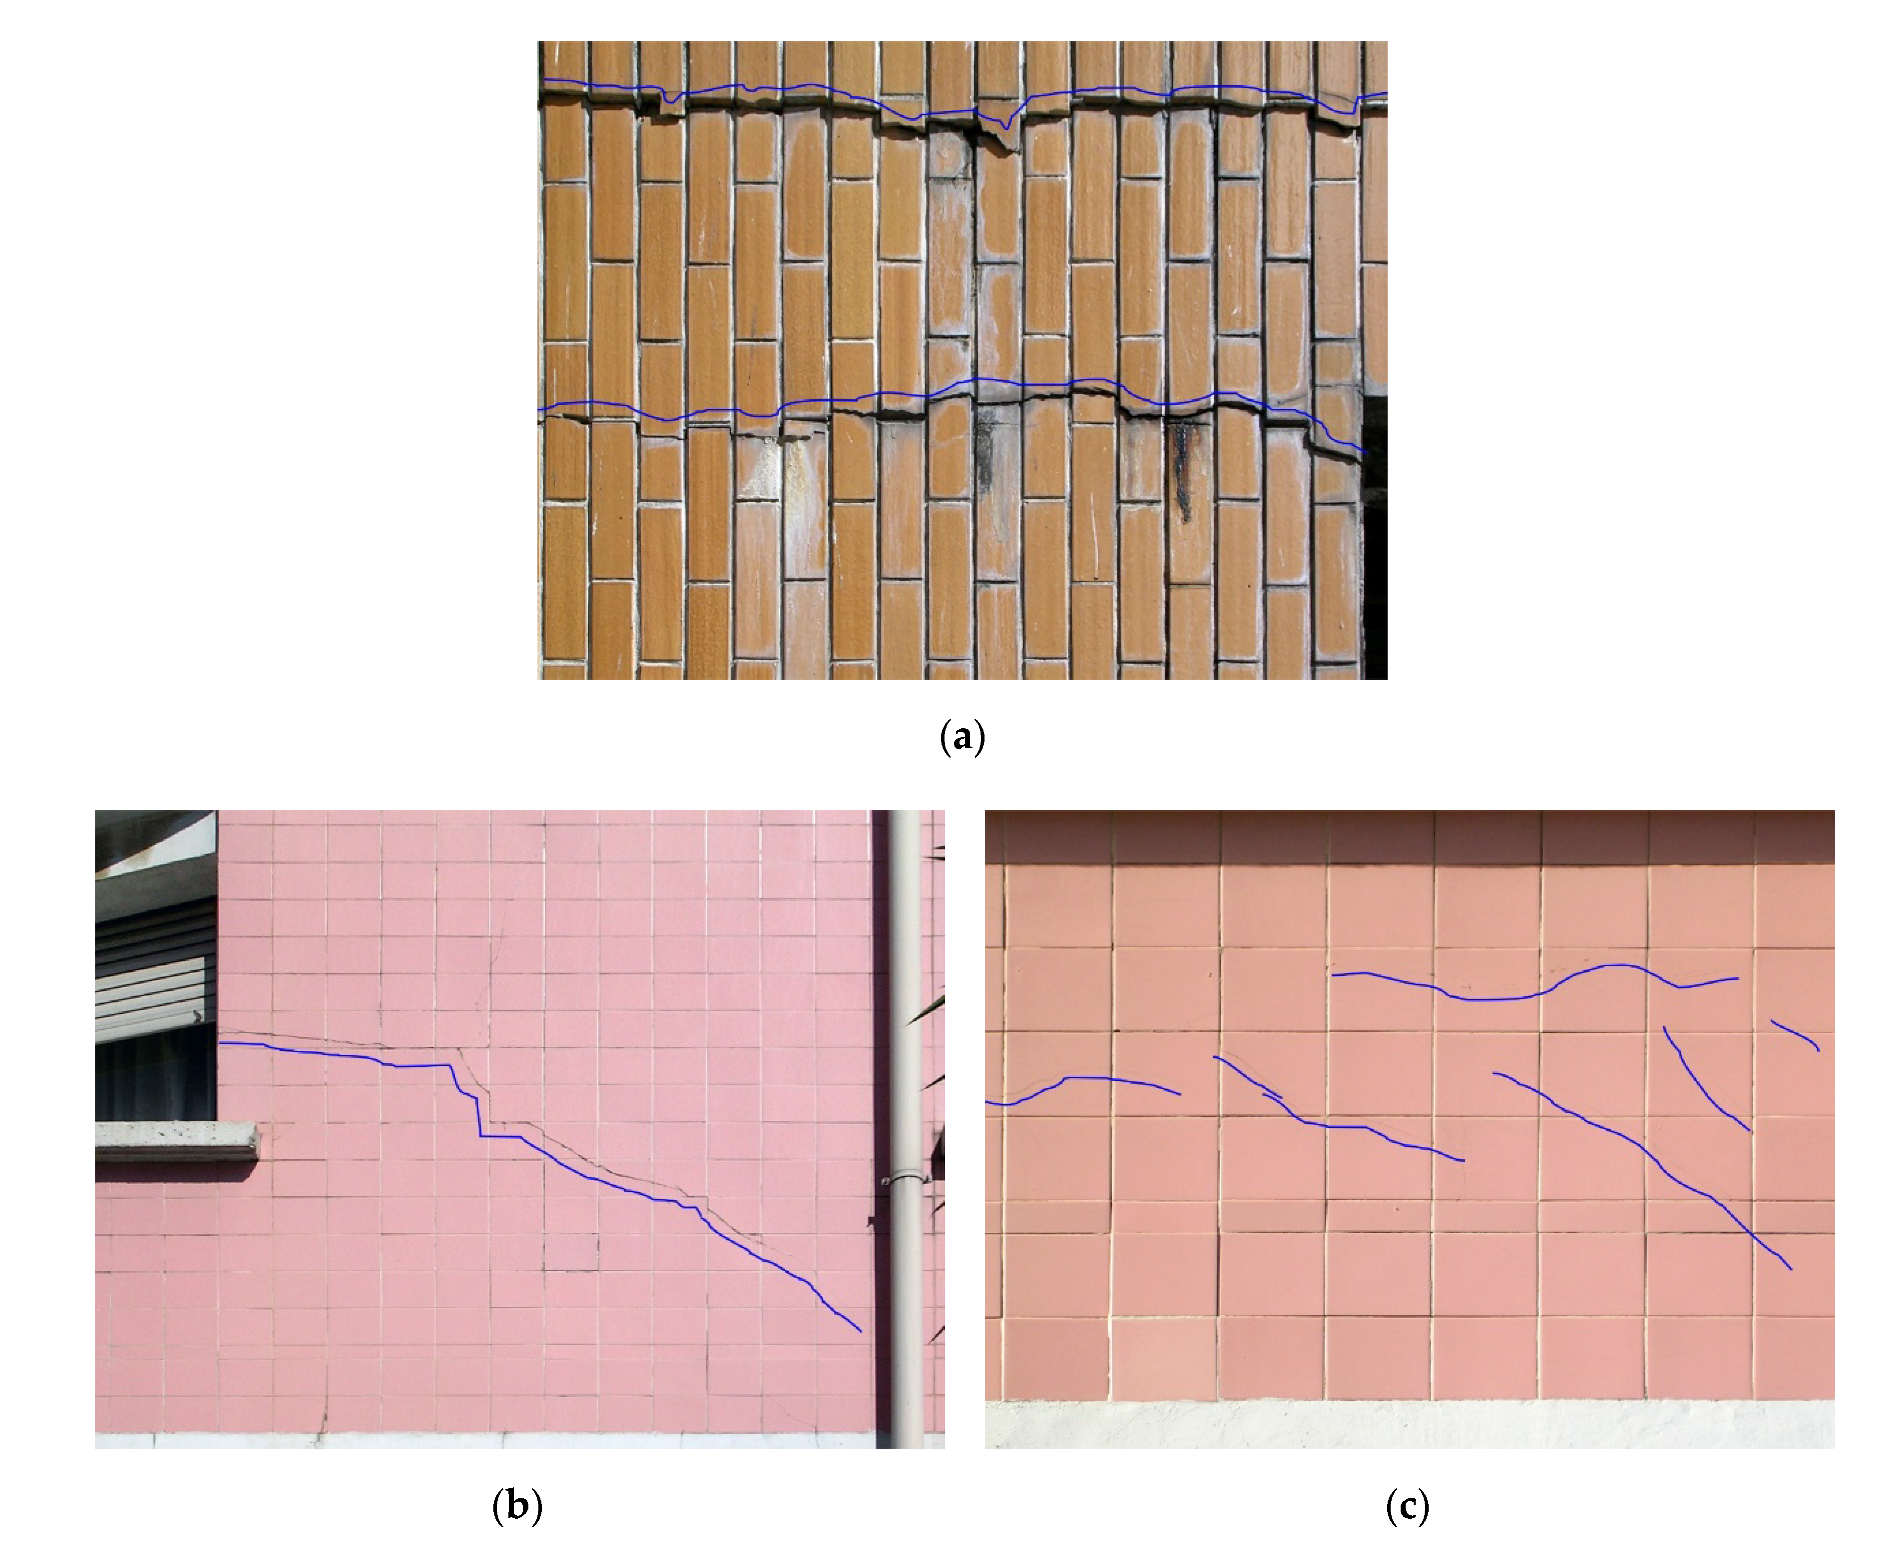
| Figure 8 | a | 2 (III) | 3 (II) | one level difference |
| b | 2 (III) | 2 (III) | match | |
| c | 3 (IV) | 1 (IV) | match | |
© 2020 by the authors. Licensee MDPI, Basel, Switzerland. This article is an open access article distributed under the terms and conditions of the Creative Commons Attribution (CC BY) license (http://creativecommons.org/licenses/by/4.0/).
Share and Cite
Pereira, C.; de Brito, J.; Silvestre, J.D.; Flores-Colen, I. Atlas of Defects within a Global Building Inspection System. Appl. Sci. 2020, 10, 5879. https://doi.org/10.3390/app10175879
Pereira C, de Brito J, Silvestre JD, Flores-Colen I. Atlas of Defects within a Global Building Inspection System. Applied Sciences. 2020; 10(17):5879. https://doi.org/10.3390/app10175879
Chicago/Turabian StylePereira, Clara, Jorge de Brito, José D. Silvestre, and Inês Flores-Colen. 2020. "Atlas of Defects within a Global Building Inspection System" Applied Sciences 10, no. 17: 5879. https://doi.org/10.3390/app10175879
APA StylePereira, C., de Brito, J., Silvestre, J. D., & Flores-Colen, I. (2020). Atlas of Defects within a Global Building Inspection System. Applied Sciences, 10(17), 5879. https://doi.org/10.3390/app10175879