Non-Destructive Techniques for Building Evaluation in Urban Areas: The Case Study of the Redesigning Project of Eleftheria Square (Nicosia, Cyprus)


Abstract
1. Introduction
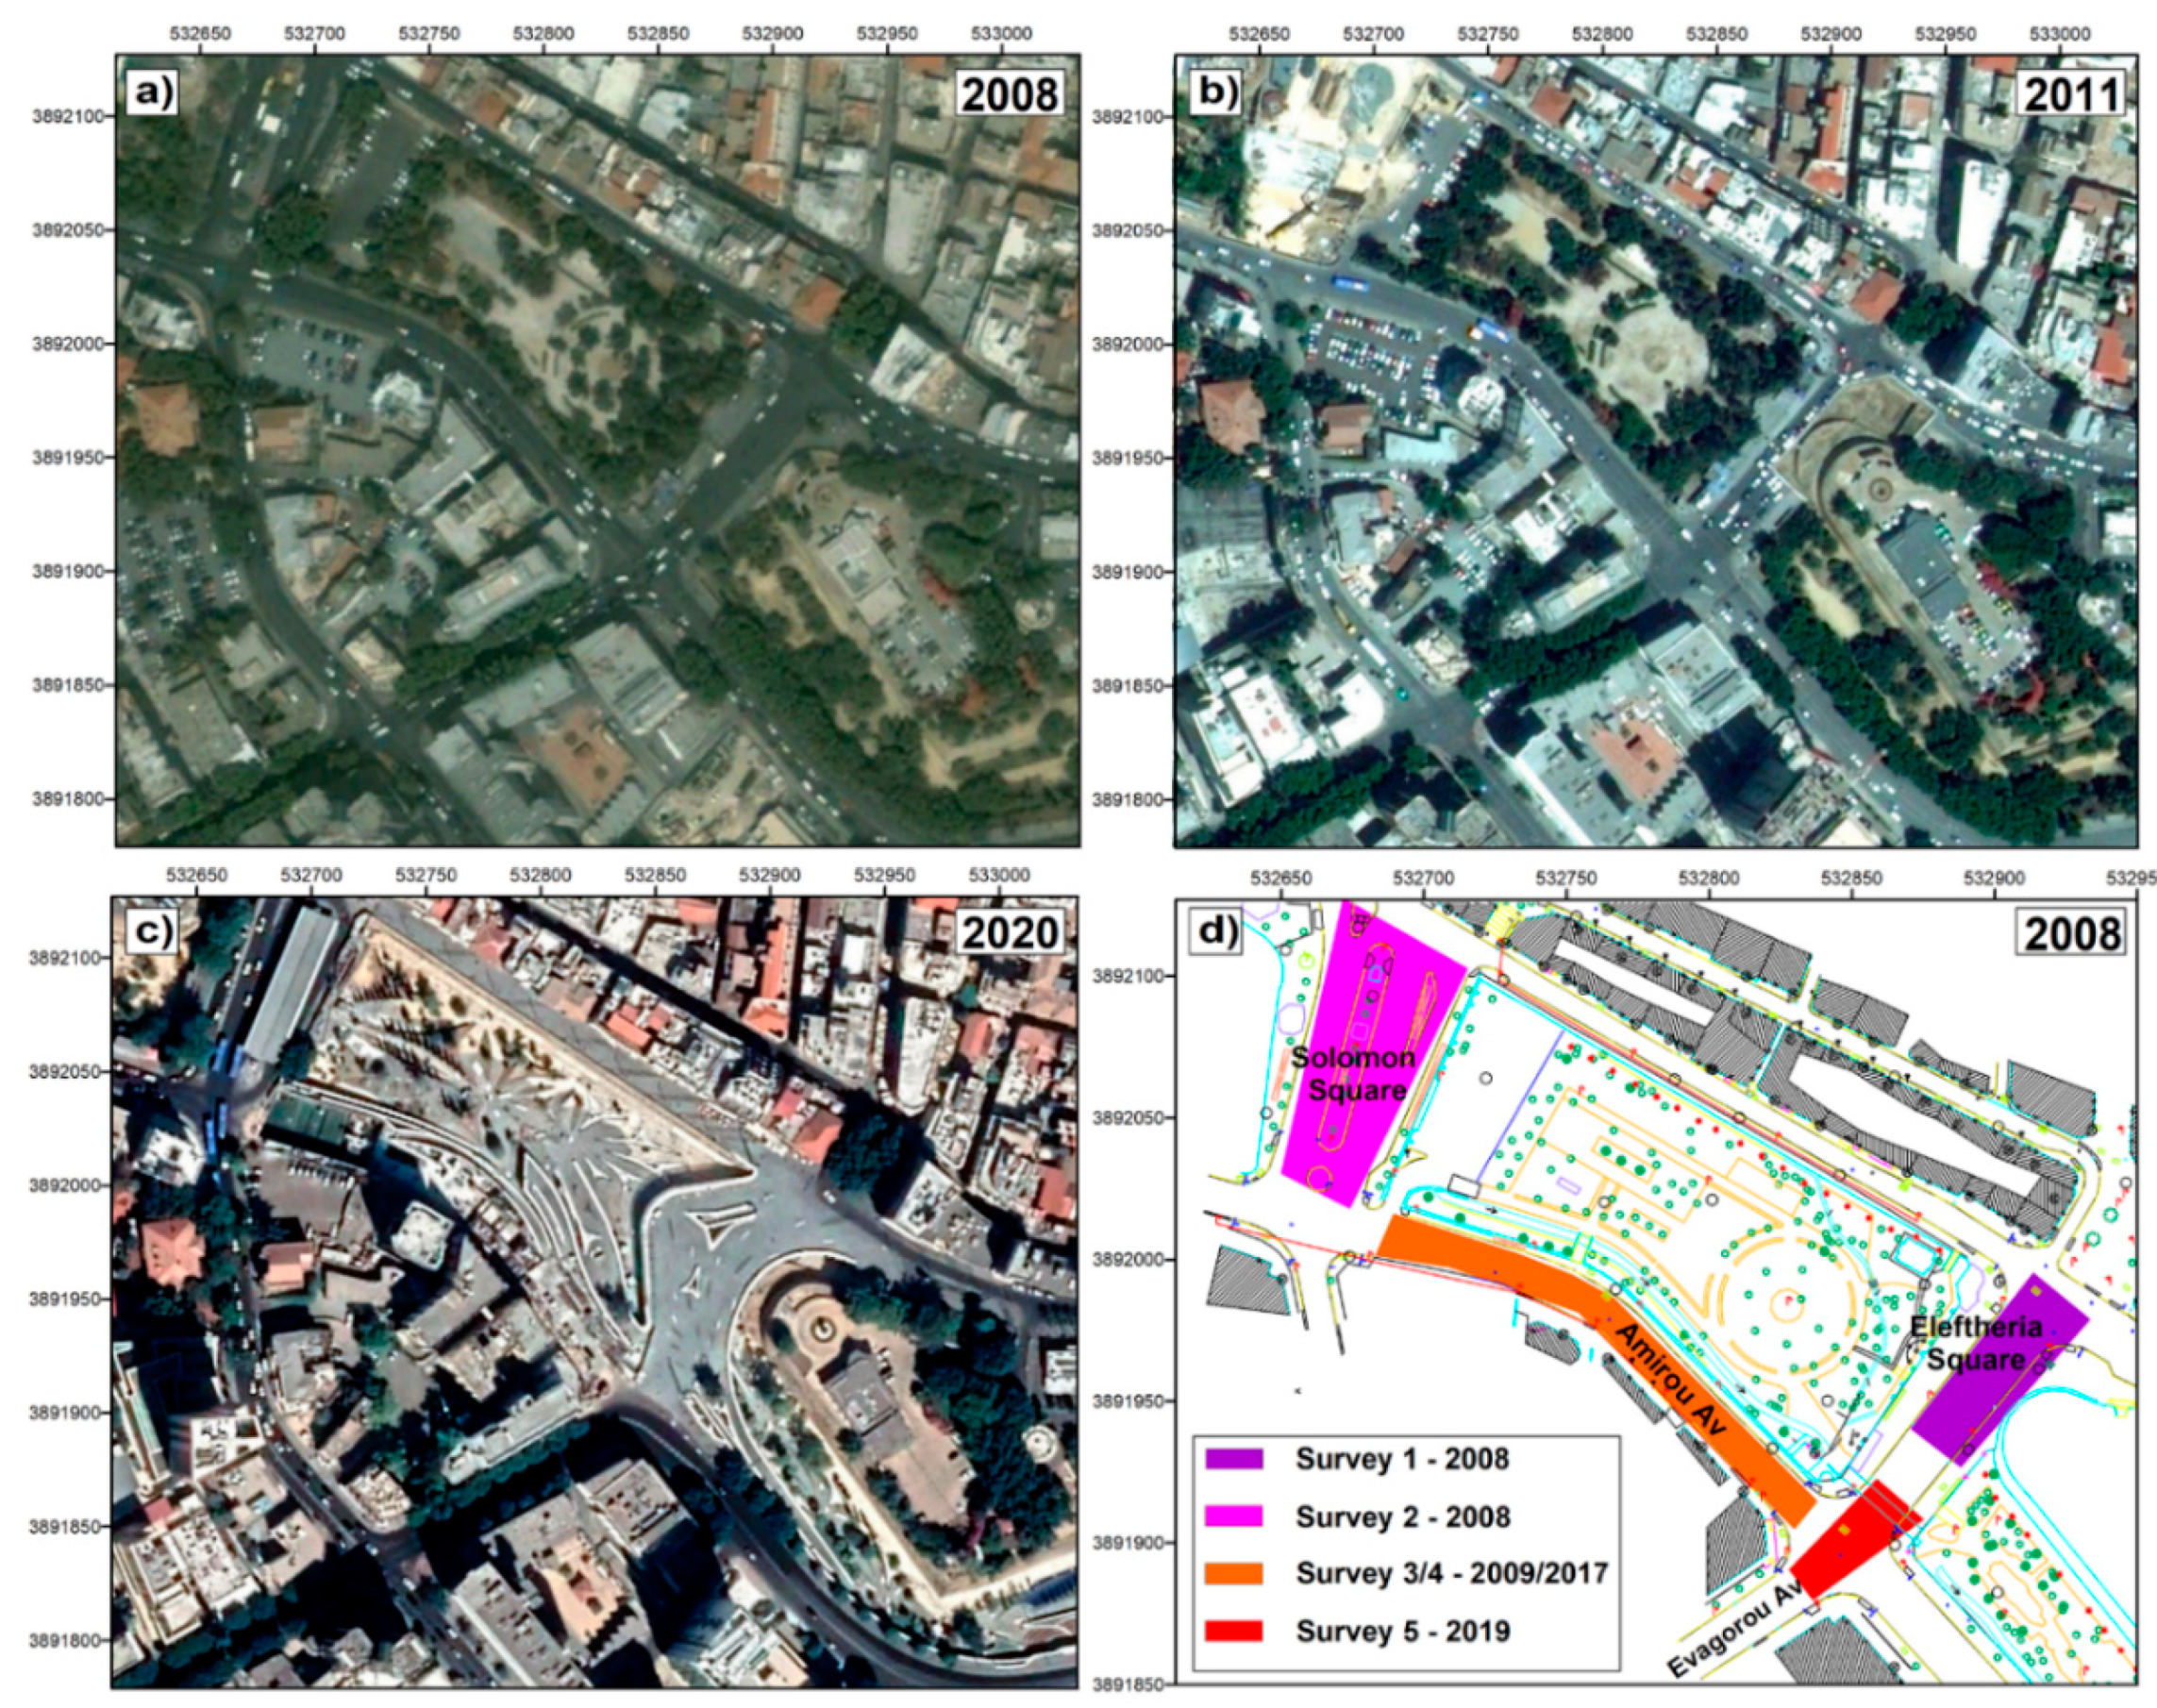
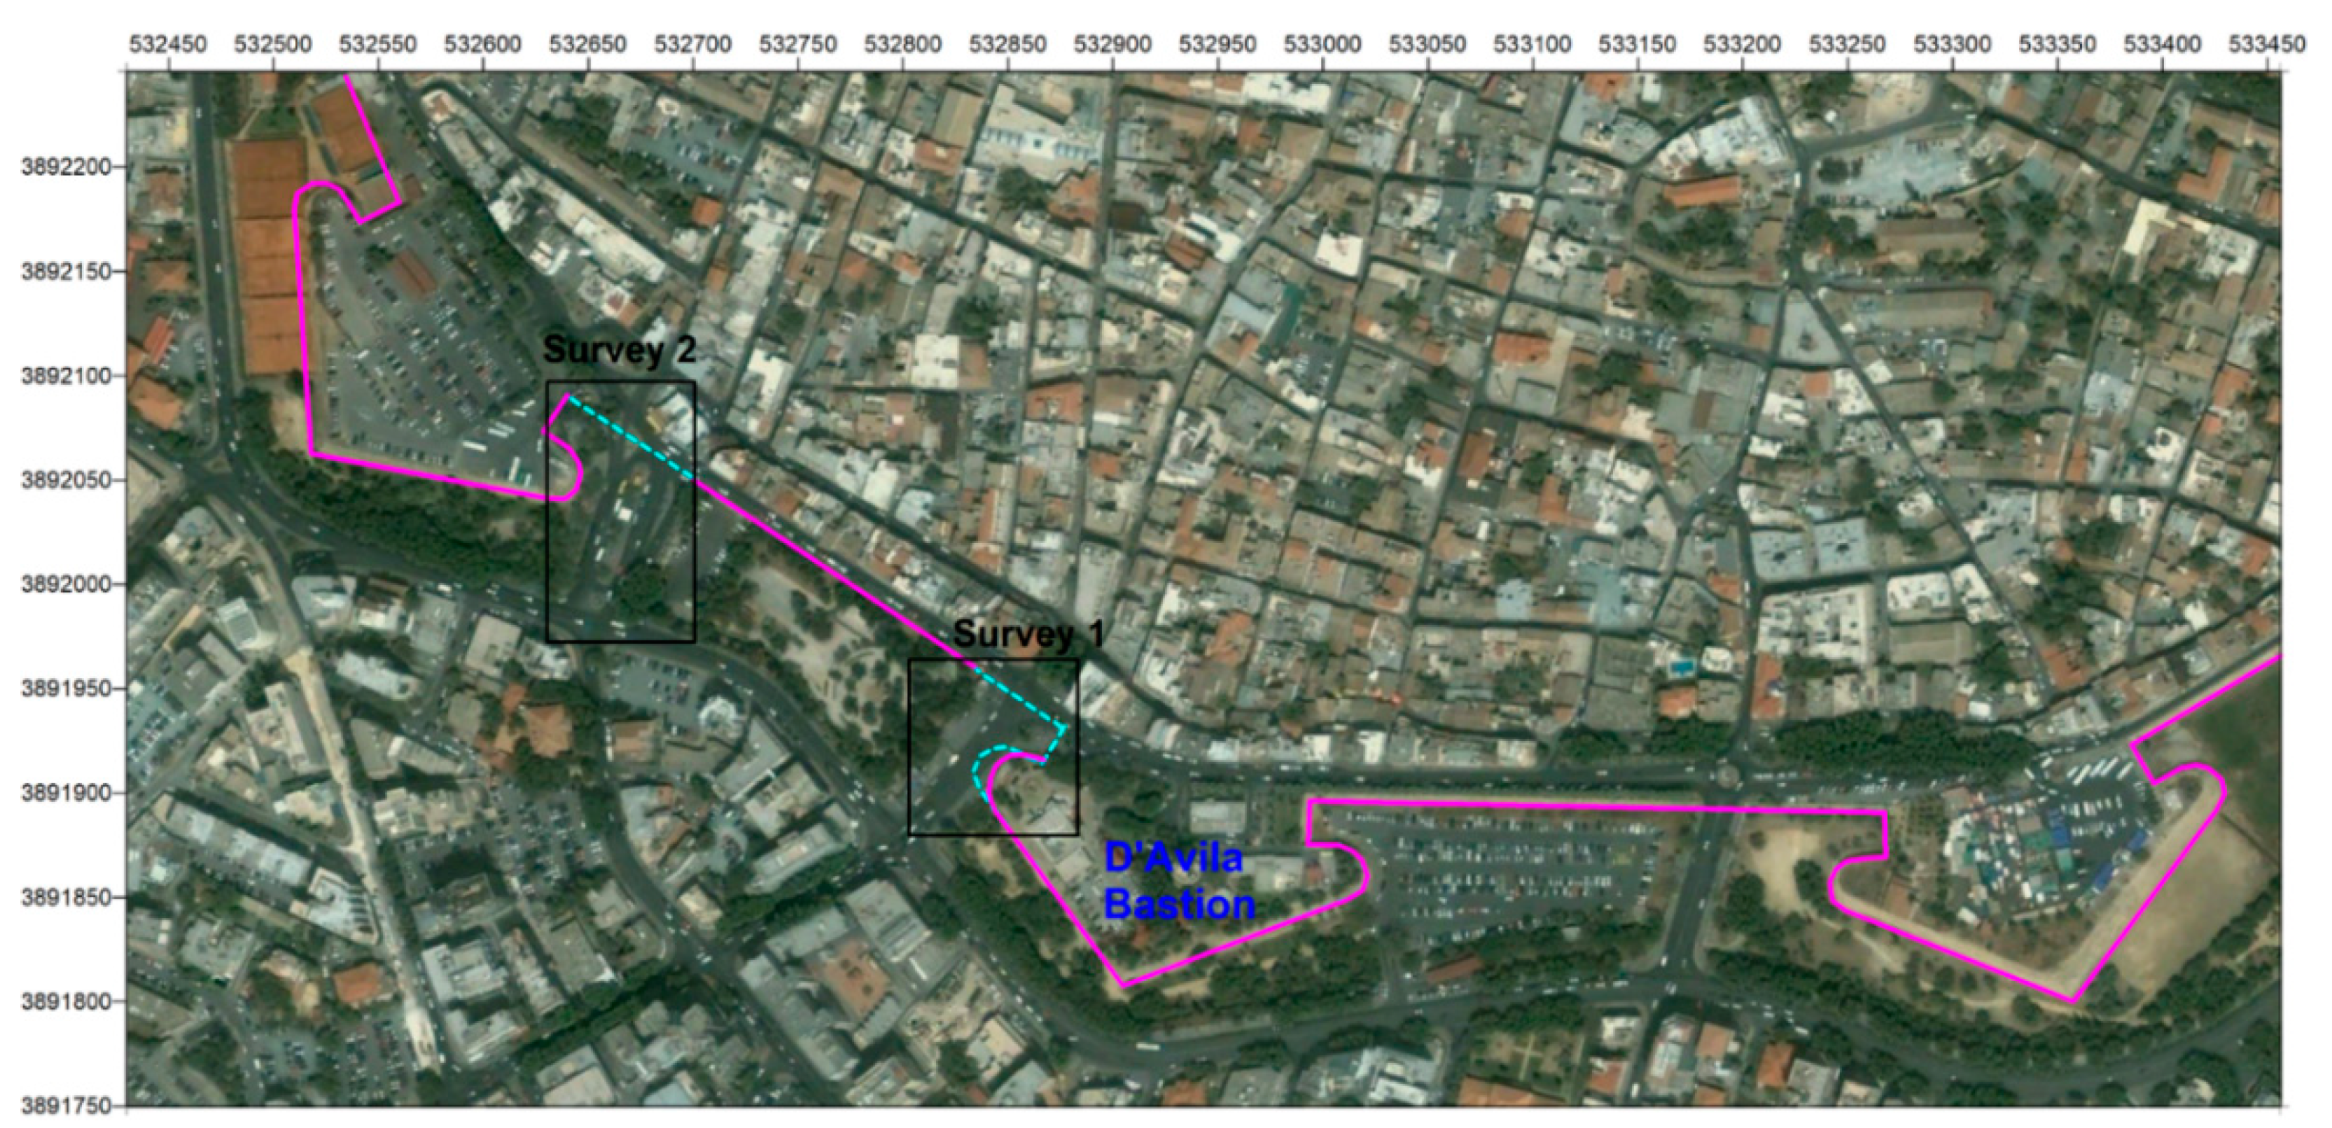
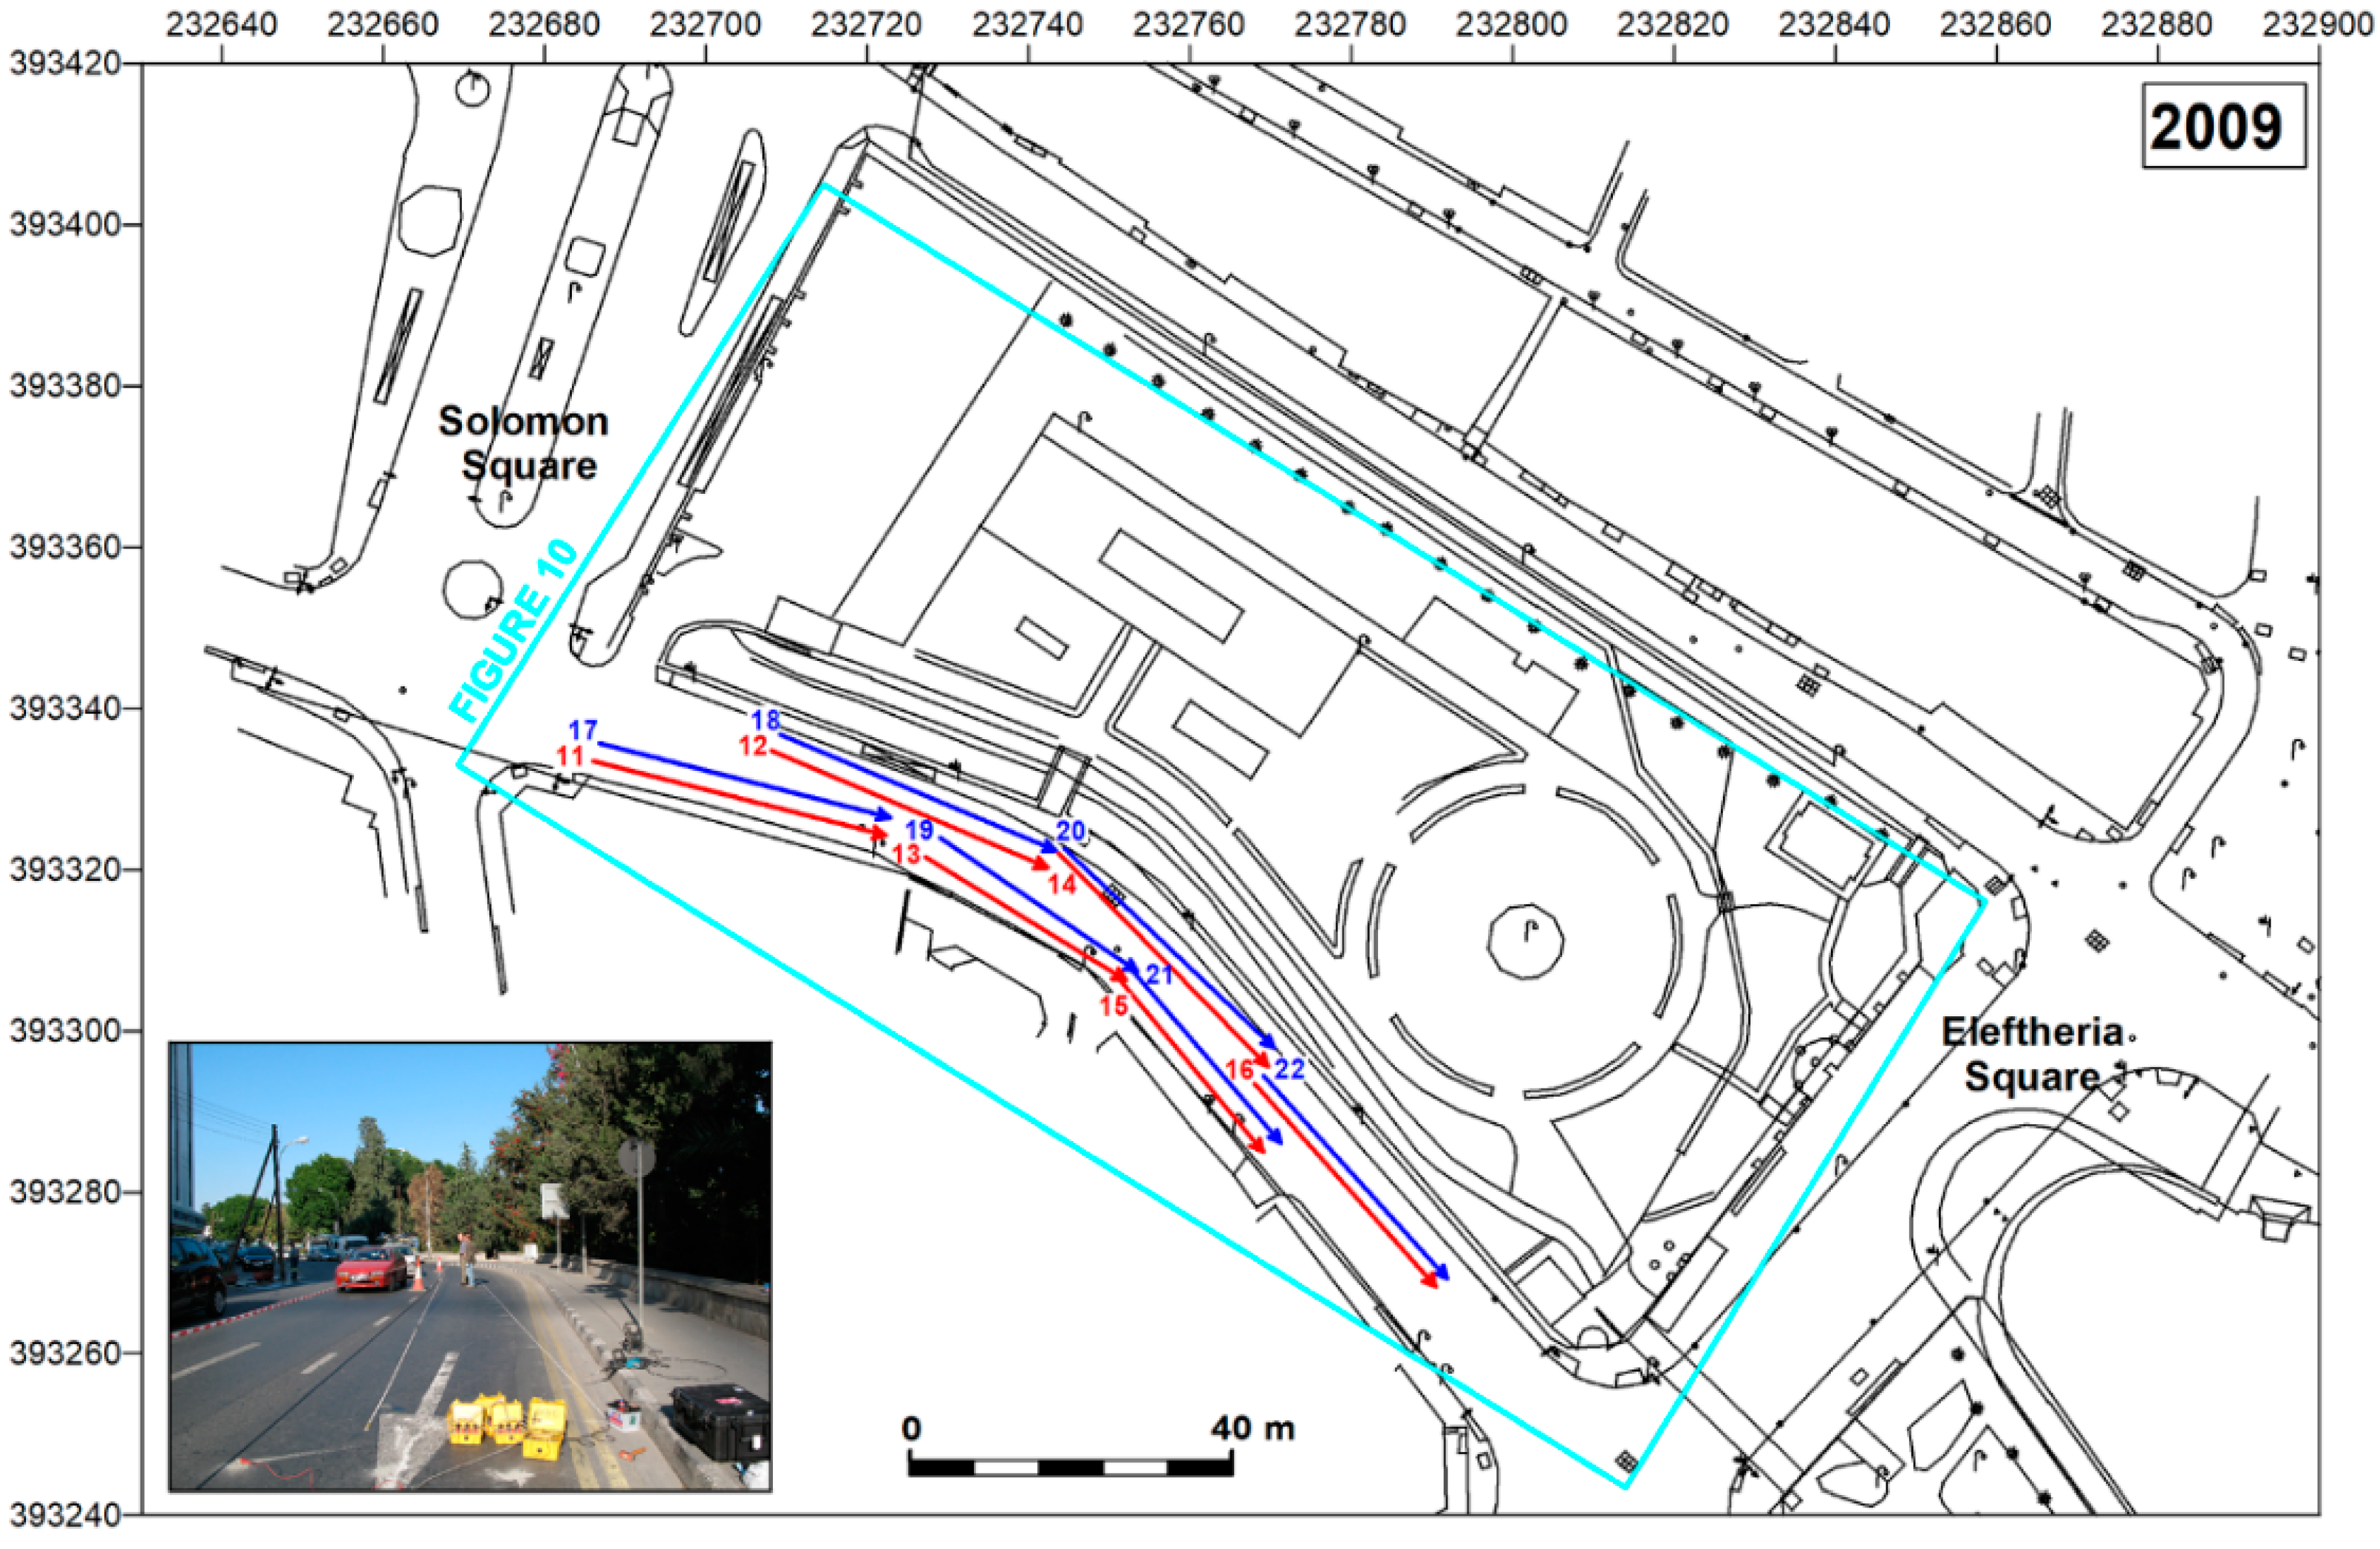
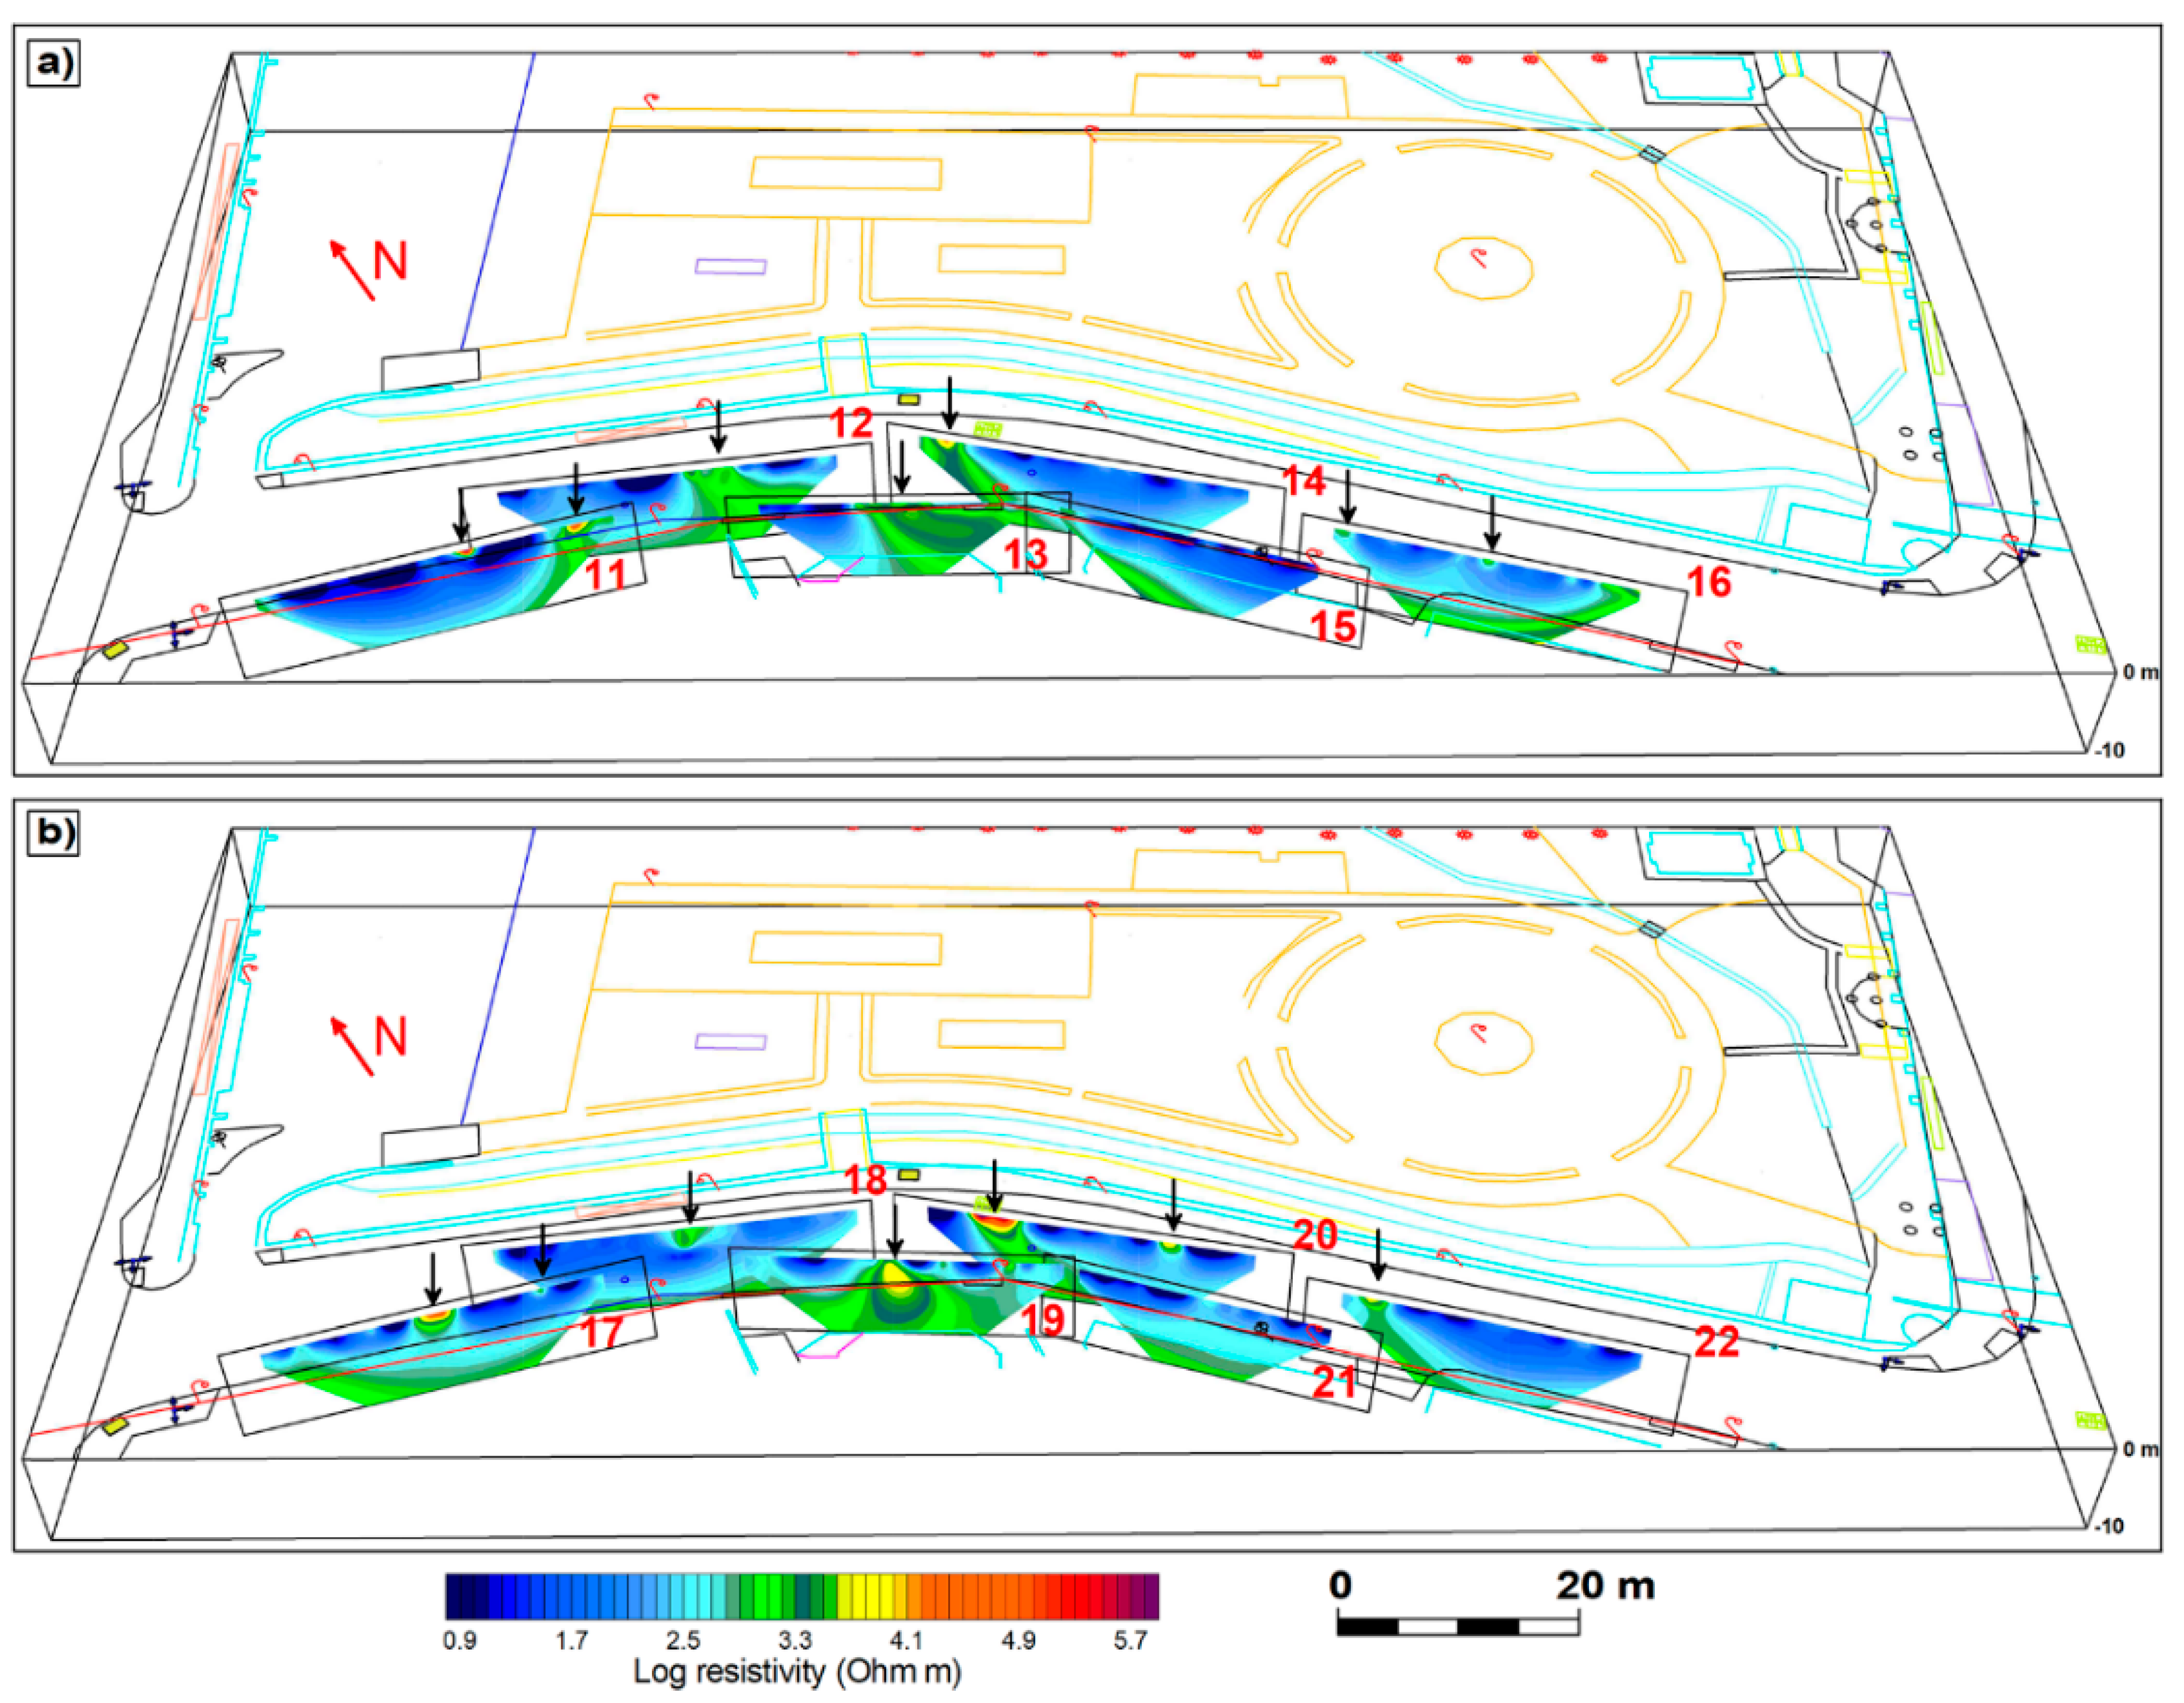
- Delineation of the geological stratigraphy of the soil proving the absence of cavities or archaeological structures in function of the construction of the underground car parking along Amirou Avenue in 2009 (Survey 3 in Figure 2).
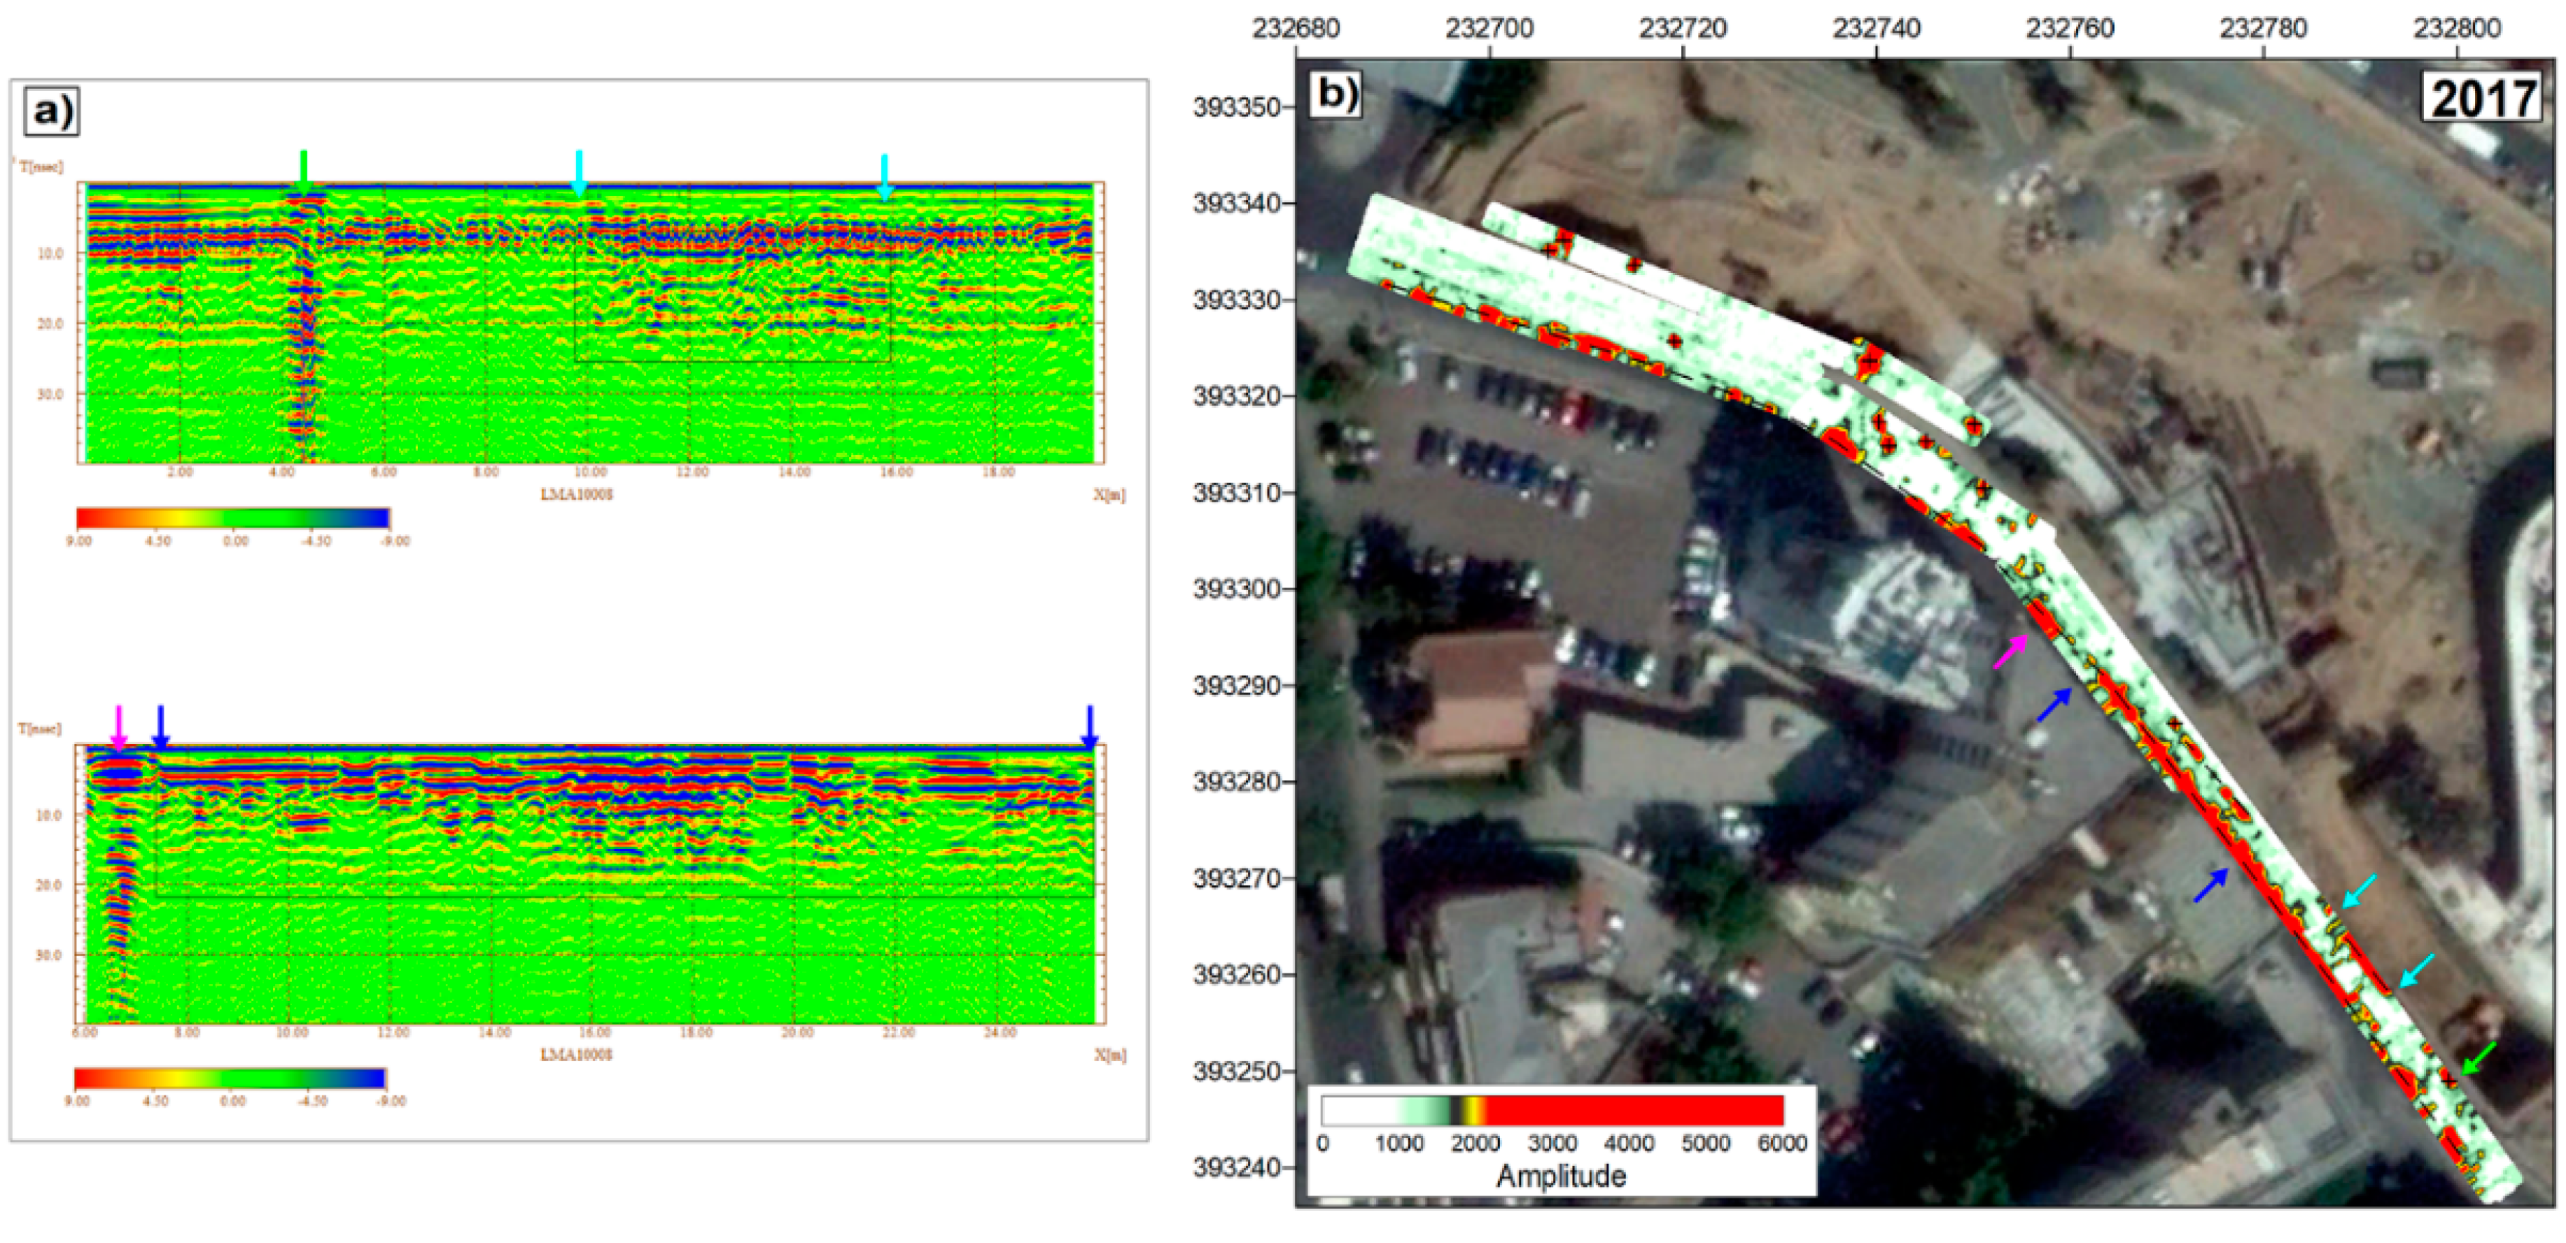
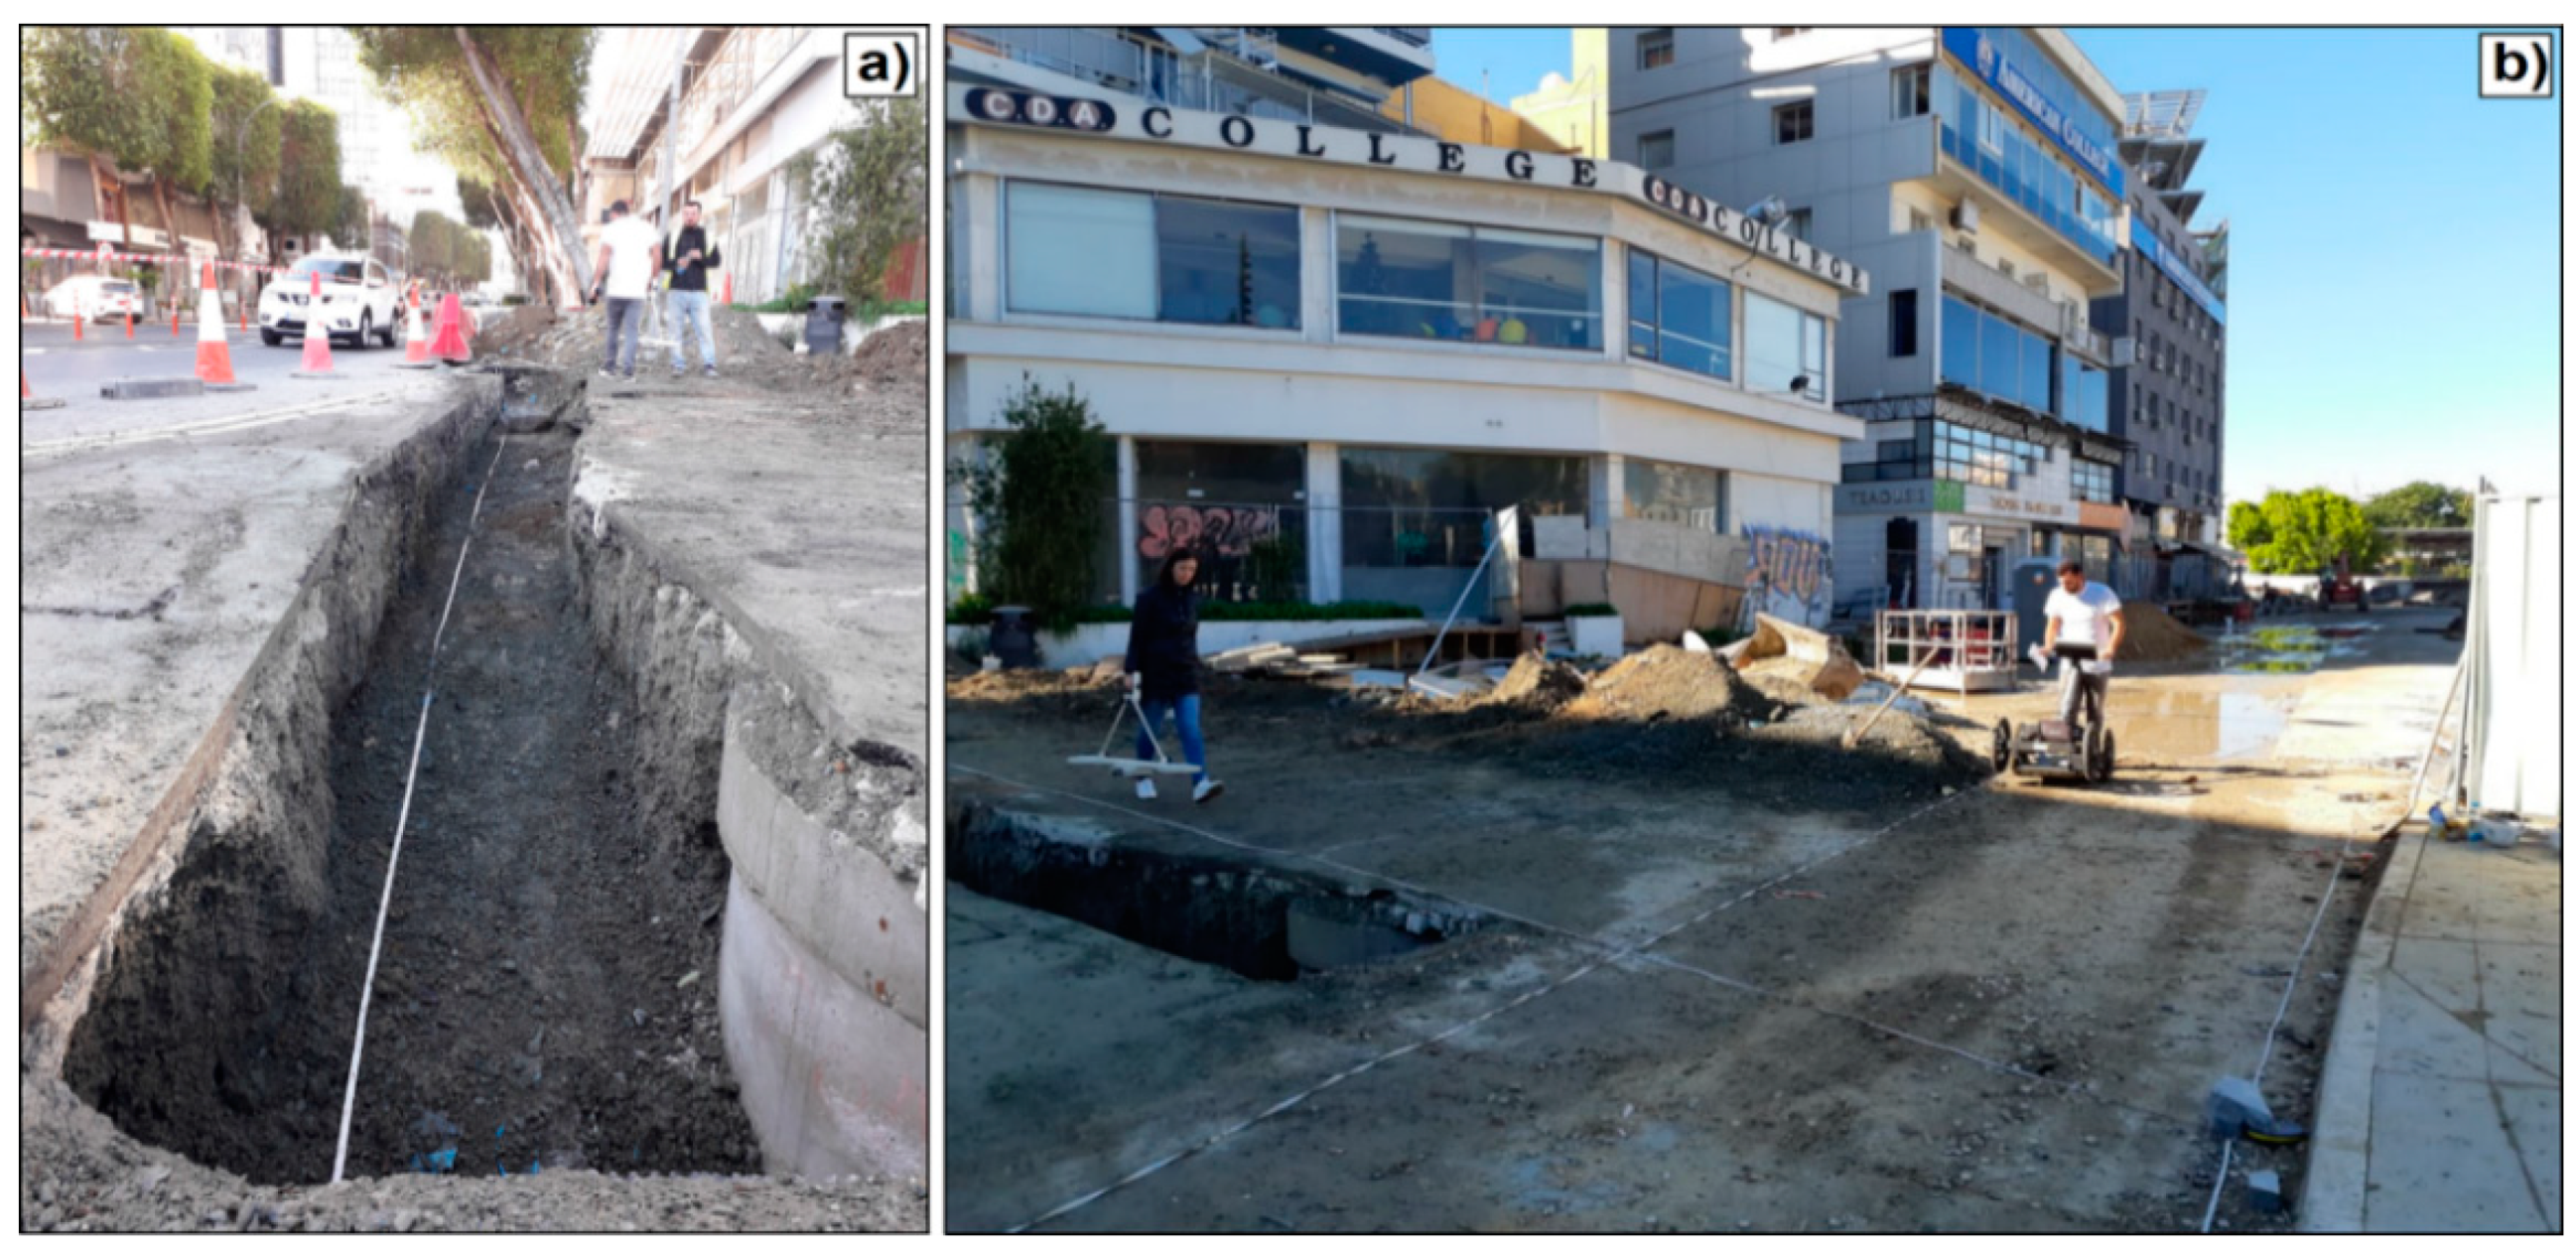
- Detection of underground utilities with the aim to facilitate technicians’ work during excavation and avoid unexpected damages to city supplies along Amirou Avenue in 2017 (Survey 4 in Figure 2).
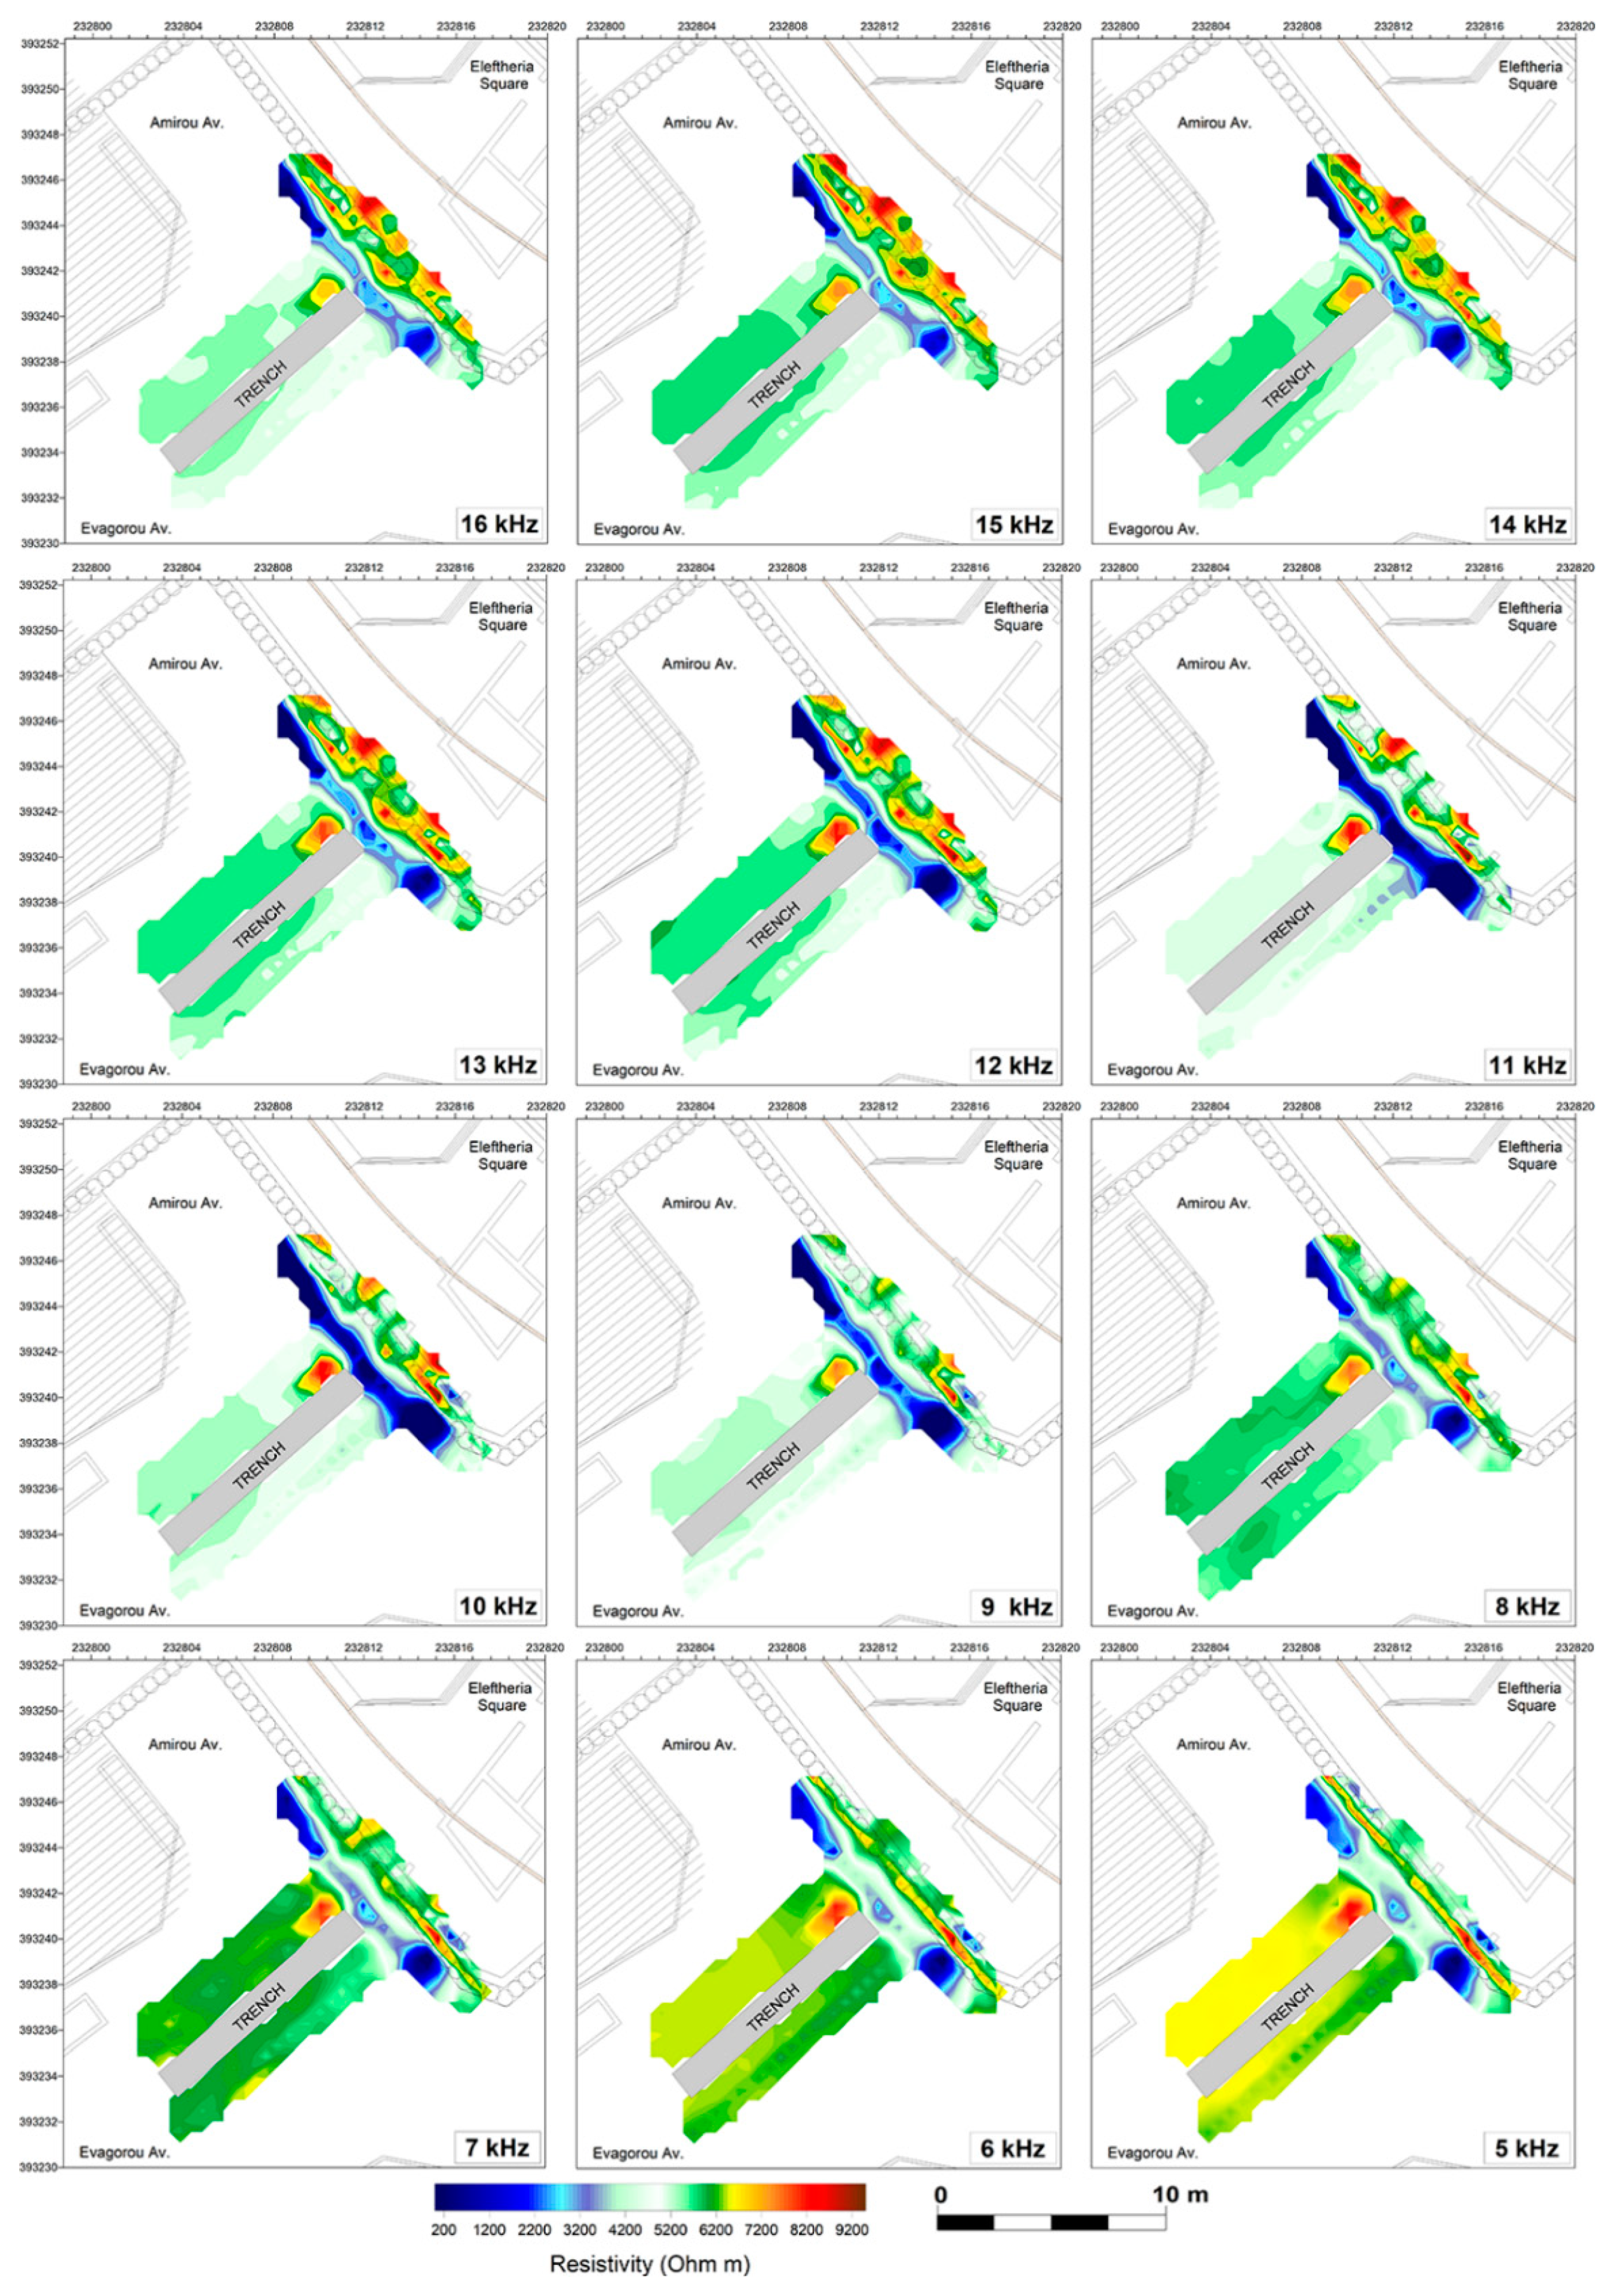
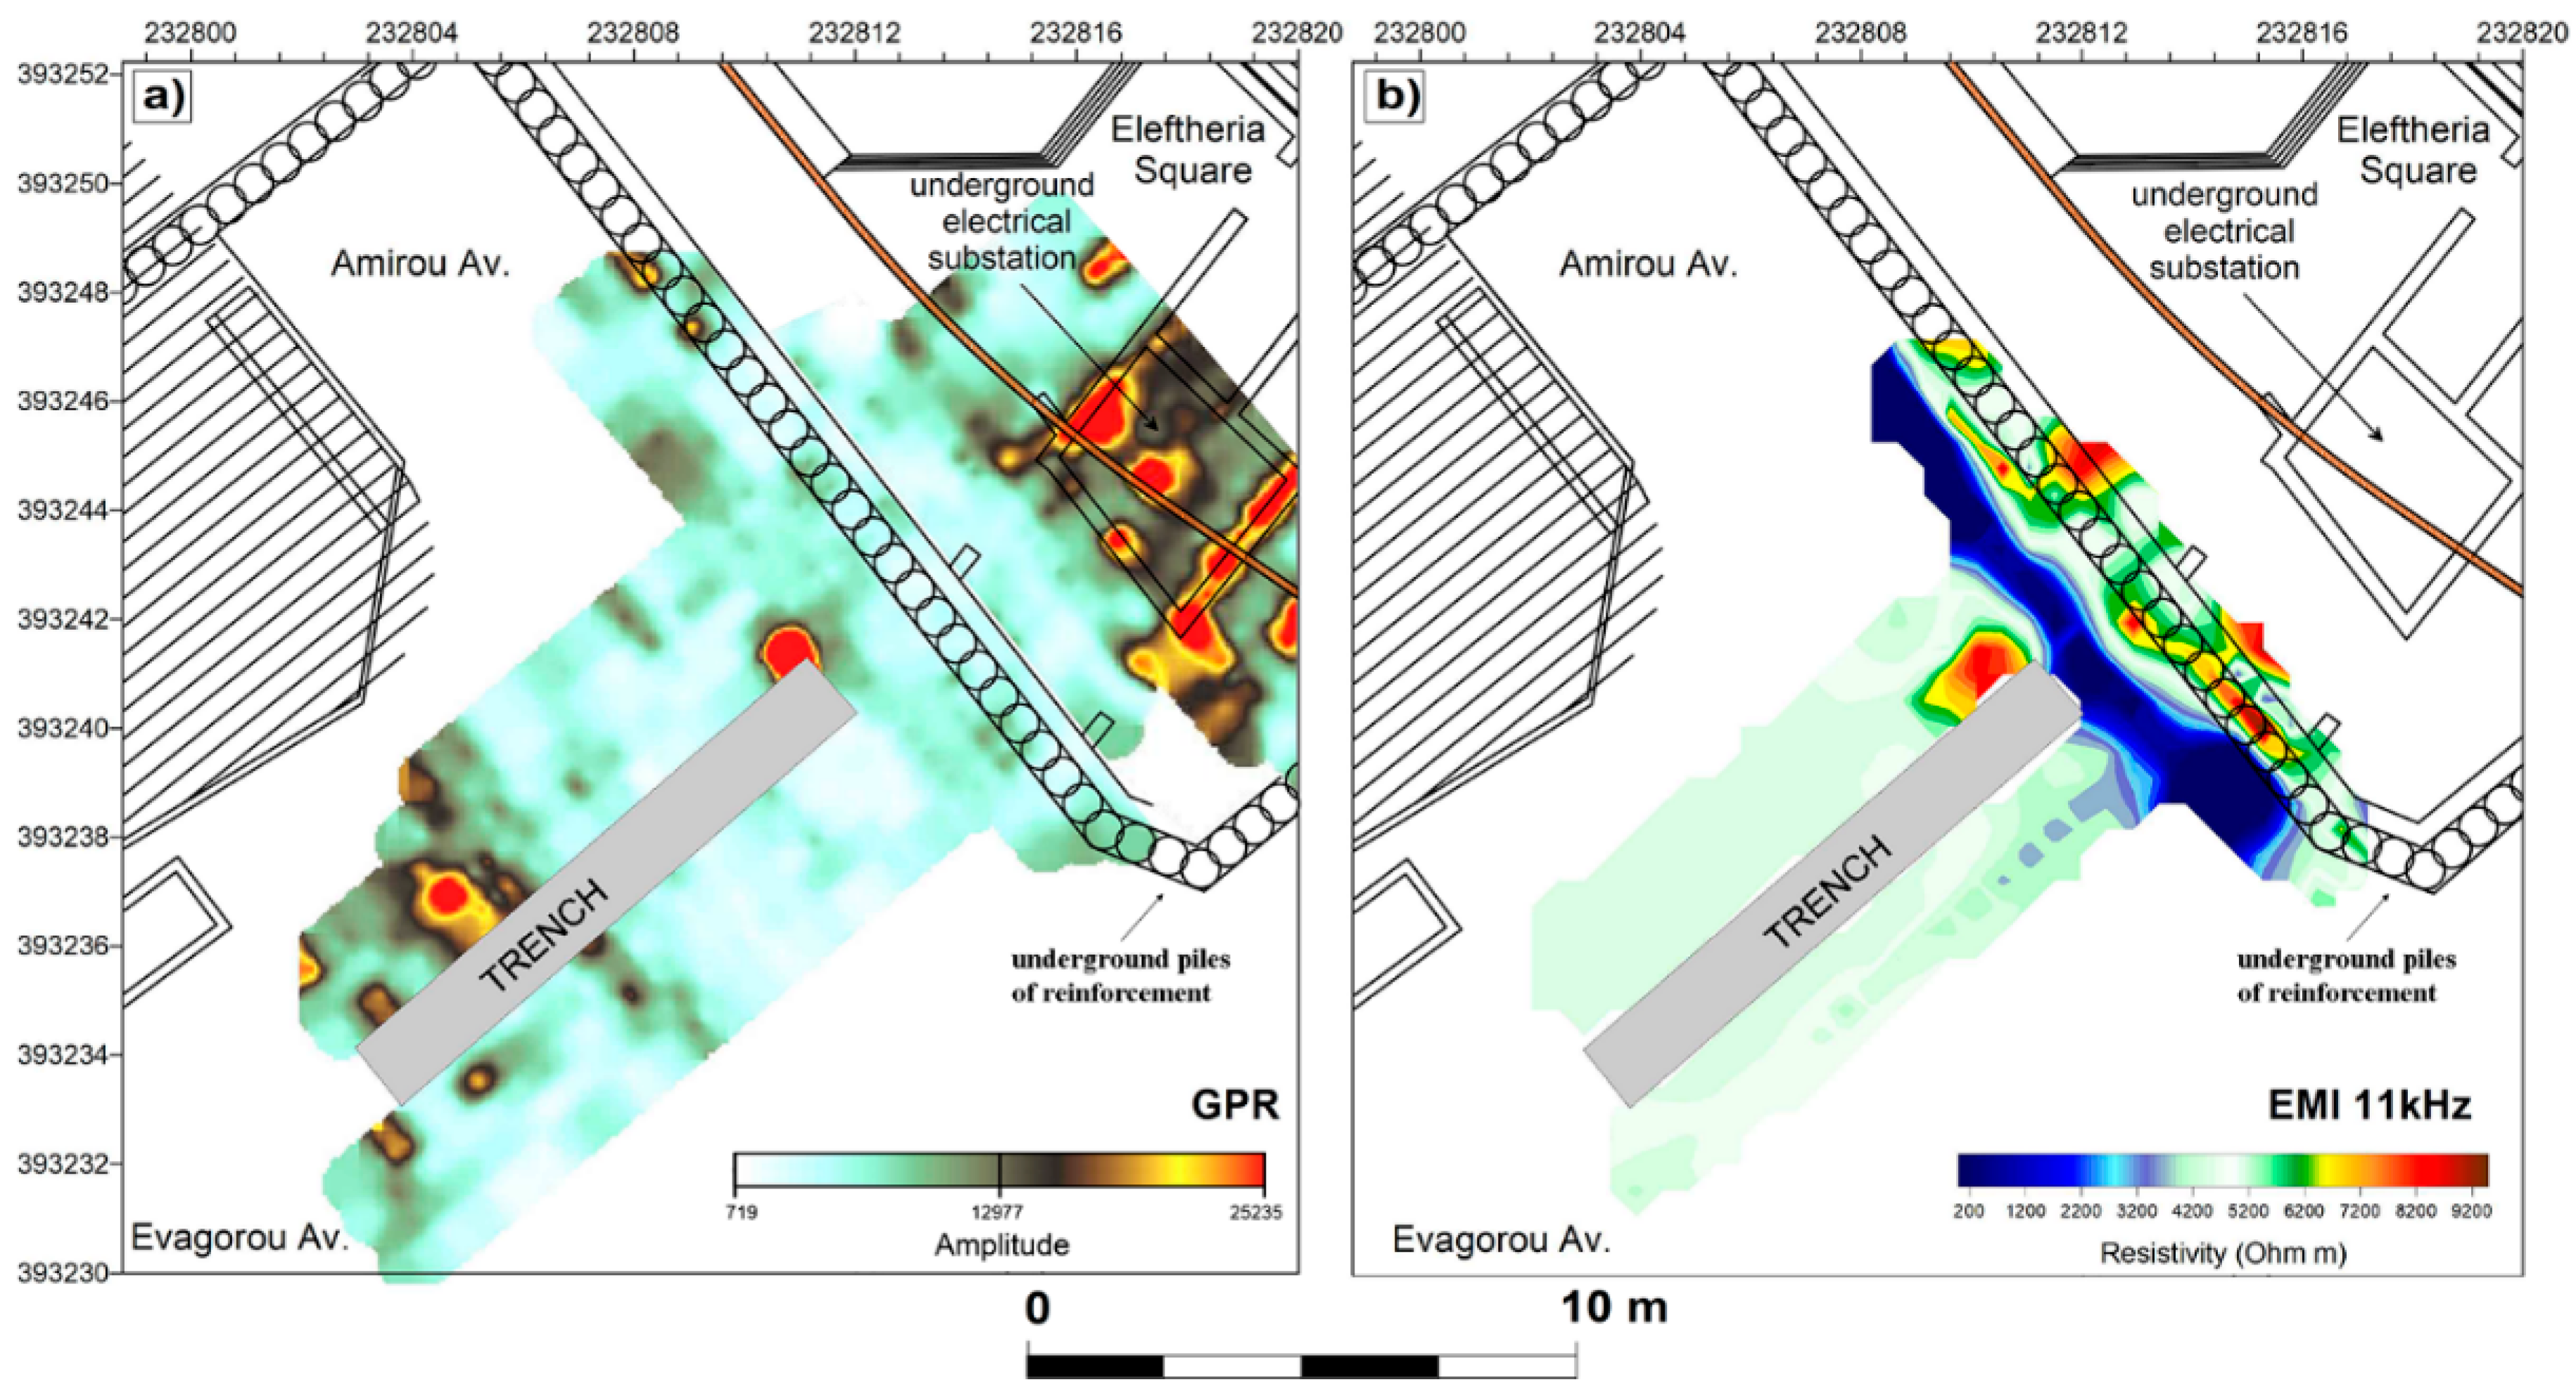
- Comprehension of the reason for an abundant flow of water that occurred inside the new underground electrical substation positioned under the new Eleftheria Square during excavations at the intersection of Evagorou Avenue and Omirou Avenue in 2009 (Survey 5 in Figure 2). The most reliable hypothesis of the cause of this phenomenon was thought to be the failure of water pipes south of Evagorou Avenue.
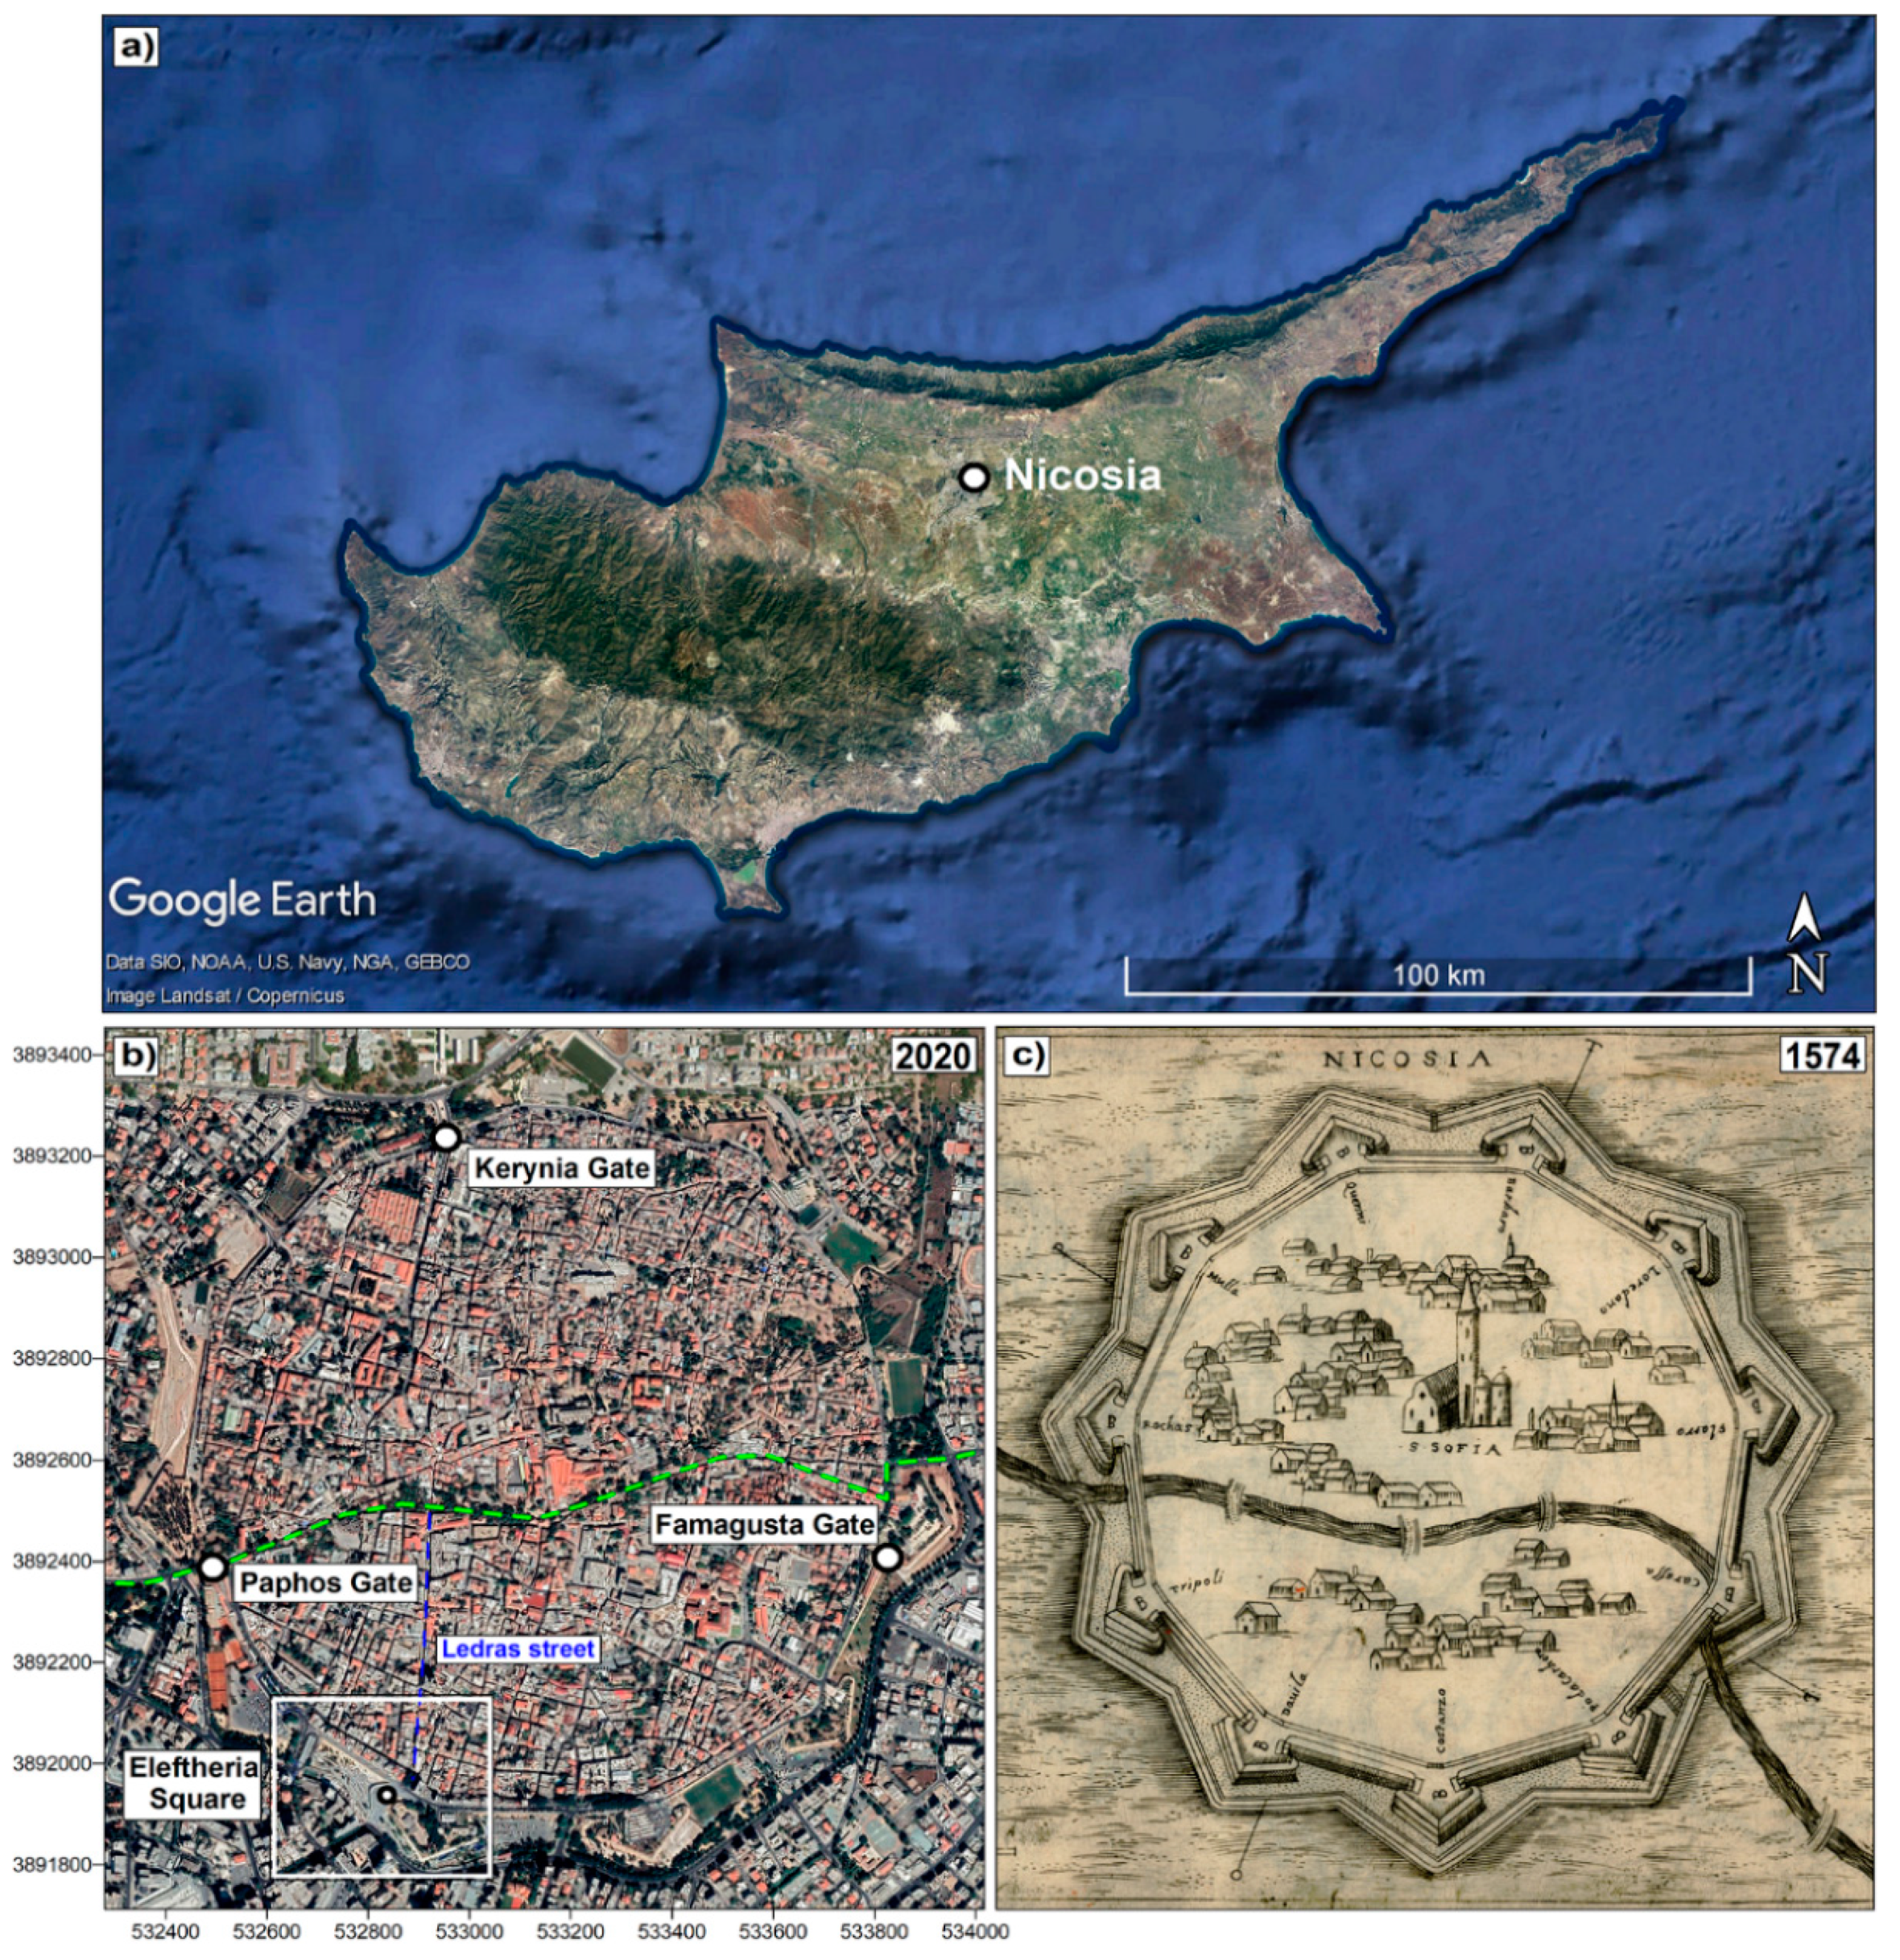
2. Case Study
- Social rehabilitation of old residential quarters, community development and population increase;
- Economic revitalization and increase of employment activities;
- Restoration of monuments and buildings, preserving culture heritage and increasing the potential tourism attraction;
- Overall urban planning for a harmonic and balanced development of different sectors of the historic center.
3. Methodological Approach, Data Acquisition and Processing
- Analysis of the needs of the investigation in collaboration with the technicians involved in the project, taking into consideration the typology of searched targets (archaeological remains, underground utilities, geological layers, cavities, water), their supposed depth (from centimeters to tens of meters), their constitutive material (stones, landfills, metal, plastic, fluids), their physical properties (density, conductivity, susceptibility) and their geometry (punctual targets, stretched objects, layers).
- Evaluation of the geological stratigraphy of the area. It is composed by anthropogenic soils and fluvial deposits of different thickness overlying deep marl and sandy marl of the Nicosia Formation [56].
- Evaluation of the environmental noise of the study area considering the presence of metals, buried iron grids, anthropic buried artifacts and the occurrence of recent mechanical interventions.
- Analysis of the typology of surfaces on which to operate (asphalt, concrete, paved areas, land) and the spaces available to work in.
- Consideration of the differences in the operating principles and the applicability of the various geophysical survey techniques, taking into account the previous points.
- Choice of the proper method that is suitable for solving the goal of the research. ERT, EMI and GPR were preferred over other methods. ERT, although having slower acquisition times and a small invasiveness due to the insertion of electrodes in the surfaces, was applied during surveys 1, 2 and 3 in order to obtain a good compromise between depth of investigation and resolution of results, features not achievable with EMI, GPR, seismic, magnetic and gravity methods. In addition, the presence of metals, energy lines and buried grids under paved surfaces during surveys 1 and 2 excluded the use of the expeditious technique such as the magnetic method and the GPR that have an extreme sensitivity to these environmental noises. GPR was used during survey 4 and 5 with the aim to produce high-resolution maps of shallow targets such as buried pipelines. Other methods, in this urban context, would not have led to a proper representation of them. EMI prospections were applied during survey 5 as they are very suitable for the identification of high conductivity bodies in a fast way as required by the research question.
- Choice of the geophysical instruments to use during data acquisition. ERT was carried out using a multi-electrode resistivity meter, the A3000E (M.A.E. s.r.l., Frosolone, Italy). GPR was implemented through an IDS Georadar (IDS GeoRadar s.r.l., Pisa, Italy), equipped with a multi-frequency TRMF antenna (200–600 MHz), and a MALA X3M Ramac Georadar (Guideline Geo AB, Skolgatan, Sweden), equipped with a shielded 500 MHz antenna frequency. EMI prospections were conducted utilizing the GSSI Profiler EMP-400 [57].
- Definition of the parameters of acquisition taking into consideration the required depth of investigation and the resolution required by the research question. For ERT, profiles had different lengths, taking into account the available spaces in the different survey areas and the electrode spacing was in any case set to 1.2 m. Regarding archaeological prospections, the selected electrode spacing has been considered proper to reach supposed large deep walls. A dipole-dipole (DD) configuration was used. For GPR investigation in both cases, all radar reflections were recorded digitally in the field as 16-bit data, 512 (for IDS) and 628 (for MALA) samples per radar scan at 25 scan s−1 for IDS (1 scan approximately corresponds to 0.025 m) and 24 scan s-1 for MALA (1 scan approximately corresponds to 0.024 m). Half meter equally spaced GPR profiles were acquired in grids adapted to the available areas. EMI measurements were collected in stationary (point-to-point) mode using frequencies in the range 5–16 kHz with vertically oriented dipoles. The investigation area was covered by profiles spaced 0.5 m inserted in a regular grid.
- Choice of the techniques of data processing for the selected methodologies:
- -
- For ERT, the measured apparent resistivity datasets were processed in order to remove dragging effects that are typical of DD array and model the survey targets converting the values in real electrical resistivity values displayed as a function of depth below surface. To this end, a probability tomography approach has been applied for imaging the sources of anomalies into the analyzed grounds. The theory was first stated for the self-potential method [58], and then adapted to the resistivity method [59,60,61]. The primary approach, even if capable of distinguishing resistivity highs and lows in the field datasets considering a reference background resistivity, precluded the estimate of the intrinsic resistivities of the source bodies. The method was successfully used to delineate the geometry of the self-potential sources in the central volcanic area of Vesuvius (Naples, Italy) [62], to imaging through the resistivity method buried archaeological structures in the archeological site of Pompei (Naples, Italy) [63], at the Castle of Zena (Carpeneto Piacentino, Italy) [64], the prehistoric sites of Checua (Cundinamarca, Colombia) [65] and Grotta Reali (Rocchetta a Volturno, Italy) [66], the Archaeological Park of Aeclanum [67] and for fault detection in a site on the Matese Mountain (Italy) [3]. Successively, a data-adaptive probability-based ERT inversion (PERTI) method [51] was directly derived from the principles of the probability tomography in order to estimate the true resistivities. From a probabilistic point of view, the algorithm, being a non-linear approach, identifies, inside the set of possible solutions the most probable one, compatibly with the dataset acquisition scheme. The main features of the PERTI method, as reported in [51] are: (i) unnecessity of a priori information; (ii) full, unconstrained adaptability to any kind of dataset, including the case of non-flat topography; (iii) drastic reduction of computing time of even two orders of magnitude, with respect to the previous methods in complex 3D cases using the same computer; (iv) real-time inversion directly in the field, thus allowing for fast modifications of the survey plan to better focus the expected targets; (v) full independence from data acquisition techniques and spatial regularity, (vi) possibility to be used as an optimum starting model in standard iterative inversion processes in order to speed up convergence. As the PERTI method does not require a priori information and iterative processes, the computation of the route mean square (RMS) error between measured and modelled apparent resistivity values is useless. In fact, the resulting RMS error, whatever it is, can be lowered within the PERTI scheme. Many applications of the PERTI approach in near surface prospections are available in literature for solving archaeological research questions [49,68,69,70,71], for defining faults in Crete [72] and for imaging of the near-surface structure of the Solfatara crater, Campi Flegrei (Naples, Italy) [73]. In [49,51,68,72] the PERTI routine was tested using well-known commercial software of inversion of geoelectrical data and the comparison put in evidence for the coherence between the obtained results and the better filter capacity and great versatility of the PERTI algorithm. Here, for the first time, the method is applied to process field datasets acquired in urban environments, as its main features fit perfectly with the needs of the case study presented.
- -
- For GPR, as the interpretation of each section can lead to underestimation or overestimation of the reflected signals and makes it not easy to identify the effect of lateral bodies present in the subsoil, all sections were processed together using standard methodological approaches in order to obtain 2D horizontal maps at a different range of depth (GPR-SLICE 7.0 software) [74]. Data were converted by subtracting out the dc-drift (wobble) in the data, and at the same time adding a gain with time of 20. A time-zero correction was determined to designate the starting point of the wave and the center frequency of the antenna was matched. Then the bandpass filter and the background removal were respectively applied to reduce noise from oscillating components that had a regular frequency cycle in the frequency domain and to remove striation noises that occurred at the same time. Processed radargrams were subsequently corrected with an automatic gain function applied to each trace based on the difference between the mean amplitude of the signal in the time window and the maximum amplitude of the trace. Thus, horizontal sections (time slices) were processed considering the whole dataset. Data were gridded using the inverse distance algorithm, which includes a search of all data within a fixed radius of 0.75 m of the desired point to be interpolated on the grid and a smoothing factor of two. Grid cell size was set to 0.01 m to produce high resolution images.
- -
- For EMI, during data elaboration the measured values of conductivity were transformed in values of resistivity and visualized in 2D maps through a contouring software.
4. Results
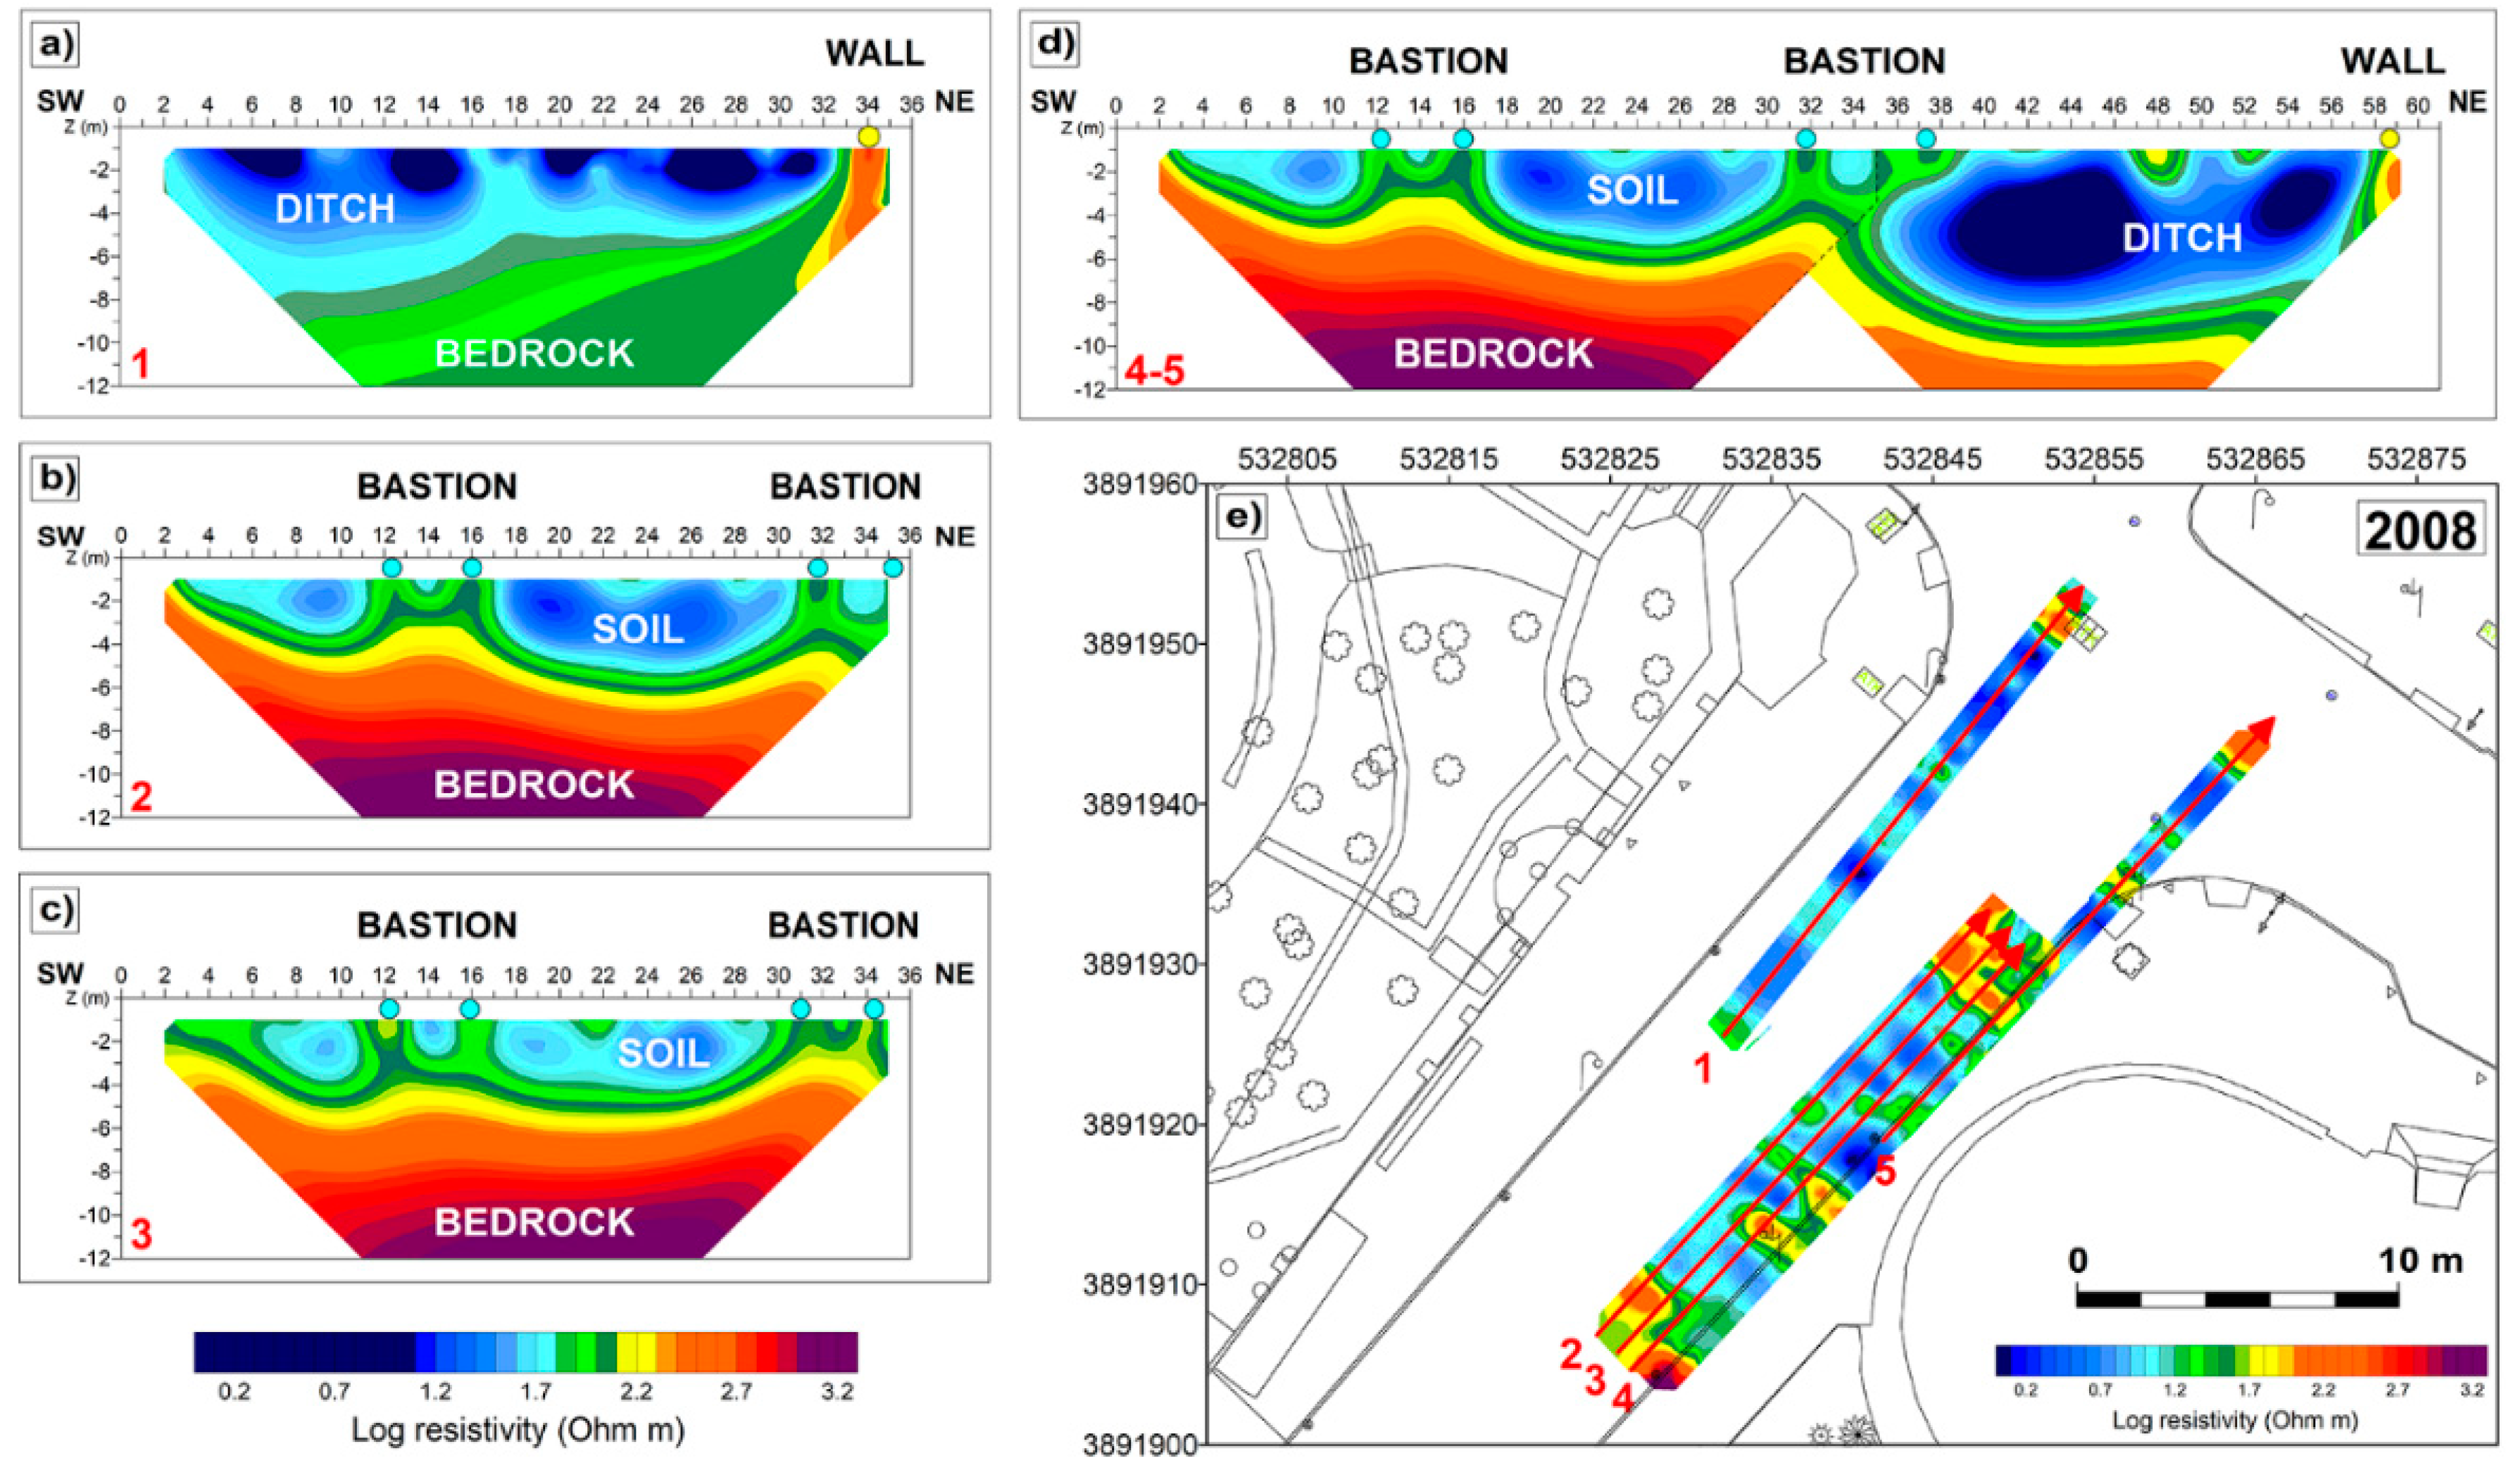
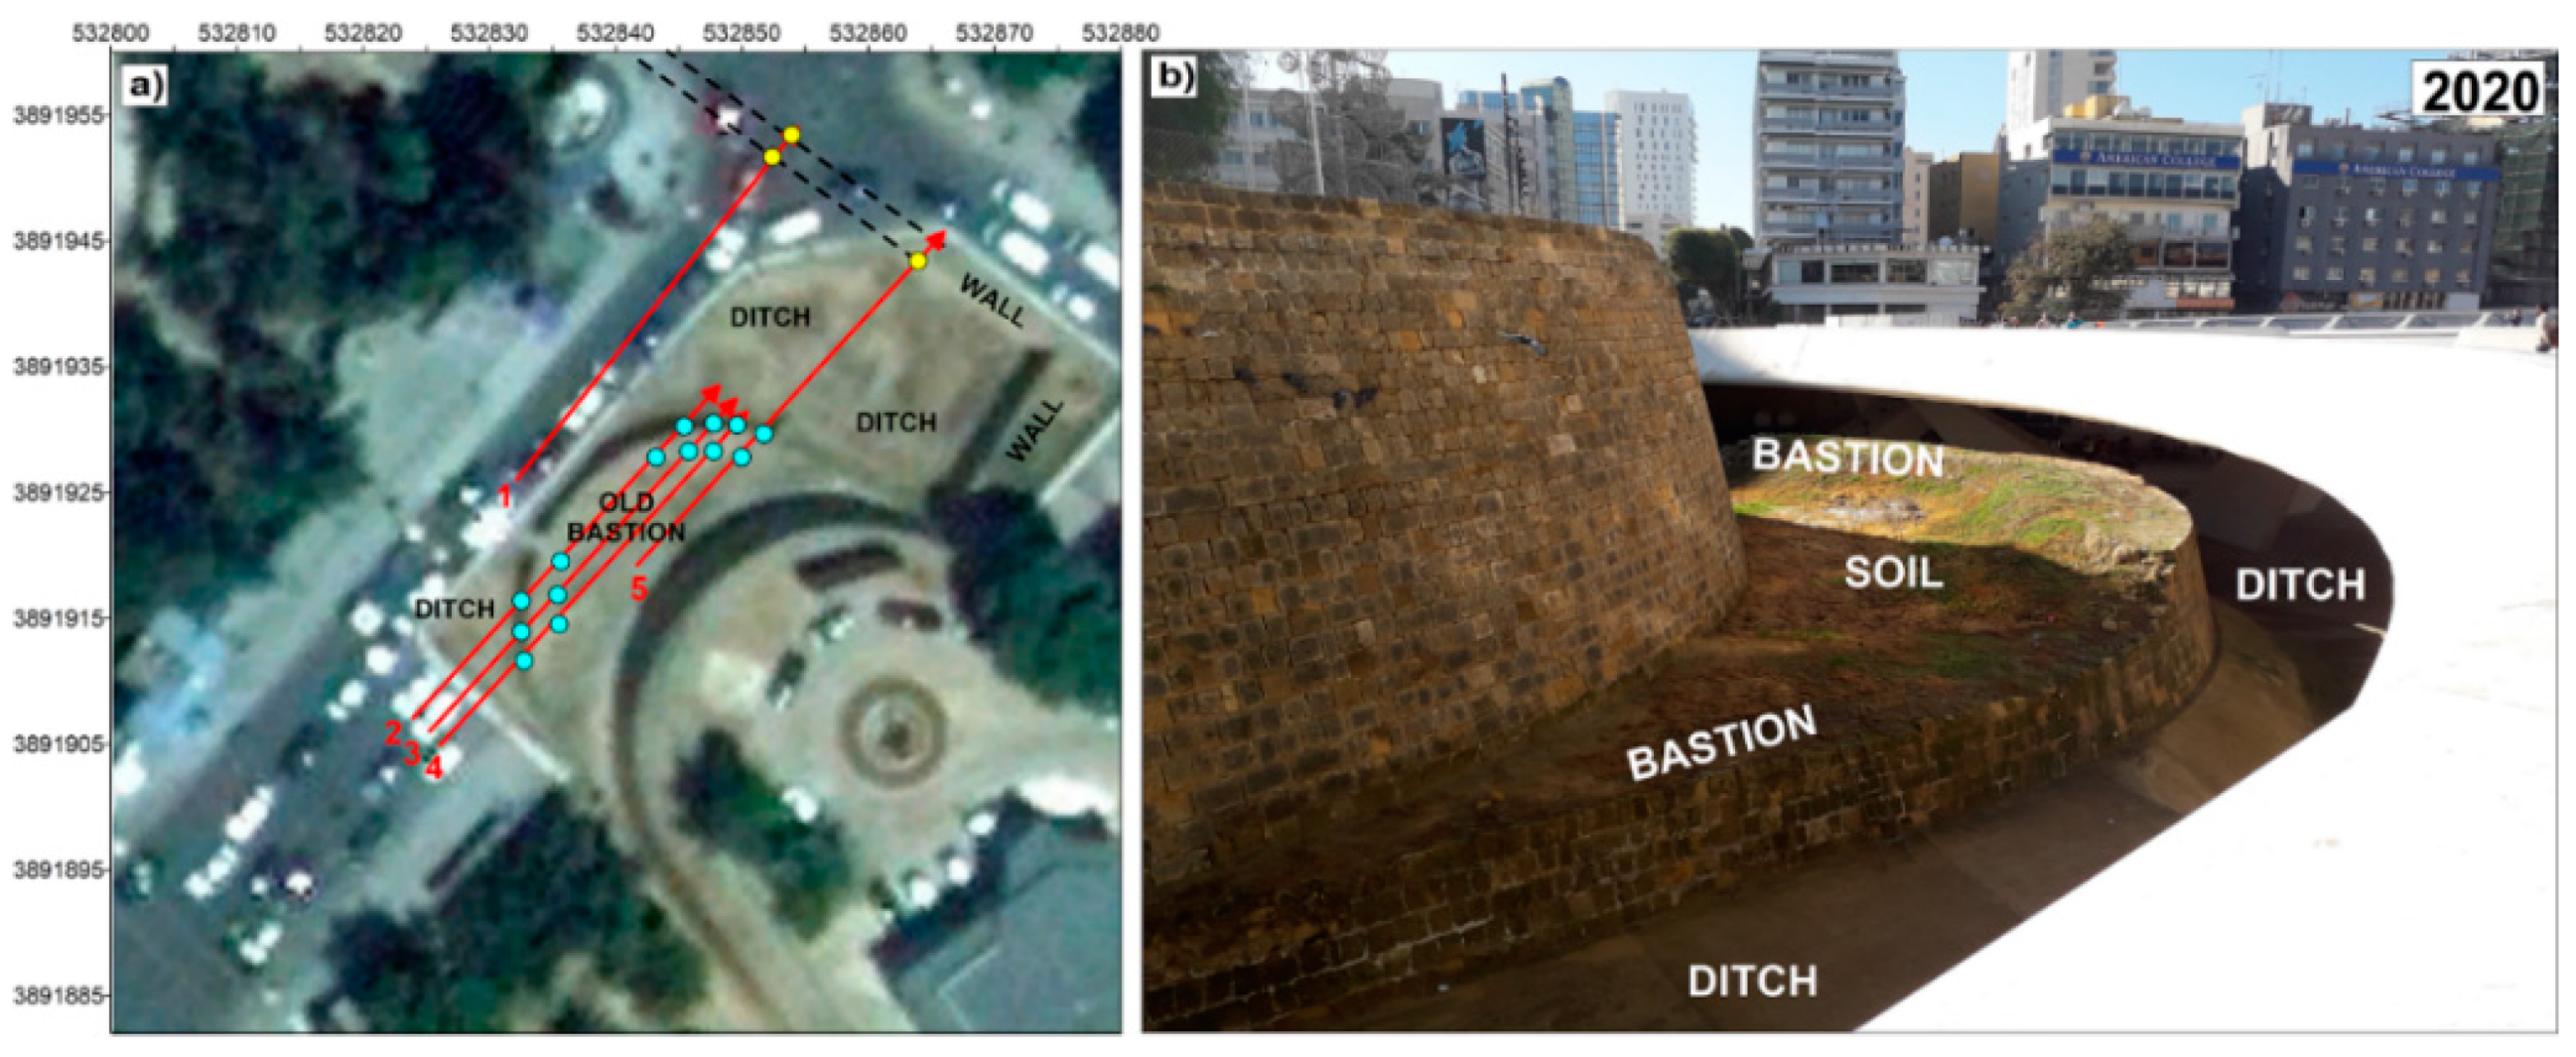
4.1. Survey 1
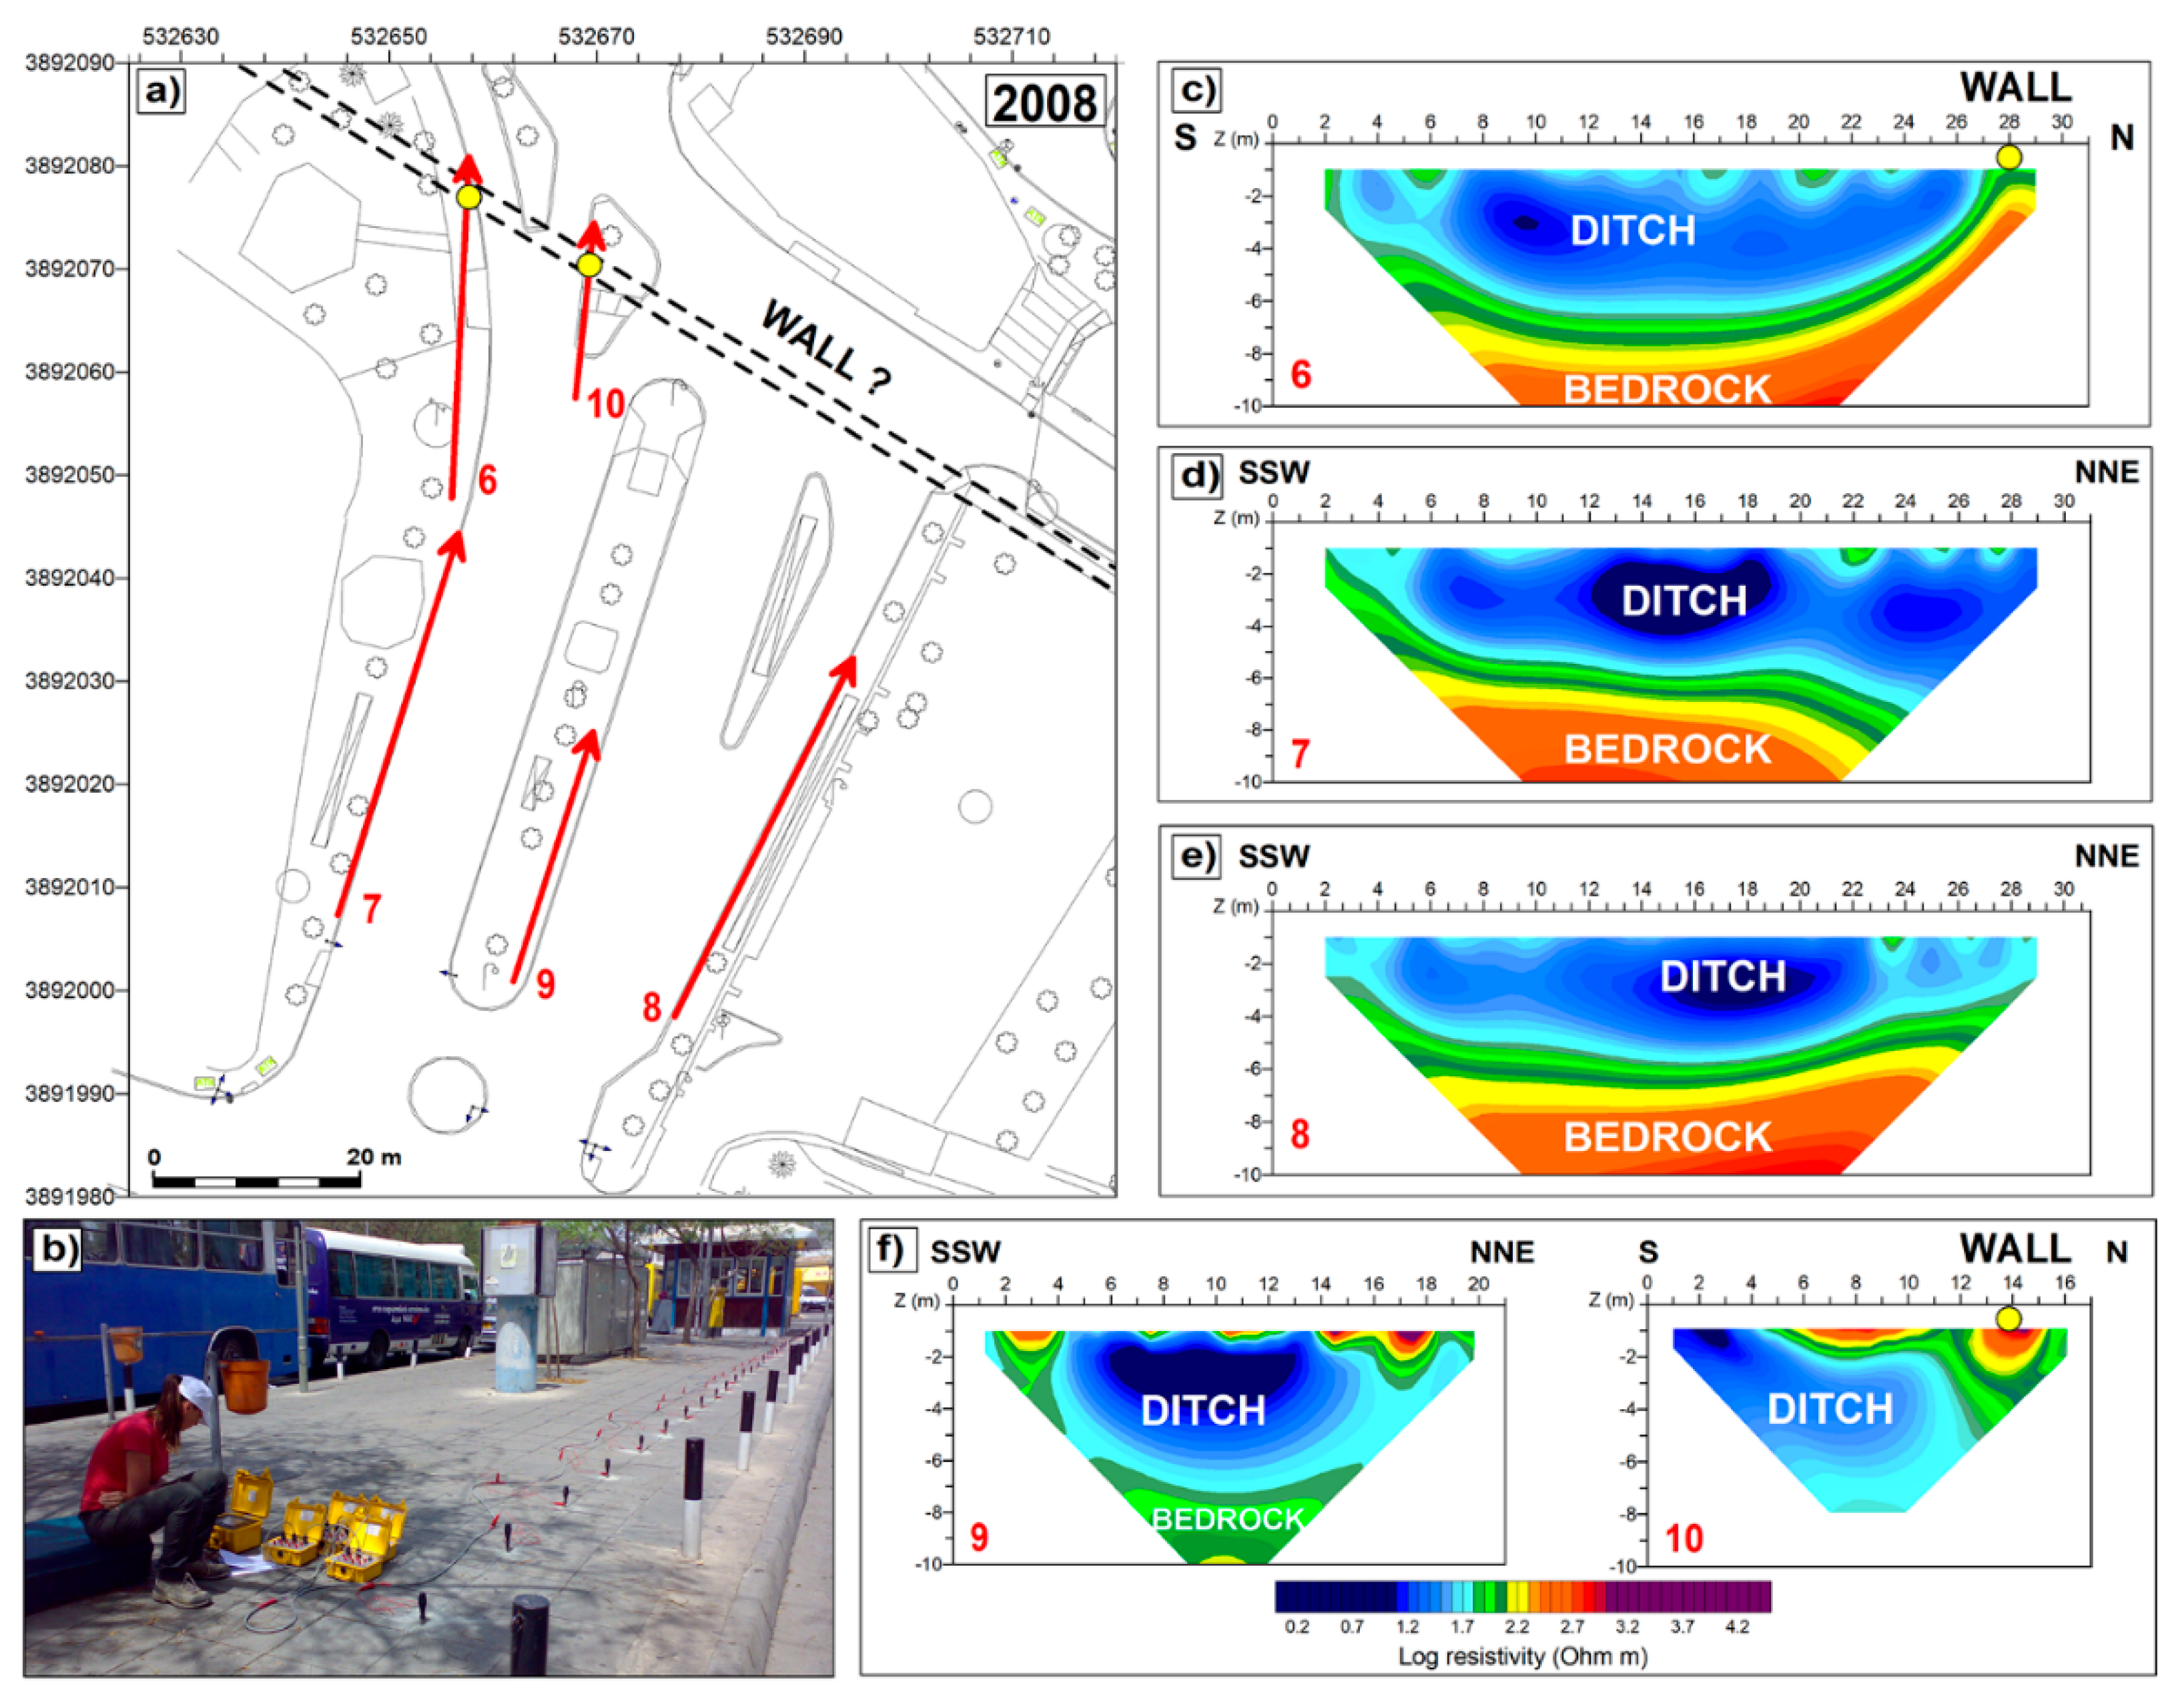
4.2. Survey 2
4.3. Surveys 3–4
4.4. Survey 5
5. Conclusions
Author Contributions
Funding
Acknowledgments
Conflicts of Interest
References
- Nguyen, F.; Garambois, S.; Chardon, D.; Hermitte, D.; Bellier, O.; Jongmans, D. Subsurface electrical imaging of anisotropic formations affected by a slow active reverse fault, Provence, France. J. Appl. Geophys. 2007, 62, 338–353. [Google Scholar] [CrossRef]
- Moisidi, M.; Vallianatos, F.; Soupios, P.; Kershaw, S. Spatial spectral variations of microtremors and electrical resistivity tomography surveys for fault determination in southwestern Crete, Greece. J. Geophys. Eng. 2012, 9, 261–270. [Google Scholar] [CrossRef]
- Valente, E.; Ascione, A.; Ciotoli, G.; Cozzolino, M.; Porfido, S.; Sciarra, A. Do moderate magnitude earthquakes generate seismically induced ground effects? The case study of the Mw = 5.16, 29th December 2013 Matese earthquake (southern Apennines, Italy). Int. J. Earth Sci. 2013, 107, 517–537. [Google Scholar] [CrossRef]
- Bichler, A.; Bobrowsky, P.; Best, M.; Douma, M.; Hunter, J.; Calvert, T.; Burns, R. Three-dimensional mapping of a landslide using a multi-geophysical approach: The Quesnel Forks landslide. Landslides 2004, 1, 29–40. [Google Scholar] [CrossRef]
- Jäger, D.; Sandmeier, C.; Schwindt, D.; Terhorst, B. Geomorphological and geophysical analyses in a landslide area near Ebermannstadt, Northern Bavaria. E G Quat. Sci. J. 2013, 62, 150–161. [Google Scholar] [CrossRef]
- Grippa, A.; Bianca, M.; Tropeano, M.; Cilumbriello, A.; Mucciarelli, M.; Sabato, L.; Scalo, T. Use of the HVSR method to detect buried paleomorphologies (filled incised-valleys) below a coastal plain: The case of the metaponto plain (Basilicata, Southern Italy). Boll. Geofis. Teor. Appl. 2011, 52, 225–240. [Google Scholar]
- Green, R.T.; Klar, R.V.; Prikryl, J.D. Use of Integrated Geophysics to Characterize Paleo-Fluvial Deposits. In Proceedings of the Site Characterization and Modeling, Geo-Frontiers Congress, Austin, TX, USA, 24–26 January 2015; American Society of Civil Engineers: Reston, VA, USA, 2015; pp. 1–13. [Google Scholar]
- Davis, J.L.; Annan, A.P. Ground-penetrating radar for high-resolution mapping of soil and rock stratigraphy 1. Geophys. Prospect. 1989, 37, 531–551. [Google Scholar] [CrossRef]
- Darwin, R.L.; Ferring, C.R.; Ellwood, B.B. Geoelectric stratigraphy and subsurface evaluation of quaternary stream sediments at the Cooper Basin, NE Texas. Geoarchaeology 1990, 5, 53–79. [Google Scholar] [CrossRef]
- Martel, R.; Castellazzi, P.; Gloaguen, E.; Trépanier, L.; Garfias, J. ERT, GPR, InSAR, and tracer tests to characterize karst aquifer systems under urban areas: The case of Quebec City. Geomorphology 2018, 310, 45–56. [Google Scholar] [CrossRef]
- Zini, L.; Calligaris, C.; Forte, E.; Petronio, L.; Zavagno, E.; Boccali, C.; Cucchi, F. A multidisciplinary approach in sinkhole analysis: The Quinis village case study (NE-Italy). Eng. Geol. 2015, 197, 132–144. [Google Scholar] [CrossRef]
- Kaufmann, G.; Romanov, D.; Tippelt, T.; Vienken, T.; Werban, U.; Dietrich, P.; Mai, F.; Börner, F. Mapping and modelling of collapse sinkholes in soluble rock: The Münsterdorf site, northern Germany. J. Appl. Geophys. 2018, 154, 64–80. [Google Scholar] [CrossRef]
- Titov, K.; Loukhmanov, V.; Potapov, A. Monitoring of water seepage from a reservoir using resistivity and self polarization methods: Case history of the Petergoph fountain water supply system. First Break 2000, 18, 431–435. [Google Scholar] [CrossRef]
- Nabighian, M.N.; Grauch, V.J.S.; Hansen, R.O.; LaFehr, T.R.; Li, Y.; Peirce, J.W.; Phillips, J.D.; Ruder, M.E. The historical development of the magnetic method in exploration. Geophysics 2005, 70, 33ND–61ND. [Google Scholar] [CrossRef]
- Gavazzi, B.; Bertrand, L.; Munschy, M.; de Lépinay, J.M.; Diraison, M.; Géraud, Y. On the Use of Aeromagnetism for Geological Interpretation: 1. Comparison of Scalar and Vector Magnetometers for Aeromagnetic Surveys and an Equivalent Source Interpolator for Combining, Gridding, and Transforming Fixed Altitude and Draping Data Sets. J. Geophys. Res. Solid Earth 2020, 125, 018870. [Google Scholar] [CrossRef]
- Bertrand, L.; Gavazzi, B.; de Lépinay, J.M.; Diraison, M.; Géraud, Y.; Munschy, M. On the Use of Aeromagnetism for Geological Interpretation: 2. A Case Study on Structural and Lithological Features in the Northern Vosges. J. Geophys. Res. Solid Earth 2020, 125, 017688. [Google Scholar] [CrossRef]
- Gavazzi, B.; le Maire, P.; de Lépinay, J.M.; Calou, P.; Munschy, M. Fluxgate three-component magnetometers for cost-effective ground, UAV and airborne magnetic surveys for industrial and academic geoscience applications and comparison with current industrial standards through case studies. Geomech. Energy Environ. 2019, 20, 100117. [Google Scholar] [CrossRef]
- Nabighian, M.N.; Ander, M.E.; Grauch, V.J.S.; Hansen, R.O.; la Fehr, T.R.; Li, Y.; Ruder, M.E. Historical development of the gravity method in exploration Historical Development of Gravity Method. Geophysics 2005, 70, 63ND–89ND. [Google Scholar] [CrossRef]
- Scollar, I. Electromagnetic Prospecting Methods in Archaeology. Archaeometry 1962, 5, 146–153. [Google Scholar] [CrossRef]
- Bozzo, E.; Merlanti, F.; Ranieri, G.; Sambuelli, L.; Finzi, E. EM-VLF soundings on the eastern hill of the archaeological site of Selinunte. Boll. Geofis. Teor. Appl. 1991, 34, 132–140. [Google Scholar]
- Fassbinder, J.W.E.; Reindel, M. Magnetometer prospection as research for pre-Spanish cultures at Nasca and Palpa, Perù. In Proceedings of the 6th International Archaeological Prospection Conference, CNR, Rome, Italy, 14–17 September 2005; Piro, S., Ed.; Institute of Technologies Applied to Cultural Heritage: Rome, Italy, 2005; pp. 6–10. [Google Scholar]
- Mol, L.; Preston, P.R. The writing’s in the wall: A review of new preliminary applications of electrical resistivity tomography within archaeology. Archaeometry 2010, 52, 1079–1095. [Google Scholar] [CrossRef]
- Tsokas, G.N.; Tsourlos, P.I.; Kim, J.-H.; Yi, M.-J.; Vargemezis, G.; Lefantzis, M.; Fikos, E.; Peristeri, K. ERT imaging of the interior of the huge tumulus of Kastas in Amphipolis (northern Greece). Archaeol. Prospect. 2018, 25, 347–361. [Google Scholar] [CrossRef]
- Urban, T.M.; Leon, J.F.; Manning, S.W.; Fisher, K.D. High resolution GPR mapping of Late Bronze Age architecture at Kalavasos-Ayios Dhimitrios, Cyprus. J. Appl. Geophys. 2014, 107, 129–136. [Google Scholar] [CrossRef]
- Cozzolino, M.; Gentile, V.; Giordano, C.; Mauriello, P. Imaging Buried Archaeological Features through Ground Penetrating Radar: The Case of the Ancient Saepinum (Campobasso, Italy). Geosciences 2020, 10, 225. [Google Scholar] [CrossRef]
- Knudson, D.L.; Rempe, J. Linear variable differential transformer (LVDT)-based elongation measurements in Advanced Test Reactor high temperature irradiation testing. Meas. Sci. Technol. 2012, 23, 025604. [Google Scholar] [CrossRef]
- Burrows, S.E.; Rashed, A.; Almond, D.P.; Dixon, S. Combined laser spot imaging thermography and ultrasonic measurements for crack detection. Nondestruct. Test. Eval. 2007, 22, 217–227. [Google Scholar] [CrossRef]
- Candoré, J.C.; Bodnar, J.-L.; Detalle, V.; Grossel, P. Non destructive testing in situ, of works of art by stimulated infra-red thermography. J. Phys. Conf. Ser. 2010, 214, 012068. [Google Scholar] [CrossRef]
- Costanzo, A.; Minasi, M.; Casula, G.; Musacchio, M.; Buongiorno, M.F. Combined Use of Terrestrial Laser Scanning and IR Thermography Applied to a Historical Building. Sensors 2014, 15, 194–213. [Google Scholar] [CrossRef]
- Arias, P.; Armesto, J.; di Capua, D.; Gonzalez-Drigo, R.; Lorenzo, H.; Perez-Gracia, V. Digital photogrammetry, GPR and computational analysis of structural damages in a mediaeval bridge. Eng. Fail. Anal. 2007, 14, 1444–1457. [Google Scholar] [CrossRef]
- Cozzolino, M.; Gabrielli, R.; Galata’, P.; Gentile, V.; Greco, G.; Scopinaro, E. Combined use of 3D metric surveys and non-invasive geophysical surveys for the determination of the state of conservation of the Stylite Tower (Umm ar-Rasas, Jordan). Ann. Geophys. 2019, 61, 72. [Google Scholar] [CrossRef]
- Cozzolino, M.; di Meo, A.; Gentile, V. The contribution of indirect topographic surveys (photogrammetry and laser scanner) and GPR investigations in the study of the vulnerability of the Abbey of Santa Maria a Mare, Tremiti Islands (Italy). Ann. Geophys. 2019, 61, 71. [Google Scholar] [CrossRef]
- Available online: https://seg.org/Events/Distributed-Sensing-for-Geophysics (accessed on 25 May 2020).
- Available online: https://www.eage.org/event/?eventid=1419&evp=18807 (accessed on 25 May 2020).
- Available online: https://www.eegs.org/sageep-2018-special-session--geophysics-for-urban-underground-space-development-i (accessed on 25 May 2020).
- Available online: https://www.science-community.org/en/node/177491 (accessed on 25 May 2020).
- Available online: https://www.sciencedirect.com/journal/engineering-geology/special-issue/10WK1QM13L7 (accessed on 25 May 2020).
- Available online: https://www.mdpi.com/journal/geosciences/special_issues/urban_geophysics (accessed on 25 May 2020).
- Miller, R. Introduction to this special section: Urban geophysics. Geophysics 2013, 32, 248–249. [Google Scholar] [CrossRef]
- Piscitelli, S.; Rizzo, E.; Cristallo, F.; Lapenna, V.; Crocco, L.; Persico, R.; Soldovieri, F. GPR and microwave tomography for detecting shallow cavities in the historical area of “Sassi of Matera” (southern Italy). Near Surf. Geophys. 2007, 5, 275–284. [Google Scholar] [CrossRef]
- Gabàs, A.; Macau, A.; Benjumea, B.; Bellmunt, F.; Figueras, S.; Vila, M. Combination of Geophysical Methods to Support Urban Geological Mapping. Surv. Geophys. 2013, 35, 983–1002. [Google Scholar] [CrossRef]
- Rizzo, E.; Capozzoli, L.; de Martino, G.; Grimaldi, S. Urban geophysical approach to characterize the subsoil of the main square in San Benedetto del Tronto town (Italy). Eng. Geol. 2019, 257, 105133. [Google Scholar] [CrossRef]
- Lück, E.; Eisenreich, M.; Spangenberg, U.; Christl, G. A note on geophysical prospection of archaeological structures in urban contexts in Potsdam (Germany). Archaeol. Prospect. 1997, 4, 231–238. [Google Scholar] [CrossRef]
- Amato, V.; Cozzolino, M.; de Benedittis, G.; di Paola, G.; Gentile, V.; Giordano, C.; Marino, P.; Rosskpof, C.M.; Valente, E. An integrated quantitative approach to assess the archaeological heritage in highly anthropized areas: The case study of Aesernia (southern Italy). Acta IMEKO 2016, 5, 33. [Google Scholar] [CrossRef]
- Paz-Arellano, P.; Tejero-Andrade, A.; Argote-Espino, D. 2D-ERT Survey for the Identification of Archaeological and Historical Structures beneath the Plaza of Santo Domingo, Mexico City, Mexico. Archaeol. Prospect. 2016, 24, 183–194. [Google Scholar] [CrossRef]
- Sagnard, F.; Norgeot, C.; Dérobert, X.; Baltazart, V.; Merliot, E.; Derkx, F.; Lebental, B. Utility detection and positioning on the urban site Sense-City using Ground-Penetrating Radar systems. Measurement 2016, 88, 318–330. [Google Scholar] [CrossRef]
- Sărăcin, A. Using georadar systems for mapping underground utility networks. Procedia Eng. 2017, 209, 216–223. [Google Scholar] [CrossRef]
- Camocio, G.F.; Bertelli, D.; Zenoi, D.; Rota, M.; Furlani, P. Isole Famose Porti, Fortezze, e Terre Maritime Sottoposte Alla Ser.ma Sig.ria di Venetia, ad Altri Principi Christiani, et al. Sig.or Turco, Nouame[n]te Poste in Luce; Alla libraria del segno di S. Marco: Venice, Italy, 1570–1573; pp. 97–100. [Google Scholar]
- Cozzolino, M.; Mauriello, P.; Patella, D. Resistivity Tomography Imaging of the Substratum of the Bedestan Monumental Complex at Nicosia, Cyprus. Archaeometry 2013, 56, 331–350. [Google Scholar] [CrossRef][Green Version]
- Cozzolino, M.; di Giovanni, E.; Mauriello, P. Geophysical prospections applied to historical centres. In Proceedings of the 19th International Conference on Cultural Heritage and New Technologies 2014 (CHNT 19, 2014), Vienna, Austria, 3–5 November 2014; pp. 1–14. [Google Scholar]
- Mauriello, P.; Patella, D. A data-adaptive probability-based fast ERT inversion method. Prog. Electromagn. Res. 2009, 97, 275–290. [Google Scholar] [CrossRef]
- Oktay, D. An Analysis and Review of the Divided City of Nicosia, Cyprus, and New Perspectives. Geography 2007, 3, 234–236. [Google Scholar]
- Petridou, A. Nicosia Master Plan: Perspectives for Urban Rehabilitation—Building Bridges between the Two Communities of the Divided City of Nicosia; EU Partnership for the Future Programme; Nicosia Municipality: Nicosia, Cyprus, 2010. [Google Scholar]
- Petridou, A. Rehabilitating Traditional Mediterranean Architecture. The Nicosia Rehabilitation Project: An Integrated Plan; Monumenta, Nicosia Municipality: Nicosia, Cyprus, 2007. [Google Scholar]
- Available online: www.zaha-hadid.com/masterplans/eleftheria-square (accessed on 24 April 2020).
- Harrison, R.W.; Newell, W.L.; Panayides, I.; Stone, B.; Tsiolakis, E.; Necdet, M.; Batihanli, H.; Ozhur, A.; Lord, A.; Berksoy, O.; et al. Bedrock Geologic Map of the Greater Lefkosia Area, Cyprus; US Geological Survey: Reston, VA, USA, 2008.
- Available online: www.geophysical.com (accessed on 24 April 2020).
- Patella, D. Introduction to ground surface self-potential tomography. Geophys. Prospect. 1997, 45, 653–681. [Google Scholar] [CrossRef]
- Mauriello, P.; Patella, D. Resistivity anomaly imaging by probability tomography. Geophys. Prospect. 1999, 47, 411–429. [Google Scholar] [CrossRef]
- Mauriello, P.; Patella, D. Resistivity tensor probability tomography. Prog. Electromagn. Res. B 2008, 8, 129–146. [Google Scholar] [CrossRef]
- Mauriello, P.; Patella, D. Geoelectrical anomalies imaged by polar and dipolar probability tomography. Prog. Electromagn. Res. 2008, 87, 63–88. [Google Scholar] [CrossRef]
- Alaia, R.; Patella, D.; Mauriello, P. Application of geoelectrical 3D probability tomography in a test-site of the archaeological park of Pompei (Naples, Italy). J. Geophys. Eng. 2007, 5, 67–76. [Google Scholar] [CrossRef]
- Alaia, R.; Mauriello, P.; Patella, D. Imaging multipole self- potential sources by 3D probability tomography. Prog. Electromagn. Res. B 2009, 14, 311–339. [Google Scholar] [CrossRef]
- Compare, V.; Cozzolino, M.; Mauriello, P.; Patella, D. Resistivity Probability Tomography Imaging at the Castle of Zena, Italy. EURASIP J. Image Video Process. 2009, 1–9. [Google Scholar] [CrossRef]
- Minelli, A.; Cozzolino, M.; di Nucci, A.; Guglielmi, S.; Giannantonio, M.; D’Amore, D.; Pittoni, E.; Groot, A.M. The prehistory of the Colombian territory: The results of the Italian archaeological investigation on the Checua site (Municipality of Nemocòn, Cundinamarca Department). J. Biol. Res. 2012, 85, 94–97. [Google Scholar] [CrossRef]
- Compare, V.; Cozzolino, M.; Mauriello, P.; Patella, D. 3D Resistivity probability tomography at the prehistoric site of Grotta Reali (Molise, Italy). Archaeol. Prospect. 2009, 16, 53–63. [Google Scholar] [CrossRef]
- Compare, V.; Cozzolino, M.; di Giovanni, E.; Mauriello, P. Examples of Resistivity Tomography for Cultural Heritage Management. In Near Surface 2010—16th EAGE European Meeting of Environmental and Engineering Geophysics; European Association of Geoscientists and Engineers (EAGE): Utrecht, Holland, 2010. [Google Scholar]
- Cozzolino, M.; di Giovanni, E.; Mauriello, P.; Desideri, A.V.; Patella, D. Resistivity Tomography in the Park of Pratolino at Vaglia (Florence, Italy). Archaeol. Prospect. 2012, 19, 253–260. [Google Scholar] [CrossRef]
- Cozzolino, M.; Longo, F.; Pizzano, N.; Rizzo, M.L.; Voza, O.; Amato, V. A Multidisciplinary Approach to the Study of the Temple of Athena in Poseidonia-Paestum (Southern Italy): New Geomorphological, Geophysical and Archaeological Data. Geosciences 2019, 9, 324. [Google Scholar] [CrossRef]
- Cozzolino, M.; Caliò, L.M.; Gentile, V.; Mauriello, P.; Di Meo, A. The Discovery of the Theater of Akragas (Valley of Temples, Agrigento, Italy): An Archaeological Confirmation of the Supposed Buried Structures from a Geophysical Survey. Geosciences 2020, 10, 161. [Google Scholar] [CrossRef]
- Cozzolino, M.; Baković, M.; Borovinić, N.; Galli, G.; Gentile, V.; Jabučanin, M.; Mauriello, P.; Merola, P.; Živanović, M. The Contribution of Geophysics to the Knowledge of the Hidden Archaeological Heritage of Montenegro. Geosciences 2020, 10, 187. [Google Scholar] [CrossRef]
- Cozzolino, M.; Mauriello, P.; Moisidi, M.; Vallianatos, F. A Probability Electrical Resistivity Tomography Imaging of complex tectonic features in the Kissamos and Paleohora urban areas, Western Crete (Greece). Ann. Geophys. 2019, 62, 13. [Google Scholar] [CrossRef]
- Di Giuseppe, M.G.; Troiano, A.; Fedele, A.; Caputo, T.; Patella, D.; Troise, C.; de Natale, G. Electrical resistivity tomography imaging of the near-surface structure of the Solfatara crater, Campi Flegrei (Naples, Italy). Bull. Volcanol. 2015, 77, 27. [Google Scholar] [CrossRef]
- Goodman, D. GPR-SLICE. Ground Penetrating Radar Imaging Software, User’s Manual; Geophysical Archaeometry Laboratory: Los Angeles, CA, USA, 2004. [Google Scholar]


© 2020 by the authors. Licensee MDPI, Basel, Switzerland. This article is an open access article distributed under the terms and conditions of the Creative Commons Attribution (CC BY) license (http://creativecommons.org/licenses/by/4.0/).
Share and Cite
Cozzolino, M.; Gentile, V.; Mauriello, P.; Peditrou, A. Non-Destructive Techniques for Building Evaluation in Urban Areas: The Case Study of the Redesigning Project of Eleftheria Square (Nicosia, Cyprus). Appl. Sci. 2020, 10, 4296. https://doi.org/10.3390/app10124296
Cozzolino M, Gentile V, Mauriello P, Peditrou A. Non-Destructive Techniques for Building Evaluation in Urban Areas: The Case Study of the Redesigning Project of Eleftheria Square (Nicosia, Cyprus). Applied Sciences. 2020; 10(12):4296. https://doi.org/10.3390/app10124296
Chicago/Turabian StyleCozzolino, Marilena, Vincenzo Gentile, Paolo Mauriello, and Agni Peditrou. 2020. "Non-Destructive Techniques for Building Evaluation in Urban Areas: The Case Study of the Redesigning Project of Eleftheria Square (Nicosia, Cyprus)" Applied Sciences 10, no. 12: 4296. https://doi.org/10.3390/app10124296
APA StyleCozzolino, M., Gentile, V., Mauriello, P., & Peditrou, A. (2020). Non-Destructive Techniques for Building Evaluation in Urban Areas: The Case Study of the Redesigning Project of Eleftheria Square (Nicosia, Cyprus). Applied Sciences, 10(12), 4296. https://doi.org/10.3390/app10124296