Review

Polarization-Sensitive Digital Holographic Imaging for Characterization of Microscopic Samples: Recent Advances and Perspectives

by
Giuseppe Coppola
and
Maria Antonietta Ferrara
*
National Research Council (CNR), Institute of Applied Sciences and Intelligent Systems, Via Pietro Castellino 111, 80131 Naples, Italy
*
Author to whom correspondence should be addressed.
Appl. Sci. 2020, 10(13), 4520; https://doi.org/10.3390/app10134520
Submission received: 28 May 2020 / Revised: 20 June 2020 / Accepted: 22 June 2020 / Published: 29 June 2020
(This article belongs to the Special Issue Recent Advances and Future Trends in Nanophotonics)

Abstract

:

Featured Application

A simple and fast measure of the state of polarization of vector optical beams is a very important topic to study new optical effects and their applications in several fields, such as microelectronics, micro-photonics, remote sensing and bioimaging.

Abstract

Polarization-sensitive digital holographic imaging (PS-DHI) is a recent imaging technique based on interference among several polarized optical beams. PS-DHI allows simultaneous quantitative three-dimensional reconstruction and quantitative evaluation of polarization properties of a given sample with micrometer scale resolution. Since this technique is very fast and does not require labels/markers, it finds application in several fields, from biology to microelectronics and micro-photonics. In this paper, a comprehensive review of the state-of-the-art of PS-DHI techniques, the theoretical principles, and important applications are reported.

1. Introduction

Digital holography (DH) is a fascinating alternative to conventional microscopy since it allows three-dimensional (3D) reconstruction, phase contrast images, and an improved focal depth [1,2,3,4,5]. Basically, DH consists of an interference fringe pattern between a reference unperturbed beam and an object beam, that changes its characteristics by passing through a sample. The interference pattern (hologram) is acquired by a digital sensor array. Its post-processing achieves a 3D quantitative image of the sample by a numerical refocusing of a 2D image at different object planes [6]. When DH is implemented in an optical microscope, the objective lens provides a magnified image allowing to reconstruct amplitude and phase-contrast images with a spatial resolution of less than 1μm in all dimensions [7].
Digital holographic imaging (DHI) has several interesting features including high-resolution, very fast acquisition, and 4D (3D + time) characterization of samples [8,9,10]. These properties are very useful, for example, when the specimen is moving or when the sample is subjected to external stimuli that can alter its shape and size, such as electrical, magnetic or mechanical forces, chemical corrosion, or evaporation and deposition of further materials. Moreover, DHI is a non-contact and non-invasive technique, allowing label-free quantitative phase analysis of living cells; thus, measurements do not require the introduction of a tag, so cells are not altered. This approach can provide useful information that can be interpreted into many underlying biological processes.
During the last decade, DHI has experienced several technological developments, including the integration of DHI with complementary characterization techniques (e.g., Raman spectroscopy or scanning electron microscope [11,12,13]). A further important extension of DHI is the possibility to quantitative measure the state of polarization (SoP) modified by a sample [14,15,16,17] and so evaluate its birefringent and/or dichroic proprieties, which are frequently related to the micro- or even ultra-structure of the sample itself [18]. Therefore, the characterization of these proprieties and the detection of their eventual variations, that can be due to either stress and strain in a given material or disordered microstructure in biological specimens, could lead to a better understanding of the process involved in a broad variety of applications.
Since SoP is one of the fundamental properties of light, its evaluation has attracted a growing interest in both the basic researches and practical applications of optics, intending to study novel optical phenomena and new applications. Thus, the experimental evaluation of the SoP has become a fast-rising subject. Typically, polarization imaging has been carried out with different approaches—for example by using real-time polarization phase-shifting system [19], polarization contrast with near-field scanning optical microscopy [20], optical coherence tomography [21,22], and Pol-Scope [23]. However, these techniques need different image acquisitions, generally obtained at diverse orientations of birefringent optical components (e.g., polarizers, quarter-wave, and/or half-wave plates) to retrieve the polarization state. The great advantage offered by polarization-sensitive digital holographic imaging (PS-DHI) is the possibility to use a single acquisition to retrieve the full polarization state of the sample under observation, therefore gaining in speed and simplicity.
This review paper aims to provide an overview of the state-of-the-art in PS-DHI. In the following sections, some basic concepts will be introduced for describing polarization of light and commonly used technical approaches for realizing PS-DHI. Then, some recent and important applications of PS-DHIM in both the biomedical field and non-biomedical use will be discussed.

2. Theoretical Background

The Stokes vectors and Müeller matrices allow a whole study of the polarization state for fully polarized, partially polarized and even unpolarized light, comprising the optical axis and the degree of polarization. On the other hand, the Jones vectors, that can be useful only for completely polarized light, are more appropriate for problems concerning coherent light (see Appendix A). As a general rule, the Jones vectors are useful for problems involving amplitude superposition, while the Müeller matrices are applied for problems involving intensity superposition [24]. Different approaches of PS-DHI have been proposed in the literature, however, the basic idea is to generate a hologram of the sample through the interference between the object wave and two orthogonally polarized reference waves, producing in this way two fringe patterns. The hologram of the magnified sample is recorded by a digital camera (such as a charge-coupled device or an active pixel sensor). The numerical reconstruction of such hologram leads to two wavefronts, one relative to each reference wave, and thus, one for each perpendicular state of polarization [15]. Basically, PS-DHI approaches can be classified in two groups—(i) those which allow measurement of Jones vectors or Jones matrices and (ii) those which give information on Stokes vectors or Müller matrices. Since holography needs a uniform laser beam, especially regarding the flatness of phase front and the extended depth of field, in both approaches, (quasi)-monochromic light and perfect plane wavefronts are considered. However, the realistic intensity distribution of laser sources is described by Gaussian function, leading to problems in holographic-based applications, such as a reduced image contrast. These issues can be overcome by implementing beam shaping systems built on the base of field mapping refractive beam shapers like πShaper [25].

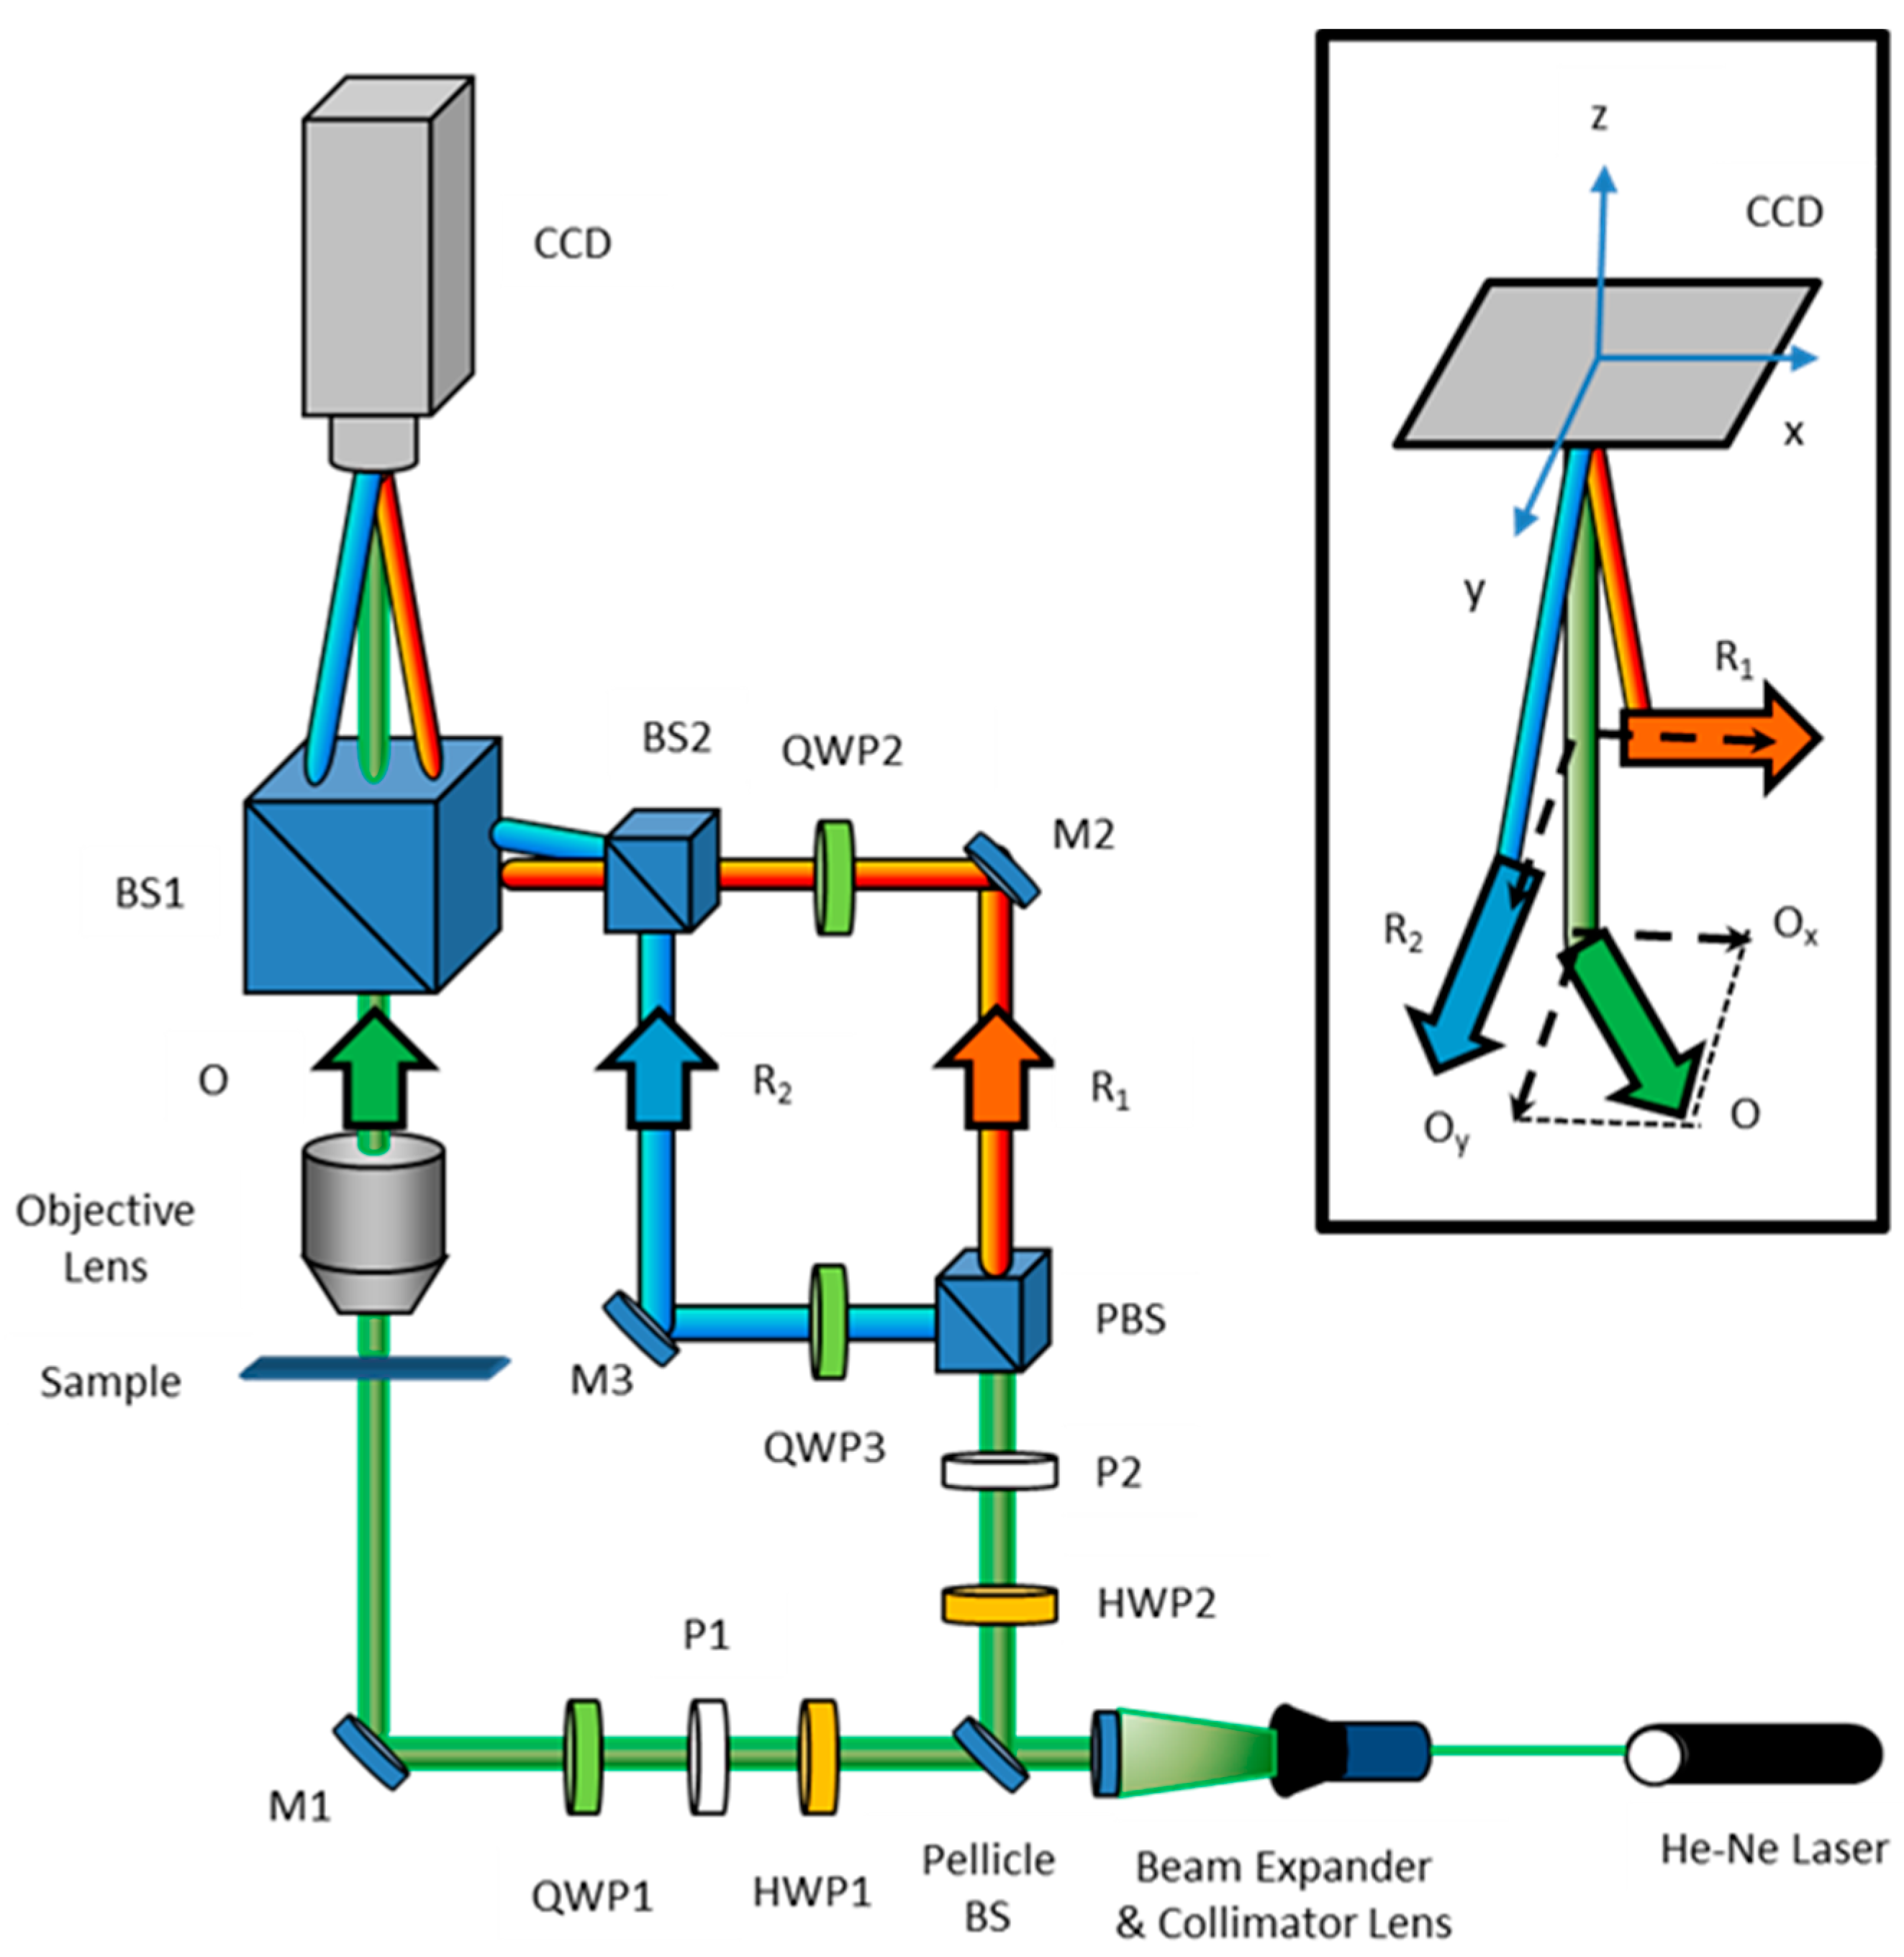
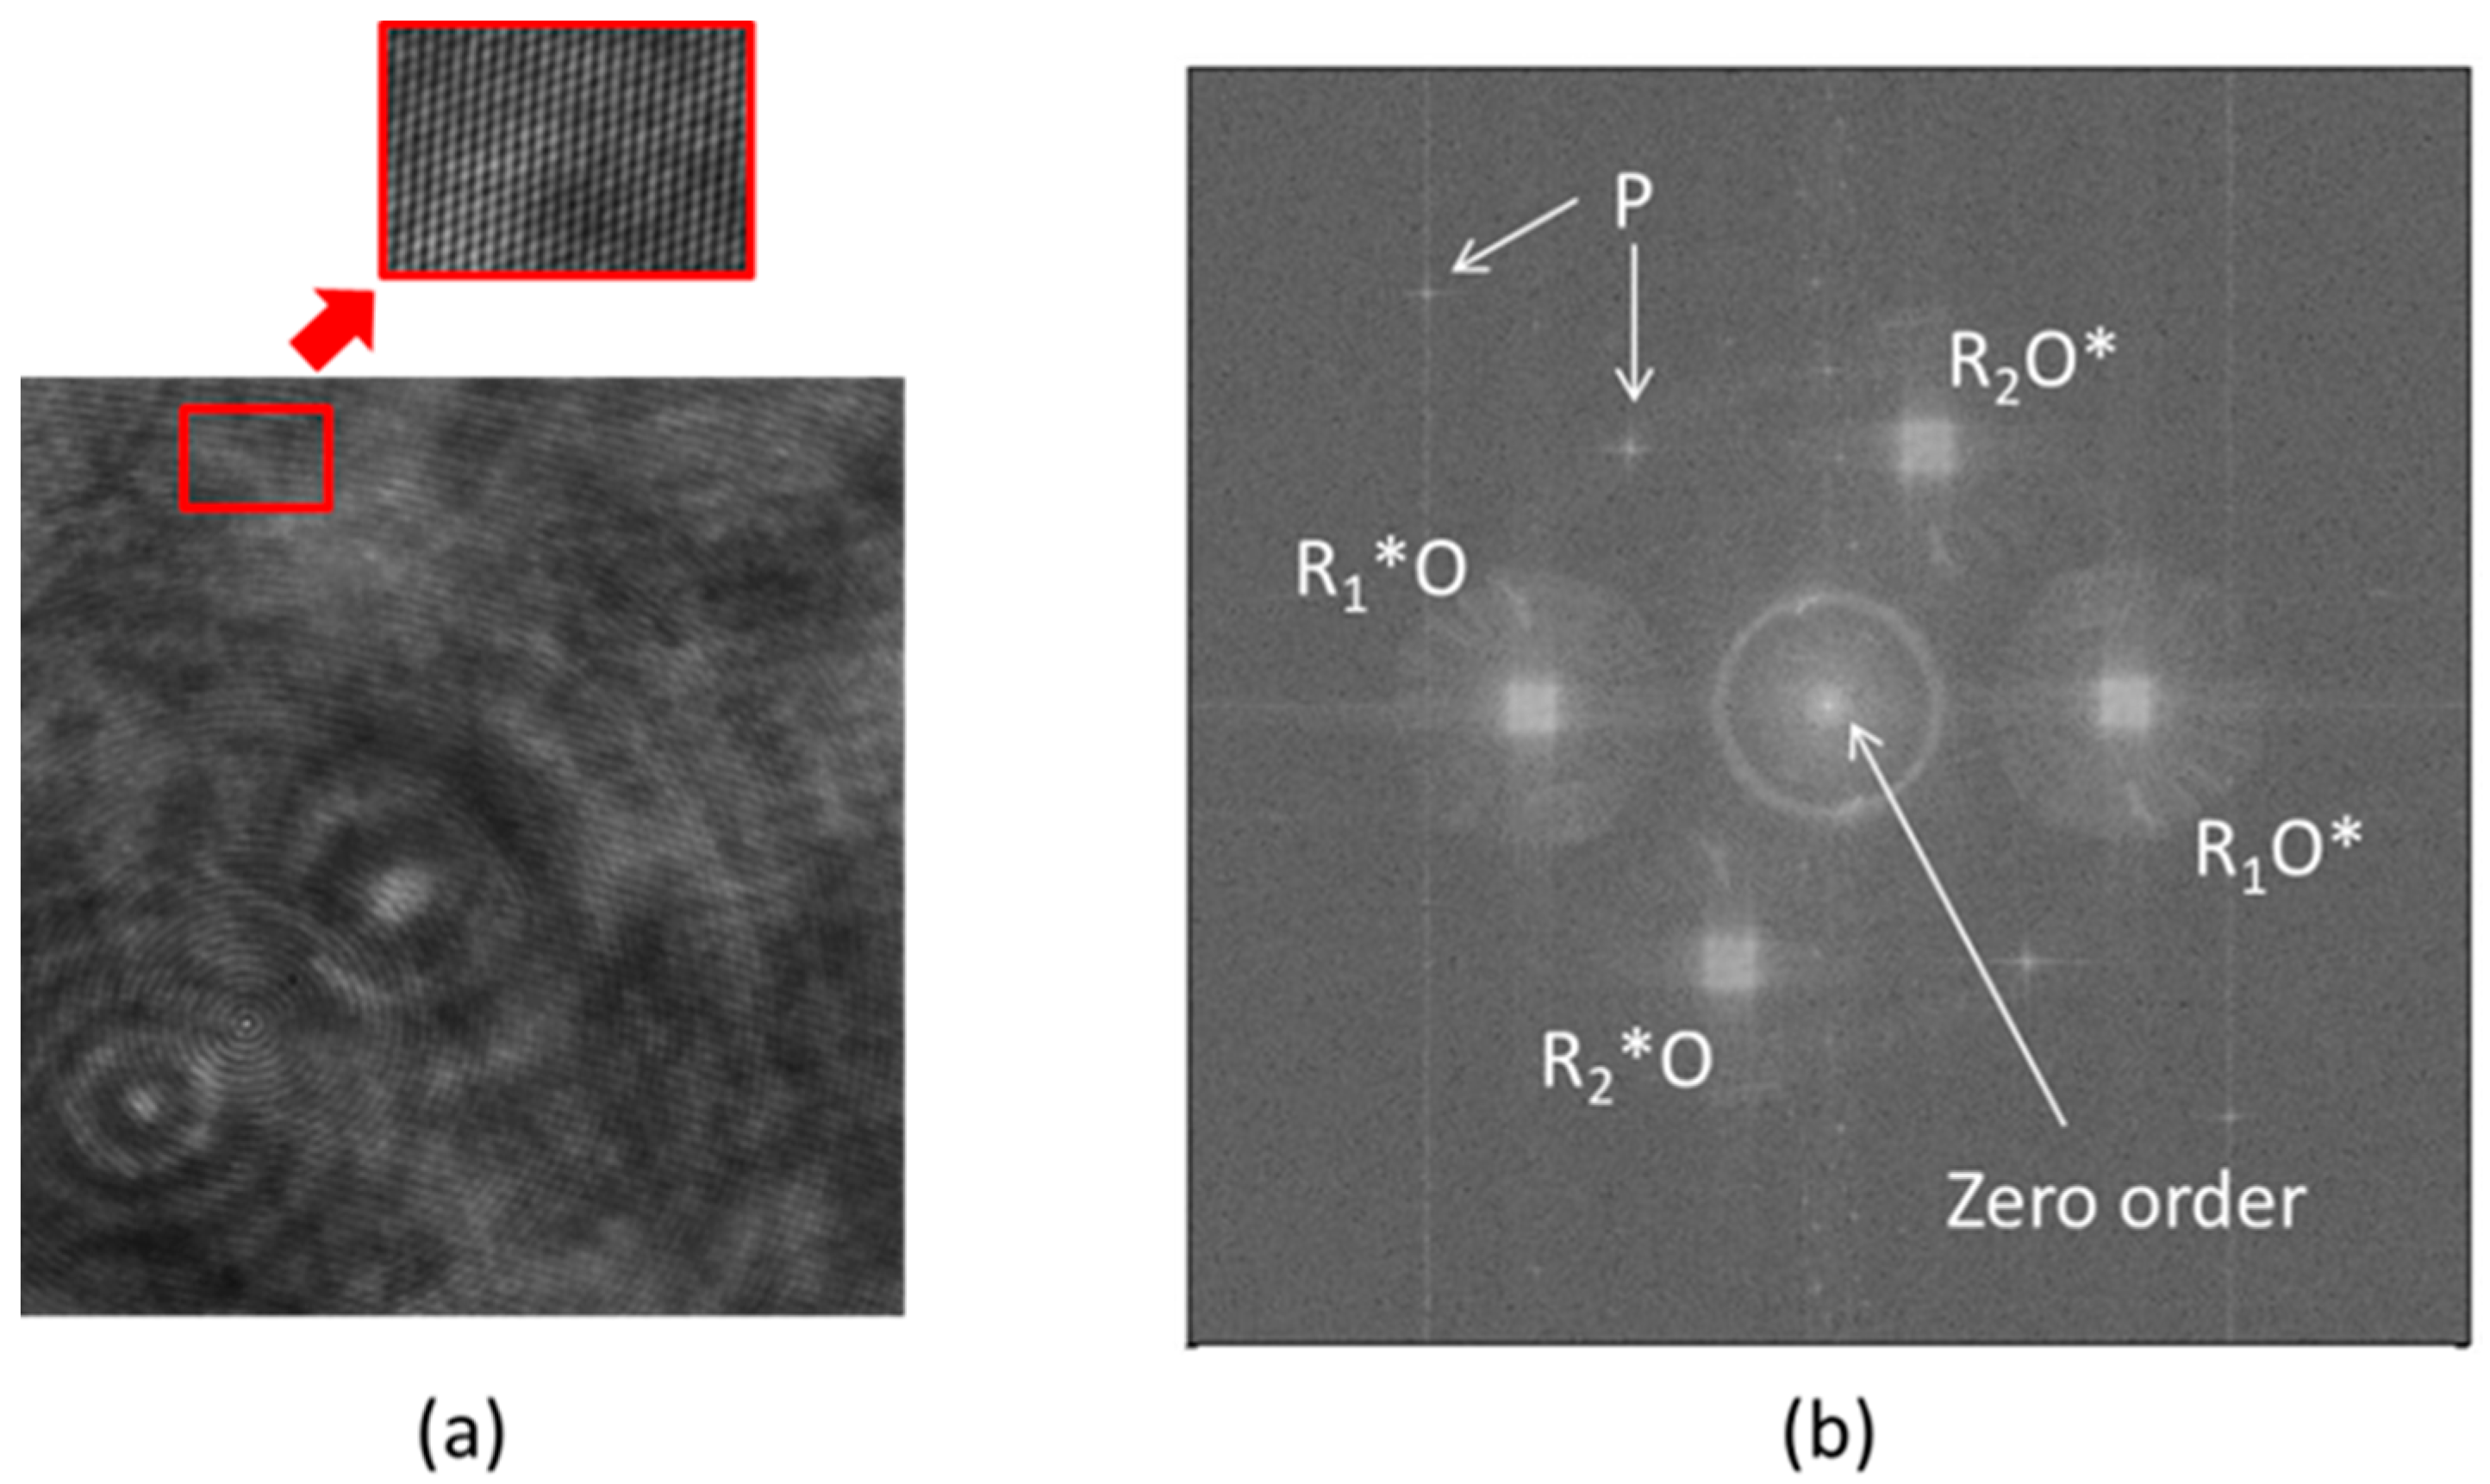
2.1. PS-DHI for Jones Formalism

In most polarimetric techniques, SoP parameters can be evaluated by applying more or less complex algorithms to various images acquired with different settings of polarization-analyzing components (polarizers, rotators, and retarders). Since these procedures need several rotations of the analyzing optics, the acquisition time is very long compared to the performances of a digital camera. Several solutions were proposed in the literature to improve the temporal resolution, such as the possibility to use a liquid-crystal universal compensator [23]; however, the goal was reached only with techniques that allow recording all parameters of the polarization state through the acquisition of a single image. Hence, since the pioneering paper published by Ohtsuka and Oka, which generated the interference between two orthogonal linearly polarized reference waves and an object wave [26] using a Mach-Zender interferometer, several other published works followed this approach [15,27,28].
The typical experimental configuration for the recording of polarization holograms is illustrated in Figure 1. It consists of a modified Mach–Zehnder interferometer with two reference waves—R1 and R2—that interfere with the object beam O [11,15,16,17]. Two operating conditions are possible [18]. First, the object plane beam is linearly polarized by a polarizer (P1 oriented at 45°) and a quarter wave plate (QWP1 oriented at 0° respect the incoming light). Due to the passage through the sample, the state of polarization of the beam O can change. An objective lens is used to collect the wave emitted from the sample. A polarized beam splitter (PBS) allows the user to obtain two orthogonal linearly polarized reference beams R1 and R2, where orthogonality avoids any interference between the reference beams. Additionally a couple of polarizers or quarter waves plates (QWP2 and QWP3) preserve the linear polarization when their fast axes are aligned parallel respect to the polarization states of the respective reference waves. In the second operating condition, a circularly polarized light is incident on the sample by orienting the QWP1 fast axis angle at −45° (left-handed circular polarization) or +45° (right-handed circular polarization) respect to the polarizer transmission axis P1. The two orthogonal linearly polarized reference are transformed in right and left circularly polarized beams by the quarter wave plates QWP2 and QWP3 oriented of +45° and −45° respect to the polarization states of the two references waves, respectively. The beam splitter BS1 allows to overlap O, R1, and R2 beams, and the interference among these waves gives rise to the hologram that is acquired by a digital camera in an off-axis configuration, i.e., with the three waves propagating along slightly different directions (as highlighted in the inset in Figure 1). The intensities of O, R1 and R2 can be adjusted by the half-waves plates HWP1 and HWP2, while the angles of incidence of R1 and R2 can be controlled by mirrors M2 and M3, respectively. An example of the recorded digital hologram in shown in Figure 2a. In the insert, where a magnification of the interference between object and the two orthogonal reference waves is reported, the two sets of fringe patterns are clearly visible.
Since R1 and R2 are orthogonally polarized, they do not interfere: R1⋅R2* = R1*⋅R2 = 0 (where the asterisk indicates the complex conjugate), so the hologram intensity at the digital camera surface is [11,15]
H ( x , y ) = ( O + R 1 + R 2 ) · ( O + R 1 + R 2 ) * = | O | 2 + | R 1 | 2 + | R 2 | 2 + O R 1 * + O R 2 * + O * R 1 + O * R 2
In Equation (1), the first three terms correspond to the zero diffraction order, the fourth and fifth terms produce the virtual images, and the last two terms form the real images. Computing the Fourier transform of the acquired hologram, these terms appear spatially separated in the Fourier space, due to the off-axis configuration, as well shown in Figure 2b where the presence of some parasitic interferences are also highlighted [16,29]. In order to recover the information of the real images, the corresponding spectra could be selected by two different spatial filters [15,18].
As with classical holography, the reconstruction is obtained by multiply the digital hologram for a digitally computed reference wave and then the inverse Fourier transform of the spatial frequency components filtered is performed. By using the standard reconstruction algorithm on each filtered region, the two orthogonal components of the object beam (Ox and Oy), can be retrieved [15,16,18,30]. So, the amplitude map and the phase map for each polarization component can be reconstructed. With the aim to evaluate the SoP change of the object beam due to the interaction with the sample under test, typically, two parameters are experimentally measured—the amplitude ratio β, which is related to the different transmitted intensities of the two orthogonal components and corresponds to the azimuth of the polarization ellipse, and the phase difference Δφ, that contains information on the different optical paths due to the refractive index anisotropy linked to the sample structure [18,30].
So, the amplitude ratio angle can be evaluated as
β = a r c t a n ( | O y | | O x | )
Equation (2) is obtained assuming that both the reference waves have the same intensity (|R1| = |R2|); this identity is experimentally achieved by controlling the orientation of the half-wave plates HWP1 and HWP2 in Figure 1 [18,30]. Regarding the phase difference between the orthogonal components of the object beam, it can be expressed as
Δ φ = p h a s e ( O y ) p h a s e ( O x ) + Δ φ R
where ΔφR = phase(R2) − phase(R1) can be removed by a calibrated phase difference offset superimposed to the phase difference image [31]. The evaluation of β and Δφ allows the SoP of the sample under test to be univocally obtained; in other words, the distributions of the Jones vector at the surface of the sample under test can be retrieved from a single hologram acquisition [31]. For example, if Δφ = 0 or π a linear polarization is retrieved, while if Δφ = π/2 and β = π/4 or Δφ = −π/2 and β = π/4 a circular right or left polarization, respectively, are detected. Elliptical polarization states, i.e., intermediate polarization values, can be also measured. Considering the polarization ellipse represented in Figure 3 and that corresponds to the projection of the trajectory of the extremity of the vector O on the plane xy, it can be characterized by the parameters ψ (orientation angle) and χ (ellipticity angle), which can be additionally evaluated by the following equations [15,17]:
ψ = 1 2 a r c t a n ( 2 | O x | | O y | cos ( Δ φ ) | O x | 2 | O y | 2 ) = 1 2 a r c t a n [ tan ( 2 β ) cos ( Δ φ ) ] χ = 1 2 a r c s i n ( 2 | O x | | O y | sin ( Δ φ ) | O x | 2 + | O y | 2 ) = 1 2 a r c s i n [ sin ( 2 β ) sin ( Δ φ ) ]
Regarding the direction of rotation of the vector O, it is defined as left-hand polarization (L-state) or right-hand polarization (R-state) depending on whether −π ≤ ∆φ ≤ 0 or 0 ≤ ∆φ ≤ π, respectively.
Finally, in a recent and very interestingly work a new compact experimental setup has been proposed as proof of concept [32]. The birefringence distribution was measured by the interference fringes based on three circularly polarized beams—two mutually orthogonal polarized (left-handed and right-handed) reference waves and a right-handed object wave. These three-beam interfering fields were obtained by monolithic gratings, so all waves were crossed at the same angle on the hologram plane, generating two sets of the fringe pattern. With this approach, all the optical elements required to obtain the three beams in the set-up illustrated in Figure 1 can be replaced by three grating vectors; moreover, in order to have practical interferometry, a monolithic grating containing three diffractive gratings positioned in a threefold-symmetric arrangement has been employed [32,33]. A schematization of both the monolithic gratings and the operating principle is illustrated in Figure 4. When a plane beam impinges on the monolithic gratings, the first-order diffractions of each grating intersect the hologram plane with the same angles. As described, analyzing the interference patterns allows the estimation of the anisotropic phase shift in the object beam. Thus, this arrangement has the potentiality to evaluate a two-dimensional birefringence distribution in a single shot and compact way.

2.2. PS-DHI for Stokes Vectors or Müller Formalism

Jones vectors cannot be used to describe light that does not remain in a single polarization state. So, to treat fully, partially, or unpolarized light, Stokes parameters (S1, S2, S3) are often used. In fact, unlike the Jones vectors, the Stokes parameters can define all kinds of SoPs of the optical beam. Unfortunately, as in the case of Jones formalism, the typical methods for estimating the Stokes parameters of an optical wave require to register several intensity distributions at different detection states via rotating the polarized optical elements. Generally, these methods require time-sequential operations using an arrangement with a rotating waveplate and a fixed analyzer. However, system error could be generated by the rotating elements, due to their inhomogeneous transmittance, and obviously, fast acquisitions are not possible [34,35]. Other proposed methods need multichannel simultaneous measurement; in this case, the amplitude or the wavefront is split into several channels, each one is analyzed by employing appropriate polarization optical components thus leading to a complicated and cumbersome dynamic measurement system [36,37]. Moreover, systematic and calculation errors are induced by a not exactly precise image matching.
Thus, it is clear that the development of imaging polarimeters in real-time without the demand for mechanical or active elements for polarization control is still a valuable aim. With this purpose, several approaches were proposed; in one of these, multiple interference patterns are produced at the surface of a digital camera and the information of a different polarized component of the optical beam under investigation is linked to fringes patterns having different spatial frequencies. The Stokes parameters can be estimated through demodulation of the obtained image by a Fourier transform approach [38]. Recently, the combination of DH with theory of the Pancharatnam–Berry (PB) phase has paved the way toward the implementation of a new method for evaluating the state of polarization of arbitrary waves with a single exposure of the interference pattern and a quick acquisition for one object wave with no moving optical components [39,40]. Pancharatnam [41] and Berry [42] introduced the so-called PB phase of an optical wave that is taken along a closed cycle on the Poincaré sphere. With this formalism, polarization transformations give rise to two optical phase retardation—one related to optical path difference (called dynamic phase) and an extra one which is equal to minus half of the solid angle subtended by the closed path on the sphere. Therefore, this extra phase, i.e., the PB phase, depending only on the geometry of the transformations’ path of on the Poincaré sphere, is also called “geometric phase.” Nevertheless, the PB phase occurs generally in the following two conditions: when there is a variation of polarization state in the beam propagation, and when there is a variation of the mode structure of the beam propagation [43,44]. Regarding the first condition, the PB phase and the polarization state variation are quantitatively related, giving the possibility to estimate the SoP from the PB phase measurement. Even though DH allows quantitative phase retrieve of the object beam to be performed [45,46], when the phase difference contains both the PB phase (related to the SoP) and dynamic phase (related to the optical density of the sample), these two phases are indistinguishable for the reconstruction process. To separate the two contributions, two holograms should be generated—one to retrieve the dynamic phase and the other one for the geometric phase, respectively. The dynamic phase is then used for the evaluation of the refractive index or 3D shape of the sample under investigation, whereas its interaction with the polarized light is estimated through the geometric phase.
Basically, two classes of experimental setup based on the geometric phase can be found in the recent literature to evaluate the full SoP of an optical beam. In the first, shown in Figure 5a, a triangular common-path interferometer (TCPI) is used to generate two interferograms which are aligned together on a single charge coupled device (CCD) target [40]. This is made possible by dividing the object beam into two orthogonal circularly polarized components (left-handed and right-handed) through the TCPI, and then these two components interfere with a reference beam. However, this implementation is difficult to align, leading to low measurement resolution, reduced field of view (due to separated fringe pattern for the orthogonal components recorded in two different region of the same CCD), and image matching errors. The second setup, reported in Figure 5b, is based on a hybrid polarization-angular multiplexing digital holographic approach (PAMDH) [47], implemented by a double-channels Mach–Zehnder interferometer. In this case, two orthogonal and linearly polarized reference beams interfere with the object beam.
In both cases, the acquisition of a composite hologram generated by combining two patterns of interference fringes with distinct orientations allows the contemporary estimation of the orthogonal polarization components for an optical wave. Once these components are retrieved, the Stokes parameters can be evaluated by applying the geometric phase theory [47]. The main difference between two reported schemes is that in the setup depicted in Figure 5b the multiplexed hologram covers the whole area of the CCD, while in the solution presented in Figure 5a, a smaller field of view is achieved to avoid the influence of the change in the intensity and polarization distribution of the reference wave. For this configuration, the field of view is determined by the region of two images on CCD related to the two orthogonal components of the object wave separated at a distance controlled by the TCPI. Therefore, since the arrangement of Figure 5b is more useful to produce and control a larger field of view, for simplicity of discussion, here, the basic theory related to this scheme is reported.
In the PAMDH approach, Equation (1) becomes [47]
H ( x , y ) = ( O + R V + R H ) · ( O + R V + R H ) * = | O V | 2 + | O H | 2 + | R V | 2 + | R H | 2 + O V R V * + O H R H * + O V * R V + O H * R H = I V + I H
I V = | O V | 2 + | R V | 2 + 2 | O V | | R V | cos φ V I H = | O H | 2 + | R H | 2 + 2 | O H | | R H | cos φ H
where φV and φH are the phase variations related to each of the two orthogonal components of the reference beams and object waves. Therefore, the two orthogonal complex amplitudes OV and OH of the object wave can be numerically retrieved. To reconstruct the SoP, the polarization state should be reported on the Poincaré sphere. With this aim, in Figure 6, a spherical coordinate system is shown; here, the vertical and horizontal states (V,H) are positioned on the two poles, whereas the polar and azimuthal angles are given by 2χ1 and 2ψ1, respectively.
In accord with Pancharatnam’s theory [41], the orthogonal components intensities of the object wave IO are given by
I O V = | O V | 2 = I O s i n 2 ( O H ^ / 2 ) I O H = | O H | 2 = I O c o s 2 ( O H ^ / 2 )
Once the distribution of the two components of the complex amplitude of the object wave has been retrieved, the polar angle can be evaluated as
2 χ 1 = π / 2 O H ^ = π / 2 2 a r c t a n | O V | / | O H |
As previously discussed, for each polarization state V and H, the phase difference between reference and the object waves contains the contributes of both the dynamic and the geometric phase, in particular,
φ V = φ V d + φ V p b
φ H = φ H d + φ H p b
In Equations (9) and (10), the first term in the sum denotes the dynamic phase difference and the second term is the PB phase. For horizontal polarization state, the PB phase is numerically equivalent to half of the area of the geodesic triangle ROH (the red region in Figure 6), i.e., φHpb = Ω/2 [48]. Correspondingly, for vertical polarization state, the PB phase is given by φVpb = −2ψ1 + Ω/2. So, the azimuthal angle can be evaluated as [47]
2 ψ 1 = ( φ H φ V ) ( φ H d φ V d )
Taking advantage by DH, the two orthogonal components of the optical field can be obtained by
E V = k | O V | | R V | e i φ V E H = k | O H | | R H | e i φ H
where k is a constant depending on the exposure time and response of the digital camera. The holographic reconstruction approach allows evaluating the phases φV and φH, as a consequence the first term in brackets on the right side of Equation (11) can be calculated. Regarding the second term in brackets, Δφ = (φHdφVd), it is a fixed value for the adjusted PAMDH configuration and can be corrected by measuring a linearly polarized beam along 45° produced by a standard polarizer.
Since the two reference waves are adjusted to have the same intensity, the azimuthal and polar angles can be estimated by the following relationships:
2 ψ 1 = a r g ( E H / E V ) Δ φ 2 χ 1 = π / 2 2 a r c t a n ( | E V | / | E H | )
Thus, the area of Ω can be evaluated as a function of the angles 2ψ1 and 2χ1 [39] and the dynamic phases φHd and φVd are calculated [40,47,48,49]. Finally, the normalized Stokes parameters (S1, S2, S3) can be expressed as a function of (2ψ1, 2χ1) with a trigonometric relationship, as shown in Figure 6 and as described by the following relations [44]:
S 1 = sin 2 χ 1 S 2 = cos 2 χ 1 cos 2 ψ 1 S 3 = cos 2 χ 1 sin 2 ψ 1
The so-evaluated Stokes parameters describe the state of polarization of the object wave at the measurement area, hence they fully characterize the SoP of an arbitrarily polarized wave.
Finally, it is worth noting that the signal light from some imaging techniques, such as fluorescence imaging, is spatially incoherent, and therefore requires a further challenge for holographic imaging. Moreover, the use of light sources such as lasers, with highly temporal and spatial coherence, reduces the quality of the hologram owing to speckle and spurious fringe generation, which can decrease the spatial sensitivity of the system [50,51]. Consequently, polarization-sensitive imaging of an incoherent scene or by using partially incoherent illumination should be implemented. Unfortunately, only a couple of work proposed the incoherent polarization sensitive holography/interferometry. For example, Zhu and Shi [52] investigated a self-interference polarization holographic imaging (Si-Phi) method that allows real-time 3D imaging of an incoherent scene. The authors developed an in-line polarization holography configuration equipped with a polarization-resolving detector array; this setup allows a single shot acquisition of the complex-valued hologram and results demonstrated both 3D and real-time imaging capabilities. Even if the use of incoherent sources is still immature, future developments are expected in this field.

3. PS-DHI Applications

As described in the previous section, PS-DHI can measure the parameters β and ∆φ, thus allows to retrieve the SoP of a beam that interacts with a specimen. The modification of the SoP in the transmitted or reflected beam gives information about the structure, the composition, or the optical properties of the specimen under study. Basically, the following two physical properties of the matter can alter the polarization state of a wave [18]:
  • Birefringence—a material is considered birefringent if its refractive index depends on the polarization and propagation direction of the incoming light, i.e., it shows an optical anisotropy. When these samples are crossed by a polarized light, the amplitudes are unchanged but a modification in the relative phase occurs. Birefringence can be linear (that is, there is one axis of symmetry, called the optic axis) such as in optical wave plates/retarders and many crystals, or circular (that is, in which for an incident linearly polarized light, the corresponding outgoing polarization plane will be rotated) such as chiral fluids.
  • Dichroism—a material, typically crystalline, is considered dichroic if it absorbs more light along a preferential incident plane of polarization than another plane (absorption anisotropy); as a result, when the optical beam propagates within this material, its polarization state undergoes a modification. The ratio of amplitudes of the orthogonal components of the light emerging from the sample under test provides a measurement of its linear dichroism property.
The study of the polarization state covers different applications and research fields, such as measurement of stress, geology, chemistry, display technologies, medicine and medical diagnosis, etc. Currently, it has been demonstrated that the PS-DHI technique can be used for noninvasive quantitative imaging of live cells or the evaluation of the dynamic phase difference induced by the birefringence of liquid crystals. In the following, a state of the art of the PS-DHI applications is reported in two subsections, dividing the biological from microelectronics and micro photonics applications.

3.1. Microelctronics and Nanophotonic Quantitative Phase Imaging

Since PS-DHI has been introduced in the literature, it has been applied on samples with well-known SoP, such as bent fiber [16], stressed polymer [15], waveplates [39,40], or liquid crystals (LCs) [47], just to confirm the potentiality offered by this technique. Among these applications, LC seems to be the most interestingly due to their uses in the display. For example, Park et al. [49] measured the spatially resolved Jones matrix components of the light passing through the single pixel of a liquid-crystal display (LCD) as a function of the applied voltage to the LCD panel by using PS-DHI. However, in the proposed setup, the authors need to acquire four independent interferograms with two different polarization states to reconstruct Jones matrix components map from a sample, thus the properties of PS-DHI are not fully exploited. In the published work, an in-plane switching liquid-crystal display (IPS-LCD) was characterized. However, the same approach can be used to feature also other types of LCDs—for example, full RGB channels of LCD pixels can be characterized in terms of their Jones matrix components using a DH setup with multiple lasers or in spectroscopic modality.
An LC depolarizer was characterized using PS-DHI with the scheme reported in Figure 5b by Dou et al. [47]. In this case, the LC depolarizer consists in a collection of HWPs with optical axes randomly distributed and the Stokes parameters distribution of the output beams for a linear incident polarized beam with θ = π/4 and for left-handed circularly polarized incident beam were measured, confirming the depolarizing effect induced by LC [47].
Regarding nanophotonics applications, images obtained with DHI have the disadvantage of being limited by the diffraction limit and, thus, a device in the nanometres size typically covers just a few camera pixels leading to a low resolution. On the other hand, a full field radiation pattern (i.e., polarization, amplitude, and phase) measurement at all angles gives a complete polarizability tomography of nanophotonic devices such as metasurfaces and nanoantennae. For this reason, Röhrich et al. [53] have combined Fourier microscopy, polarimetry, and digital holography, generating a signal over an entire CCD chip, for angle-resolved amplitude, polarization, and phase imaging of single nano-objects. In particular, the authors analyzed the orbital angular momentum (OAM) content of light scattered by a family of plasmonic spirals. In Figure 7 results obtained in Ref. [53] are summarized; the intensity radiation distribution is recorded by a Fourier microscope (Figure 7a—logarithmic scale). Then, the Stokes parameters are determined by polarization-resolved imaging; these parameters completely define the SoP of the wavefront for each wave vector in the radiation pattern and, consequently, can be transformed in the polarization ellipse parameters—namely, the ellipticity and the orientation angles (Appendix A, Equation (A5)). The evaluated ellipse parameters are shown in Figure 7b and a complete helicity conversion in a doughnut-like pattern with five spiraling arms around it can be observed. Finally, by using DHI the individual phase profiles of two orthogonally polarized field components were retrieved; in Figure 7c the representation in the Fourier transform domain of a hologram corresponding to an m = −5 spiral in circular co-polarization is reported, while in Figure 7d the two evaluated phase maps related to the co- and cross-polarized channel are shown and for this latter channel, the helical shape around the optical axis is clearly visible. As suggested by Röhrich et al. [53], this approach can be applied to several nanophotonics problems such as plasmonic oligomer antennae for emission and sensing, metasurfaces for monitoring wavefronts (transmitted and reflected) as a function of the incident amplitude, phase and vector contents, and nonlinear metasurfaces whose efficiency and angular distribution depend on the phase gradients structured in the metasurface geometry.

3.2. Biological

The order of molecular architecture can play a role in the dependence of the refractive index on the polarization and propagation direction of the optical beam. Indeed, the anisotropy of the refractive index, i.e., birefringence, could be related to the presence of filament arrays and/or membranes (made of a lipid bilayer that exhibits some degree of orientation) included in organelles and cells. Several pathological modifications, due, for example, to physical damage or disease such as cancer, may modify optical properties of biological tissues by altering their structure and, thus, leading to a change in their birefringence pattern [54,55,56]. Therefore, the detection of these modifications could become a valuable tool to identify the molecular order, follow events, and diagnose diseases. Typically, the characterization of birefringence is carried out by using quantitative polarized light microscopy [57,58,59], polarimetry [60,61,62,63], and experimental determination of the Müeller matrix [64,65,66]. Since these techniques require the acquisition of several images to retrieve the birefringence of the sample, they appear too slow for living semi-transparent biological sample imaging.
For this reason, PS-DHI may have a good chance of being used as a label-free and fast technique (only one acquired image) for the study of the SoP of biological samples. However, this technique has started to be used for biological imaging only in the last few years; therefore, the scientific papers on this field of application present in the literature are still a low number. For example, Wang et al. [67] studied the birefringence distribution of biological tissues by using polarization-dependent phase-shifted holograms. Even if the authors used a setup based on a modified Mach–Zehnder interferometer, which allows the recording polarization holograms by rotating a polarizer and so requiring multiple acquisitions, this approach takes advantage by DH and, thus, can be exploited to have only one image acquisition. Interestingly, the results demonstrated that the median birefringence value of cancerous bladder tissues is higher than that of the normal bladder tissues. Hence, this approach can be effectively used to discriminate between cancerous and non-cancerous tissues.
PS-DHI in a configuration similar to that shown in Figure 1 has also been used to distinguish among three different B-leukemia transformed cell lines, providing a diagnosis method of acute lymphoblastic leukemia type B, a cancer with a high mortality rate that affects B lymphocytes [68]. The same approach has been applied also to human sperm cells [30]. In fact, in normal morphological human sperm cells heads, due to longitudinally oriented protein filaments, there is a strong birefringence [69]. When the acrosome reaction occurs, i.e., spermatozoa are ready to approach the egg, the local protein organization disaggregates and, as a consequence, there is a variation in the intrinsic birefringence properties. In fact, reacted spermatozoa show a partial head birefringence, typically in the post-acrosomal region [70]. In the paper published by De Angelis et al. [30], PS-DHI is proposed in a configuration combined with Raman spectroscopy (RS) for a complete, accurate and label-free estimation of the biological proprieties of fixed air-dried sperm. Indeed, PS-DHI provides quantitative information on the cell morphology, motility and SoP [8,71], whereas the RS technique gives complementary specific biochemical fingerprint of the sample, without harming the integrity of live specimens [72]. In Figure 8a,b, the amplitude parameter β and phase difference Δφ relative to a control sperm cell and to reacted sample retrieved by PS-DHI are reported. It is evident that Δφ map shows a birefringence distribution (bright pattern) over all the sperm head in the control sperm cell, while the Δφ map for reacted sperm cell presents a reduction of the birefringent distribution, that is confined in the post-acrosomal area. The acrosome reaction was induced by a heparin treatment. A statistical analysis of the distribution of birefringence patterns of sperm from three donors exposed to heparin for 0 h (control sample) and 4 h (reacted sample) was performed, and the results are resumed in Figure 8c. By combining PS-DHI and RS, the authors proposed a new fully label-free protocol for the recognition of healthy and reacted sperm cells. In detail, sperm cells with a head entirely birefringent are selected by PS-DHI, assuring their integrity; then, the heparin treatment was performed on these chosen spermatozoa to induce the acrosome reaction. Finally, the effectively reacted spermatozoa are selected by estimating again their polarization state by the PS-DHI combined with the study of their Raman spectra. This interesting combined approach leads to the identification of spermatozoa in which the modification in their birefringence distribution is imputed only to the acrosome reaction, while those in which this variation is correlated with defects are not considered [30].
In 2019, Gordon et al. [73] proposed a proof of concept of a holographic fiberscope that allows producing full-field images of amplitude and quantitative phase in two polarizations, using a novel parallelized transmission matrix approach. The polarimetric imaging of birefringent and deattenuating samples was carried out to verify the feasibility of this approach. Due to their small diameter and high flexibility, imaging through optical fibers is already implemented in biomedical endoscopy and industrial inspection. Therefore, the introduction of a holographic fiberscope for birefringence measures appears very interesting for biological applications and remote sensing.
An application worthy of note is that studied by Öhman et al. [74,75]. They developed a dual-view polarization-resolved digital holographic systems for particle tracking [74] as well as for define if a particle has a spherical shape or not and to estimate its size [75]. This novel system allows to image the same volume from two perpendicular directions, giving information about the amplitude ratio angle β from two views. The authors found that the size of a non-spherical particle can be estimated from β with an upper limit of about nm. This approach could be very useful to detect and distinguish different particles, including biological particles, under different flow conditions by estimating their polarization response.
Finally, the instantaneous (single-shot) measure of the spatial variations of the phase retardance induced in either geometric or dynamic phase is carried out through an alternative approach presented in Ref [76], where a quantitative fourth-generation optics microscopy (Q4GOM) has been developed; even though this approach doesn’t characterize the full SoP, thanks to its unique optical performance, it can open new research in diagnosis of optical composite nanostructures or biomolecular sensing. The phase restoration is based on the self-interference of optical wave and is achieved in an intrinsically stable common-path setup. Basically, in the live cell imaging an add-on fourth-generation (4G) optics imaging module is combined to a polarization adapted interference microscope, as shown in Figure 9a. A light linearly polarized in the same direction of the azimuth of the compensating quarter-wave plate QWP1 and obtained by the input polarizer P1, enters in a Mirau microscope objective (MMO) by the beam splitter cube BS2. Therefore, the object (reflected from the sample) and reference (reflected from the reference mirror M) beams are orthogonally linear polarized after passing twice through QWP1 and QWP2 (see Figure 9b). Another quarter-wave plate (QWP3) transforms the orthogonal linear polarizations into L-state and R-sate circular polarizations. The light collimated by the MMO is focused by the tube lens TL, whose back focal plane corresponds to the input plane of the add-on 4G optics module. Here the L-state and R-sate circular polarizations images created in the sample and reference path overlap, and a polarization directed geometric-phase grating (GPG), with a spatial period Λ = 9 μm (corresponding to 2π rotation of the anisotropy axis) is positioned. The polarization state of the object and reference beams is changed from L-state to R-state circular polarization and vice versa by passing through the GPG, whereas the geometric phase changes as ±2φ, where φ is the periodic spatial change of the angular orientation of the anisotropy axis (see Figure 9c). This geometric-phase modulation leads to a tilt of the object and reference waves with the orthogonal circular polarizations in directions of +1st and −1st diffraction order with the mutual angle of 8° for the central wavelength. The polarizer P2 and the lens L2 give the polarization projection and the Fourier transform, respectively; then, the off-axis hologram is recorded on the CCD. By using an optical path difference compensator to the back focal plane of the lens L1, the length of the object and reference beams optical paths can be aligned, allowing the successfully use of the MMO in biological experiments using broadband light. The Q4GOM has been tested for quantitative imaging of diverse cells classes: human cheek cells, blood smear and spontaneously transformed rat embryonic fibroblast cells. As example, the images obtained for human cheek cells are reported in Figure 9d. Results are very impressive, since they demonstrated an accuracy well below 5 nm, opening new research directions in the quantitative retardance imaging of anisotropic biological samples [76].

4. Conclusions

PS-DHI is a flexible, useful development of DHI; indeed, only a few changes to the standard DH setup are required to obtain polarization-based imaging. However, innovative solutions were also developed. The requirement of a single-shot imaging and high processing speed significantly improve the operation of the measurement process making this approach more appropriate for real-time multiple analyses. Moreover, the full SoP and phase distribution for an arbitrary light field can be easily and quickly measured by PS-DHI based on the geometric phase.
In this context, this review paper presents a brief introduction to the basic principles underlying PS-DHI and an overview of some enhancements in its technology development. To the best of our knowledge, there are no other reviews on this topic. Therefore, it is our belief that this work could help researchers who work in this field. Even if PS-DHI is a fairly established research line (the first work proving its feasibility dates back to 1999 [17], while in the past 20 years, many works have been published to introduce improvements to the technique), there are currently only a few applications presented in the literature. Among these, the most promising are in the fields of microelectronics, photonics and biomedical imaging. Since it has been demonstrated with other more complex techniques that birefringence and, in general, SoP modification induced by biological and electronics samples can indicate their status (e.g., the healthy state of some cells [54,55,56,69,70] or the stress–strain induced in some materials [15,16]), and considering the achievements of PS-DHI in microelectronics, photonics, and biomedical imaging of the past few years, new technological developments, such as the use of quantum holography, which is a recent fascinating line of research, and new potential applications are expected in the next years.

Author Contributions

Conceptualization, M.A.F. and G.C.; investigation, M.A.F. and G.C.; data curation, M.A.F. and G.C.; writing—original draft preparation, M.A.F. and G.C.; writing—review and editing, M.A.F. and G.C.; supervision, M.A.F. All authors have read and agreed to the published version of the manuscript.

Funding

This research received no external funding.

Conflicts of Interest

The authors declare no conflict of interest. The funders had no role in the design of the study; in the collection, analyses, or interpretation of data; in the writing of the manuscript, or in the decision to publish the results.

Appendix A

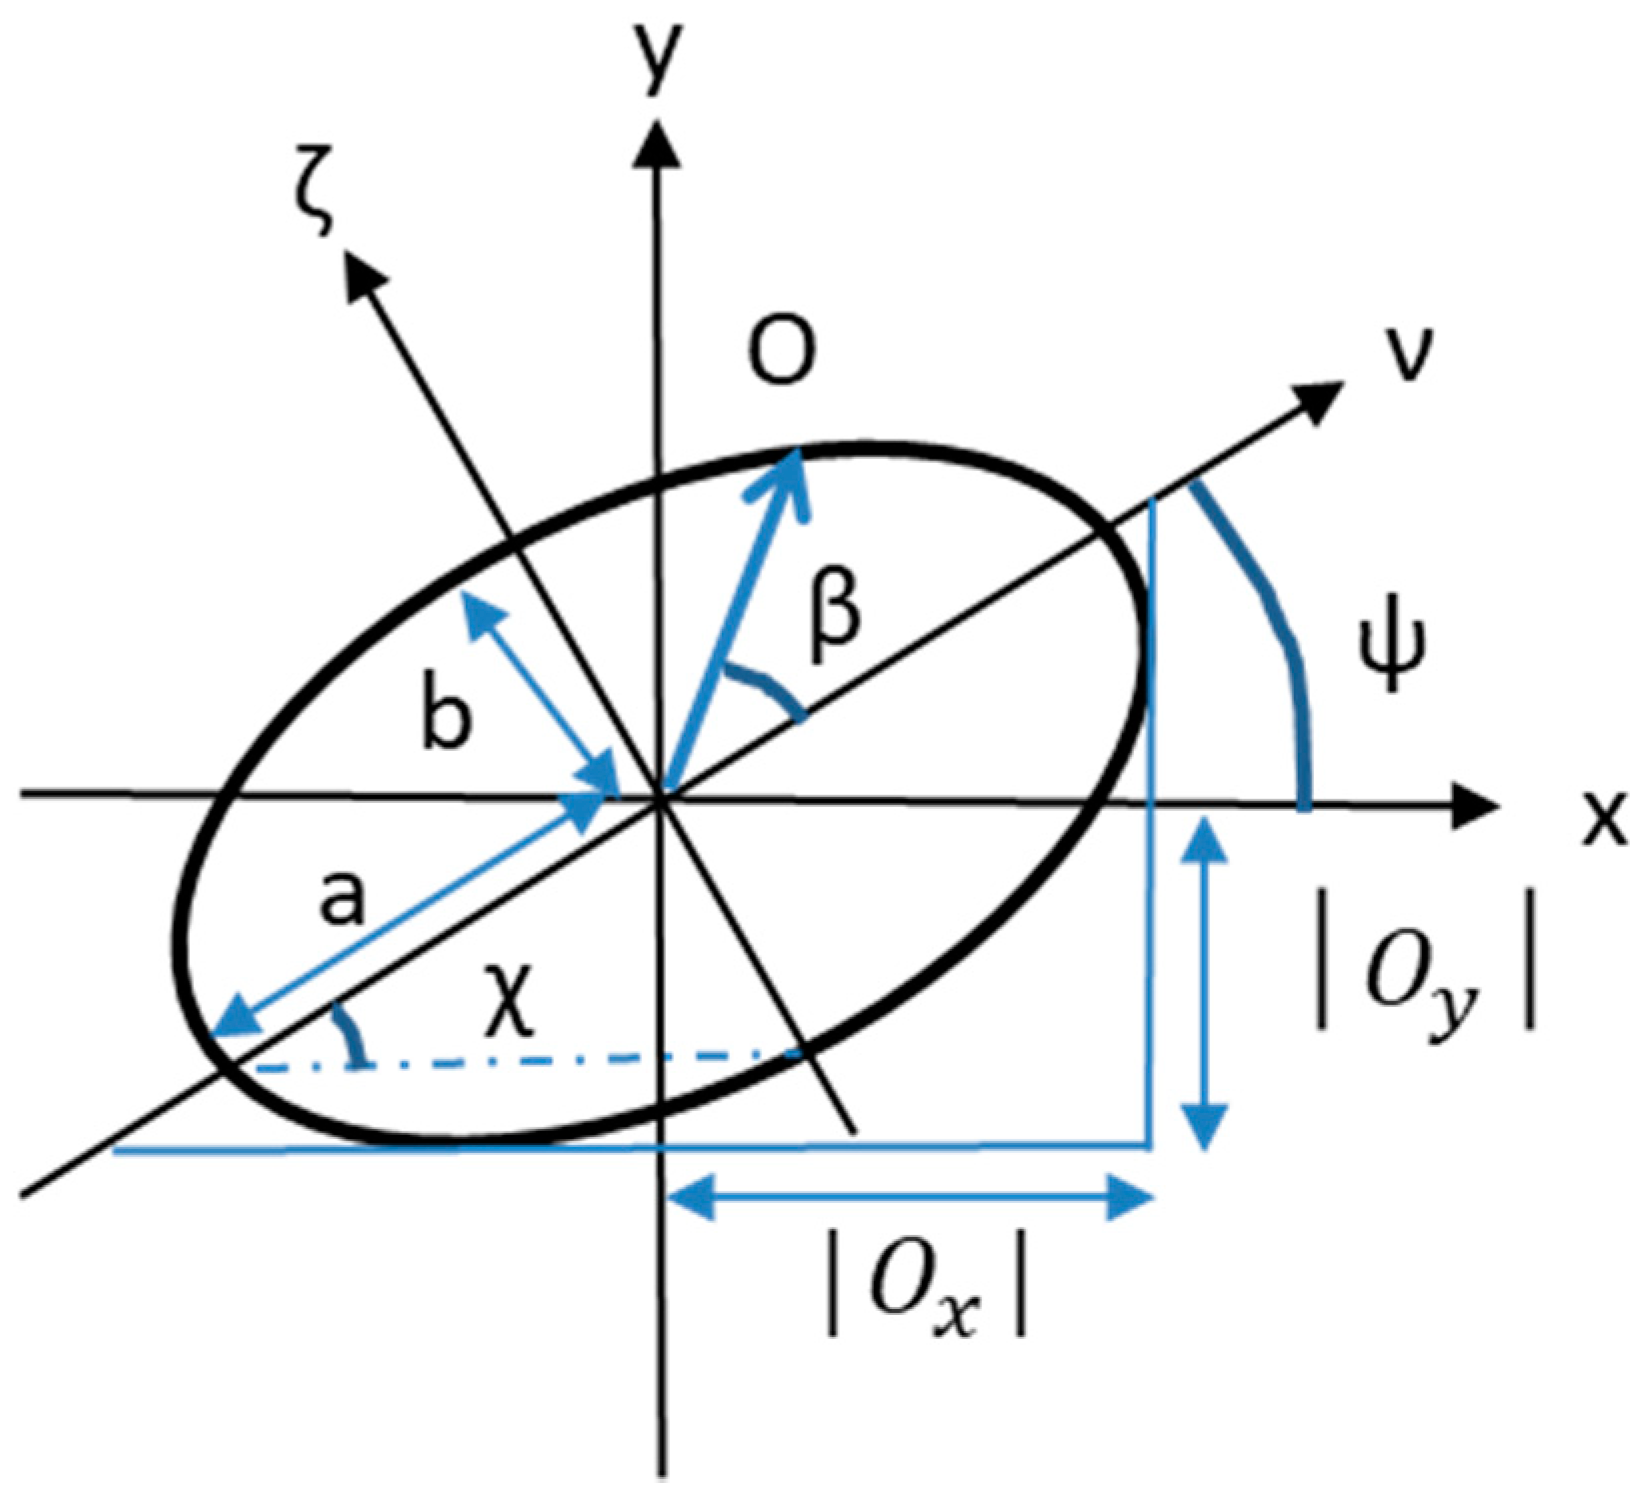
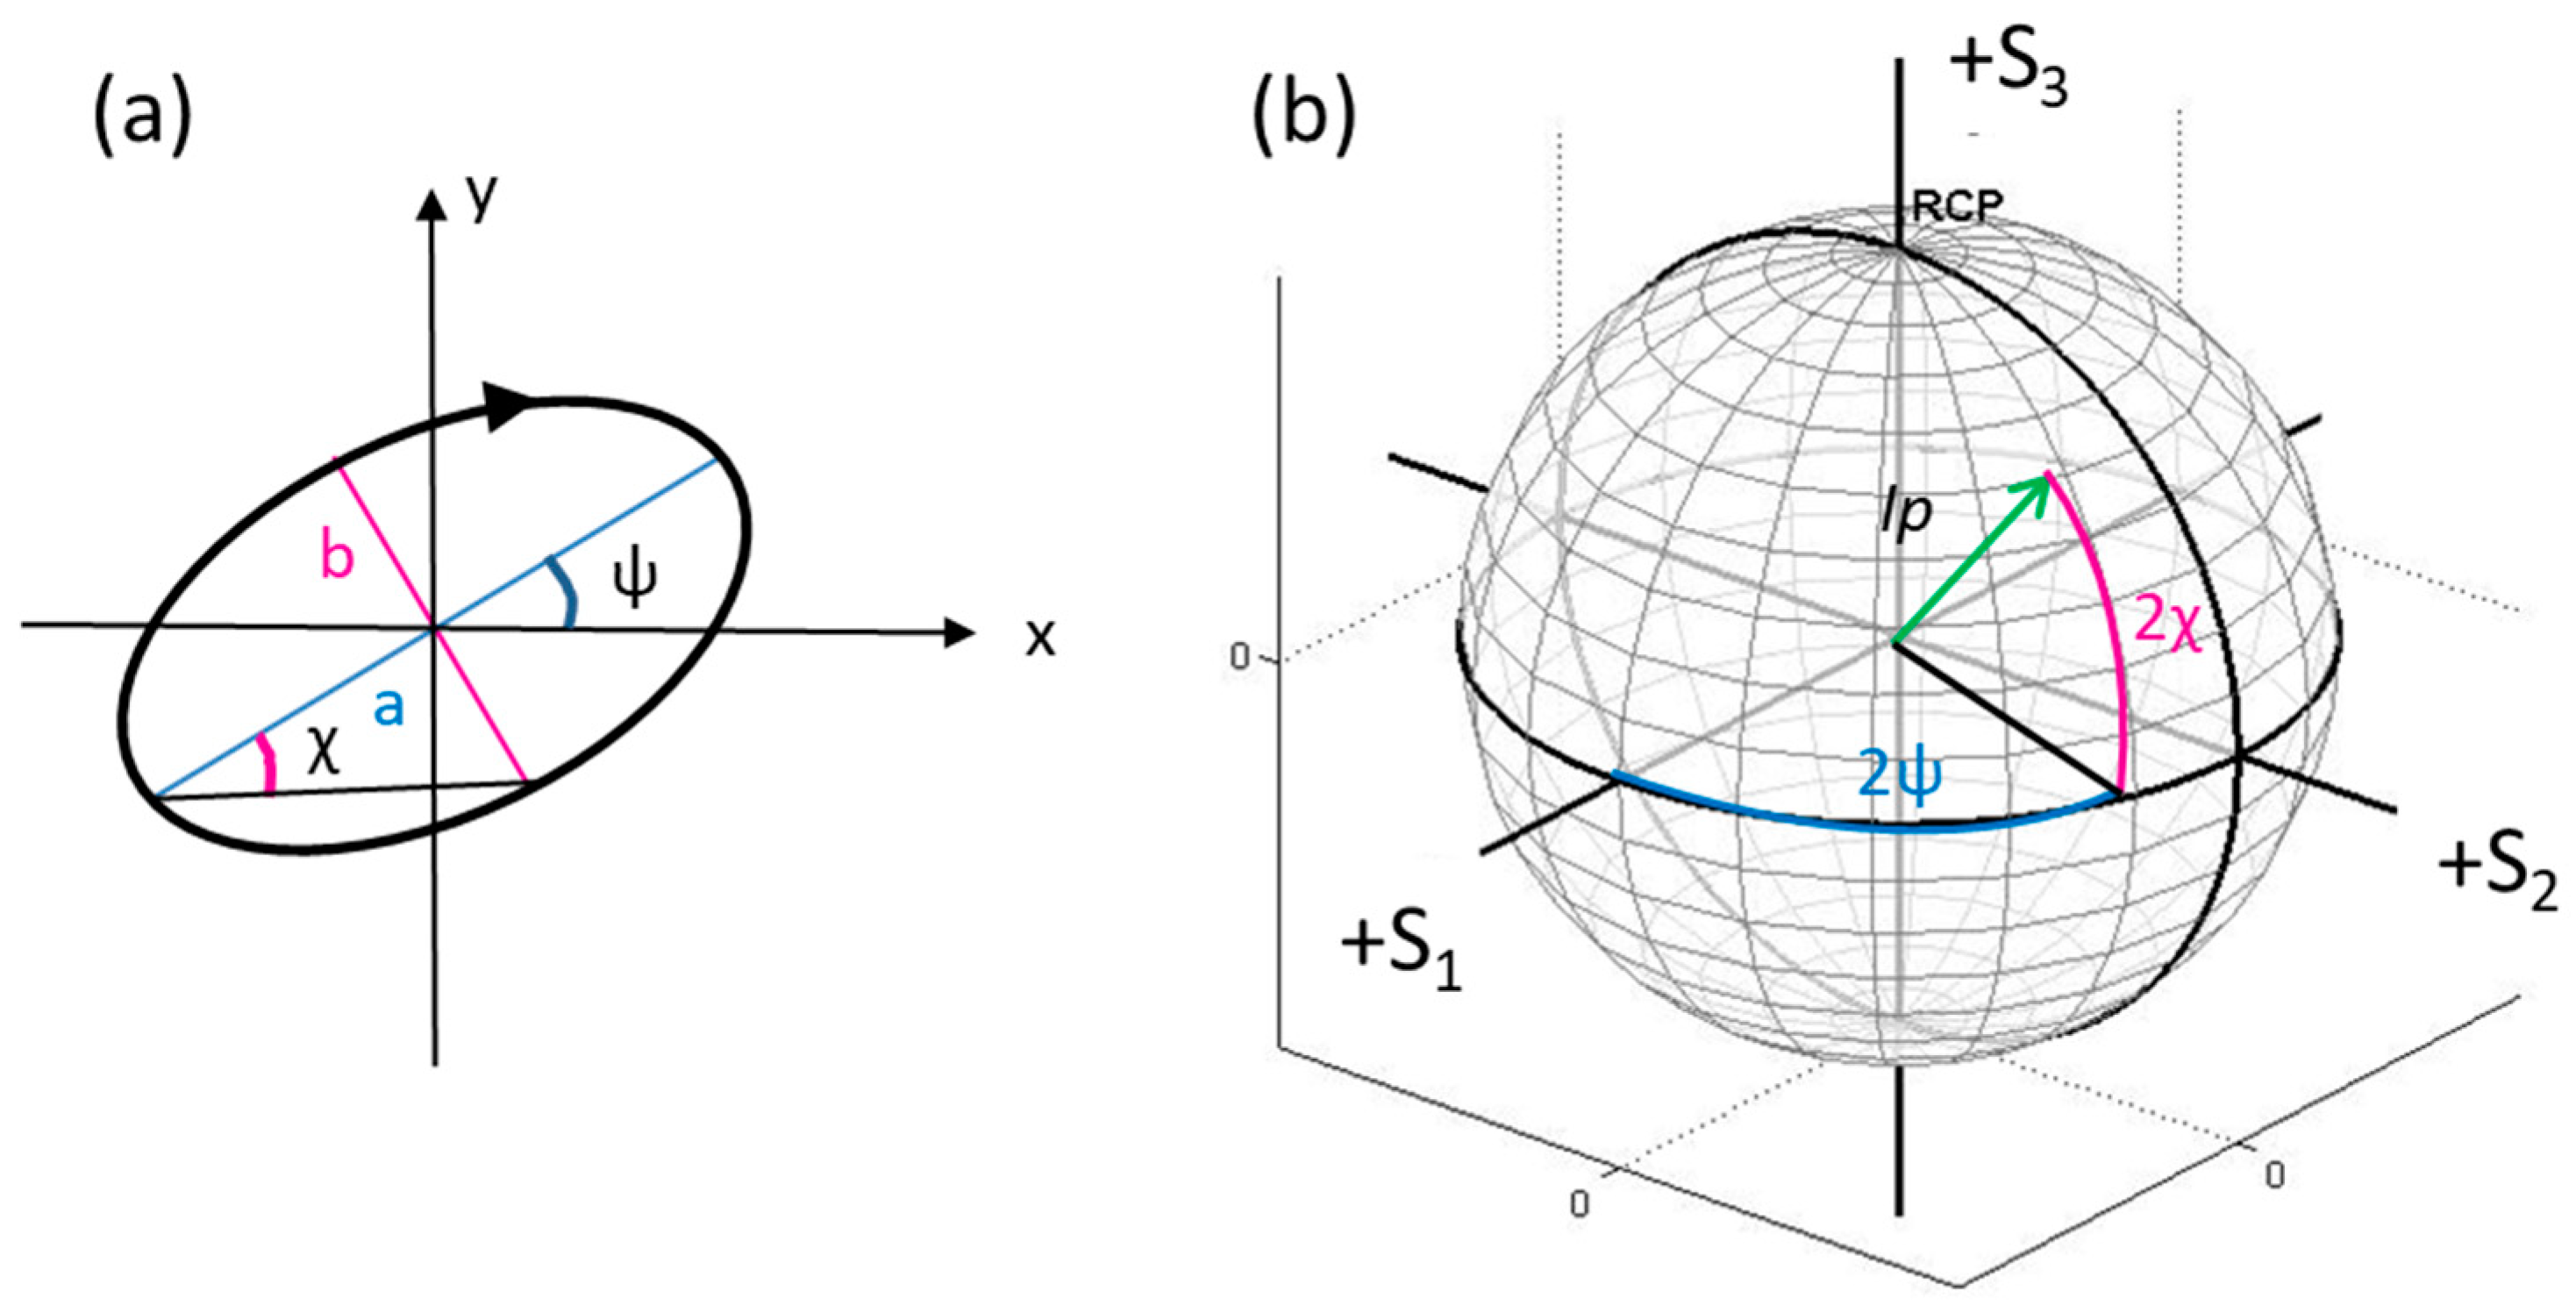
Polarization of Light

Polarization of light defines the geometrical orientation of the oscillations of electromagnetic waves. In a transverse wave, the oscillation is in the perpendicular direction respect to the direction of propagation of the beam. When the field vector components along the x and y directions generates a linear trajectory over the time, polarization is called linear, whereas when the tip of the field vector describes a circle or an ellipse in any fixed plane intersecting, and normal to, the direction of propagation, the polarization is classified as circular or elliptical, respectively. The rotation can occur in two possible directions: right circular polarization if the fields rotate in a right-hand sense with respect to the propagation direction, or left circular polarization if the fields rotate in a left-hand sense. Polarization of light can be described with the following two different formalisms [77]:
  • Jones vector, evaluated by means of the Jones calculus, only applicable to light that is already fully polarized;
  • Stokes parameters, evaluated by means of the Müeller calculus, for a light that is randomly polarized, partially polarized, or incoherent.
Basically, in the Jones formalism, considering propagation along the z axis, the electric field can be written as E = Ex + Ey, where
( E x ( z , t ) E y ( z , t ) ) = ( A x cos ( ω t k z + δ x ) A y cos ( ω t k z + δ y ) ) = ( A x e i δ x A y e i δ y ) e i ( ω t k z )
Here i is the imaginary unit. The components can be writing as a column vector, which is called Jones vector.
J = ( A x e i δ x A y e i δ y )
The state of polarization of an optical wave can be expressed in terms of the amplitudes (Ax, Ay) and the phase variations (δx, δy) of the x and y components of the electric field vector. Hence, the polarization state of a light beam is completely described by the complex amplitudes in Equation (A2). When a polarized wave with field vector E is incident on a polarization-changing object, the emerging wave has another polarization state E1 given by
( E 1 x E 1 y ) = ( j 11 j 12 j 21 j 22 ) ( E x E y )
where the 2 × 2 transformation matrix is called the Jones matrix. If the optical wave travels through different optical components, the resulting Jones vector can be evaluated by multiplying a cascade of Jones matrices to the input vector, JNJN-1J2J1E, where Ji represents the polarization properties of i-th element [78].
In the case of Stokes formalism, the polarization of light is described by four factors related to intensity and polarization ellipse parameters as described in Figure A1 and in the following equations:
S 0 = I S 1 = I p cos 2 ψ cos 2 χ S 2 = I p cos 2 χ S 3 = I p sin 2 χ
where Ip, 2ψ and 2χ are the spherical coordinates of the polarization state in the three-dimensional space for the S1, S2 and S3 parameters, I is the total intensity of the beam, and p is the degree of polarization given by S 1 2 + S 2 2 + S 3 2 S 0 , constrained by 0 ≤ p ≤ 1. Generally, normalized Stokes vector, obtained by normalizing to the total intensity S0, is used and the three significant Stokes parameters are plotted on a spherical region. The parameter S1 describes the dominance of linear horizontal polarized (LHP) light over linear vertical polarized (LVP) light; S2 describes the preponderance of linear +45° polarized (L + 45P) light over linear −45° polarized (L − 45P) light and S3 describes the dominance of right circular polarized (RCP) light over left circular polarized (LCP) light [79]. For pure polarization states, the normalized vector is situated on the Poincaré sphere with unity-radius, while in case of partially polarized states the normalized vector will be placed inside the unity radius Poincaré sphere at a distance of p from the origin.
Figure A1. (a) Polarization ellipse, showing the relationship to the Poincaré sphere parameters ψ and χ. In particular, the orientation angle ψ is the angle between the major axis of the ellipse and the x-axis along with the ellipticity ε = a/b, the ratio of the ellipse’s major to the minor axis (also known as the axial ratio). The ellipticity parameter is an alternative parameterization of the ellipticity angle, χ = arctan(b/a) = arctan(1/ε) [15,79]. (b) The Poincaré sphere is the parameterization of the last three Stokes’ parameters in spherical coordinates.
Applsci 10 04520 g0a1
The orientation and ellipticity angles, ψ and χ, associated with the polarization ellipse can be related to the Stokes parameters associated with the Poincaré sphere as follows [80]:
ψ = 1 2 tan 1 ( S 2 S 1 ) ,             0 ψ π χ = 1 2 sin 1 ( S 3 S 0 ) ,       π 4 χ π 4
Following the Müeller formalism, the Stokes components at the output of a given optical sample can be modelled as S′ = Msample S, where S and S′ are the input and output Stokes vectors, respectively, and M is the 4 × 4 Müeller matrix of the sample,
( S 0 S 1 S 2 S 3 ) = ( M 11 M 12 M 21 M 22       M 13 M 14       M 23 M 24 M 31 M 32 M 41 M 42       M 33 M 34 M 43 M 44 ) ( S 0 S 1 S 2 S 3 )
Similarly to the Jones calculus, when a polarized light wave passes through several optical objects, the polarization of the outgoing beam can be evaluated by knowing the Stokes vector of the input wave and applying Müeller calculus that needs a Müller matrix for each crossed optical object; the resulting vector contains the Stokes parameters of the light outgoing the system [80].

References

  1. Buraga-Lefebre, C.; Coetmellec, S.; Lebrun, D.; Ozkul, C. Application of wavelet transform to hologram analysis: Three–dimensional location of particles. Opt. Laser Eng. 2000, 33, 409–421. [Google Scholar] [CrossRef]
  2. Seebacher, S.; Osten, W.; Baumbach, T.; Jüptner, W. The determination of material parameters of microcomponents using digital holography. Opt. Laser Eng. 2001, 36, 103–126. [Google Scholar] [CrossRef]
  3. Xu, W.; Jericho, M.H.; Meinertzhagen, I.A.; Kreuser, H.J. Digital in-line holograph microspheres. Appl. Opt. 2002, 41, 5367–5375. [Google Scholar] [CrossRef]
  4. Ferraro, P.; Grilli, S.; Alfieri, D.; De Nicola, S.; Finizio, A.; Pierattini, A.; Javidi, B.; Coppola, G.; Striano, V. Extended focused image in microscopy by digital holography. Opt. Express 2005, 13, 6738–6749. [Google Scholar] [CrossRef]
  5. Ferraro, P.; Grilli, S.; Coppola, G.; Javidi, B.; De Nicola, S. How to Extend Depth of Focus in 3D Digital Holography. Proc. SPIE Three-Dimensional TV Video Display IV 2005, 6016, 60160I. [Google Scholar] [CrossRef]
  6. Nazarathy, M.; Shamir, J. Fourier optics described by operator algebra. J. Opt. Soc. Amer. A 1980, 70, 150–151. [Google Scholar] [CrossRef]
  7. Cuche, E.; Marquet, P.; Dahlgren, P.; Depeursinge, C.; Delacrétaz, G.; Salathé, R.P. Simultaneous amplitude and quantitative phase-contrast microscopy by numerical reconstruction of Fresnel off-axis holograms. Appl. Opt. 1999, 38, 6994–7001. [Google Scholar] [CrossRef]
  8. Di Caprio, G.; El Mallahi, A.; Ferraro, P.; Dale, R.; Coppola, G.; Dale, B.; Coppola, G.; Dubois, F. 4D tracking of clinical seminal samples for quantitative characterization of motility parameters. Biomed. Opt. Express 2014, 5, 690–700. [Google Scholar] [CrossRef] [Green Version]
  9. Coppola, G.; Striano, V.; Ferraro, P.; De Nicola, S.; Finizio, A.; Pierattini, G.; Maccagnani, P. A non-destructive dynamic characterization of a micro-heater through a Digital Holography Microscopy. J. Microelectromech. Syst. 2007, 16, 659–667. [Google Scholar] [CrossRef]
  10. Dardikman-Yoffe, G.; Mirsky, S.K.; Barnea, I.; Shaked, N.T. High-resolution 4-D acquisition of freely swimming human sperm cells without staining. Sci. Adv. 2020, 6, eaay7619. [Google Scholar] [CrossRef] [Green Version]
  11. McReynolds, N.; Cooke, F.G.M.; Chen, M.; Powis, S.J.; Dholakia, K. Multimodal discrimination of immune cells using a combination of Raman spectroscopy and digital holographic microscopy. Sci. Rep. 2017, 7, 43631. [Google Scholar] [CrossRef] [Green Version]
  12. Ferrara, M.A.; De Angelis, A.; De Luca, A.C.; Coppola, G.; Dale, B.; Coppola, G. Simultaneous Holographic Microscopy and Raman Spectroscopy Monitoring of Human Spermatozoa Photodegradation. IEEE J. Sel. Top. Quantum Electron. 2016, 22, 5200108. [Google Scholar] [CrossRef]
  13. Ferrara, M.A.; De Tommasi, E.; Coppola, G.; De Stefano, L.; Rea, I.; Dardano, P. A New Imaging Method Based on Combined Microscopies. Int. J. Mol. Sci. 2016, 17, 1645. [Google Scholar] [CrossRef] [Green Version]
  14. Tuchin, V.V. Polarized light interaction with tissues. J. Biomed. Opt. 2016, 21, 071114. [Google Scholar] [CrossRef] [Green Version]
  15. Colomb, T.; Dahlgren, P.; Beghuin, D.; Cuche, E.; Marquet, P.; Depeursinge, C. Polarization imaging by use of digital holography. Appl. Opt. 2002, 41, 27–37. [Google Scholar] [CrossRef]
  16. Colomb, T.; Dürr, F.; Cuche, E.; Marquet, P.; Limberger, H.G.; Salathé, R.-P.; Depeursinge, C. Polarization microscopy by use of digital holography: Application to optical-fiber birefringence measurements. Appl. Opt. 2005, 44, 4461–4469. [Google Scholar] [CrossRef] [Green Version]
  17. Beghuin, D.; Cuche, E.; Dahlgren, P.; Depeursinge, C.; Delacretaz, G.; Salathe´, R.P. Single acquisition polarization imaging with digital holography. Electron. Lett. 1999, 35, 2053–2055. [Google Scholar] [CrossRef]
  18. Palacios, F.; Font, O.; Palacios, G.; Ricardo, J.; Escobedo, M.; Ferreira Gomes, L.; Vasconcelos, I.; Muramatsu, M.; Soga, D.; Prado, A.; et al. Phase and Polarization Contrast Methods by Use of Digital Holographic Microscopy: Applications to Different Types of Biological Samples. In Holography–Basic Principles and Contemporary Applications; Mihaylova, E., Ed.; InTech: London, UK, 2013; pp. 353–377. [Google Scholar]
  19. Kemao, Q.; Hong, M.; Xiaoping, W. Real-time polarization phase shifting technique for dynamic deformation measurement. Opt. Lasers Eng. 1999, 31, 289–295. [Google Scholar] [CrossRef]
  20. Umeda, N.; Iijima, H.; Ishikawa, M.; Takayanagi, A. Birefringence imaging with illumination mode near field scanning optical microscope. In Far- and Near-Field Optics: Physics and Information Processing; Jutamulia, S., Asakura, T., Eds.; SPIE digital library: Bellingham, WA, USA, 1998; Volume 3467, pp. 13–17. [Google Scholar]
  21. De Boer, J.F.; Milner, T.E.; van Gemert, M.J.C.; Nelson, J.S. Two-dimensional birefringence imaging in biological tissue by polarization-sensitive optical coherence tomography. Opt. Lett. 1997, 22, 934–936. [Google Scholar] [CrossRef] [PubMed] [Green Version]
  22. Everett, M.J.; Schoenenberger, K.; Colston, B.W., Jr.; Da Silva, L.B. Birefringence characterization of biological tissue by use of optical coherence tomography. Opt. Lett. 1998, 23, 228–230. [Google Scholar] [CrossRef] [PubMed]
  23. Oldenbourg, R.; Mei, G. New polarized light microscope with precision universal compensator. J. Microsc. 1995, 180, 140–147. [Google Scholar] [CrossRef] [PubMed]
  24. Bickel, W.S.; Bailey, W.M. Stokes vectors, Mueller matrices, and polarized scattered light. Am. J. Phys. 1985, 53, 468–478. [Google Scholar] [CrossRef]
  25. Laskina, A.; Laskina, V.; Ostrun, A. Beam shaping for holographic techniques. Proc. Spie Opt. Eng. Appl. 2014, 9200, 92000E. [Google Scholar] [CrossRef] [Green Version]
  26. Ohtsuka, Y.; Oka, K. Contour mapping of the spatiotemporal state of polarization of light. Appl. Opt. 1994, 33, 2633–2636. [Google Scholar] [CrossRef]
  27. Yang, T.D.; Park, K.; Kang, Y.G.; Lee, K.J.; Kim, B.-M.; Choi, Y. Single-shot digital holographic microscopy for quantifying a spatially-resolved Jones matrix of biological specimens. Opt. Express 2016, 24, 29302–29311. [Google Scholar] [CrossRef]
  28. Liu, X.; Yang, Y.; Han, L.; Guo, C.S. Fiber-based lensless polarization holography for measuring Jones matrix parameters of polarization-sensitive materials. Opt. Express 2017, 25, 7288–7299. [Google Scholar] [CrossRef]
  29. Kosmeier, S.; Langehanenberg, P.; von Bally, G.; Kemper, B. Reduction of parasitic interferences in digital holographic microscopy by numerically decreased coherence length. Appl. Phys. B 2012, 106, 107–115. [Google Scholar] [CrossRef]
  30. De Angelis, A.; Ferrara, M.A.; Coppola, G.; Di Matteo, L.; Siani, L.; Dale, B.; Coppola, G.; De Luca, A.C. Combined Raman and polarization sensitive holographic imaging for a multimodal label-free assessment of human sperm function. Sci. Rep. 2019, 9, 4823. [Google Scholar] [CrossRef] [Green Version]
  31. Colomb, T.; Cuche, E.; Montfort, F.; Marquet, P.; Depeursinge, C. Jones vector imaging by use of digital holography: Simulation and experimentation. Opt. Commun. 2004, 231, 137–147. [Google Scholar] [CrossRef]
  32. Shimomura, A.; Fukuda, T.; Emoto, A. Analysis of interference fringes based on three circularly polarized beams targeted for birefringence distribution measurements. Appl. Opt. 2018, 57, 7318–7324. [Google Scholar] [CrossRef]
  33. Berger, V.; Gauthier-Lafaye, O.; Costard, E. Photonic band gaps and holography. J. Appl. Phys. 1997, 82, 61–64. [Google Scholar] [CrossRef]
  34. Berry, H.G.; Gabrielse, G.; Livingston, A.E. Measurement of the Stokes parameters of light. Appl. Opt. 1977, 16, 3200–3205. [Google Scholar] [CrossRef] [Green Version]
  35. Azzam, R.M.A. Rotating-detector ellipsometer for measurement of the state of polarization of light. Opt. Lett. 1985, 10, 427–429. [Google Scholar] [CrossRef] [PubMed]
  36. Jellison, G.E. Four-channel polarimeter for time-resolved ellipsometry. Opt. Lett. 1987, 12, 766–768. [Google Scholar] [CrossRef] [PubMed]
  37. Williams, P.A. Rotating-wave-plate Stokes polarimeter for differential group delay measurements of polarization-mode dispersion. Appl. Opt. 1999, 38, 6508–6515. [Google Scholar] [CrossRef] [PubMed]
  38. Oka, K.; Kaneko, T. Compact complete imaging polarimeter using birefringent wedge prisms. Opt. Express 2003, 11, 1510–1519. [Google Scholar] [CrossRef]
  39. Liu, S.; Han, L.; Li, P.; Zhang, Y.; Cheng, H.; Zhao, J. A method for simultaneously measuring polarization and phase of arbitrarily polarized beams based on Pancharatnam-Berry phase. Appl. Phys. Lett. 2017, 110, 171112. [Google Scholar] [CrossRef]
  40. Qi, S.; Liu, S.; Li, P.; Han, L.; Zhong, J.; Wei, B.; Cheng, H.; Guo, X.; Zhao, J. A method for fast and robustly measuring the state of polarization of arbitrary light beams based on Pancharatnam-Berry phase. J. Appl. Phys. 2019, 126, 133105. [Google Scholar] [CrossRef]
  41. Pancharatnam, S. Generalized theory of interference and its applications. Proc. Ind. Acad. Sci. A 1956, 44, 247–262. [Google Scholar] [CrossRef]
  42. Berry, M.V. The Adiabatic Phase and Pancharatnam’s Phase for Polarized Light. J. Mod. Opt. 1987, 34, 1401–1407. [Google Scholar] [CrossRef]
  43. Milione, G.; Sztul, H.I.; Nolan, D.A.; Alfano, R.R. Higher-order Poincaré sphere, stokes parameters, and the angular momentum of light. Phys. Rev. Lett. 2011, 107, 053601. [Google Scholar] [CrossRef] [PubMed]
  44. Malhotra, T.; Gutiérrez-Cuevas, R.; Hassett, J.; Dennis, M.R.; Vamivakas, A.N.; Alonso, M.A. Measuring Geometric Phase without Interferometry. Phys. Rev. Lett. 2018, 120, 233602. [Google Scholar] [CrossRef] [PubMed] [Green Version]
  45. Hariharan, P. Optical Holography: Principles, Techniques and Applications, 2nd ed.; Cambridge University Press: New York, NY, USA, 1996; p. 406. [Google Scholar]
  46. Cuche, E.; Bevilacqua, R.; Depeursinge, C. Digital holography for quantitative phase contrast imaging. Opt. Lett. 1999, 24, 291–293. [Google Scholar] [CrossRef] [PubMed]
  47. Dou, J.; Xi, T.; Ma Jianglei Di, C.; Zhao, J. Measurement of full polarization states with hybrid holography based on geometric phase. Opt. Express 2019, 27, 7968–7978. [Google Scholar] [CrossRef] [PubMed]
  48. De Zela, F. The Pancharatnam-Berry Phase: Theoretical and Experimental Aspects. In Theoretical Concepts of Quantum Mechanics; Reza Pahlavani, M., Ed.; InTech: Rijeka, Croatia, 2012; pp. 289–312. [Google Scholar]
  49. Park, J.; Yu, H.; Park, J.-H.; Park, Y.K. LCD panel characterization by measuring full Jones matrix of individual pixels using polarization-sensitive digital holographic microscopy. Opt. Express 2014, 22, 24304–24311. [Google Scholar] [CrossRef]
  50. Dubois, F.; Requena, M.-L.N.; Minetti, C.; Monnom, O.; Istasse, E. Partial spatial coherence effects in digital holographic microscopy with a laser source. Appl. Opt. 2004, 43, 1131–1139. [Google Scholar] [CrossRef]
  51. Ahmad, A.; Dubey, V.; Singh, G.; Singh, V.; Mehta, D.S. Quantitative phase imaging of biological cells using spatially low and temporally high coherent light source. Opt. Lett. 2016, 41, 1554–1557. [Google Scholar] [CrossRef]
  52. Zhu, Z.; Shi, Z. Self-interference polarization holographic imaging of a three-dimensional incoherent scene. Appl. Phys. Lett. 2016, 109, 091104. [Google Scholar] [CrossRef]
  53. Röhrich, R.; Hoekmeijer, C.; Osorio, C.I.; Koenderink, A.F. Quantifying single plasmonic nanostructure far-fields with interferometric and polarimetric k-space microscopy. Light Sci. Appl. 2018, 7, 65. [Google Scholar] [CrossRef]
  54. Wolman, M. Polarized light microscopy as a tool of diagnostic pathology, a review. J. Histochem. Cytochem. 1975, 23, 21–50. [Google Scholar] [CrossRef] [Green Version]
  55. Chin, L.; Yang, X.; McLaughlin, R.A.; Noble, P.; Sampson, D. Birefringence imaging for optical sensing of tissue damage. In Proceedings of the IEEE Eighth International Conference on Intelligent Sensors, Sensor Networks and Information Processing, Melbourne, Australia, 2–5 April 2013; Volume 1, pp. 45–48. [Google Scholar] [CrossRef]
  56. Chen, H.W.; Huang, C.L.; Lo, Y.L.; Chang, Y.R. Analysis of optically anisotropic properties of biological tissues under stretching based on differential Mueller matrix formalism. J. Biomed. Opt. 2017, 22, 35006. [Google Scholar] [CrossRef] [PubMed]
  57. Van Turnhout, M.C.; Kranenbarg, S.; van Leeuwen, J.L. Modeling optical behavior of birefringent biological tissues for evaluation of quantitative polarized light microscopy. J. Biomed. Opt. 2009, 14, 054018. [Google Scholar] [CrossRef] [PubMed] [Green Version]
  58. Shin, I.H.; Shin, S.-M.; Kim, D.Y. New, simple theory-based, accurate polarization microscope for birefringence imaging of biological cells. J. Biomed. Opt. 2010, 15, 016028. [Google Scholar] [CrossRef] [PubMed] [Green Version]
  59. Low, J.C.M.; Ober, T.J.; Mckinley, G.H.; Stankovic, K.M. Quantitative polarized light microscopy of human cochlear sections. Biomed. Opt. Exp. 2015, 6, 599–606. [Google Scholar] [CrossRef] [PubMed] [Green Version]
  60. Swami, M.K.; Manhas, S.; Buddhiwant, P.; Ghosh, N.; Uppal, A.; Gupta, P.K. Polar decomposition of 3 × 3 Mueller matrix: A tool for quantitative tissue polarimetry. Opt. Express 2006, 14, 9324–9337. [Google Scholar] [CrossRef]
  61. Ghosh, N.; Vitkin, I.A. Tissue polarimetry: Concepts, challenges, applications, and outlook. J. Biomed. Opt. 2011, 16, 110801. [Google Scholar] [CrossRef] [Green Version]
  62. Phan, Q.-H.; Lo, Y.-L. Stokes-Mueller matrix polarimetry system for glucose sensing. Opt. Lasers Eng. 2017, 92, 120–128. [Google Scholar] [CrossRef]
  63. Liu, W.-C.; Lo, Y.-L.; Phan, Q.-H. Circular birefringence/dichroism measurement of optical scattering samples using amplitude-modulation polarimetry. Opt. Lasers Eng. 2018, 102, 45–51. [Google Scholar] [CrossRef]
  64. Chipman, R.A.; Lu, S.Y. Interpretation of Mueller matrices based on polar decomposition. J. Opt. Soc. Am. A 1996, 13, 1106–1113. [Google Scholar]
  65. Jiao, S.; Yao, G.; Wang, L.V. Depth-resolved two-dimensional Stokes vectors of backscattered light and Mueller matrices of biological tissue measured with optical coherence tomography. Appl. Opt. 2000, 39, 6318–6324. [Google Scholar] [CrossRef] [Green Version]
  66. He, H.; He, C.; Chang, J.; Lv, D.; Wu, J.; Duan, C.; Zhou, Q.; Zeng, N.; He, Y.; Ma, H. Monitoring microstructural variations of fresh skeletal muscle tissues by Mueller matrix imaging. J. Biophotonics 2017, 10, 664–673. [Google Scholar] [CrossRef]
  67. Wang, J.; Dong, L.; Chen, H.; Huang, S. Birefringence measurement of biological tissue based on polarizationsensitive digital holographic microscopy. Appl. Phys. B 2018, 124, 240. [Google Scholar] [CrossRef]
  68. Coppola, G.; Zito, G.; De Luca, A.C.; Ferrara, M.A. Polarized Digital Holography as Valuable Analytical Tool in Biological and Medical Research. In Digital Holography and Three-Dimensional Imaging; OSA Technical Digest (Optical Society of America, 2019): Washington, DC, USA, 2019; paper Th4A.5. [Google Scholar] [CrossRef]
  69. Magli, M.C.; Crippa, A.; Muzii, L.; Boudjema, E.; Capoti, A.; Scaravelli, G.; Ferraretti, A.P.; Gianaroli, L. Head birefringence properties are associated with acrosome reaction, sperm motility and morphology. Reprod. Biomed. Online 2012, 24, 352–359. [Google Scholar] [CrossRef] [Green Version]
  70. Gianaroli, L.; Magli, M.C.; Ferraretti, A.P.; Crippa, A.; Lappi, M.; Capitani, S.; Baccetti, B. Birefringence characteristics in sperm heads allow for the selection of reacted spermatozoa for intracytoplasmic sperm injection. Fertil. Steril. 2010, 93, 807–813. [Google Scholar] [CrossRef] [PubMed]
  71. Coppola, G.; Di Caprio, G.; Wilding, M.; Ferraro, P.; Esposito, G.; Di Matteo, L.; Dale, R.; Coppola, G.; Dale, B. Digital holographic microscopy for the evaluation of human sperm structure. Zygote 2014, 22, 446–454. [Google Scholar] [CrossRef] [PubMed] [Green Version]
  72. Edengeiser, E.; Meister, K.; Bründermann, E.; Büning, S.; Ebbinghaus, S.; Havenith, M. Non-invasive chemical assessment of living human spermatozoa. RSC Adv. 2005, 5, 10424–10429. [Google Scholar] [CrossRef]
  73. Gordon, G.S.; Joseph, J.; Sawyer, T.; Macfaden, A.J.; Williams, C. Full-field quantitative phase and polarisation-resolved imaging through an optical fibre bundle. Opt. Express 2019, 27, 23929–23947. [Google Scholar] [CrossRef] [PubMed]
  74. Öhman, J.; Gren, P.; Sjödahl, M. Polarization-resolved dual-view holographic system for 3D inspection of scattering particles. Appl. Opt. 2019, 58, G31–G40. [Google Scholar] [CrossRef]
  75. Öhman, J.; Sjödahl, M. Identification, tracking, and sizing of nano-sized particles using dual-view polarization-resolved digital holography and T-matrix modeling. Appl. Opt. 2020, 59, 4548–4556. [Google Scholar]
  76. Bouchal, P.; Štrbková, L.; Dostál, Z.; Chmelík, R.; Bouchal, Z. Geometric-Phase microscopy for quantitative phase imaging of isotropic, birefringent and space-variant polarization samples. Sci. Rep. 2019, 9, 3608. [Google Scholar] [CrossRef] [Green Version]
  77. Perez, J.J.G.; Ossikovski, R. Polarized Light and the Mueller Matrix Approach, 1st ed.; CRC Press: Boca Raton, FL, USA, 2016; p. 405. [Google Scholar]
  78. Baumann, B. Polarization Sensitive Optical Coherence Tomography: A Review of Technology and Applications. Appl. Sci. 2017, 7, 474. [Google Scholar] [CrossRef]
  79. Collett, E. Field Guide to Polarization; SPIE Press: Bellingham, WA, USA, 2005; p. 148. [Google Scholar]
  80. Singh, D.K. Propagation of Light: A Review. Int. J. Res. Sci. Innov. 2017, IV, 70–74. [Google Scholar]
Figure 1. Basic scheme of the polarization-sensitive digital holographic imaging (PS-DHI) experimental setup. Abbreviations: M: mirrors; BS: beam splitter; PBS: polarized beam splitter; P: polarizer; QWP: quarter-wave plate; HWP: half-wave plate. In the inset, the incident directions and the polarization states of the object and reference waves are highlighted.
Applsci 10 04520 g001
Figure 2. (a) Example of polarization hologram; in the inset the two fringe patterns are highlighted; (b) Fourier amplitude spectra of the hologram: the frequencies of the zero-order of diffraction, of the virtual and real images, and of parasitic interferences (P) are clearly visible.
Applsci 10 04520 g002
Figure 3. Polarization ellipse. The ellipticity is given by the ratio of the length of the semiminor axis to the length of the semimajor axis, b/a = tan(χ). The ellipse is further described by its azimuth ψ, measured counterclockwise from the x axis [10].
Applsci 10 04520 g003
Figure 4. Representation of (a) the monolithic gratings, (b) interference of the diffracted beams, (c) monolithic gratings with the half-wave plate (HWP) and sample of birefringent medium, and (d) experimental setup designed for measuring birefringence distributions (Reproduced with permission from Shimomura et al. [32], © The Optical Society, 2018).
Applsci 10 04520 g004
Figure 5. Experimental setup for polarization measurement—(a) triangular common-path interferometer (TCPI). GTP: Glan–Taylor polarizer; BS1 and BS2: beam splitter; PCS: polarization conversion system; λ/4: quarter-wave plate; PBS: polarizing beam splitter; M: mirror; RT: reversed telescope; CCD: charge-coupled device. The elements inside the dashed box form a TCPI (Reproduced with permission from Qi et al. [40], AIP, 2019); (b) schematic of the PAMDH system based on the geometric phase. BE: beam expander; L: lens; P: polarizer; S: sample; HWP: half-wave plate; NPBS1-NPBS2: non-polarized beam splitters; PBS1-PBS2: polarized beam splitters; M1-M3: mirrors; NDF: neutral density filter; MO: microscope objective; TL: tube lens (reprinted from Dou et al. [47]).
Applsci 10 04520 g005
Figure 6. Theoretical model for estimating polarization state based on geometric phase (reprinted from Dou et al. [47]).
Applsci 10 04520 g006
Figure 7. Demonstration of combined Fourier microscopy, polarimetry, and digital holography. R-state circular polarized input and an m = −5 spiral nanostructure were used. (a) Fourier map of intensity; (b) reconstructed polarization ellipse parameters; (c) digital Fourier transform of an interferogram obtained with R-state circular polarized detection; (d) reconstructed phase maps for R-state and L-state circular polarized detection. The green and red arrows specify the input and output polarization, respectively (reprinted from Röhrich et al. [53]).
Applsci 10 04520 g007
Figure 8. (a) Amplitude parameter β and phase difference Δφ relative to a control sperm cell (0 h in heparin). Colorbars indicate the mapping of the phase variation. (b) The same polarization parameters measured for a reacted sample (4 h in heparin). (c) Distribution of birefringence patterns of sperm from three donors exposed to heparin for 0 h (control sample) and 4 h (reacted sample). Scale bar: 4 μm (adapted from De Angelis at al. [30]).
Applsci 10 04520 g008
Figure 9. Illustration of quantitative fourth-generation optics microscopy (Q4GOM). (a) Experimental setup using 4G optics module connected to microscope with a polarization adapted interference objective. P1: input polarizer; IL1, IL2: illumination lenses; MMO: Mirau microscope objective; BS1: pellicle beam splitter; QWP1, QWP2, QWP3: quarter-wave plates; M: reference mirror; BS2: beam splitter cube; TL: tube lens; GPG: geometric-phase grating; L1: first Fourier lens; P2: analyzer; L2: second Fourier lens; CCD: charged coupled device. (b) Polarization-adapted Mirau microscope objective (MMO) used for imaging of isotropic samples. (c) Polarization sensitive transformation of light by geometric phase grating. (d) The quantitative phase retardance imaging of human cheek cells. At the top a comparison of the quantitative phase imaging (left) and bright field image (right) of the marked area (adapted from Bouchal et al. [76]).
Applsci 10 04520 g009

