Article

Physicochemical and Antioxidant Properties of Potentilla anserina L. Polysaccharides Affected by Ultrasonication

1
College of Chemistry and Chemical Engineering, Northwest Normal University, Lanzhou 730070, China
2
Agricultural Product Storage and Processing Institute, Gansu Academy of Agricultural Sciences, Lanzhou 730070, China
3
Bioactive Products Engineering Research Center for Gansu Distinctive Plants, College of Life Science, Northwest Normal University, Lanzhou 730070, China
*
Authors to whom correspondence should be addressed.
Appl. Sci. 2020, 10(13), 4510; https://doi.org/10.3390/app10134510
Submission received: 11 June 2020 / Revised: 22 June 2020 / Accepted: 23 June 2020 / Published: 29 June 2020

Abstract

:
The effects of ultrasonic treatment on the physicochemical and antioxidant properties of Potentilla anserina L. polysaccharides (PAPs) were investigated. A Box–Behnken design (BBD) was applied to optimize the parameters of ultrasound-assisted extraction (UAE). A maximum yield of 9.43% was achieved at an extraction temperature of 66 °C, ultrasonic power of 205 W, and extraction time of 2.6 h. The chemical structure analyses illustrated that the two PAP extracts using UAE and hot water extraction (HWE) had the same monosaccharide composition but displayed a significant difference in the monosaccharide content, and the molecular weight of PAPUAE was significantly lower than PAPHWE. Fourier-transform infrared (FT-IR) spectroscopy confirmed that the ultrasonic treatment did not change the type of glycosidic bonds compared with HWE. In addition, the results from thermogravimetric analysis indicated that different extraction methods had effects on the physical properties of PAPs to some degree. Antioxidant activity assays demonstrated that PAPUAE had higher superoxide dismutase and glutathione peroxidase activities when cells were exposed to exogenous H2O2 than PAPHWE, and the malondialdehyde levels were also lowered following exposure to PAPUAE. These findings indicated that ultrasound irradiation is a promising technique for polysaccharide extraction from plant materials.

1. Introduction

Potentilla anserina L., a perennial herb of the Rosaceae family, is widely distributed in the Qinghai-Tibet Plateau areas of China. Its roots have been used as a functional food and in traditional Tibetan medicine [1]. Current literature indicates that the roots of P. anserina L. mainly contain a variety of biologically active components, such as polyphenols, tannins, flavonoids, triterpenes, and essential amino acids, especially polysaccharides [2]. Polysaccharides are considered important biological response regulators and their bioactivities have been widely studied, such as their antioxidant, anti-tumor, and immunostimulatory effects, as well as their antiviral and anti-diabetic activities. Antioxidant activity is one of the research hotspots in the polysaccharides field due to its positive effects on health. Researchers have also focused on preserving the structure of polysaccharides during extraction, which is crucial to maintaining its bioactivity [3,4,5].
Oxidative stress in the body is involved in aging and various diseases, including neurodegenerative diseases, physiological senescence, cardiovascular disease, and diabetes mellitus; therefore, protecting the body from oxidative damage is essential for health [6,7]. Many natural antioxidants from food sources can protect humans from health problems caused by oxidative damage [8]. Studies have shown that various plant polysaccharides generally possess antioxidant activity and can be explored as effective potential antioxidants against oxidation-related diseases [5]. P. anserina L. polysaccharides (PAPs) have strong antioxidant activities, and this work evaluated and compared the effect of ultrasonic treatment on the antioxidant properties of PAP [9].
The extraction method is an important factor for the use of active plant polysaccharides. Conventional extraction methods, such as Soxhlet extraction, heating reflux extraction, and hot water maceration, have several shortcomings, including being time-intensive, having a low efficiency and high energy consumption, and being environment unfriendly [10]. Ultrasound-assisted extraction (UAE) is extensively used in natural product extractions because it is a simple, inexpensive, rapid, and effective method that can enhance the yield, decrease the extraction time, and reduce the energy consumption [11,12]. Moreover, it can alter or improve the physical and chemical properties of extracted products, such as a decrease in molecular weight and the enhancement of antioxidant activity [13]. Up to now, many studies have demonstrated that UAE is a valid method for improving the bioactivities of polysaccharides [10,14]. Hence, in this study, UAE was used for the extraction of polysaccharides, where the power, temperature, and duration of ultrasonication were optimized using a Box–Behnken design (BBD). Furthermore, the physicochemical and antioxidant properties of polysaccharides obtained using ultrasound-assisted extraction (PAPUAE) and hot water extraction (PAPHWE) were evaluated and compared to determine the specific effects of ultrasonication.

2. Materials and Methods

2.1. Materials and Chemicals

P. anserina L. was grown in the Tibetan Autonomous Prefecture of Ganan, China, and authenticated by the Application and Development Institute of Herbal Medicinal Plants (Gansu, China). Standard glucose (Glu), mannose (Man), rhamnose (Rha), arabinose (Ara), galactose (Gal), lyxose (Lyx), and xylose (Xyl) were purchased from Sigma Chemical Co. (St. Louis, MO, USA). Dulbecco’s modified Eagle’s medium (DMEM) and trypsin were purchased from Gibco BRL (Grand Island, NY, USA). Malondialdehyde (MDA), glutathione peroxidase (GSH-Px), superoxide dismutase (SOD) kits, and H2O2 were purchased from Nanjing Jiancheng Biology Research Institute (Nanjing, China). Fetal bovine serum was obtained from Hangzhou Sijiqing (Hangzhou, China).

2.2. Extraction of PAP Polysaccharides

2.2.1. HWE Method

After cleaning, the entire roots of P. anserina L. were dried at 65 °C for 24 h using hot-air drying, ground to become ultra-fine, and passed through a 100-mesh sieve. The resulting powder was extracted with 85% (v/v) ethanol to remove free sugars, polyphenols, amino acids, and pigments. After removing the solvent, the pretreated samples were extracted twice with distilled water (ratio of liquid to solid = 22 mL/g) at 81 °C for 4 h each time. The collected supernatant was concentrated in a rotary evaporator under vacuum. It was then decolorized using macroporous adsorption resin (AB-8) and further deproteinized using the Sevage method with 1% papain (w/v) following our previously reported procedure [15]. The pre-sample was purified with dialysis bags (molecular weight cut off 10 kDa). Subsequently, the aqueous fraction was precipitated with ethanol (final concentration of 80% for 48 h) and the precipitate was freeze-dried. The total carbohydrate content of PAP was assayed via the phenol-sulfuric acid method using D-glucose as the standard sample [16]. The PAP sample was dissolved into ultrapure water to obtain a 0.1 mg/mL solution. After 1.00 mL of the PAP solution was accurately pipetted, a phenol-sulfuric acid reagent was added and the distilled water was used as a blank. The mixed solution was placed in a boiling water bath for 10 min, cooled in an ice bath for 2 min, and then placed at room temperature for 15 min. The absorbance at 490 nm was measured. The procedure was repeated three times.

2.2.2. UAE Method

The processing methods used for the raw materials and extraction procedures were the same as those described in Section 2.2.1. According to the designed conditions, the UAE of PAP was performed using an ultrasonic cleaner (KQ-250DE, Kunshan Ultrasound Instrument Co., Kunshan China). The extraction was carried out with three independent variables: ultrasonication temperature (40, 50, 60, 70, and 80 °C), ultrasonication time (1, 1.5, 2, 2.5, and 3 h), and ultrasonication power (120, 160, 200, and 240 W). When one factor was changed, the other factors were kept constant.
Based on the results of the single-factor experiments, a BBD assay was used to further optimize the extraction parameters. The ultrasonication temperature (A), power (B), and extraction time (C) were chosen as the independent variables. The range and actual levels of each factor are listed in Table 1. The response (Y) was the final polysaccharide yield.

2.3. Characterization of Polysaccharides

2.3.1. Fourier-Transform Infrared (FT-IR) Spectroscopy

FT-IR spectra were measured using the KBr disk method described in a previous report from our laboratory [17]. Briefly, more than 2 mg of dried polysaccharide was added to dry KBr powder, which was then homogenized and pressed into pellets for FT-IR analysis using a Nicolet iS10 instrument (Thermo Fisher, Pittsburg, PA, USA). All spectra were scanned in the range of 400–4000 cm−1 with a resolution of 4 cm−1, and the number of scans recorded was 16.

2.3.2. Molecular Weight Analysis

Size-exclusion chromatography combined with laser light scattering (SEC-LLS) was carried out using a triple-detection laser photometer (Dawn Heleos, Wyatt Technology, Santa Barbara, CA, USA) for multiangle light scattering (λ = 690 nm), an Optilab refractometer (Wyatt), and an Ultrahydrogel column (7.8 mm × 300 mm) (Waters, Bedford, MA, USA). The sample was dissolved in ultrapure water and filtered into the scattering cell through a 0.45 μm membrane. The injection volume was 50 μL and the flow rate was 0.5 mL/min. The refractive index increment (dn/dc) value was measured using the Optilab refractometer at 690 nm and 25 °C, and was found to be 0.147 mL/g.

2.3.3. Monosaccharide Composition Analysis

The monosaccharide composition was analyzed via gas chromatography-mass spectrometry (GC-MS) using the method previously reported by our laboratory [18]. Briefly, 20 mg of dried sample was hydrolyzed with 4 M trifluoroacetic acid at 120 °C for 10 h under nitrogen. Excess trifluoroacetic acid was removed, and then ammonium hydrochloride and pyridine were added at 90 °C for 30 min under nitrogen. The mixture was cooled to room temperature and acetic anhydride was added for the acetylation reaction. The acetylated derivatives were dissolved in chloroform and analyzed via GC-MS (Thermo electron, Milan, Italy) using a TR-5MS SQC capillary column (30 m × 0.25 mm × 0.25 μm). The carrier gas (helium) flow rate was 1.0 mL/min and the split ratio was 50:1. The temperature was set to increase from 120 to 250 °C with at 5 °C/min increments. Standard monosaccharides (glucose, mannose, galactose, xylose, arabinose, rhamnose, and lyxose) were treated in the same way as the samples.

2.3.4. Thermogravimetric (TGA) Analysis

TGA analyses were conducted using a Pyris Diamond Thermogravimetric analyzer (Perkin Elmer, Waltham, MA, USA). The samples (3 mg) were heated from 25 to 800 °C at the rate of 10 °C/min under a nitrogen atmosphere.

2.4. Antioxidant Activity Assays

2.4.1. Cell Culture and Experimental Group

The mouse macrophage cell line RAW264.7 was obtained from China Center for Type Culture Collection. RAW264.7 cells were cultivated at a density of 5 × 10⁴ cells/mL in DMEM medium supplemented with 10% fetal bovine serum at 37 °C and 5% CO2 for 24 h. Then, the medium was removed and the cells were treated with a new medium according to the different groups. The experimental cells were divided into three groups (n = 5 in each group) as follows: control group (RAW264.7 cells without any treatment), negative control group (cells incubated in the presence of 700 µM H2O2), and experimental group (cells incubated with 700 µM H2O2 and polysaccharide solutions at 0.1, 0.50, and 1.00 mg/mL). H2O2 was added to the cell culture medium 24 h before the polysaccharide addition).

2.4.2. Cell Viability Assay

Cell viability was measured using the Cell Counting Kit-8 (CCK-8) (Nanjing Jiancheng Biology Research Institute, Nanjing, China). RAW264.7 cells (4 × 10⁴ cells/well) were plated in 96-well plates. Then, CCK-8 at a final concentration of 10 μL/well was added to each well at 37 °C for 1 h. The optical density (OD) was then measured at a wavelength of 450 nm using a Multiskan Spectrum Microplate Spectrophotometer (Thermo, Vantaa, Finland). The cell viability of samples was represented as the percentage of cells that survived and was calculated as follows:
The   cell   survival   rate ( % ) = OD   Experiment / negative   control   group OD   Blank   control   group   OD   Control   group OD   Blank   control   group × 100 %

2.4.3. Measurement of MDA, GSH-Px, and SOD

Extracellular MDA production and intracellular SOD and GSH-Px activities were measured spectrophotometrically using the SOD, MDA, and GSH-Px kits. The RAW264.7 cells were placed in 24-well plates (2 × 10⁴ cells/well), sonicated on ice, and then collected. The GSH-Px, SOD, and MDA levels were determined using the colorimetric method following the manufacturerʹs protocol (Nanjing Jiancheng Bioengineering Institute, Nanjing, China).

2.5. Statistical Analyses

All data are expressed as mean ± standard deviation (SD). Statistically significant differences were evaluated via one-way analysis of variance (ANOVA) using the SPSS program (Version 19.0, SPSS Inc., Chicago, IL, USA), followed by Duncan’s test. Statistical significance was considered to be p < 0.05.

3. Results and Discussion

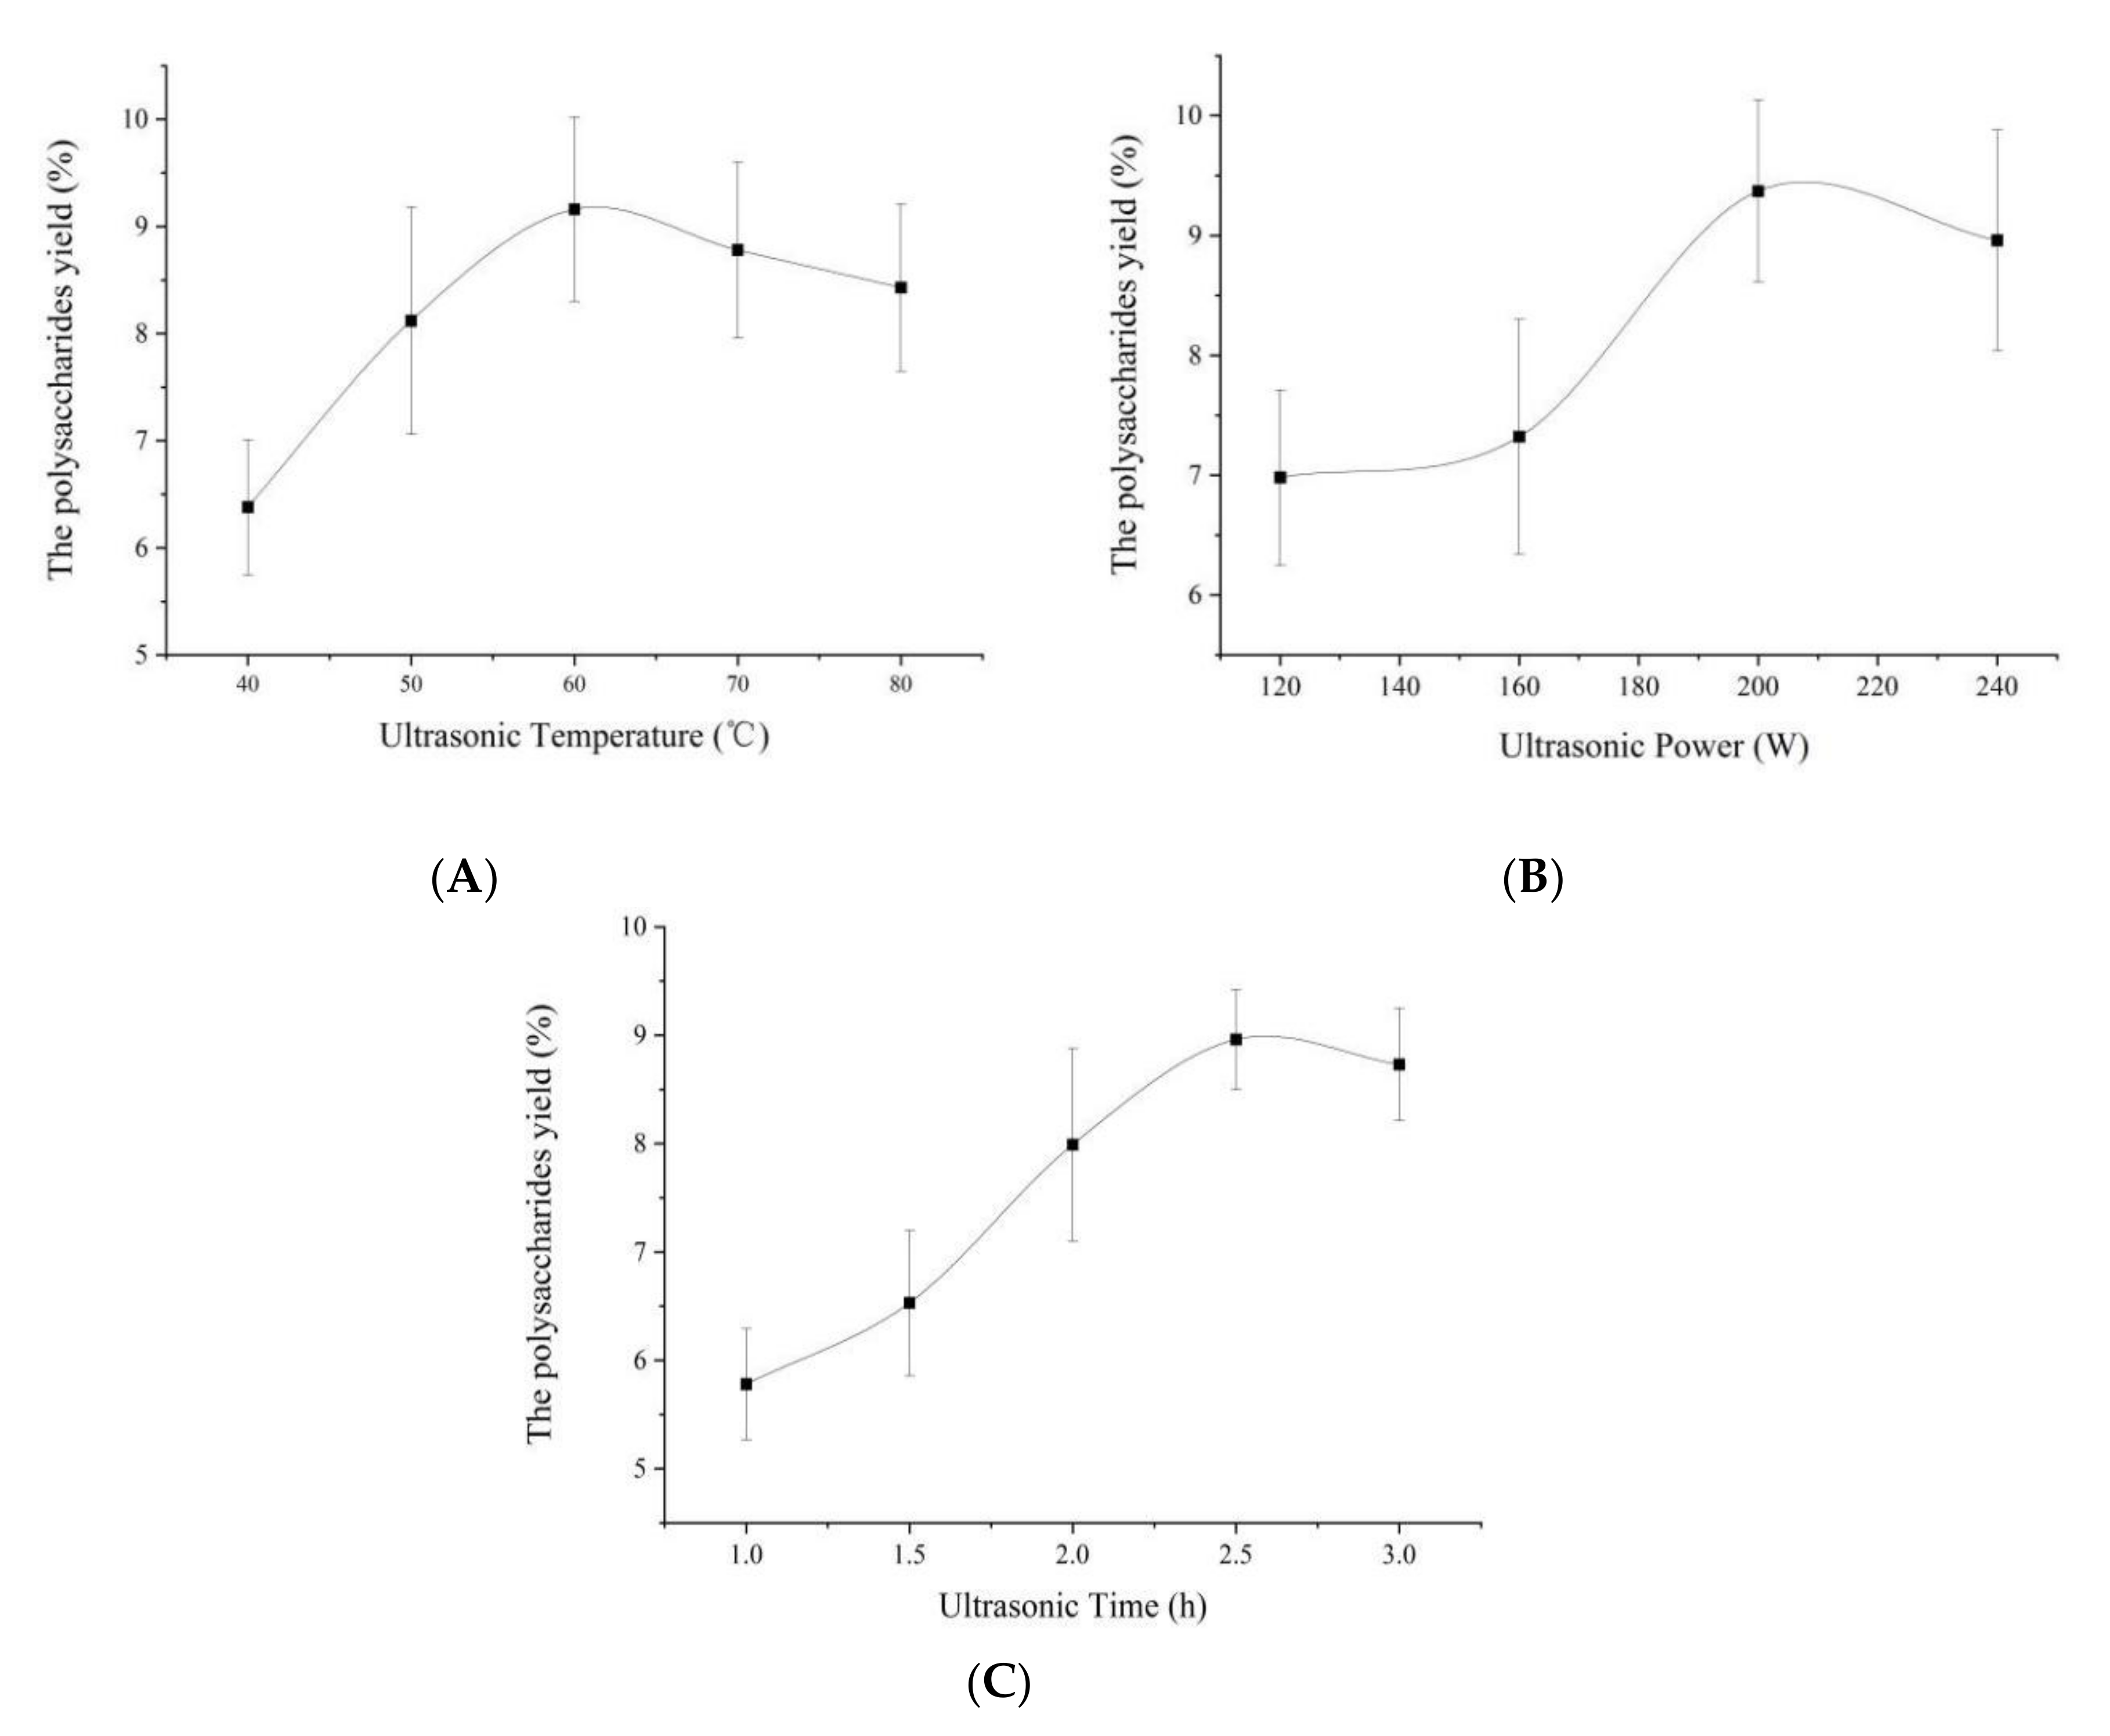
3.1. Single-Factor Experimental Analysis

In this experiment, the main UAE parameters influencing the polysaccharide yields, namely, ultrasonication temperature, power, and time, were evaluated. As shown in Figure 1A, the polysaccharides yield increased with an increase in the ultrasonication temperature in the range of 40 to 60 °C, and reached a maximum yield at 60 °C. However, there was a decrease in the yield of PAP when the temperature exceeded 60 °C, which might have been due to polysaccharide decomposition at higher temperatures. Therefore, the optimum extraction temperature was set at 60 °C. Alterations in the ultrasonication power generated a certain increase in yield, with the maximum yield being at 200 W. Above this level, the yield was not significantly changed; therefore, 200 W was chosen as the optimal ultrasonication power setting (Figure 1B). A similar trend was observed with the ultrasonication times. The yield rapidly increased from 1 to 2.5 h; therefore, 2.5 h was set as the optimal time (Figure 1C). High temperatures increased the solubility of the polysaccharides, which was conducive to the diffusion of polysaccharides from cells within a certain extraction period. With the increase of ultrasonic power, the intensity of acoustic cavitation increased, which may have promoted the wall-breaking effect and mass transfer. However, ultra-high temperatures, extended extraction times, and excessive ultrasonic power would lead to degradation of the polysaccharides [14].

3.2. Optimization of the Extraction Conditions Using BBD

3.2.1. Extraction Model and Statistical Analysis

Based on the results of the single-factor experiments, the extraction parameters were optimized using a BBD model. The results of 17 runs with 3 factors and 3 levels are shown in Table 2. The data was analyzed using Design-Expert V8.0.6.1 software (Stat-Ease Inc., Minneapolis, MN, USA). The polysaccharide yield and test variables were obtained using the following quadratic polynomial equation:
Y = 9.49 + 0.042 A + 0.11 B + 0.33 C + 0.076 AB 0.039 AC + 0.046 BC 1.09 A 2 0.64 B 2 0.54 C 2
where Y is the polysaccharides yield, A is the ultrasonication temperature, B is the ultrasonication power, and C is the ultrasonication time.
The results of the variance (ANOVA) for the experiments are presented in Table 3. The determination coefficient (R2 = 0.9830) and adjusted coefficient of determination (R2adj = 0.9612) illustrated that the regression model fits the data well and the model was highly significant in the range of the experimental variables. In addition, a low coefficient of variation (CV) of 1.90% indicated a high degree of precision and confirmed that the experimental values were reliable.
The F-values and p-values were also used to evaluate the significance of the regression model. The independent variables (C), quadratic terms (A2, B2, and C2) and cross product coefficient (AC) significantly affected the polysaccharide yield (p < 0.05). These results demonstrated that the ultrasonication time was the most important parameter influencing the extraction yield, followed by the ultrasonication power and temperature.

3.2.2. Response Surface Analysis

Three-dimensional response surfaces and two-dimensional contour plots were used to visualize the regression equations [19]. The 3D response surface explains the relationship between the dependent variables and the interaction between two test variables when the other factors are kept constant at a zero level [20]. The shape of the contour plots reflects the mutual interaction effects between the variables. A circular plot indicates an insignificant interaction, whereas an elliptical contour plot indicates significant influences by the test parameters [21].
The effects of ultrasonication temperature (A) and power (B) on the yield were determined when the time (C) was set at a zero level. The yield increased with the increase in temperature from 50 to 66 °C and the yield decreased when the temperature exceeded 66 °C (Figure 2A). The 2D contour plot (Figure 2B) indicated that the mutual interaction between A and B was not significantly influential. The effects of the ultrasonication temperature (A) and time (C) with ultrasonication power (B) fixed at a zero level showed significant yields in the 2 to 2.6 h range (Figure 2C). The mutual interaction between the ultrasonication temperature (A) and ultrasonication time (C) is shown in Figure 2D, which indicated their significant influence. The yields increased as the ultrasonication power (B) increased from 160 to 205 W and then decreased as the power increased further from 205 W to 240 W. The highest polysaccharide yield was achieved with a power setting of 205 W and ultrasonication duration of 2.6 h (Figure 2E). The 2D contour plot indicated a significant mutual interaction between power (B) and time (C) (Figure 2F).

3.2.3. Validation of the Model

To verify the suitability of the model equation, the optimum response values were used (66 °C, 205 W, and 2.6 h) for a test extraction. The average extraction yield was 8.97 ± 0.36%, which was similar to the predicted best extraction yield (9.17%). These results indicated that the model was adequate for polysaccharide extraction.

3.3. Characterization Analysis of PAPUAE and PAPHWE

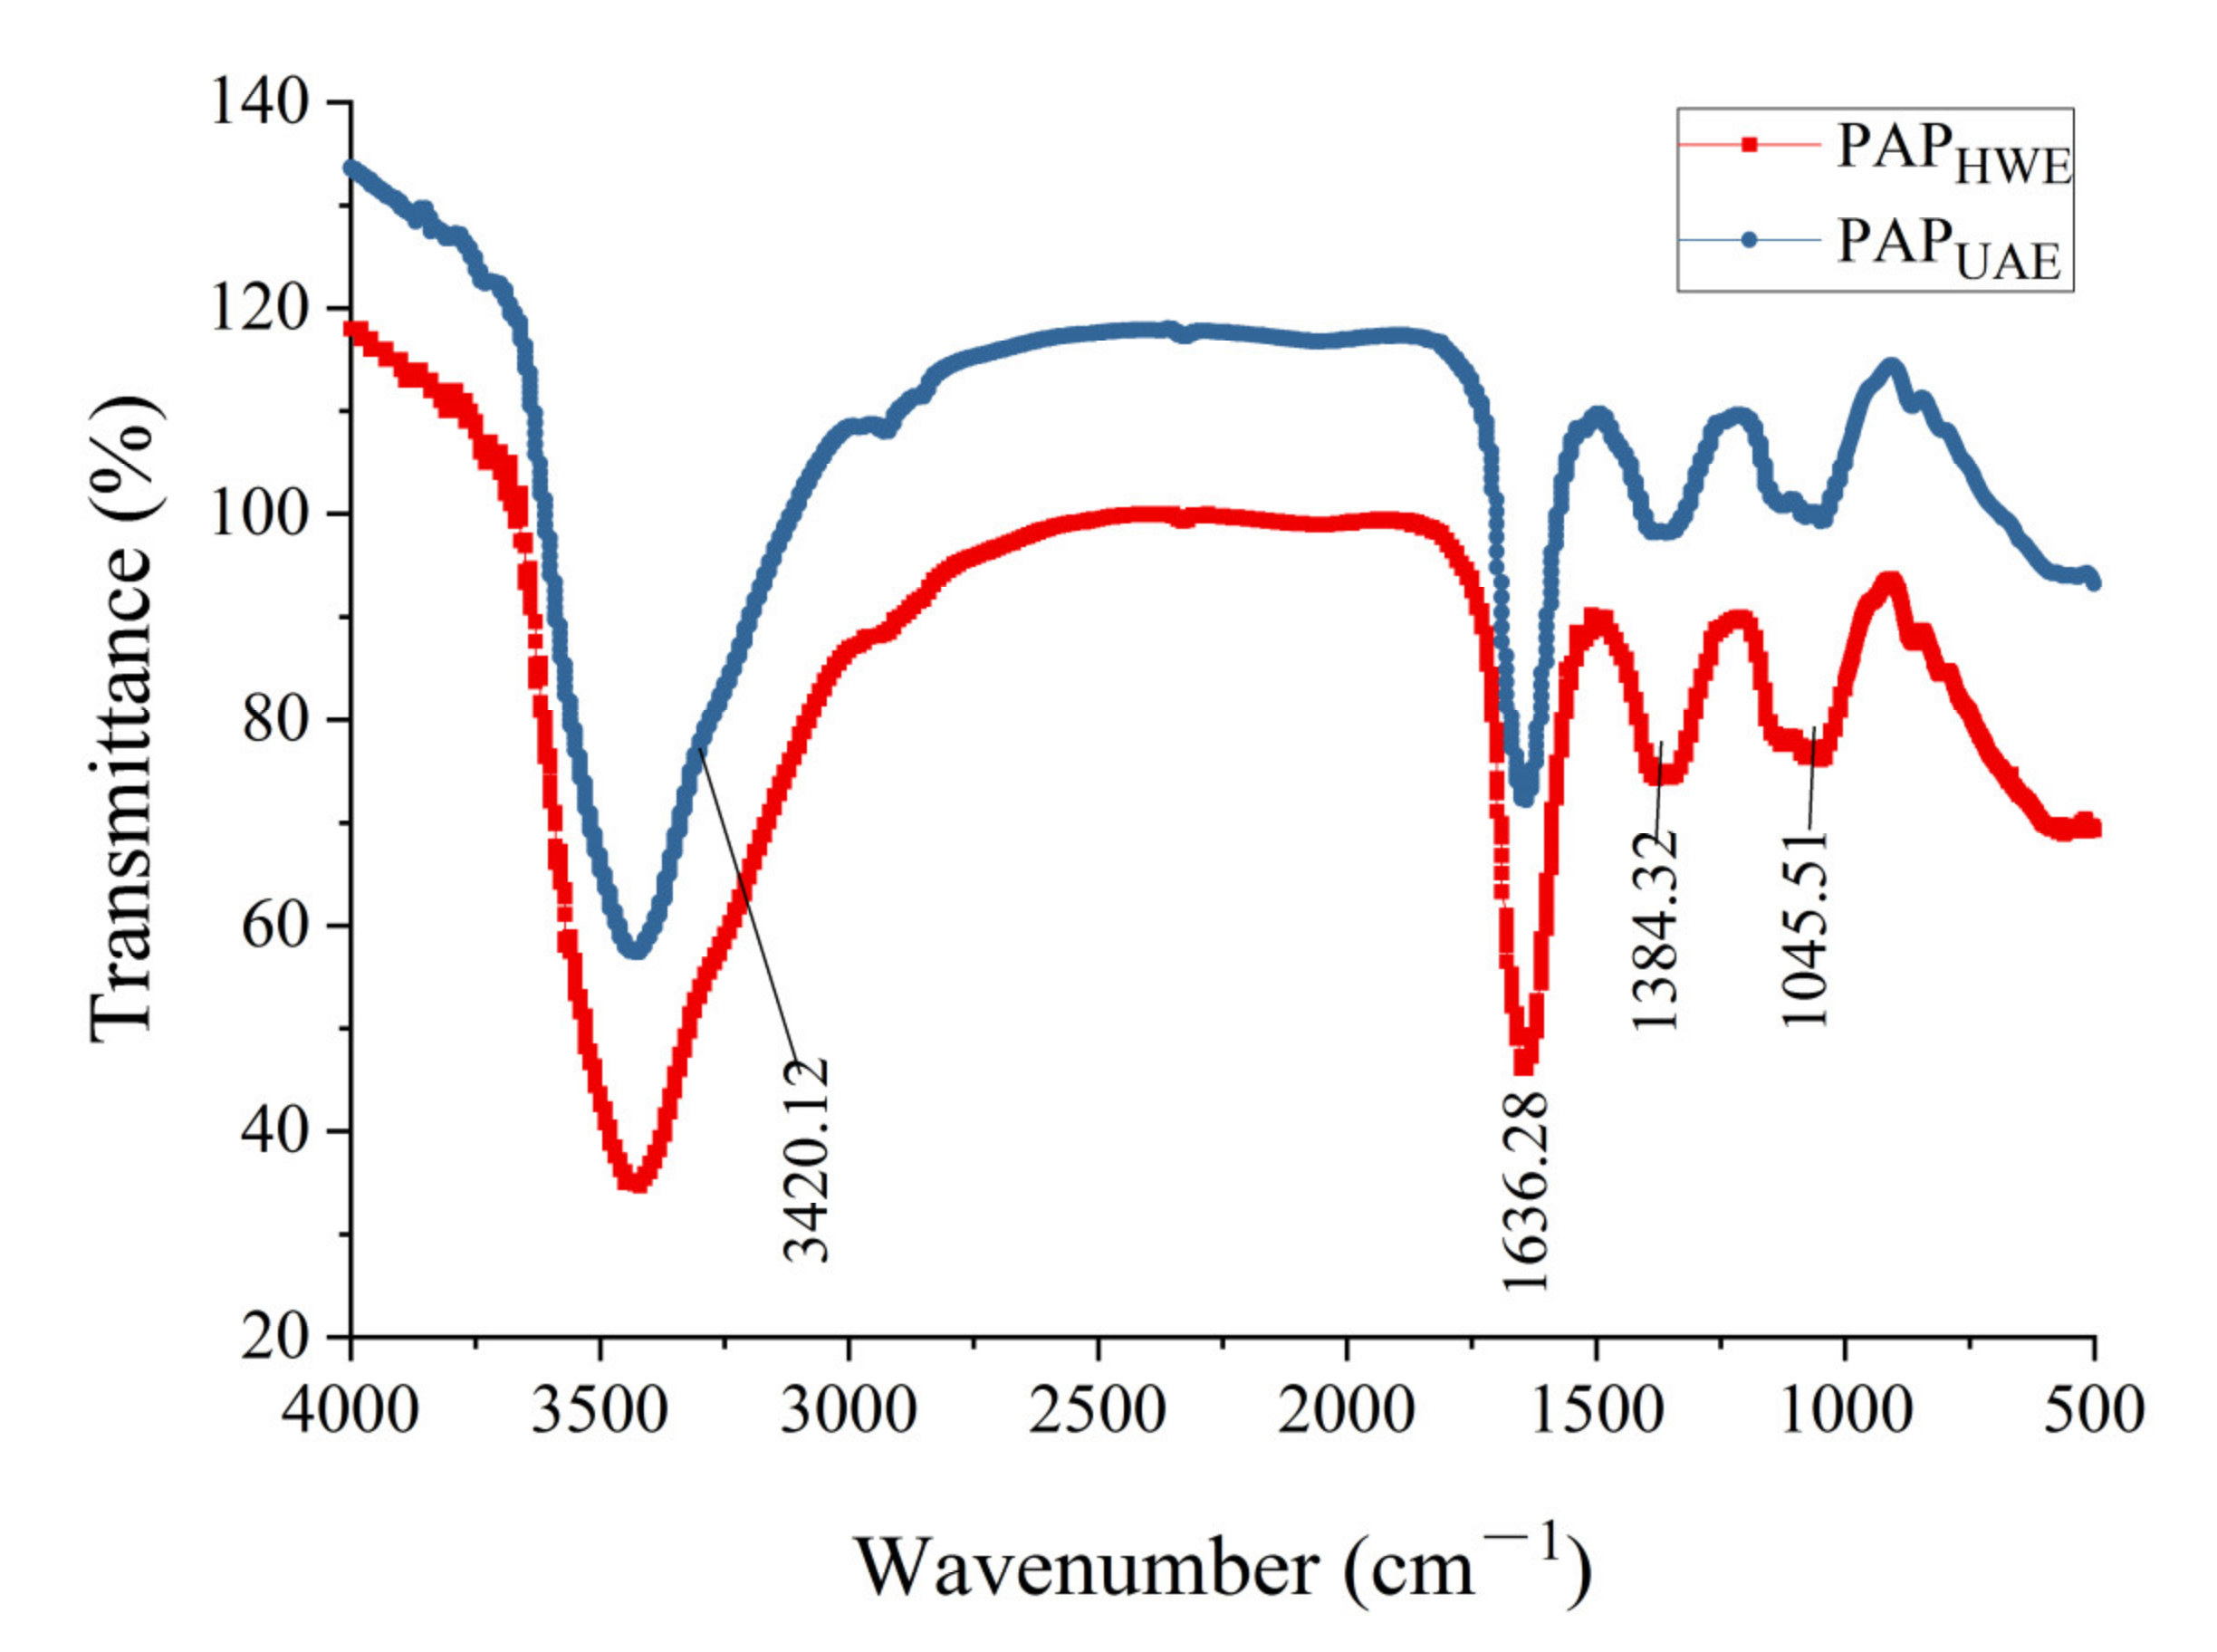
3.3.1. FT-IR Spectroscopy Analysis

The FT-IR spectra of PAPs obtained using different extraction methods are shown in Figure 3. Each sample displayed typical polysaccharide absorption peaks at 3600–3000 cm1, 1400–1200 cm1, and 1200–700 cm1 [22]. The strong band at 3420 cm1 was attributed to the hydroxyl stretching vibration. The absorption peak at 1636 cm1 was attributed to the asymmetric stretching of the carbonyl group (C=O) [23]. The region at 936–1241cm1 was dominated by the stretching vibration of C–O–C and the hydroxyl group of the pyranose ring, indicating the presence of pyranose [24]. These results indicated that the ultrasonic treatment did not influence the glycosidic bond and sugar ring structures, although there were some differences in the peak intensities between the products obtained using different extraction methods.

3.3.2. Molecular Weight Analysis

The characterization of polysaccharides with different molecular weights is important to determine the structure–activity relationship of polysaccharides [25]. The weight-average molecular weight (Mw), the number-average molecular weight (Mn), and polydispersity (PD, Mw/Mn) of the products obtained using HWE and UAE were compared. The chromatograms of PAPHWE exhibited a single peak, indicating that there was no aggregation and the sample was homogenous. The Mw, Mn, and PD values for PAPHWE were measured to be 1.113 × 10⁶ Da, 3.931 × 10⁵ Da, and 2.831, respectively. The ultrasonic treatment also produced a single chromatographic peak, although a sharp decrease in molecular weight was observed. The Mw, Mn, and PD for PAPUAE were determined to be 6.225 × 10⁵ Da, 2.138 × 10⁵ Da, and 2.912, respectively (Figure 4). The reason for the decrease in molecular weight was that ultrasonic waves could induce the degradation of polysaccharides due to the fluid shear forces from the collapsing cavitation [26].

3.3.3. Purification and Monosaccharide Composition Analysis

After the decolorization and deproteinization, the preliminarily purified PAP was loaded into a Sephadex G-100 column (2.6 cm×60 cm, Yuanye Bio-Technology Co., Ltd, Shanghai, China) and eluted with deionized water. A single peak was obtained. The total sugar content of PAPHWE and PAPUAE were 94.35 ± 1.07% and 91.65 ± 0.88%, respectively. To determine the monosaccharide composition, PAP was hydrolyzed and converted into its acetylated derivatives for GC-MS analysis. The results of the GC-MS analysis are shown in Figure 5. The PAP products obtained using HWE and UAE were mainly composed of rhamnose, arabinose, mannose, glucose, and galactose in approximate molar ratios of 0.19:3.42:5.32:87.03:3.86 and 0.23:2.96:6.27:85.22:5.32, respectively. These results suggested that the composition of the monosaccharides did not change but the molar ratio changed during the ultrasonic treatment. This phenomenon will be given more attention in our future work.

3.3.4. TGA Analysis

Thermal stability is a crucial property for bioactive macromolecules. The measured thermostability data of PAPHWE and PAPUAE are shown in Figure 6. It can be seen that the PAPs extracted using different methods had similar TGA curves. PAPHWE exhibited mass losses of 9.87 and 54.37% at 174 and 800 °C, respectively. Similarly, PAPUAE showed mass losses of 11.75 and 55.79% at 203 and 800 °C, respectively. The first stage of mass loss was primarily associated with the pyrolysis of non-covalent bonds occurring below 220 °C [27]. The second stage was attributed to chemical reactions and the thermal decomposition of functional groups [28,29]. These small differences in mass losses related to temperature may have been caused by the different structures resulting from the different extraction methods.

3.4. Antioxidant Activity In Vitro

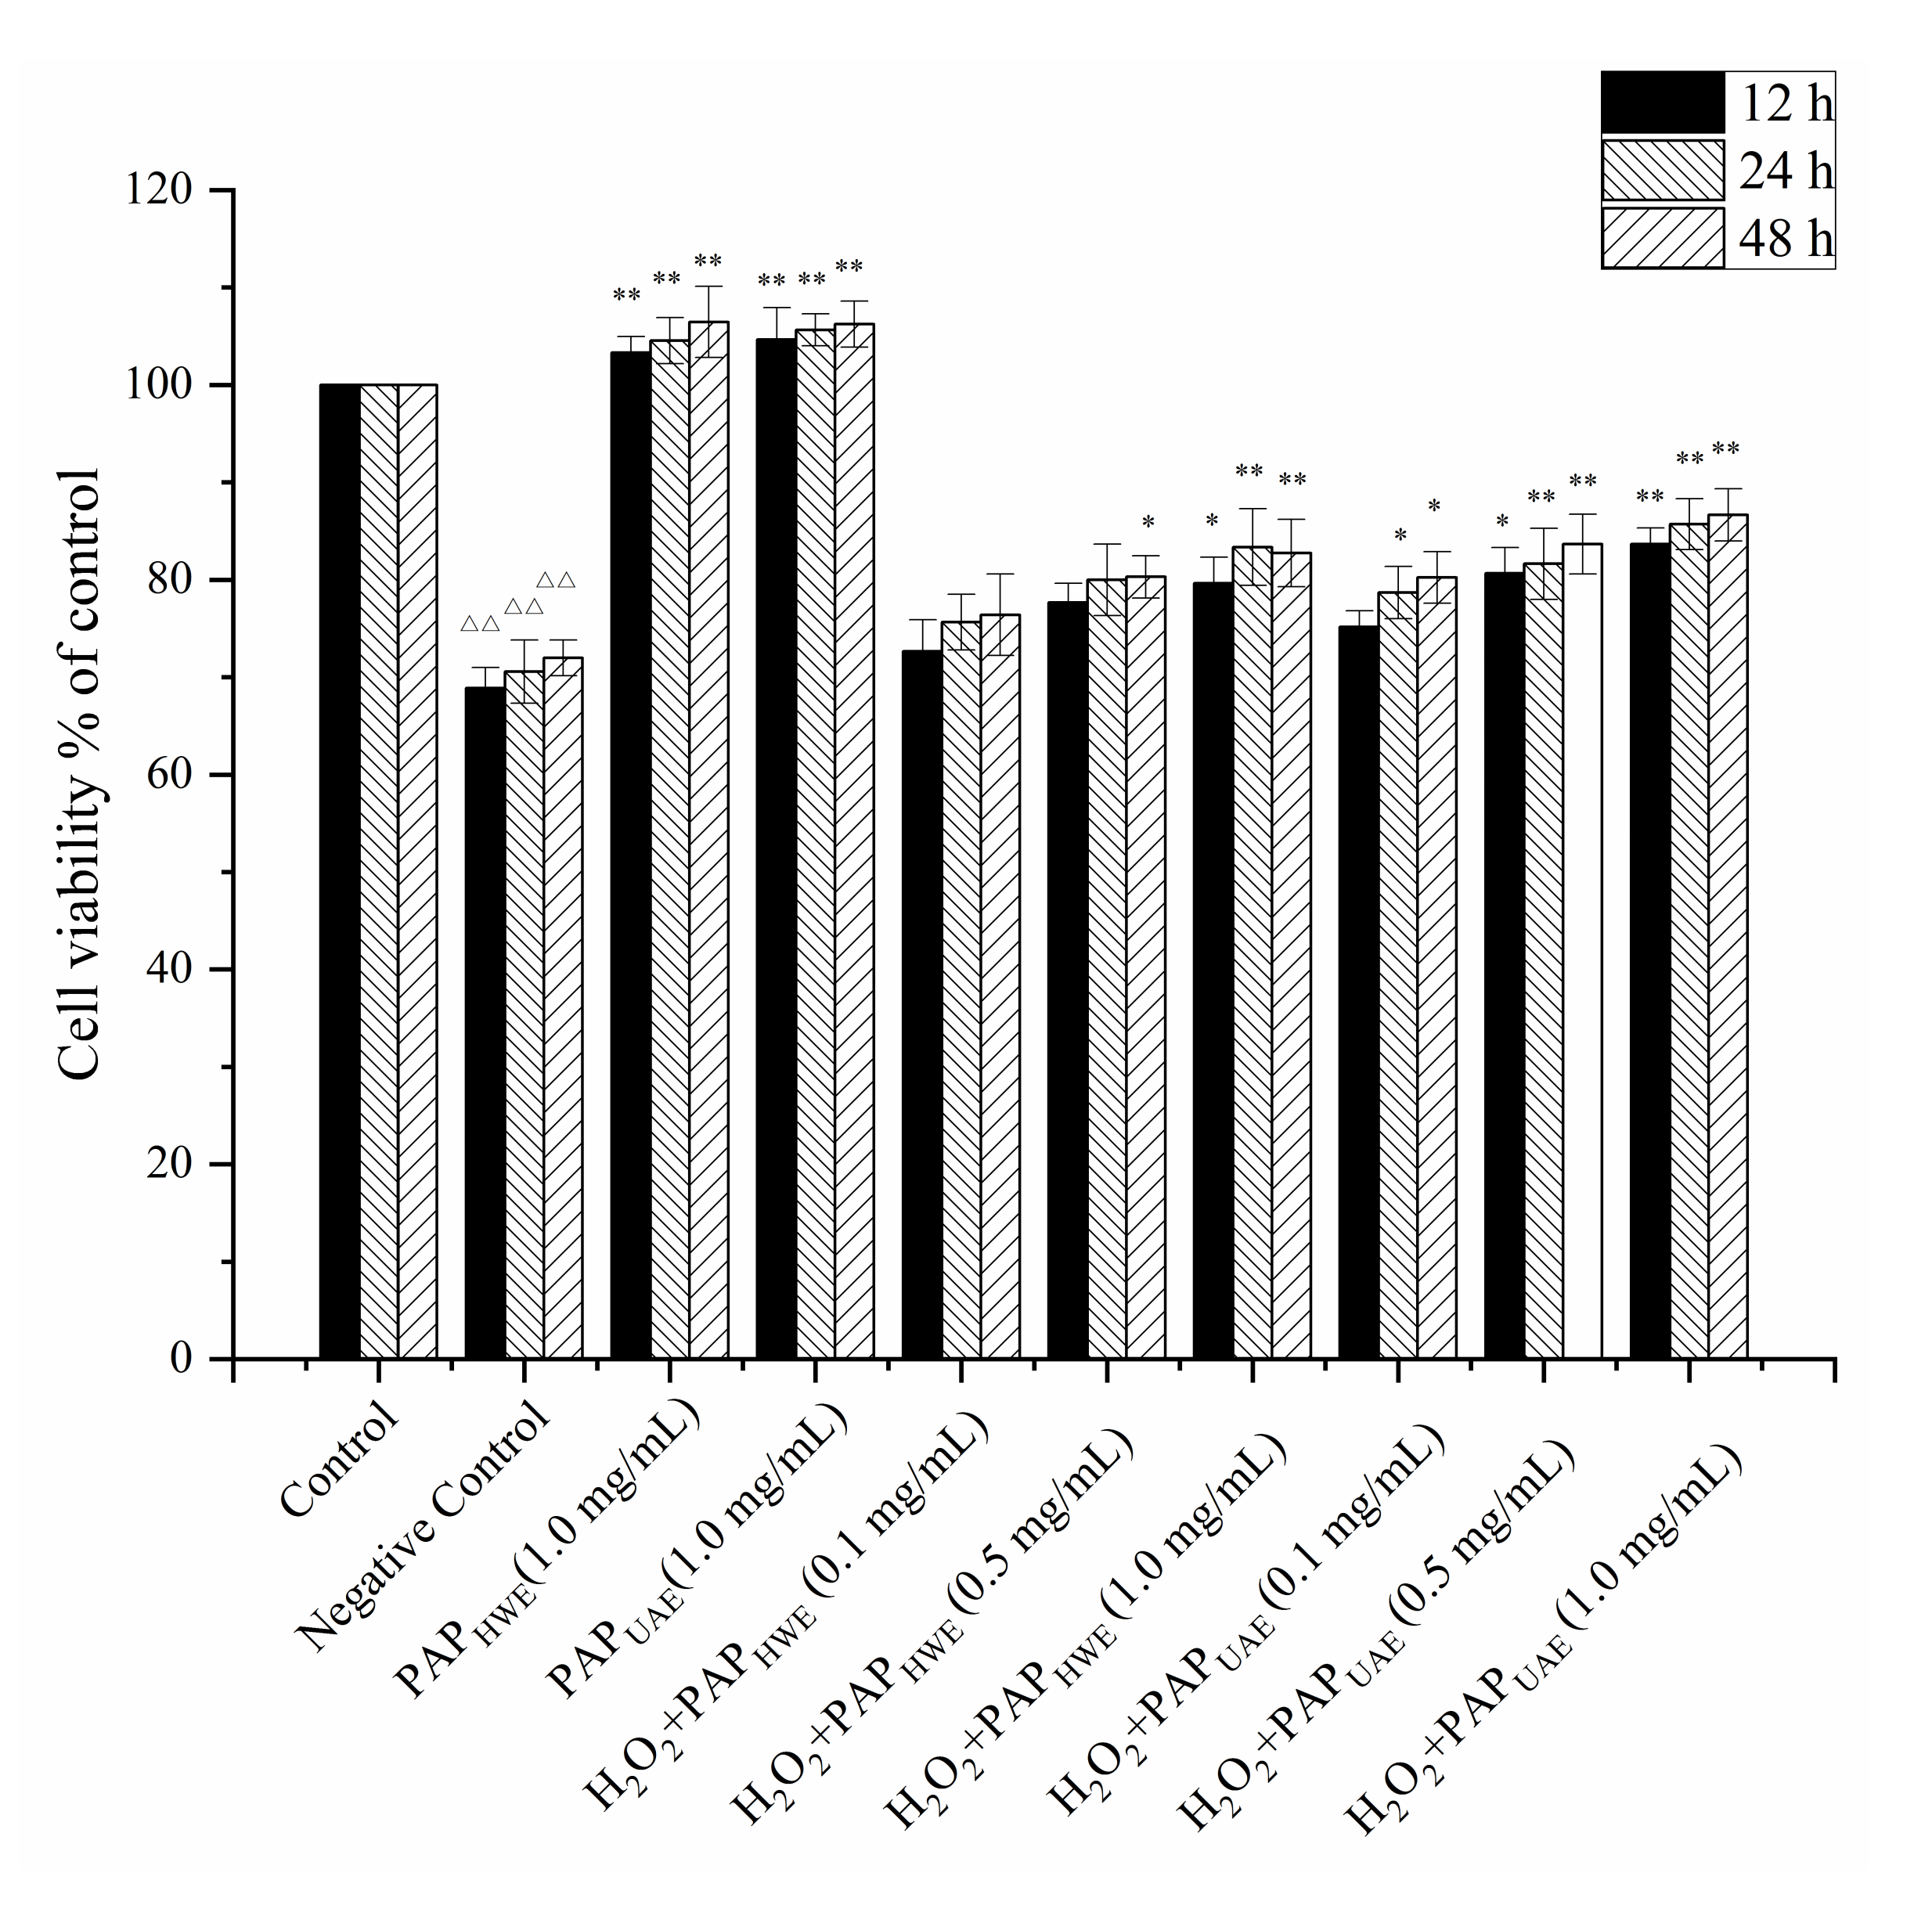
3.4.1. Cell Viability Assay

Oxidative stress produces free radicals and reactive oxygen species (ROS) that have been implicated in numerous disease states, especially in neurodegenerative diseases, physiological senescence, and cardiovascular disease [30,31]. Thus, the use of antioxidants for scavenging ROS is one of the most effective means of decreasing oxidative stress.
The effects of the extracted polysaccharides on the cell survival rate in the presence of oxidative stress were evaluated. H2O2 is a membrane-permeable redox-active agent that is used to model cellular oxidative damage [32]. The exposure of RAW264.7 cells to exogenous H2O2 induced a significant decrease in cell viability. The cell viability increased significantly when the polysaccharides were added. Interestingly, this effect was time- and dosage-dependent at polysaccharide concentrations of 0.1 and l mg/mL. In addition, the polysaccharides generated from ultrasound treatment allowed for greater cell survival in the presence of H2O2 compared to the hot-water-extracted polysaccharides (Figure 7). These results indicated that the polysaccharides were not toxic to RAW264.7 cells and that the polysaccharides extracted using ultrasonication had a stronger protective ability against H2O2-induced injury than those extracted using the hot water method.

3.4.2. Effect of PAPs on MDA Production and Both GSH-Px and SOD Activities in H2O2-Treated RAW264.7 Cells

The antioxidative effects of polysaccharides from Ophiopogon japonicus, Phellinus linteus, and Cordyceps cicadae have been reported to decrease MDA content and increase SOD and GSH-Px activities [33,34,35]. MDA is a product of lipid peroxidation and is a biomarker of oxidative stress. It was found that MDA levels in the negative control group were significantly higher compared to the control group (p < 0.05). Both polysaccharide groups showed similar abilities to reduce MDA levels and this effect was dose-dependent. The ultrasonicated product had a slightly greater ability and reduced the MDA levels to 53.32% at 1.0 mg/mL after 12 h compared to hot-water-extracted polysaccharides (50.13%) (Figure 8A).
SOD and GSH-Px are endogenous cellular antioxidant enzymes that protect against oxidative damage. It was found that RAW264.7 cells treated with H2O2 exhibited lower SOD and GSH-Px activities compared to the controls (p < 0.05). However, incubation with the polysaccharide preparations markedly attenuated these increases in a dose-dependent manner. In addition, the ultrasonicated product generated higher levels of these activities than the hot-water-extracted product in the concentration range of 0.1–1.0 mg/mL (Figure 8B,C).

4. Conclusions

In this work, the process parameters for the ultrasound-assisted extraction of polysaccharides from P. anserine L. were optimized. The maximum extraction yield of 9.43% was achieved with the optimal extraction conditions of a 66 °C ultrasonication temperature, 205 W ultrasonication power setting, and 2.6 h ultrasonication duration. Structural characterization showed that the molecular weight of polysaccharides extracted using UAE was significantly less and the ratio of the monosaccharide composition was changed after the ultrasonic treatment. The FT-IR spectra of different extracted polysaccharides were nearly identical. TGA results indicated that the three-dimensional structure and physical properties of polysaccharides were affected by the different extraction methods to some extent. The polysaccharides extracted using ultrasonication displayed better antioxidant activities and have potential as a natural antioxidant ingredient. These results indicate that ultrasonic treatment is a reliable method for the extraction of bioavailability-added natural polysaccharides.

Author Contributions

Data curation, Y.H.; supervision, J.Z.; writing—original draft, J.G.; writing—review and editing, Y.H. All authors have read and agreed to the published version of the manuscript.

Funding

This research was funded by the National Natural Science Foundation of China (grant no. 51873175), the Science and Technology Project of Gansu Agricultural and Rural Department (GNKJ-2018-11), and the Agricultural Science and Technology Innovation Project of Gansu Academy of Agricultural Sciences (2019GAAS20).

Conflicts of Interest

The authors declare no conflict of interest.

References

  1. Tomczyk, M.; Latté, K.P. Potentilla-A review of its phytochemical and pharmacological profile. J. Ethnopharmacol. 2009, 122, 184–204. [Google Scholar] [CrossRef] [PubMed]
  2. Morikawa, T.; Ninomiya, K.; Imura, K.; Yamaguchi, T.; Akagi, Y.; Yoshikawa, M.; Hayakawa, T.; Muraoka, O. Hepatoprotective triterpenes from traditional Tibetan medicine Potentilla anserina. Phytochemistry 2014, 102, 169–181. [Google Scholar] [CrossRef] [PubMed]
  3. He, X.; Wang, X.; Fang, J.; Chang, Y.; Ning, N.; Guo, H.; Huang, L.; Huang, X.; Zhao, Z. Structures, biological activities, and industrial applications of the polysaccharides from Hericium erinaceus (Lion’s Mane) mushroom: A review. Int. J. Biol. Macromol. 2017, 97, 228–237. [Google Scholar] [CrossRef] [PubMed]
  4. Shi, Q.; Wang, A.; Lu, Z.; Qin, C.; Hu, J.; Yin, J. Overview on the antiviral activities and mechanisms of marine polysaccharides from seaweeds. Carbohydr. Res. 2017, 453–454, 1–9. [Google Scholar] [CrossRef]
  5. Yu, Y.; Shen, M.; Song, Q.; Xie, J. Biological activities and pharmaceutical applications of polysaccharide from natural resources: A review. Carbohydr. Polym. 2018, 183, 91–101. [Google Scholar] [CrossRef]
  6. Ravarotto, V.; Simioni, F.; Pagnin, E.; Davis, P.A.; Calò, L.A. Oxidative stress—Chronic kidney disease—Cardiovascular disease: A vicious circle. Life Sci. 2018, 210, 125–131. [Google Scholar] [CrossRef]
  7. Chang, K.-H.; Cheng, M.-L.; Chiang, M.-C.; Chen, C.-M. Lipophilic antioxidants in neurodegenerative diseases. Clin. Chim. Acta 2018, 485, 79–87. [Google Scholar] [CrossRef]
  8. Tang, W.; Lin, L.; Xie, J.; Wang, Z.; Wang, H.; Dong, Y.; Shen, M.; Xie, M. Effect of ultrasonic treatment on the physicochemical properties and antioxidant activities of polysaccharide from Cyclocarya paliurus. Carbohydr. Polym. 2016, 151, 305–312. [Google Scholar] [CrossRef]
  9. Wang, J.; Zhang, J.; Zhao, B.; Wang, X.; Wu, Y.; Yao, J. A comparison study on microwave-assisted extraction of Potentilla anserina L. polysaccharides with conventional method: Molecule weight and antioxidant activities evaluation. Carbohydr. Polym. 2010, 80, 84–93. [Google Scholar] [CrossRef]
  10. Zhang, D.; Wan, Y.; Xu, J.; Wu, G.; Li, L.; Yao, X. Ultrasound extraction of polysaccharides from mulberry leaves and their effect on enhancing antioxidant activity. Carbohydr. Polym. 2016, 137, 473–479. [Google Scholar] [CrossRef]
  11. Hu, J.-L.; Nie, S.-P.; Li, C.; Wang, S.; Xie, M.-Y. Ultrasonic irradiation induces degradation and improves prebiotic properties of polysaccharide from seeds of Plantago asiatica L. during in vitro fermentation by human fecal microbiota. Food Hydrocoll. 2018, 76, 60–66. [Google Scholar] [CrossRef]
  12. Yan, J.-K.; Wang, Y.-Y.; Ma, H.-L.; Wang, Z.-B. Ultrasonic effects on the degradation kinetics, preliminary characterization and antioxidant activities of polysaccharides from Phellinus linteus mycelia. Ultrason. Sonochem. 2016, 29, 251–257. [Google Scholar] [CrossRef]
  13. Chen, G.; Bu, F.; Chen, X.; Li, C.; Wang, S.; Kan, J. Ultrasonic extraction, structural characterization, physicochemical properties and antioxidant activities of polysaccharides from bamboo shoots (Chimonobambusa quadrangularis) processing by-products. Int. J. Biol. Macromol. 2018, 112, 656–666. [Google Scholar] [CrossRef]
  14. Lin, T.; Liu, Y.; Lai, C.; Yang, T.; Xie, J.; Zhang, Y. The effect of ultrasound assisted extraction on structural composition, antioxidant activity and immunoregulation of polysaccharides from Ziziphus jujuba Mill var. spinosa seeds. Ind. Crop. Prod. 2018, 125, 150–159. [Google Scholar] [CrossRef]
  15. Xu, Y.; Song, S.; Wei, Y.; Wang, F.; Zhao, M.; Guo, J.; Zhang, J. Sulfated modification of the polysaccharide from Sphallerocarpus gracilis and its antioxidant activities. Int. J. Biol. Macromol. 2016, 87, 180–190. [Google Scholar] [CrossRef]
  16. Dubois, M.; Gilles, K.A.; Hamilton, J.K.; Rebers, P.; Smith, F. Colorimetric method for determination of sugars and related substances. Anal. Chem. 1956, 28, 350–356. [Google Scholar] [CrossRef]
  17. Guo, J.; Wang, J.; Song, S.; Liu, Q.; Huang, Y.; Xu, Y.; Wei, Y.; Zhang, J. Sphallerocarpus gracilis polysaccharide protects pancreatic β-cells via regulation of the bax/bcl-2, caspase-3, pdx-1 and insulin signalling pathways. Int. J. Biol. Macromol. 2016, 93, 829–836. [Google Scholar] [CrossRef]
  18. Wang, J.; Yang, W.; Wang, J.; Wang, X.; Wu, F.; Yao, J.; Zhang, J.; Lei, Z. Regioselective sulfation of Artemisia sphaerocephala polysaccharide: Characterization of chemical structure. Carbohydr. Polym. 2015, 133, 320–327. [Google Scholar] [CrossRef]
  19. Hafsa, J.; Hammi, K.M.; Le Cerf, D.; Limem, K.; Majdoub, H.; Charfeddine, B. Characterization, antioxidant and antiglycation properties of polysaccharides extracted from the medicinal halophyte Carpobrotus edulis L. Int. J. Biol. Macromol. 2018, 107, 833–842. [Google Scholar] [CrossRef]
  20. Zhao, B.; Zhang, J.; Guo, X.; Wang, J. Microwave-assisted extraction, chemical characterization of polysaccharides from Lilium davidii var. unicolor Salisb and its antioxidant activities evaluation. Food Hydrocoll. 2013, 31, 346–356. [Google Scholar] [CrossRef]
  21. Yin, C.; Fan, X.; Fan, Z.; Shi, D.; Gao, H. Optimization of enzymes-microwave-ultrasound assisted extraction of Lentinus edodes polysaccharides and determination of its antioxidant activity. Int. J. Biol. Macromol. 2018, 111, 446–454. [Google Scholar] [CrossRef]
  22. Kaczmarska, K.; Grabowska, B.; Spychaj, T.; Zdanowicz, M.; Sitarz, M.; Bobrowski, A.; Cukrowicz, S. Effect of microwave treatment on structure of binders based on sodium carboxymethyl starch: FT-IR, FT-Raman and XRD investigations. Spectrochim. Acta Part A Mol. Biomol. Spectrosc. 2018, 199, 387–393. [Google Scholar] [CrossRef]
  23. Ramamoorthy, S.; Gnanakan, A.; SLakshmana, S.; Meivelu, M.; Jeganathan, A. Structural characterization and anticancer activity of extracellular polysaccharides from ascidian symbiotic bacterium Bacillus thuringiensis. Carbohydr. Polym. 2018, 190, 113–120. [Google Scholar] [CrossRef]
  24. Seedevi, P.; Moovendhan, M.; Sudharsan, S.; Sivasankar, P.; Sivakumar, L.; Vairamani, S.; Shanmugam, A. Isolation and chemical characteristics of rhamnose enriched polysaccharide from Grateloupia lithophila. Carbohydr. Polym. 2018, 195, 486–494. [Google Scholar] [CrossRef]
  25. Peng, Q.; Liu, H.; Lei, H.; Wang, X. Relationship between structure and immunological activity of an arabinogalactan from Lycium ruthenicum. Food Chem. 2016, 194, 595–600. [Google Scholar] [CrossRef]
  26. Xu, Y.; Guo, Y.; Duan, S.; Wei, H.; Liu, Y.; Wang, L.; Huo, X.; Yang, Y. Effects of ultrasound irradiation on the characterization and bioactivities of the polysaccharide from blackcurrant fruits. Ultrason. Sonochem. 2018, 49, 206–214. [Google Scholar] [CrossRef] [PubMed]
  27. Zavastin, D.E.; Biliută, G.; Dodi, G.; Macsim, A.M.; Lisa, G.; Gherman, S.P.; Breabăn, I.G.; Miron, A.; Coseri, S. Metal content and crude polysaccharide characterization of selected mushrooms growing in Romania. J. Food Compos. Anal. 2018, 67, 149–158. [Google Scholar] [CrossRef]
  28. Ballesteros, L.F.; Cerqueira, M.A.; Teixeira, J.A.; Mussatto, S.I. Production and physicochemical properties of carboxymethyl cellulose films enriched with spent coffee grounds polysaccharides. Int. J. Biol. Macromol. 2018, 106, 647–655. [Google Scholar] [CrossRef] [Green Version]
  29. Varma, C.A.; Kumar, K.J. Structural, functional and pH sensitive release characteristics of water-soluble polysaccharide from the seeds of Albizia lebbeck L. Carbohydr. Polym. 2017, 175, 502–508. [Google Scholar] [CrossRef]
  30. Bhat, A.H.; Dar, K.B.; Anees, S.; Zargar, M.A.; Masood, A.; Sofi, M.A.; Ganie, S.A. Oxidative stress, mitochondrial dysfunction and neurodegenerative diseases; a mechanistic insight. Biomed. Pharmacother. 2015, 74, 101–110. [Google Scholar] [CrossRef]
  31. Taleb, A.; Ahmad, K.A.; Ihsan, A.U.; Qu, J.; Lin, N.; Hezam, K.; Koju, N.; Hui, L.; Qilong, D. Antioxidant effects and mechanism of silymarin in oxidative stress induced cardiovascular diseases. Biomed. Pharmacother. 2018, 102, 689–698. [Google Scholar] [CrossRef]
  32. Ma, E.; Chen, P.; Wilkins, H.M.; Wang, T.; Swerdlow, R.H.; Chen, Q. Pharmacologic ascorbate induces neuroblastoma cell death by hydrogen peroxide mediated DNA damage and reduction in cancer cell glycolysis. Free Radic. Biol. Med. 2017, 113, 36–47. [Google Scholar] [CrossRef]
  33. Olatunji, O.J.; Feng, Y.; Olatunji, O.O.; Tang, J.; Wei, Y.; Ouyang, Z.; Su, Z. Polysaccharides purified from Cordyceps cicadae protects PC12 cells against glutamate-induced oxidative damage. Carbohydr. Polym. 2016, 153, 187–195. [Google Scholar] [CrossRef]
  34. Yan, J.-K.; Wang, Y.-Y.; Wang, Z.-B.; Ma, H.-L.; Pei, J.-J.; Wu, J.-Y. Structure and antioxidative property of a polysaccharide from an ammonium oxalate extract of Phellinus linteus. Int. J. Biol. Macromol. 2016, 91, 92–99. [Google Scholar] [CrossRef]
  35. Zhang, J.; Shi, R.; Li, H.; Xiang, Y.; Xiao, L.; Hu, M.; Ma, F.; Ma, C.W.; Huang, Z. Antioxidant and neuroprotective effects of Dictyophora indusiata polysaccharide in Caenorhabditis elegans. J. Ethnopharmacol. 2016, 192, 413–422. [Google Scholar] [CrossRef]
Figure 1. Effects of different extraction parameters: ultrasonication temperature (A), power (B), and time (C).
Applsci 10 04510 g001
Figure 2. Response surface plots (AC) and contour plots (DF) showing the interactive effects of the ultrasonication temperature, power, and time on the extraction yield of Potentilla anserina L. polysaccharides (PAPs).
Applsci 10 04510 g002
Figure 3. FT-IR spectra of extracted polysaccharides.
Applsci 10 04510 g003
Figure 4. Size-exclusion chromatography combined with laser light scattering (SEC-LLS) chromatogram of the extracted polysaccharides: PAPHWE (A) and PAPUAE (B) (HWE: hot water extraction, UAE: ultrasound-assisted extraction).
Applsci 10 04510 g004
Figure 5. The GC-MS analysis of standard monosaccharides (a), PAPHWE (b), and PAPUAE (c).
Applsci 10 04510 g005aApplsci 10 04510 g005b
Figure 6. TGA curves of PAP extracted by different methods.
Applsci 10 04510 g006
Figure 7. Effects of PAPs on cell viability. The data are presented as mean ± SD. △△: p < 0.01 compared with the control group, *: p < 0.05 compared with the negative group, **: p < 0.01 compared with the negative group.
Applsci 10 04510 g007
Figure 8. Effects of PAPs on malondialdehyde (MDA) (A) production and both glutathione peroxidase (GSH-Px) (B) and superoxide dismutase (SOD) (C) activities. The data are presented as mean ± SD. △△: p < 0.01 compared with the control group; *: p < 0.05 compared with the negative group, **: p < 0.01 compared with the negative group.
Applsci 10 04510 g008
Table 1. Independent variables and their levels used in the Box–Behnken design (BBD).
VariablesCoded
Variables
Levels
−101
Ultrasonic temperature (°C)A506070
Ultrasonic power (W)B160200240
Ultrasonic time (h)C22.53
Table 2. BBD and the response values for the polysaccharide yields.
RunUltrasonic Temperature (°C)Ultrasonic Power (W)Ultrasonic Time (h)Extraction Yield (%)
17020037.729
2602002.59.534
35020038.653
47020027.838
5502402.57.657
6602002.59.478
7602002.59.672
8602002.59.324
9602002.59.426
10702402.58.128
116024038.782
126024028.032
135020027.213
14501602.57.548
156016038.502
16701602.57.713
17601602.57.938
Table 3. Analysis of variance (ANOVA) for the response surface quadratic model.
SourceSum of SquaresdfMean SquareF-Valuep-ValueSignificance
Model10.3591.1545.01<0.0001Significant
A0.01410.0140.560.4804
B0.1010.103.940.0874
C0.8710.8734.210.0006
AB0.02310.0230.920.3705
AC0.6010.6023.470.0019
BC8649186490.340.5790
A25.0115.01195.80<0.0001
B21.7011.7066.42<0.0001
C21.2211.2247.730.002
Residual0.1870.026
Lack of Fit0.1130.0372.240.2261Not Significant
Pure Error0.06740.017
Cor Total 110.5316
R2 = 0.9830, R2Adj = 0.9612, 1 Cor Total: sum of squares total corrected for mean.

