Article

An Application Study on Road Surface Monitoring Using DTW Based Image Processing and Ultrasonic Sensors

1
Extreme environment design and manufacturing innovation center, Changwon National University, Changwon 51140, Korea
2
Institute of Theoretical and Applied Research, Duy Tan University, Hanoi 100000, Vietnam
3
Faculty of Civil Engineering, Duy Tan University, Danang 550000, Vietnam
4
School of Mechanical Engineering, Changwon National University, Changwon 51140, Korea
*
Author to whom correspondence should be addressed.
Appl. Sci. 2020, 10(13), 4490; https://doi.org/10.3390/app10134490
Submission received: 15 May 2020 / Revised: 22 June 2020 / Accepted: 28 June 2020 / Published: 29 June 2020
(This article belongs to the Special Issue Applications on Ultrasonic Wave)

Abstract

:

Featured Application

Road surface monitoring for severe conditions.

Abstract

Road surface monitoring is an essential problem in providing smooth road infrastructure to commuters. This paper proposed an efficient road surface monitoring using an ultrasonic sensor and image processing technique. A novel cost-effective system, which includes ultrasonic sensors sensing with GPS for the detection of the road surface conditions, was designed and proposed. Dynamic time warping (DTW) technique was incorporated with ultrasonic sensors to improve the classification and accuracy of road surface detecting conditions. A new algorithm, HANUMAN, was proposed for automatic recognition and calculation of pothole and speed bumps. Manual inspection was performed and comparison was undertaken to validate the results. The proposed system showed better efficiency than the previous systems with a 95.50% detection rate for various road surface irregularities. The novel framework will not only identify the road irregularities, but also help in decreasing the number of accidents by alerting drivers.

Graphical Abstract

1. Introduction

Treacherous road surface conditions are a significant problem for safe and comfortable transportation. The importance of road infrastructure for society can be compared with the importance of blood vessels for humans. For better road surface quality, it should be monitored continuously and repaired as necessary. The optimal distribution of resources for road repairs is possible by providing the availability of comprehensive and objective real-time data about the state of the roads. Developing countries with an escalating economy have an enormously extensive network of roads. Events within the past have shown that countries like the USA have invested about $68 billion a year on the maintenance of roads, bridges, and highways. These potholes also contribute to the degradation of suspension and fuel efficiency. In India, roads are the most common means of mobility; roads carry 90% of passengers and 65% of freight. Even with such a massive network, traveling is tiring in India as the roads are not sufficiently wide and the maintenance is inadequate. Regardless of where you are, driving is a stressful and potentially life-threatening affair. Over the last two decades, with an exponential rise in population, the number of vehicles has increased at a tremendous rate. The road infrastructure is not at par with the number of vehicles to support it, resulting in traffic congestion and accidents. As the ECONOMIC TIME’s report of January 2018 suggests, at the very least, 400 people lose their lives every day in the country to road accidents due to potholes [1].
According to the report, “Road Accidents in India, 2016 [1] ”, by the Ministry of Road Transport and Highways, there were 480,652 road accidents in 2016 as opposed to 501,423 in 2015. However, fatalities resulting from these accidents have risen by about 3.2%, which means that nearly 150,785 people were killed in 2016 compared to 46,133 in 2015 [1]. In India, most of the vehicles (unusually small hatchbacks) sold are either a 0-star rating or a 1-star rating in correspondence to the European standards, which implies that there could be fatal injuries even at moderate speeds. A considerable amount of research has been conducted on reducing traffic congestion and the number of ever-growing accidents. Vast sums of money are spent on repairing these potholes and bumps, however, small developing countries cannot afford to invest these amounts, which are a significant cause of road degradation. Irregularities on the road such as potholes caused by activities like erosion, weather, traffic, and some other factors may lead to accidents. Moreover, human-induced bumps such as speed breakers, which are made in the form of speed bumps, are used to control the speed of the vehicles, but they are not distributed at even distances, and the heights of the speed bumps have not been scientifically justified, which could also cause accidents. While said obstacles ought to be signaled according to specific road regulations, they are not always correctly labeled. One of the primary goals of this research was to detect road irregularities and decrease the number of accidents and fatalities. This approach is cost-efficient and can be applied worldwide. Generically, in modern-day field practices, the evaluation of the road irregularity data is done entirely via the raw data assessment [2]. Several road irregularity stats are used for the same. The existing technique can be categorically classified into three main types: imaging-based, sensor, and manual techniques.
There has been a substantial amount of research done in the past on the detection of potholes [3,4,5] using various techniques like reconstruction using laser [6], stereo vision [7,8], Light Detection and Raanging (LIDAR) [9], ultrasonic [10,11,12,13], etc. Forrest et al. [10] proposed a method of detecting road surface disruptions based on ultrasonic sensors in which the pothole detection rate of 62% was achieved on a paved road. Singh et al. [11] used a global positioning system receiver and ultrasonic for the identification of geographical location coordinates of the detected potholes and speed breaker with 59.23% efficiency. Madli et al. [12] worked on the automatic detection and notification of potholes and humps on roads to aid drivers using ultrasonic and a Global Positioning System (GPS). It was found that the system was 74% efficient and the data could be stored in the cloud. Shivaleelavathi et al. [13] also proposed an intelligent system using an ultrasonic sensor based on Raspberry Pi, GPS, and ultrasonic to take corrective measures. Devapriya et al. [14] proposed a real-time system that detected speed bumps by the analysis of photos of the road that were further enhanced using a Gaussian Filter (computer vision technique). This system had a correct rate ranging from 30% to 92%; however, failure was witnessed for faded speed bumps, and for a higher price, they had to be painted and maintained; this was a significant drawback of the system. Eriksson et al. [8] established the patrol system that comprised of a GPS and a 3-axis accelerometer for the detection of potholes. Likewise, Chen et al. [15] used the very same system and evaluated the power spectral density (PSD) for the detection of pavement irregularities using Fourier transformations. Inaccurate location of the irregularities was a shortcoming of the system. Nericell was a system developed by Mohan et al. [7] that comprised of amici, global system for mobile communication (GSM), accelerometer, and GPS sensors for road surface monitoring. The method yielded a False Negative Rate (FNR) of 37% and 41% for low speed and high-speed bumps, respectively. The use of smartphones, an adaptive fuzzy classifier, GPS, and inertial sensors for the detection of sudden driving events was presented by Arroyo et al. [16] and a precision performance of 0.87 and 0.91 was recorded. A fuzzy inference system was proposed by Aljaafreh et al. [17] for the detection of speed bumps using accelerometers embedded in smartphones. Nevertheless, the actual results of the tests were missing and accuracy only ranged from 70–80%. A multi-mobile phone system was developed by Astarita et al. [18], who also used accelerometers for the detection of bumps and potholes. A whopping 90% detection rate was obtained for bumps whereas the False Positive Rate (FPR) was about 35%.
Furthermore, the use of a smartphone accelerometer with six different algorithms to categorize road surface conditions was done by González et al. [19], who reported an Area Under Curve (AUC) ranging from 0.823 to 0.9445. Nature driven approaches such as genetic algorithm have also been explored: Yu and Yu [20] explored the use of genetic algorithms using images as a source of information to detect road irregularities. Moreover, abnormalities or distress data collection are increasingly being automated by using various imaging systems. However, analysis of the collected raw video clips for distress assessment is still predominantly being done manually, which is expensive, time-consuming, and slows down road maintenance management [21]. Pre-existing research suggests that three-dimensional image-based techniques are quite expensive; on the other hand, vibration sensor-based techniques are not as accurate and reliable [22] for road surface monitoring. The majority of the existing two-dimensional imaging methods have solely focused on either crack distress detection or pothole detection.
In this paper, an experimental analysis was conducted to detect potholes and speed bumps in quasi-real-time conditions using three different techniques, namely, an ultrasonic sensor with DWT, imaging-based systems, and manual inspection for validation from various roads of Noida city. In the first technique, which consists of an ultrasonic sensor, a GPS and Arduino connected to the Head Up Display (HUD) device are introduced. This system is a cost-effective method for a better, faster, and more reliable way to avoid accidents caused by potholes and raised humps. During the conduct of this experimental analysis, a collection of an exclusive data pattern of speed bumps and potholes was undertaken and directly fed to dynamic time warping (DTW) to find the likeness and similarity. A robust method for automated segmentation of frames with and without distress from the image processing technique is presented. These photo processing methods are responsible for the detection of potholes and speed bumps, which are supported by user-defined decision logic. The derivation of the decision logic is dependent on three characteristic visual properties of these irregularities (i.e., the standard deviation for calculating pixels intensities, circularity (CIRC) for calculating the shape, and average width for the dimension). An agile video separation algorithm called irregularity frame selection (IFS) was used to separate the visual frames with irregularities or not categorically. A new algorithm named the Hanuman algorithm took care of the second phase for automatically detecting and assessing potholes and speed bumps in one go. Finally, in the third technique, a manual visual inspection was undertaken to validate the above two methods.

2. Materials and Methods
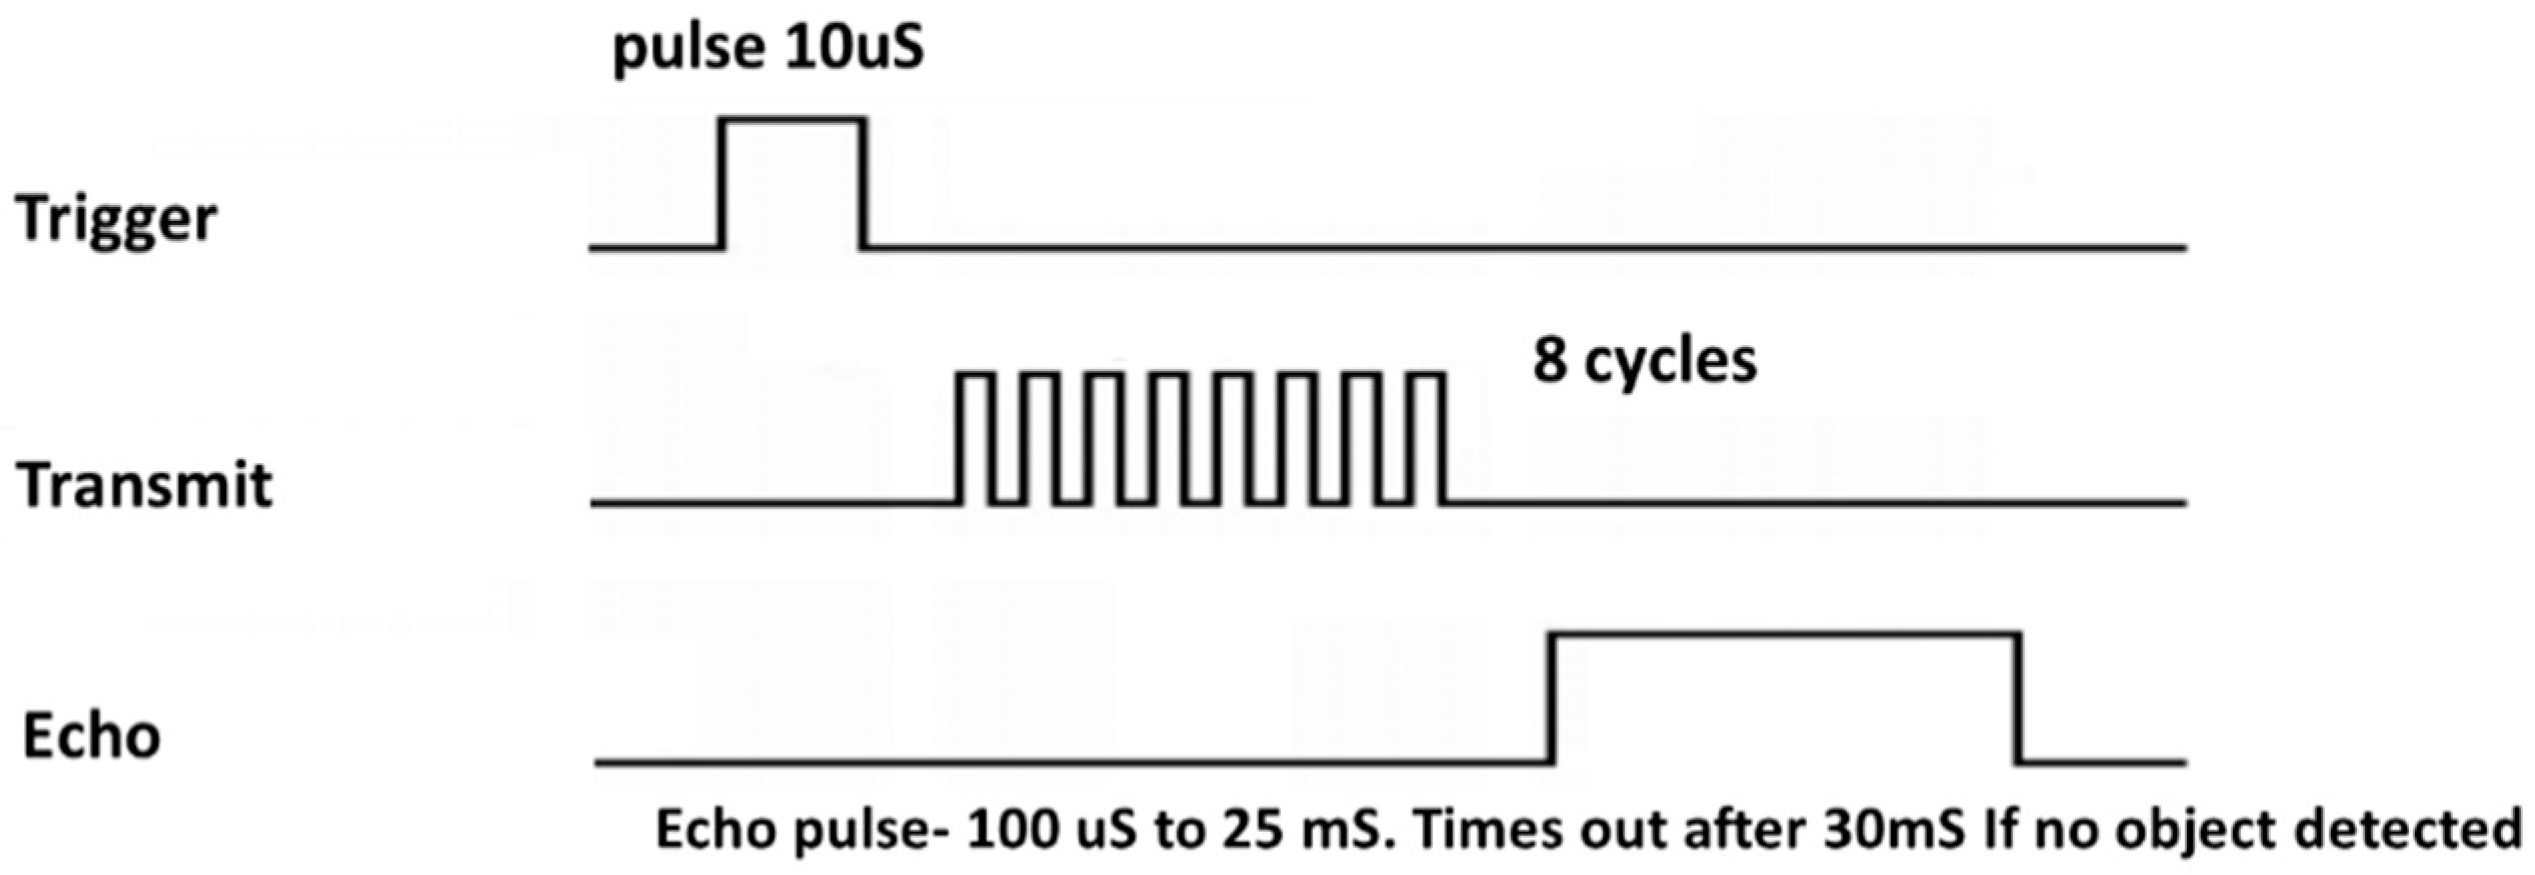
The proposed threshold-based efficient road monitoring system detects the pothole and a speed break. Figure 1 shows the methodology overview of the information taken from the ultrasonic sensor. Collection and analysis of data were done using the primary server where the application of the DTW algorithm and noise filtering techniques was made. After the observation of the limitations of the existing systems, the present framework introduces the use of an ultrasonic sensor, DTW, IFS (algorithms), and filters for the detection of road irregularities. The ultrasonic sensor is fit in the moving direction of the car, as explained in Section 4. Information gathered with the help of sensors is sent to the central server for further analysis. Furthermore, noises, vibrations, and gravity components are eliminated using the filters. DTW helps to obtain the closeness score by analyzing the patterns for potholes and speed bumps. Ergo, road irregularity detection is undertaken with its GPS signature. Eventually, the final output is displayed on the mobile HUD for ease of the driver, making it even more ergonomic.

2.1. Hardware Setup

The main aim of the research was to create inexpensive hardware that runs on open software. Ergo, we used an Arduino Uno with an ultrasonic sensor (in Figure 2 and Figure 3) and a GPS. Table 1 shows the hardware specification and Figure 4 shows the components used in the setup. The architecture of the proposed system consisted of four parts: an ultrasonic sensor, Arduino, a server module, and a heads-up display module. The ultrasonic sensor and Arduino are used to gather information about potholes and speed bumps and their geographical locations, and this information is sent to the server. The server module receives information from the microcontroller module, processes, and stores in the database.
Ultrasonic sensors are utilized to determine the separation between the vehicle frame and the street surface numerically, and this value is passed to the microcontroller. Threshold distance is defined as the distance between the body of the vehicle and the smooth road surface, which depends upon the ground clearance of vehicles. If the value obtained by the ultrasonic sensor is more than the threshold distance, it recognizes it as a pothole, and if it is less, it is recognized as an unimportant irregularity, otherwise the street is smooth.
The microcontroller module (Arduino) is the main controller of the entire system and is responsible for incorporating the ultrasonic sensors and sending and receiving signals between the GPS receiver and the sensors. The microcontroller module is merely the processing power of the whole system and is utilized to accumulate data about potholes and their topographical areas, and these data are passed onto the server. The server module gets this data from the microcontroller and uploads its respective location signatures to the cloud server. This location will appear on the GPS system whenever any vehicle passes through or near it. The Arduino contains several filters to smoothen out the output from the ultrasonic sensor. The basic variations from the ultrasonic sensor are bolstered to the filters, where the information is smoothed and standardized. The filters are to filter the vibration due to some irregularities from the road surface apart from speed bumps and potholes. These vibrations are removed from the ultrasonic sensor information to lessen the impact of other outside powers and for the system to be able to differentiate between a constant/normal variation and an actual pothole or a bump.

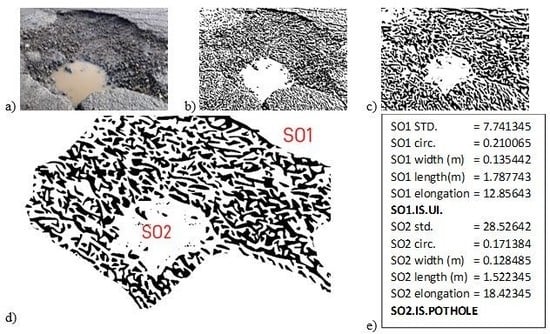
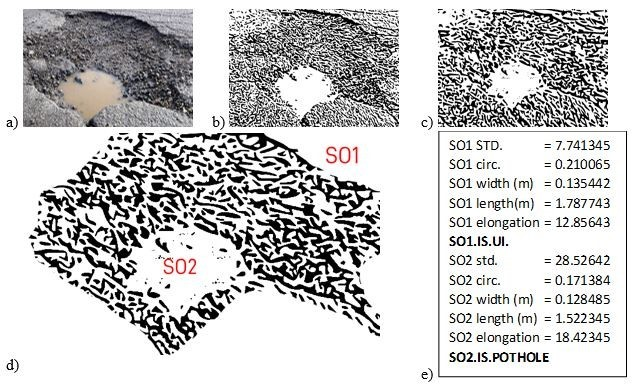
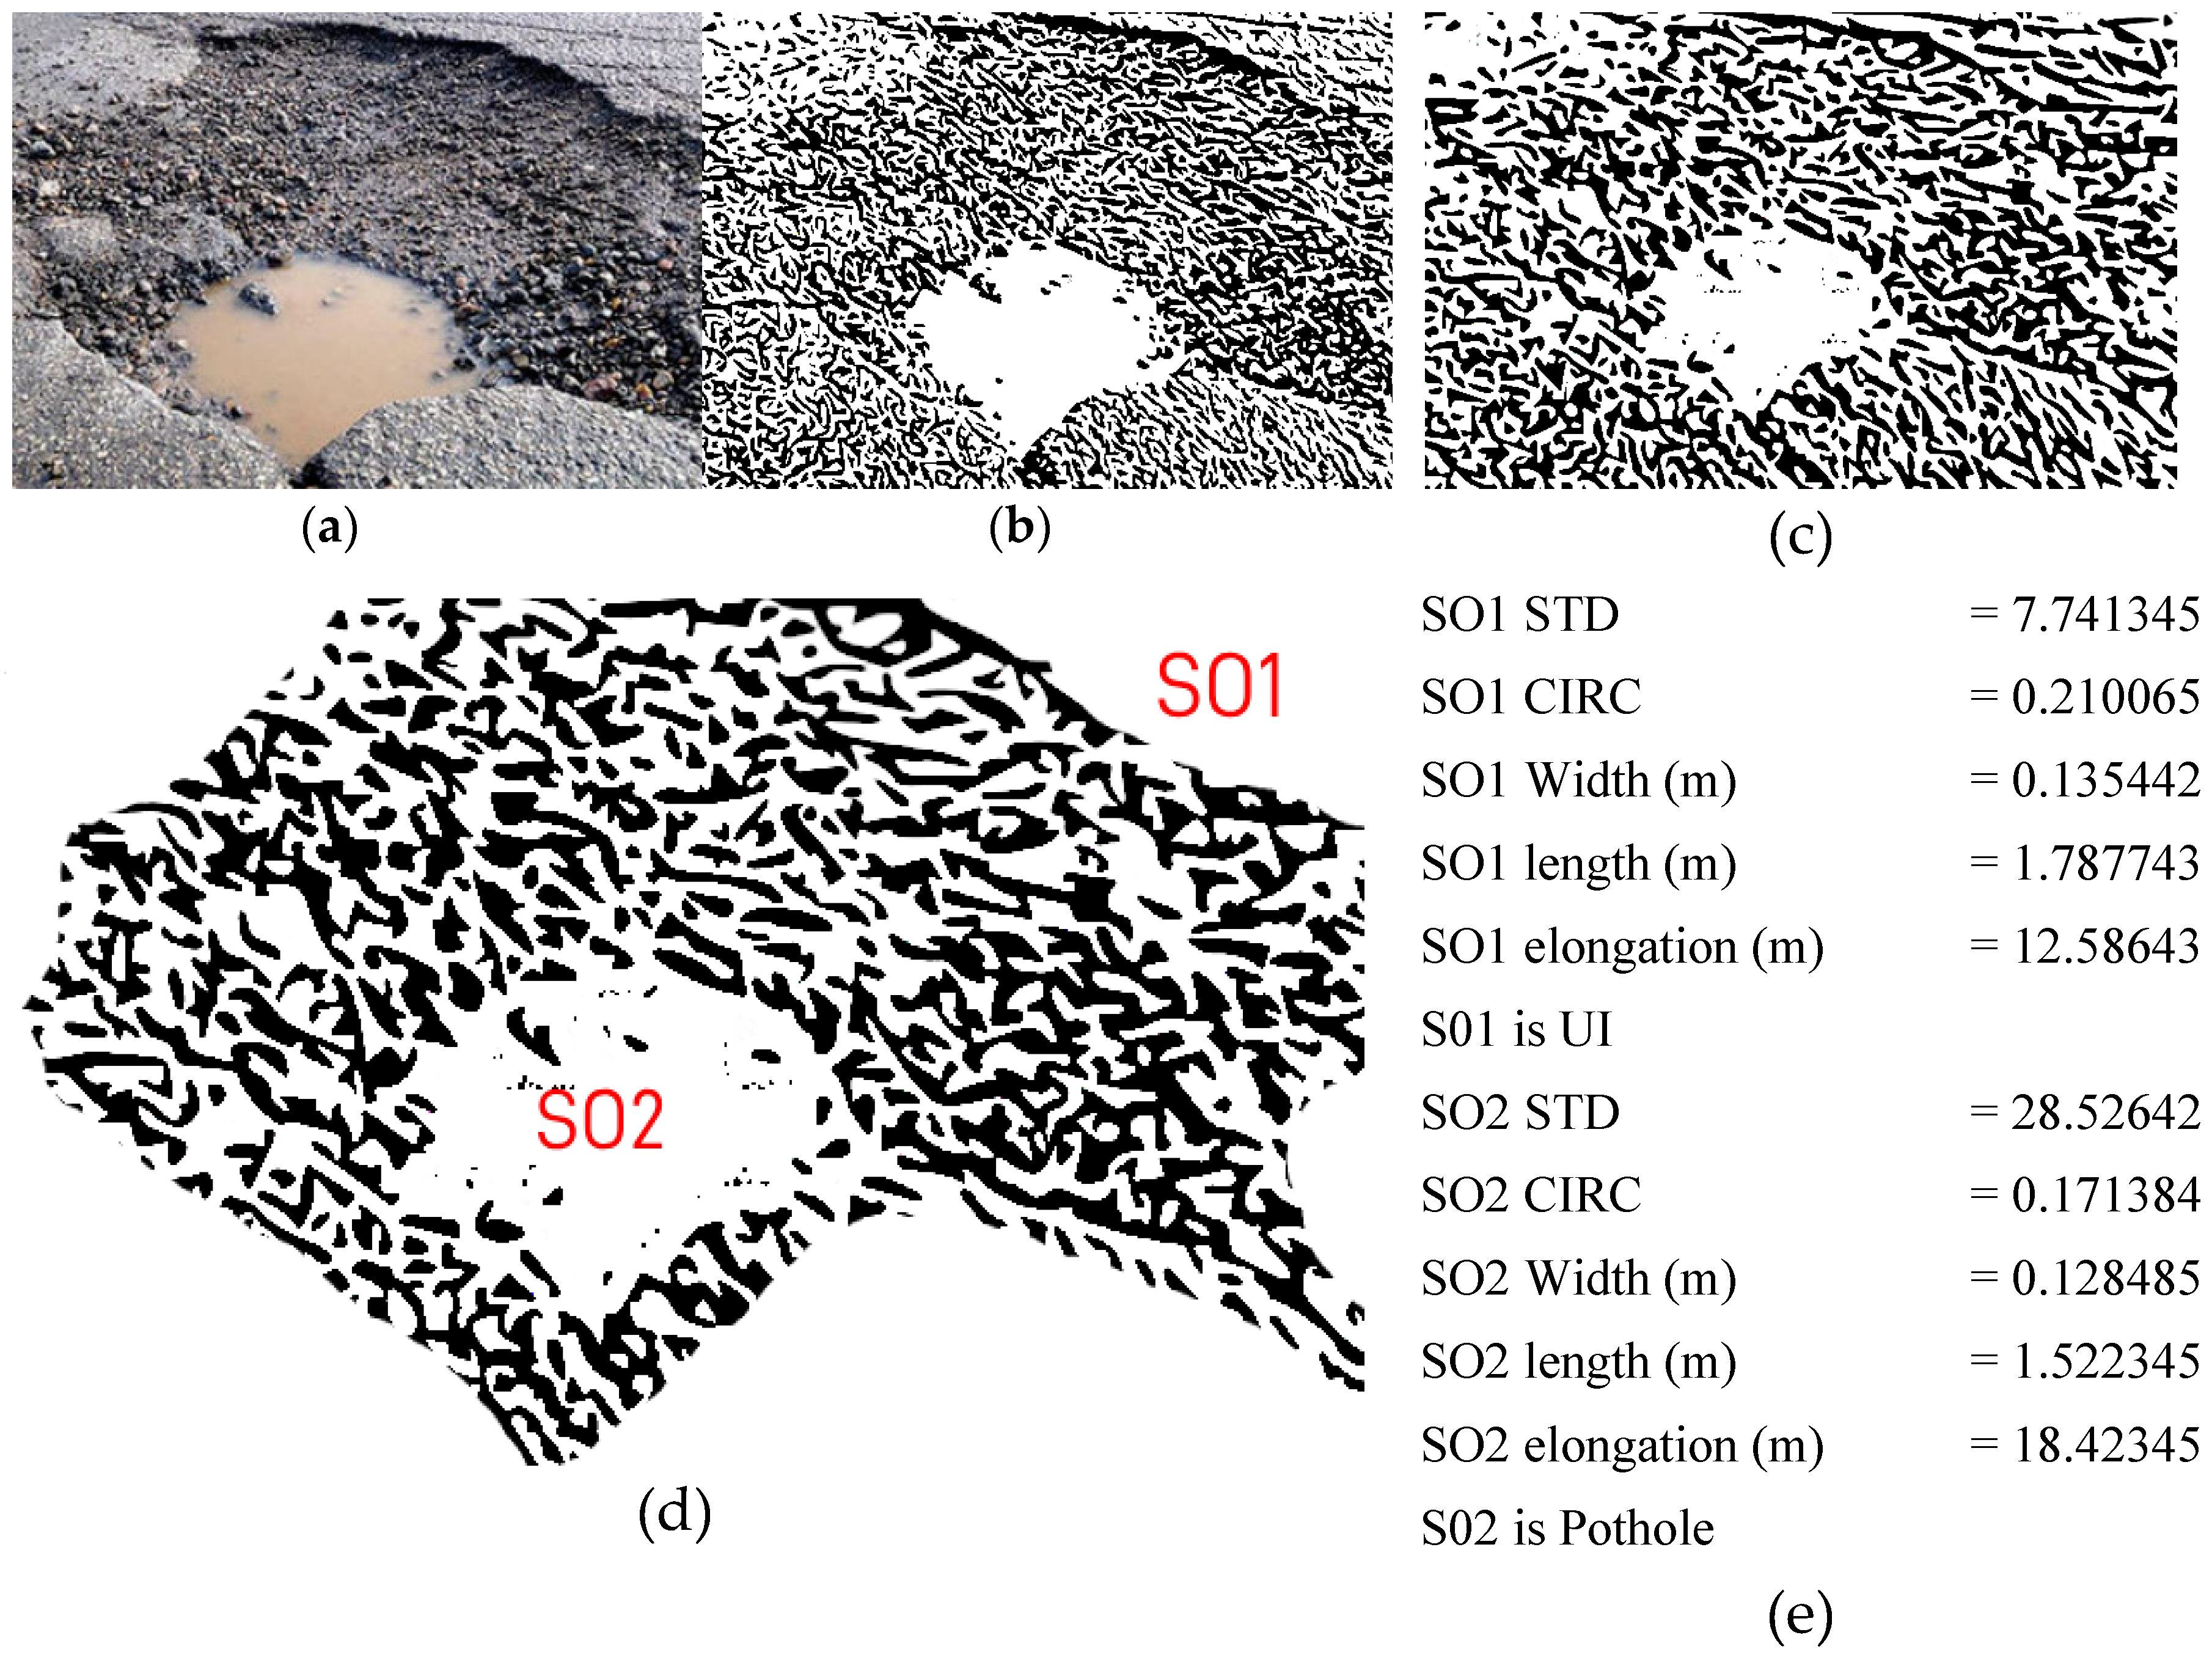
2.2. Automated Assessment of Potholes and Speed Bumps Using Imaging Processing

The inception of the motivation for this research paper was induced directly or indirectly by our personal first-hand experiences with the Indian road conditions. The validation was for the determination of the efficiency of the proposed system. Initially, the pothole and bumps were detected with the help of using ultrasonic sensors paired with an Arduino attached with a heads-up display feeding the information to the GPS receiver. Irregularity frame selection is a recursive algorithm for searching all the vertices of a graph or tree data structure. This algorithm uses raw visual clips that are further put through several image processing methods; this is done using user-defined logics, which ensures the precise detection of irregularities. Segmentation of the irregular pixels in a visual frame is done by the algorithm using user defined decision logics that categorize those frames by the area covered by the irregular pixel. This segmentation is categorized into two parts: (1) Frames with irregularities, (2) frames without irregularities.
The Hanuman algorithm is used in the presented technique for computerized location and estimation of speed bumps and potholes in a single go from a grouping of video outlines. This algorithm is generated by the arrangement of two visual properties of bumps and potholes, which are distinguished from video photographs of Indian streets. This aggregate arrangement of recognized visual properties incorporates the accompanying, including the following:
Picture Texture: The picture surface of the interior of a pothole and speed bump is more different and distinguishing than the encompassing zone (i.e., irregularity less street surface region).
Shape Factor: The state of a pothole and speed bump is distinguishable. Their shape factor is estimated as far as circularity, which changes depending on their surface territory and border.
Measurement: The element of pothole and speed bump is expressed in terms of average width.
This particular algorithm fundamentally includes five segments:
  • Image augmentation (Algorithm steps 3 and 4),
  • Photo categorization (Algorithm step 5),
  • Extraction of visual properties of articles (Algorithm steps 6 to 11),
  • Recognition and classification of irregularities by decision logic (Algorithm step 12) and
  • Quantification (Algorithm step 13).
The calculation produced for the robotized identification, estimation, and arrangement of casings with potholes and speed bumps without basic irregularity from a grouping of street video outlines is recorded underneath.
  • Categorized video frames are input;
  • The initial frame is selected;
  • A blue channel is selected for the conversion of the preset 24-bit depth format into 8-bit depth format;
  • Median filtering is used for photo augmentation;
  • Application of weighted mean based adaptive thresholding is made to covert processed photos into a binary image wherein black pixels signify objects of concentration;
  • Morphological erosion is used to add black pixels to link the slits in the binary photo;
  • Morphological dilation is used to eradicate secluded black pixels or their minor cluster;
  • Morphological erosion is used again to add black pixels to the binary photo;
  • Connected element classification and chain coding methods are used to quantify the number of substances or areas of notice and evaluate the area (A) and perimeter (P) of each of the object/substance;
  • Filter out all the objects/substances whose A = 192cm2 in the primary photo;
  • Calculate standard deviation, circularity and average width of every remaining substance/object (critical objects, i.e., objects whose A ≥ 192 cm2);
  • Categorize every substance/object into three kinds using heuristically derivative decision logic: Type (object) =
    (a)
    Pothole, if STD ≥ 12 & CIRC ≥ 0.14 & W ≥ 70 mm;
    (b)
    Speed Bump, if Convexity ≥ 5;
    (c)
    Unimportant Irregularity (UI), if otherwise;
  • Save the visual frame with the extracted and enumerated data in its respective category type folder;
  • Repeat steps 2 to 13 for all outstanding visual database;
  • Finish.
The procedure applied to extract the pothole information using the proposed algorithm is shown in Figure 5. Figure 5a is the original image with potholes; (b) is the binary image after median filtering (i.e., after random noise reduction in column (a) image), and adaptive thresholding (i.e., after object segmentation in column (b) image); (c) is binary image after erosion (i.e., after joining disparate black pixels in column (b) image); column (d) image after the Hanuman algorithm and (e) is the report of the pothole. Similarly, Figure 6 shows the speed bumps.

3. Experimental Design and Location

To investigate the road surface, the framework used for the testing is shown in Table 2. The research was performed in the city of Noida, which comes under the National Capital Region of New Delhi. The city has an elevation of 200 m above sea level and a flat topographical region. Like most of the country, there are extremely contrasting roads in Noida, ranging from excellent roads to terrible roads. An expressway just outside of Noida (Figure 7a) and a slum road in Noida (Figure 7b) were considered for the experiment. Several test runs were performed, yielding different results. The experiment was conducted for three months covering around 150–170 km. For the evaluation of the performance of the framework, the algorithm presented in this research was applied in a Windows environment (Dell XPS 15Z with Intel i7 2600, 8GB DDR3 RAM on Windows 10 Pro) with the use of Visual Studio 2017 (VC ++ Redistributable) and Open CV3.3 Library. Hanuman, IFS, and DTW algorithms were used across the entire framework. For test runs, a Honda Amaze was used and image processing was done by a cost effective 4k resolution action camera. Table 2 shows the software and hardware specifications used in the experiment

4. Results and Discussion

The evaluation of the three different techniques is presented while traveling over the R1 (Yamuna expressway) and R2 (Khora Village) roads of Noida city and was also compared with other existing techniques.

4.1. Proposed Novel Framework

The ultrasonic sensor detects the pothole and speed bumps; these data are saved on the server and used to determine the separation amid the vehicle body and the street surface numerically, and this value is passed by the Arduino. Threshold distance is defined as the distance between the body of the vehicle and the smooth road surface and depends upon on the ground clearance of vehicles. If the value obtained by the ultrasonic sensor is more than the threshold distance, it will recognize it as a pothole, and if it is less, it is a mound, otherwise the street is smooth. The proto test was conducted using the design described in the Methodology Section above, and the results for R1 and R2 are shown in Table 3 and Table 4.
As can be clearly seen, the uneven roads of the rural areas showed many potholes and bumps with some specific dimensions. On the other hand, the motorway road only showed irregularities up to 6.2 cm, which were filtered by filters such as Speed, Virtual Re-orientation, Filtering Z-pivot, SMA, and Band-Pass on the basis of the threshold limit being 8 cm. Figure 8 shows the experimental comparison in the z-axis displacement for R1 and R2.

4.2. Image Processing Result

Identification of the unique visuals of irregularities like illumination, size, and shape are made using image processing techniques. These accurately identify and help classify those irregularities. The irregularity frame selection algorithm is used as a quick video separation of the real-life visual clips captured of the Indian National Highways at several locations, which are divided into two frame categories (frames with irregularities and frames without irregularities). The Hanuman algorithm is responsible for the evaluation of the database of frames with irregularities, which is an automatic technique for the recognition and analysis of potholes and speedbumps. The proto test was conducted using the design described in the image processing methodology and the results for R1 and R2 are shown in Table 5 and Table 6.

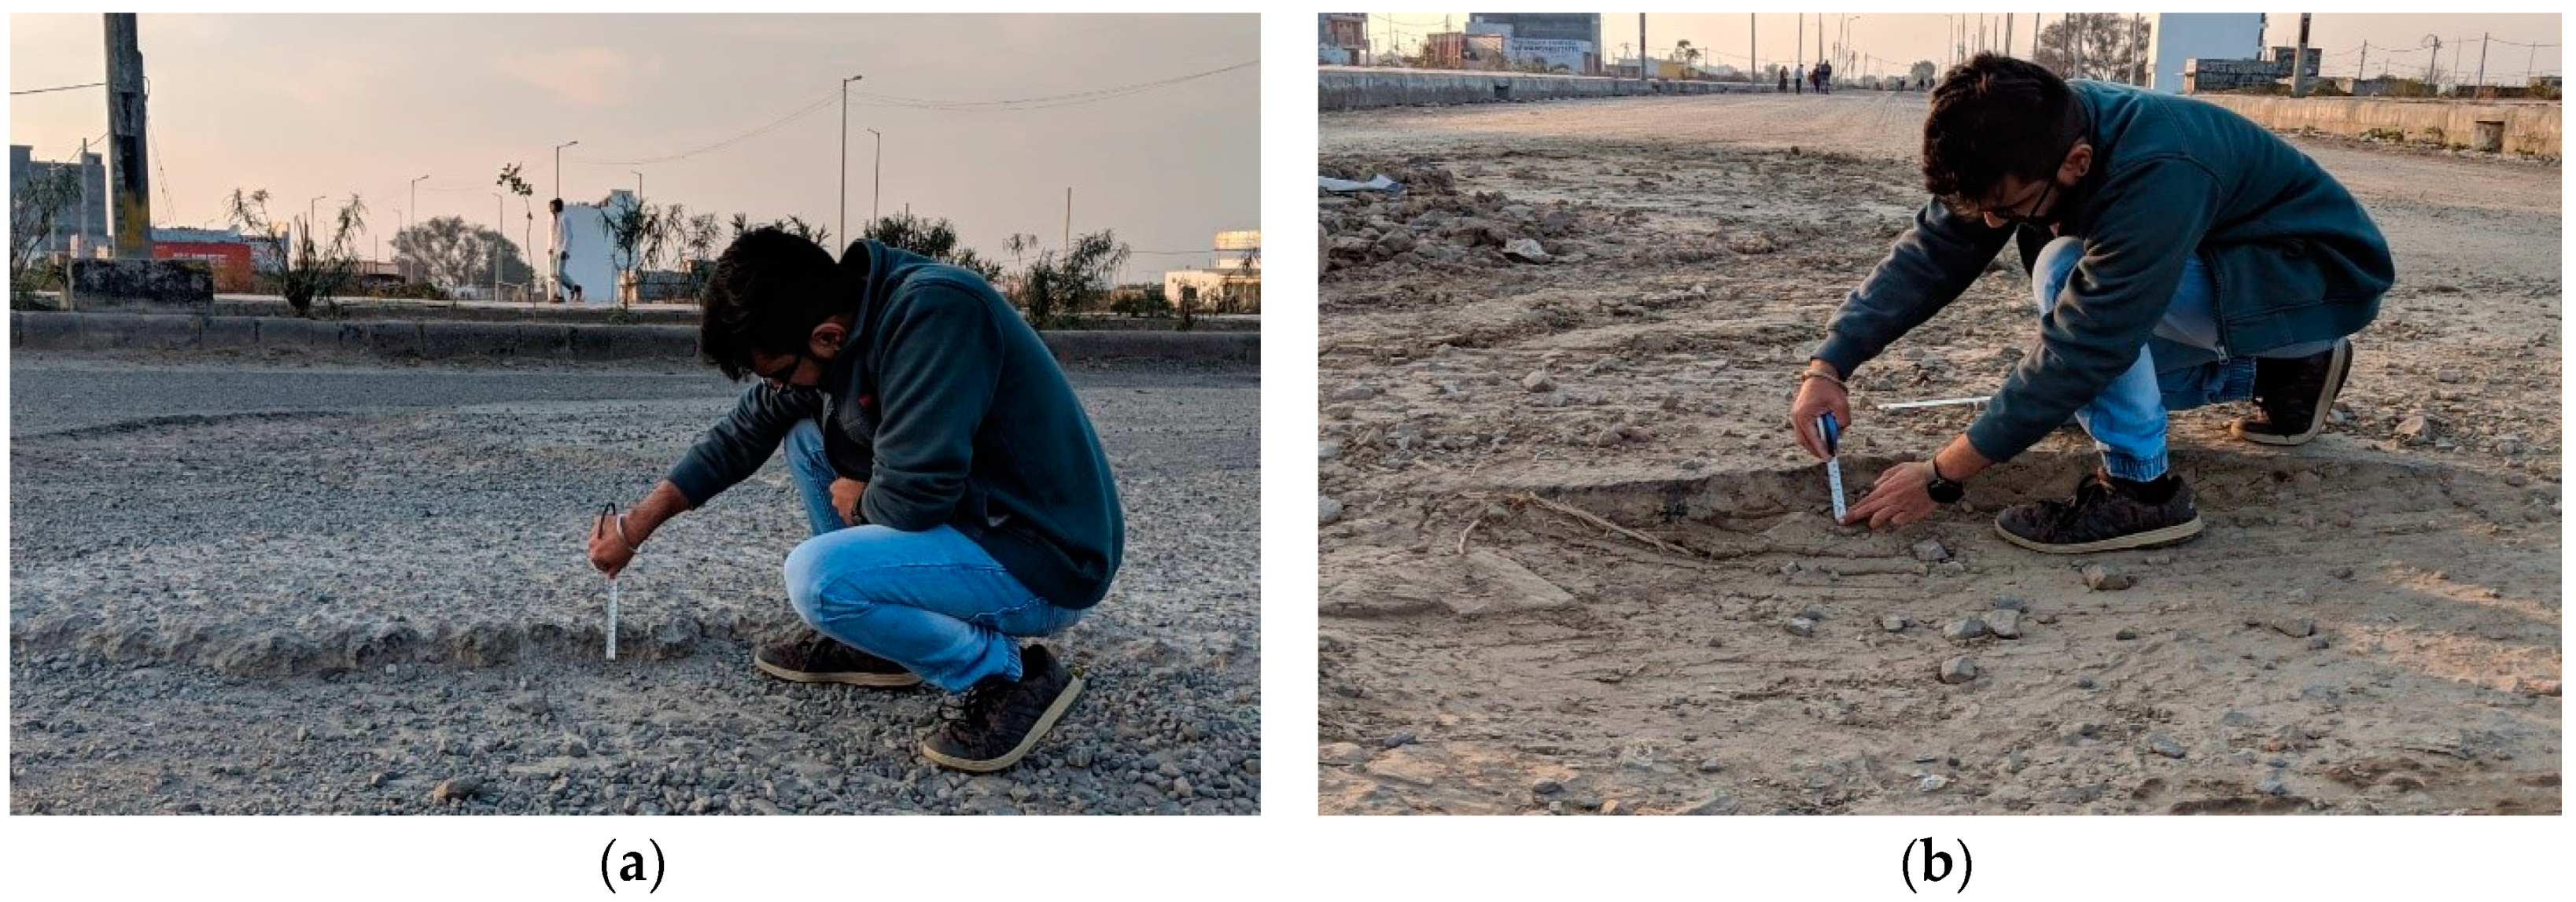
4.3. Manual Inspection

Manual inspection was performed using a band meter, which is used to measure the depth of an object with precision and accuracy. Figure 9 shows the manual inspection at R1 and R2, respectively. The proto test was conducted using manual inspection, and the results for R1 and R2 are shown in Table 7 and Table 8. Generally, manual inspection is performed using some technical equipment, but in our case, we performed a very traditional manual inspection. Different scales were used to measure the different potholes and speed bumps for the validation.

4.4. Validation of Proposed System with Other Techniques

The same experiment was conducted using three different methods several times on the very same roads; the rural road of Khora village and the urban road of the Yamuna Expressway. Each method, ultrasonic sensor, image processing, and manual inspection had slight deviations, as shown below. The comparison between three different techniques for depth/height, latitude, and longitude with their error are given in Table 9, Table 10, Table 11, Table 12, Table 13 and Table 14 for both roads.
The deviation of the location of the pothole is relevant in different methods. The ultrasonic sensor and image processing detection deviated slightly from the actual position. Ergo, to calculate the accuracy of the system, the mean of the output using different method was calculated. The maximum error was 4.60% and the efficiency of the proposed system was about 95.48%.
Table 15 shows a full comparison between the results obtained with the proposed methodology and those yielded by similar approaches. As can be seen, our approach clearly outperformed the others, where TPR is the True Positive Rate, FPR is the False Positive Rate, and FNR is the False Negative Rate. One of the strongest points presented in this research is the use of a multi-variate model for pothole and speed bump detection. The presented methodology builds a model by combining different methods for the detection of road surface irregularities which provides greater accuracy to the entire framework. The collaboration of different methods with our novel framework targets a much bigger audience, and since it is very cost effective, it makes this system ideal for road surface monitoring in all regions.

5. Conclusions

It has been highlighted that the current road anomaly detection frameworks used by the government or the existing authorities are very tedious and overwhelmingly time consuming, which is why this device eradicates all the problems and complications with the existing systems with much better efficiency. The analysis results demonstrated the use of ultrasonic sensors mated with an Arduino, GPS receivers, and HUD module, which runs on several filters. Dynamic time warping was also one of the algorithms used, which makes the validation process more manageable and is also one of the reasons for the increased efficiency. The presented Hanuman algorithm could detect the potholes and speed bumps accurately and efficiently. The calculated accuracy of the system was 95.48%, and the use of inexpensive components makes it the most cost effective framework among the existing systems. The model proposed in this paper serves two critical purposes (i.e., automatic detection of potholes, bumps, and alerting vehicle drivers to evade potential accidents). The HUD application provides real-time alerts about potholes and bumps right in front onto the windshield, making it more ergonomic. The framework works perfectly in all seasons, especially in monsoon as the signal/warning is generated from a database. The novel framework ha the highest efficiency when compared to all preexisting systems. Since it is a cost effective long time solution for pothole management, it can be easily provided to the maximum number of people; which can furthermore save many lives. Integration of GMaps and Satnav with the system can be done for ease of use. This framework can be applied to different types of road conditions and will be the future scope of this work.

Author Contributions

S.K.S. prepared the inspection system for the experiment and performed the experiments of this research. H.P. and J.L. conceived the original idea. J.L. designed the methodology and gave guidance and helped to improve the quality of the manuscript. S.K.S. wrote the original draft preparation in consultation with H.P. J.L reviewed and edited the final manuscript. All authors have read and agreed to the published version of the manuscript.

Funding

This work was supported by a National Research Foundation of Korea (NRF) grant funded by the Korea government (MSIT) (No. 2019R1A5A808320111, No. NRF-2019R1G1A1004577).

Acknowledgments

The authors would like to thank Amrit Seth, Ansh Mittal, and Vansh Malik, students at Amity University, who helped in conducting this research.

Conflicts of Interest

The authors declare that they have no conflict of interest. We declare that we do not have any commercial or associative interest that represents a conflict of interest in connection with the work submitted.

List of Abbreviations

GPSGlobal Positioning SystemPSDPower Spectral Density
DTWDynamic Time WarpingUIUnimportant Irregularity
HUDHead Up DisplaySTDStandard deviation
IFSIrregularity Frame SelectionTPRTrue Positive Rate
CIRCCircularityFPRFalse Positive Rate
WAverage widthFNRFalse Negative Rate

References

  1. Malik, Y.S. Road Accidents in India 2016; Ministry of Road Transport & Highways: Delhi, India, 2016.
  2. Guan, L.; Zou, M.; Wan, X.; Li, Y. Nonlinear Lamb Wave Micro-Crack Direction Identification in Plates with Mixed-Frequency Technique. Appl. Sci. 2020, 10, 2135. [Google Scholar] [CrossRef] [Green Version]
  3. Schnebele, E.; Tanyu, B.F.; Cervone, G.; Waters, N. Review of remote sensing methodologies for pavement management and assessment. Eur. Trans. Res. Rev. 2015, 7, 7. [Google Scholar] [CrossRef] [Green Version]
  4. Vittorio, A.; Rosolino, V.; Teresa, I.; Vittoria, C.M.; Vincenzo, P.G.; Francesco, D.M. Automated Sensing System for Monitoring of Road Surface Quality by Mobile Devices. Procedia-Soc. Behav. Sci. 2014, 111, 242–251. [Google Scholar] [CrossRef] [Green Version]
  5. Praticò, F.G.; Fedele, R.; Naumov, V.; Sauer, T. Detection and Monitoring of Bottom-Up Cracks in Road Pavement Using a Machine-Learning Approach. Algorithms 2020, 13, 81. [Google Scholar] [CrossRef] [Green Version]
  6. Vupparaboina, K.K.; Tamboli, R.R.; Shenu, P.M.; Jana, S. Laser-based detection and depth estimation of dry and water-filled potholes: A geometric approach. In Proceedings of the 2015 Twenty First National Conference on Communications (NCC), Mumbai, India, 27 February–1 March 2015; pp. 1–6. [Google Scholar]
  7. Mohan, P.; Padmanabhan, V.N.; Ramjee, R. Nericell: Rich Monitoring of Road and Traffic Conditions using Mobile Smartphones. In Proceedings of the 6th ACM Conference on Embedded Network Sensor Systems, Raleigh, NC, USA, 5–7 November 2008; p. 323. [Google Scholar]
  8. Eriksson, J.; Girod, L.; Hull, B.; Newton, R.; Madden, S.; Balakrishnan, H. The Pothole Patrol: Using a Mobile Sensor Network for Road Surface Monitoring. In Proceedings of the 6th International Conference on Mobile Systems, Applications, and Services, Breckenridge, CO, USA, 17-20 June 2008; p. 29. [Google Scholar] [CrossRef]
  9. Kang, B.; Choi, S. Pothole detection system using 2D LiDAR and camera. In Proceedings of the 2017 Ninth International Conference on Ubiquitous and Future Networks (ICUFN), Milan, Italy, 4–7 July 2017; pp. 744–746. [Google Scholar]
  10. Forrest, M.M.; Chen, Z.; Hassan, S.; Raymond, I.O.; Alinani, K. Cost Effective Surface Disruption Detection System for Paved and Unpaved Roads. IEEE Access 2018, 6, 48634–48644. [Google Scholar] [CrossRef]
  11. Singh, G.; Kumar, R.; Kashtriya, P. Detection of Potholes and Speed Breaker on Road. In Proceedings of the 2018 First International Conference on Secure Cyber Computing and Communication (ICSCCC), Jalandhar, India, 15–17 December 2018; pp. 490–495. [Google Scholar]
  12. Madli, R.; Hebbar, S.; Pattar, P.; Golla, V. Automatic Detection and Notification of Potholes and Humps on Roads to Aid Drivers. IEEE Sens. J. 2015, 15, 4313–4318. [Google Scholar] [CrossRef]
  13. Shivaleelavathi, B.G.; Yatnalli, V.; Chinmayi, S.Y.V.; Thotad, S. Design and Development of an Intelligent System for Pothole and Hump Identification on Roads. Int. J. Recent Technol. Eng. 2019, 8, 5294–5300. [Google Scholar] [CrossRef]
  14. Devapriya, W.; Babu, C.N.K.; Srihari, T. Real time speed bump detection using Gaussian filtering and connected component approach. In Proceedings of the 2016 World Conference on Futuristic Trends in Research and Innovation for Social Welfare (Startup Conclave), Coimbatore, India, 29 February 2016–1 March 2016; pp. 1–5. [Google Scholar]
  15. Chen, K.; Lu, M.; Fan, X.; Wei, M.; Wu, J. Road condition monitoring using on-board Three-axis Accelerometer and GPS Sensor. In Proceedings of the 2011 6th International ICST Conference on Communications and Networking in China (CHINACOM), Harbin, China, 17–19 August 2011; pp. 1032–1037. [Google Scholar]
  16. Arroyo, C.; Bergasa, L.M.; Romera, E. Adaptive fuzzy classifier to detect driving events from the inertial sensors of a smartphone. In Proceedings of the 2016 IEEE 19th International Conference on Intelligent Transportation Systems (ITSC), Janeiro, Brazil, 1–4 November 2016; pp. 1896–1901. [Google Scholar]
  17. Aljaafreh, A.; Alawasa, K.; Alja’afreh, S.; Abadleh, A. Fuzzy inference system for speed bumps detection using smart phone accelerometer sensor. J. Telecommun. Electron. Comput. Eng. 2017, 9, 133–136. [Google Scholar]
  18. Astarita, V.; Caruso, M.V.; Danieli, G.; Festa, D.C.; Giofrè, V.P.; Iuele, T.; Vaiana, R. A Mobile Application for Road Surface Quality Control: UNIquALroad. Procedia-Soc. Behav. Sci. 2012, 54, 1135–1144. [Google Scholar] [CrossRef] [Green Version]
  19. Gonzalez, R.C.; Woods, R.E.; Masters, B.R. Digital Image Processing, 3rd ed.; Tata McGraw-Hill Education: New York, NY, USA, 2009; Volume 14, ISBN 0201180758. [Google Scholar]
  20. Yu, B.X.; Yu, X. Vibration-Based System for Pavement Condition Evaluation. Appl. Adv. Technol. Transp. 2019, 1, 183–189. [Google Scholar]
  21. Han, S.; Liu, M.; Shang, W.; Qi, X.; Zhang, Z.; Dong, S. Timely and Durable Polymer Modified Patching Materials for Pothole Repairs in Low Temperature and Wet Conditions. Appl. Sci. 2019, 9, 1949. [Google Scholar] [CrossRef] [Green Version]
  22. Koch, C.; Brilakis, I. Pothole detection in asphalt pavement images. Adv. Eng. Inform. 2011, 25, 507–515. [Google Scholar] [CrossRef]
  23. Mohamed, A.; Fouad, M.M.M.; Elhariri, E.; El-Bendary, N.; Zawbaa, H.M.; Tahoun, M.; Hassanien, A.E. RoadMonitor: An Intelligent Road Surface Condition Monitoring System; Springer: Cham, Switzerland, 2015; pp. 377–387. [Google Scholar]
Figure 1. Flow chart of the proposed novel system includes ultrasonic sensor with dynamic time warping (DTW).
Applsci 10 04490 g001
Figure 2. Working of ultrasonic sensor, (a) Plain road, (b) Speed bump, and (c) pothole.
Applsci 10 04490 g002
Figure 3. Timing response of the ultrasonic sensor.
Applsci 10 04490 g003
Figure 4. Components used in the road surface monitoring system: (a) Arduino with HY-SRF05; (b) GPS Receiver; (c) Head-up display module.
Applsci 10 04490 g004
Figure 5. Procedure to categorize the image using the proposed method: (a) original image; (b) processed image; (c) further processed image; (d) image after Hanuman algorithm; (e) report of the Hanuman algorithm.
Applsci 10 04490 g005
Figure 6. Procedure to categorize the image using the proposed method: (a) original image; (b) processed image; (c) further processed image; (d) image after Hanuman algorithm; (e) report of Hanuman algorithm.
Applsci 10 04490 g006
Figure 7. Field test sites for road surface monitoring: (a) Yamuna expressway (from Noida to Agra, India); (b) potholes on the main roads (Khora, Noida)
Applsci 10 04490 g007
Figure 8. Experimental comparison of R1 (Yamuna expressway, urban site) and R2 (potholes on the main road (Khora, Noida, rural site)
Applsci 10 04490 g008
Figure 9. Manual inspection on a rough patch in the middle of R1 (a) and R2 (b).
Applsci 10 04490 g009
Table 1. The hardware specification of the proposed framework.
ComponentHardware Description
ArduinoMicrocontroller board based on ATmega328 using an open-source, prototyping platform, having 14 digital input/output pins (6 can be used as PWM outputs), 6 analog inputs, 16 MHz crystal oscillator, USB connection, power jack, ICSP header, and a reset button.
HY-SRF05Narrow acceptance angle, 5-pin male header with 2.54 mm (0.1") spacing, 35 mA active, Range: approximately to 4 m (12- feet), Power requirements: +5 VDC; Communication: Dimensions: 22 × 46 × 16 mm (0.81 × 1.8 × 0.6 in), positive TTL pulse, Operating temperature range: 0 to + 70 °C (+32 to +158 °F). Figure 4a Arduino with HY-SRF05.
GPS ReceiverIt is a satellite navigation system and is used to capture geographic location and time, irrespective of the weather conditions (Figure 4b).
HUDA mobile device that used to display the information on the windshield as shown in Figure 4c.
FiltersSeveral filters like Speed, Separating Z-Axis, Moving Average, Band Pass, and Virtual Orientation are used.
Table 2. Software and hardware specifications used in the experimental setup
Technique UsedDTW + Ultrasonic Sensor + Image Processing
Location of ExperimentNoida City, UP, North India.
OS of the Data Collection SystemWindows 10 Pro
Equipment used for Data CollectionDell XPS 15z, HP Pavilion DV9000
Vehicle(s) usedHonda Amaze (2016)
Distance Covered (km)/Travel time (hours)(150–170 km/4 h)
DetectionLocation of potholes, speed bumps on the roads
Table 3. Information of pothole (P) and bumps (B) collected during real-time testing using an ultrasonic sensor with dynamic time warping (DTW) for the R1 test site.
Scenario No.Obstacle TypeDepth/Height (cm)Latitude (°N)Longitudinal (°E)
1B3.028.421577.5261
2B3.028.421677.5261
3P2.628.421577.5265
4B5.228.421477.5266
5B4.828.421477.5268
Table 4. Information of pothole (P) and bumps (B) collected during real-time testing using ultrasonic sensor with DTW for R2 test site
Scenario No.Obstacle TypeDepth/Height (cm)Latitude (°N)Longitudinal (°E)
1P9.2728.618677.5544
2B2.2028.624377.5661
3B8.6328.654377.5667
4P13.1228.672277.5643
5P8.2028.693277.5634
6P8.1928.742377.5612
7B3.2028.786577.5755
8P1.7728.793377.5765
9B3.7228.865477.5659
10P12.1628.965377.5760
Table 5. Information of pothole (P) and bumps (B) collected during real-time testing using the image processing method for the R1 test site.
Scenario No.Obstacle TypeDepth/Height (cm)Latitude (°N)Longitudinal (°E)
1B3.1427.193776.5725
2B3.1127.540576.4872
3P2.5728.069176.4799
4B5.4028.808076.6505
5B4.6027.997977.1004
Table 6. Information of pothole (P) and bumps (B) collected during real-time testing using the image processing method for the R2 test site.
Scenario No.Obstacle TypeDepth/Height (cm)Latitude (°N)Longitudinal (°E)
1P8.869527.416676.2903
2B2.131827.450775.7666
3B8.359027.651477.3884
4P12.927128.328176.5420
5P8.208227.775074.2999
6P7.898428.282475.7508
7B3.068228.066874.5035
8P1.714428.062075.3345
9B3.601027.930275.0760
10P11.600628.281775.0858
Table 7. Information of pothole (P) and bumps (B) collected by manual inspection for the R1 test site.
Scenario No.Obstacle TypeDepth/Height (cm)Latitude (°N)Longitudinal (°E)
1B3.1127.4178.65
2B3.1327.2576.50
3P2.5027.5376.49
4B5.3028.0076.61
5B4.5828.4577.17
Table 8. Information of pothole (P) and bumps (B) collected by manual inspection for the R2 test site.
Scenario No.Obstacle TypeDepth/Height (cm)Latitude (°N)Longitudinal (°E)
1P8.828.1575.72
2B2.1527.9676.33
3B8.2928.2075.63
4P12.9327.9675.60
5P7.8828.3575.75
6P7.9528.0674.49
7B3.1528.3275.33
8P1.7028.4576.31
9B3.5927.9475.77
10P11.8728.0377.40
Table 9. Comparison of depth/height between the proposed system (PS), image processing (IP), and manual inspection (MI) for the R1 test site.
Scenario No.Obstacle TypeDepth/Height (cm)
Proposed SystemImage ProcessingManual Inspection% Error
(PS vs. IP)
% Error
(PS vs. MI)
1B3.03.143.114.673.67
2B3.03.113.133.674.33
3P2.62.572.50−1.15−3.85
4B5.25.405.303.851.92
5B4.84.604.58−4.17−4.58
Table 10. Comparison of latitude between the proposed system (PS), image processing (IP), and manual inspection (MI) for the R1 test site.
Scenario No.Obstacle TypeLatitude (°N)
Proposed SystemImage ProcessingManual Inspection% Error
(PS vs. IP)
% Error
(PS vs. MI)
1B28.421527.193727.414.323.56
2B28.421627.540527.253.14.12
3P28.421528.069127.531.243.14
4B28.421428.808028.00−1.361.47
5B28.421427.997928.451.49−0.1
Table 11. Comparison of longitude between the proposed system (PS), image processing (IP), and manual inspection (MI) for the R1 test site.
Scenario No.Obstacle TypeLongitude (°E)
Proposed SystemImage ProcessingManual Inspection% Error
(PS vs. IP)
% Error
(PS vs. MI)
1B77.526176.572578.651.23-1.45
2B77.526176.487276.501.341.32
3P77.526576.479976.491.351.34
4B77.526676.650576.611.131.18
5B77.526877.100477.170.550.46
Table 12. Comparison of depth/height between the proposed system (PS), image processing (IP), and manual inspection (MI) for the R2 test site.
Scenario No.Obstacle TypeDepth/Height (cm)
Proposed SystemImage ProcessingManual Inspection% Error
(PS vs. IP)
% Error
(PS vs. MI)
1B9.278.86958.884.324.21
2B2.202.13182.153.102.34
3P8.638.35908.293.143.96
4B13.1212.927112.931.471.47
5B8.208.20827.88-0.103.96
6P8.197.89847.953.562.89
7B3.203.06823.154.121.63
8P1.771.71441.703.144.10
9B3.723.60103.593.203.50
10P12.1611.600611.874.602.36
Table 13. Comparison of latitude between the proposed system (PS), Image processing (IP), and Manual inspection (MI) for the R2 test site.
Scenario No.Obstacle TypeLatitude (°N)
Proposed SystemImage ProcessingManual Inspection% Error
(PS vs. IP)
% Error
(PS vs. MI)
1B28.618627.416628.154.201.63
2B28.624327.450727.964.102.32
3P28.654327.651428.203.501.60
4B28.672228.328127.961.202.50
5B28.693227.775028.353.201.20
6P28.742328.282428.061.602.36
7B28.786528.066828.322.501.63
8P28.793328.062028.452.541.20
9B28.865427.930227.943.243.20
10P28.965328.281728.032.363.24
Table 14. Comparison of longitude between the proposed system (PS), image processing (IP), and manual inspection (MI) for the R2 test site.
Scenario No.Obstacle TypeLongitude (°E)
Proposed SystemImage ProcessingManual Inspection% Error
(PS vs. IP)
% Error
(PS vs. MI)
1B77.554476.290375.721.632.36
2B77.566175.766676.332.321.60
3P77.566877.388475.630.232.50
4B77.566976.543075.601.322.54
5B77.565474.299975.754.212.34
6P77.565875.750874.492.343.96
7B77.575574.503575.333.962.89
8P77.576575.334576.312.891.63
9B77.565975.076075.773.212.32
10P77.576075.085877.403.210.23
Table 15. Detection rate comparison of different approaches on previous research.
AuthorDetection RateApproach
Devapriya et al. [14]30–92% TPRComputer Vision Accelerometer & GPS
Eriksson et al. [8]0.2 FPR
Mohan et al. [7]11.1% FPR & 22% FNRAccelerometer, Microphone, GPS & GSM
Forrest et al. [10]62% AccuracyUltrasonic
Singh et al. [11]59.23% AccuracyGlobal positioning system receiver and ultrasonic
Madli et al. [12] 74% AccuracyUltrasonic and GPS
Shivaleelavathi et al. [13] 79% AccuracyRaspberry Pi, GPS, ultrasonic
Mohamed et al. [23]75.6–87.8% (Accuracy)Accelerometer
Astarita et al. [18] 90% Accuracy, 35% FPAccelerometer using Smart Phone
Proposed system95.48% (Accuracy)Ultrasonic Sensor, Image Processing and manual Inspection

