Assessment of Areal Methane Yields from Energy Crops in Ukraine, Best Practices

 ,
,  ,
, 

Abstract
1. Introduction
2. Materials and Methods
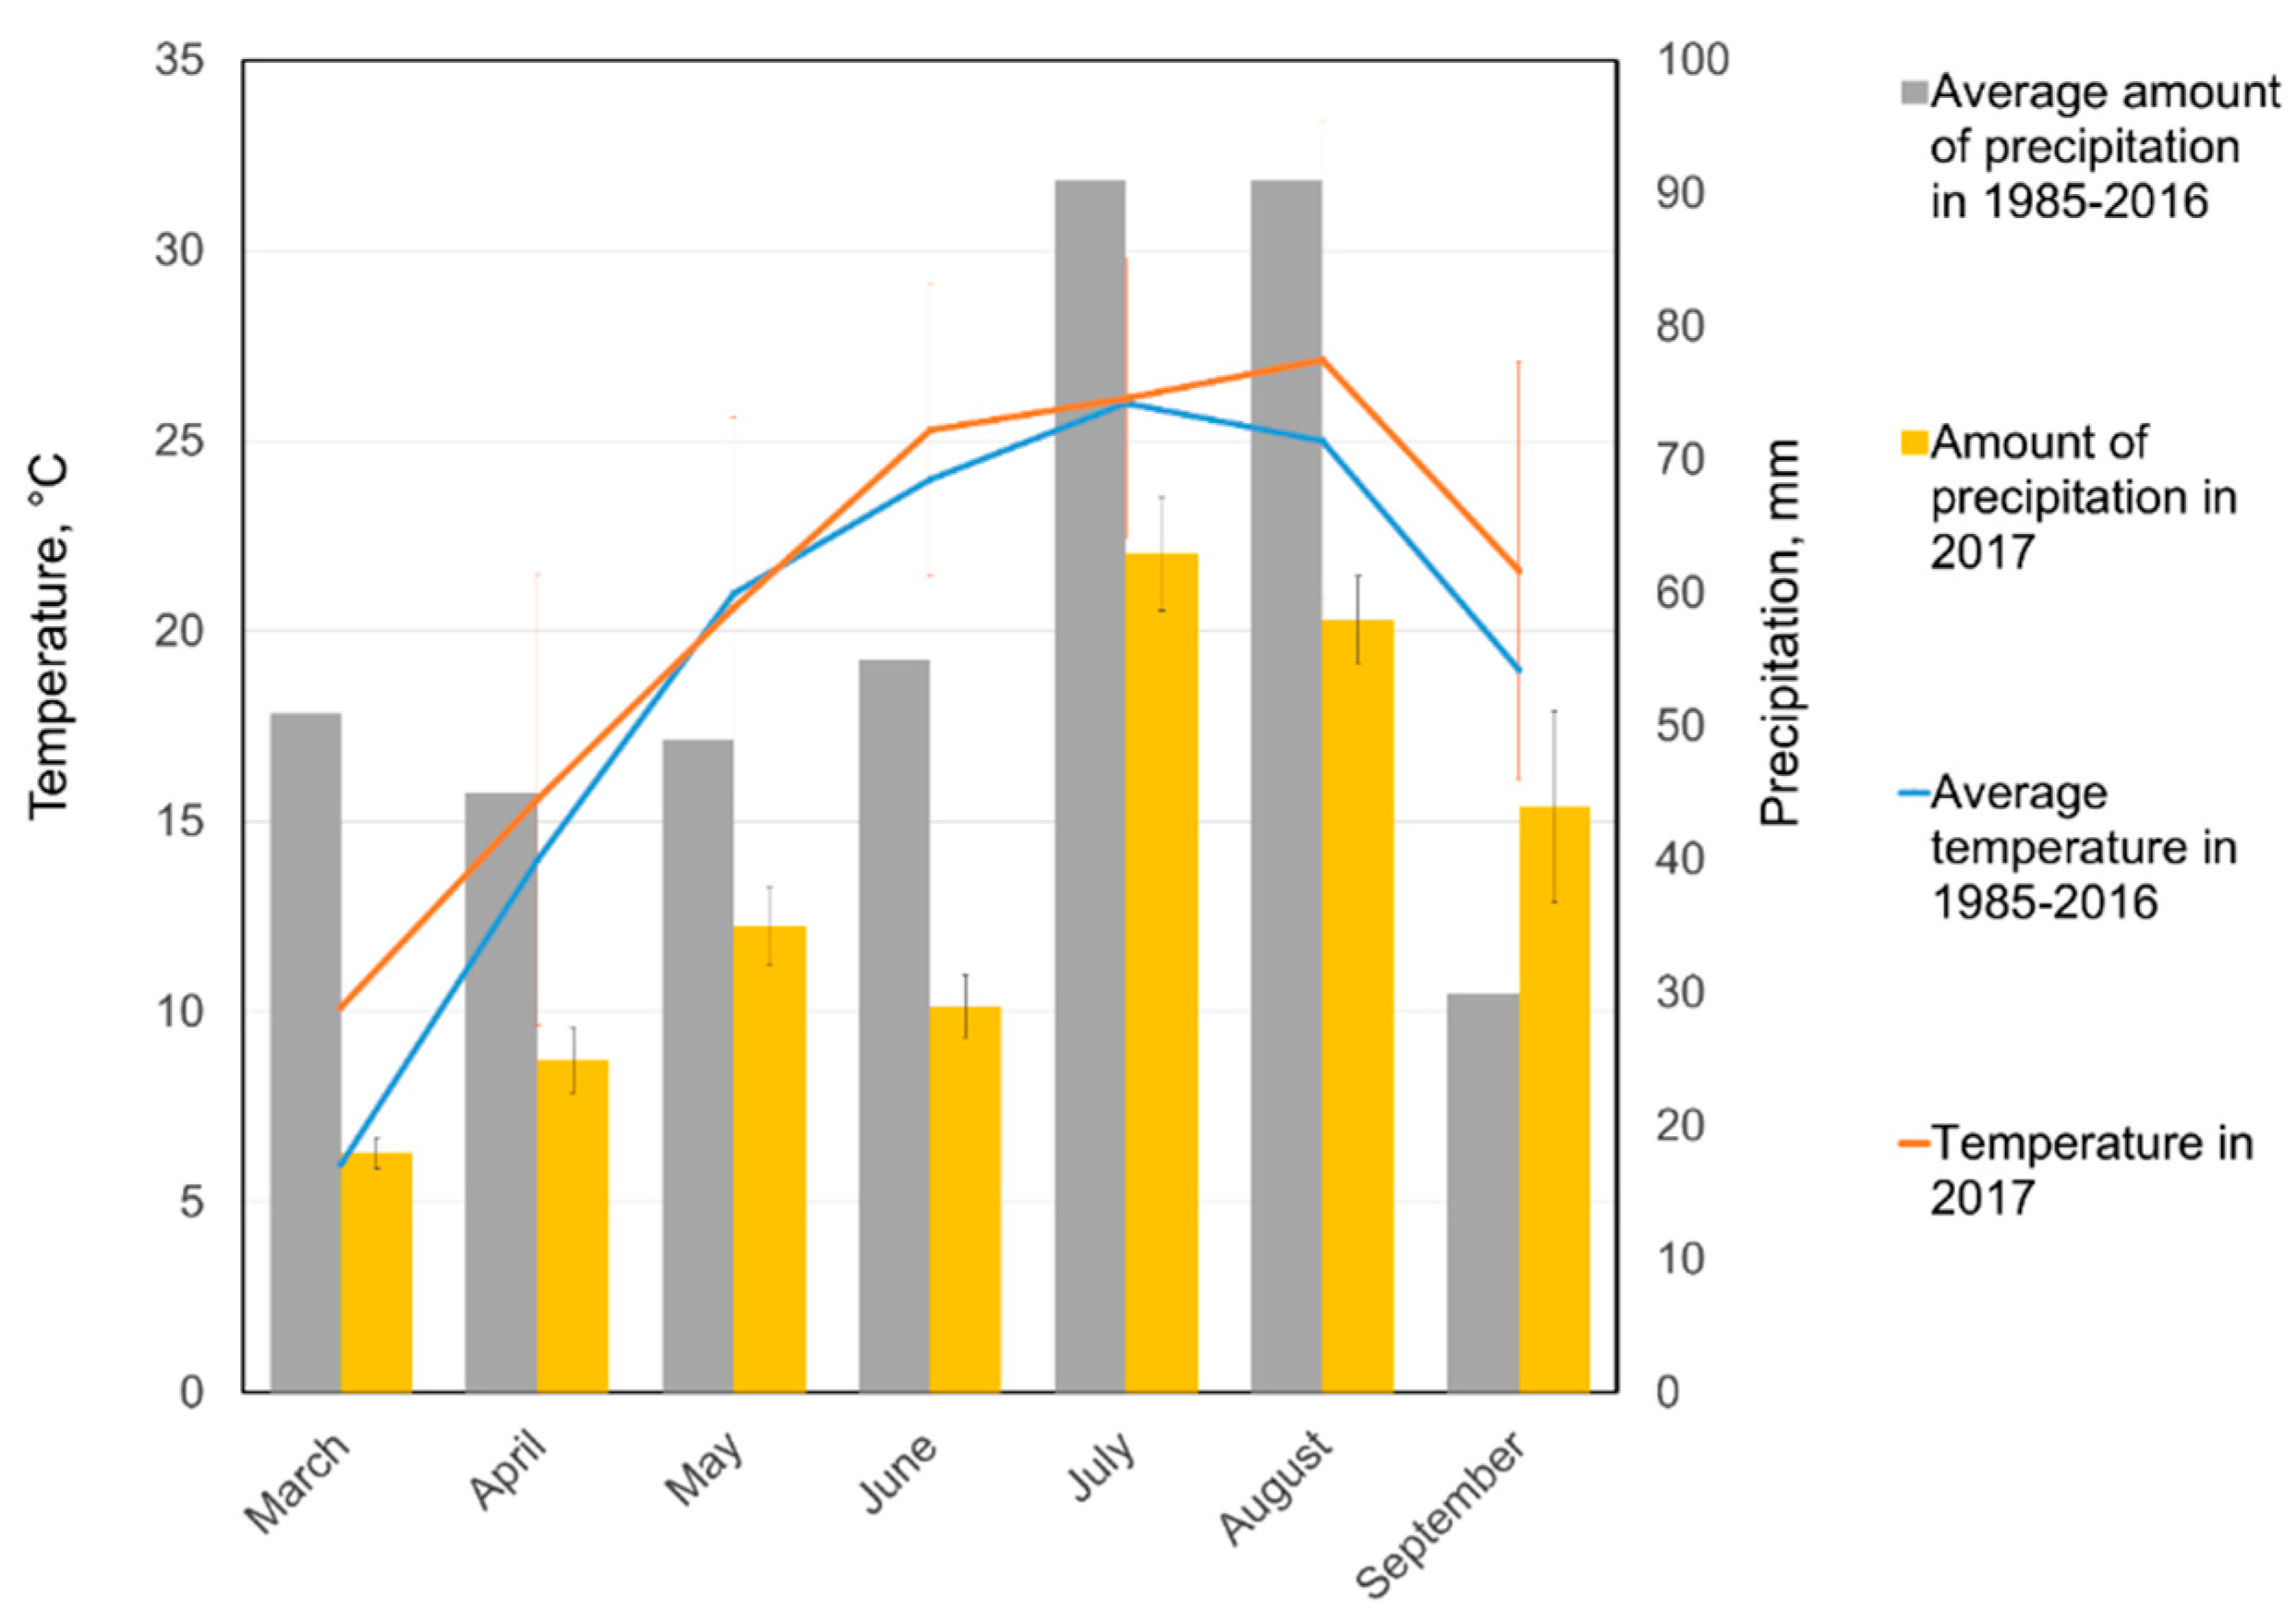
2.1. Experiment Overview
2.2. Field Trials and Plant Material
2.2.1. Field Trials
2.2.2. Plant Material
2.3. SMY and AMY
2.3.1. SMY
2.3.2. AMY
2.4. Statistical Analysis
3. Results and Discussion
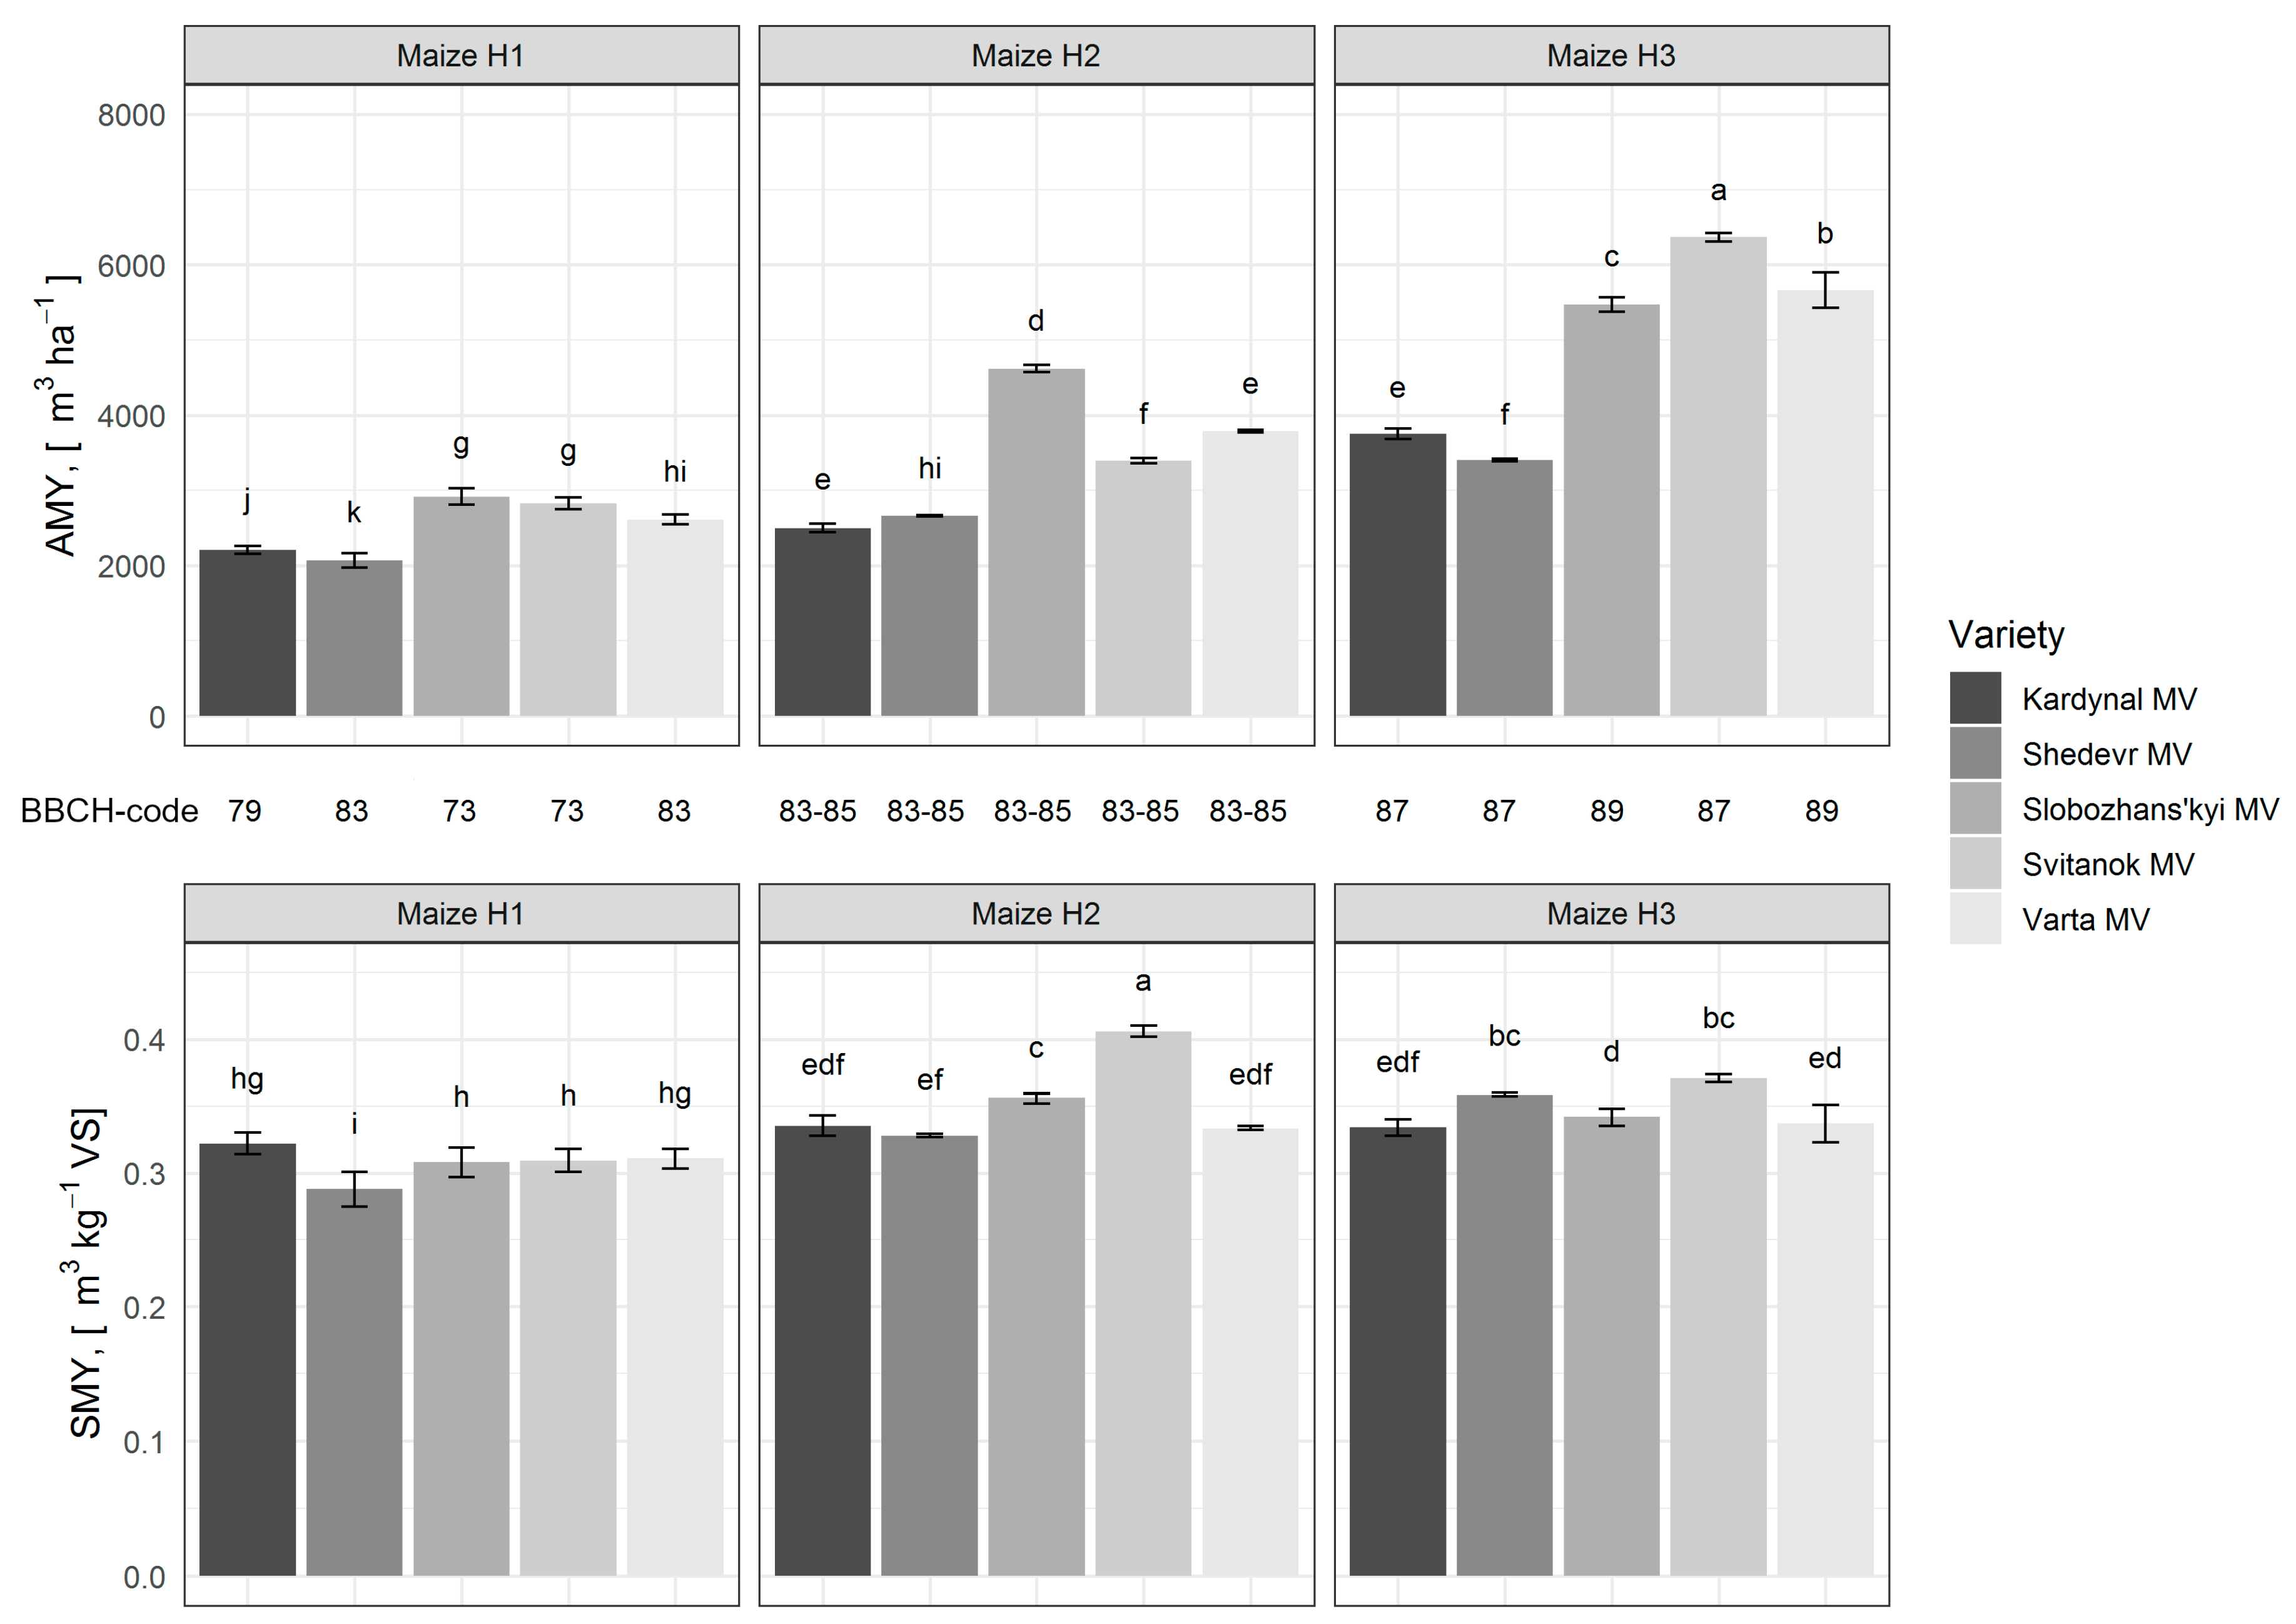
3.1. Maize
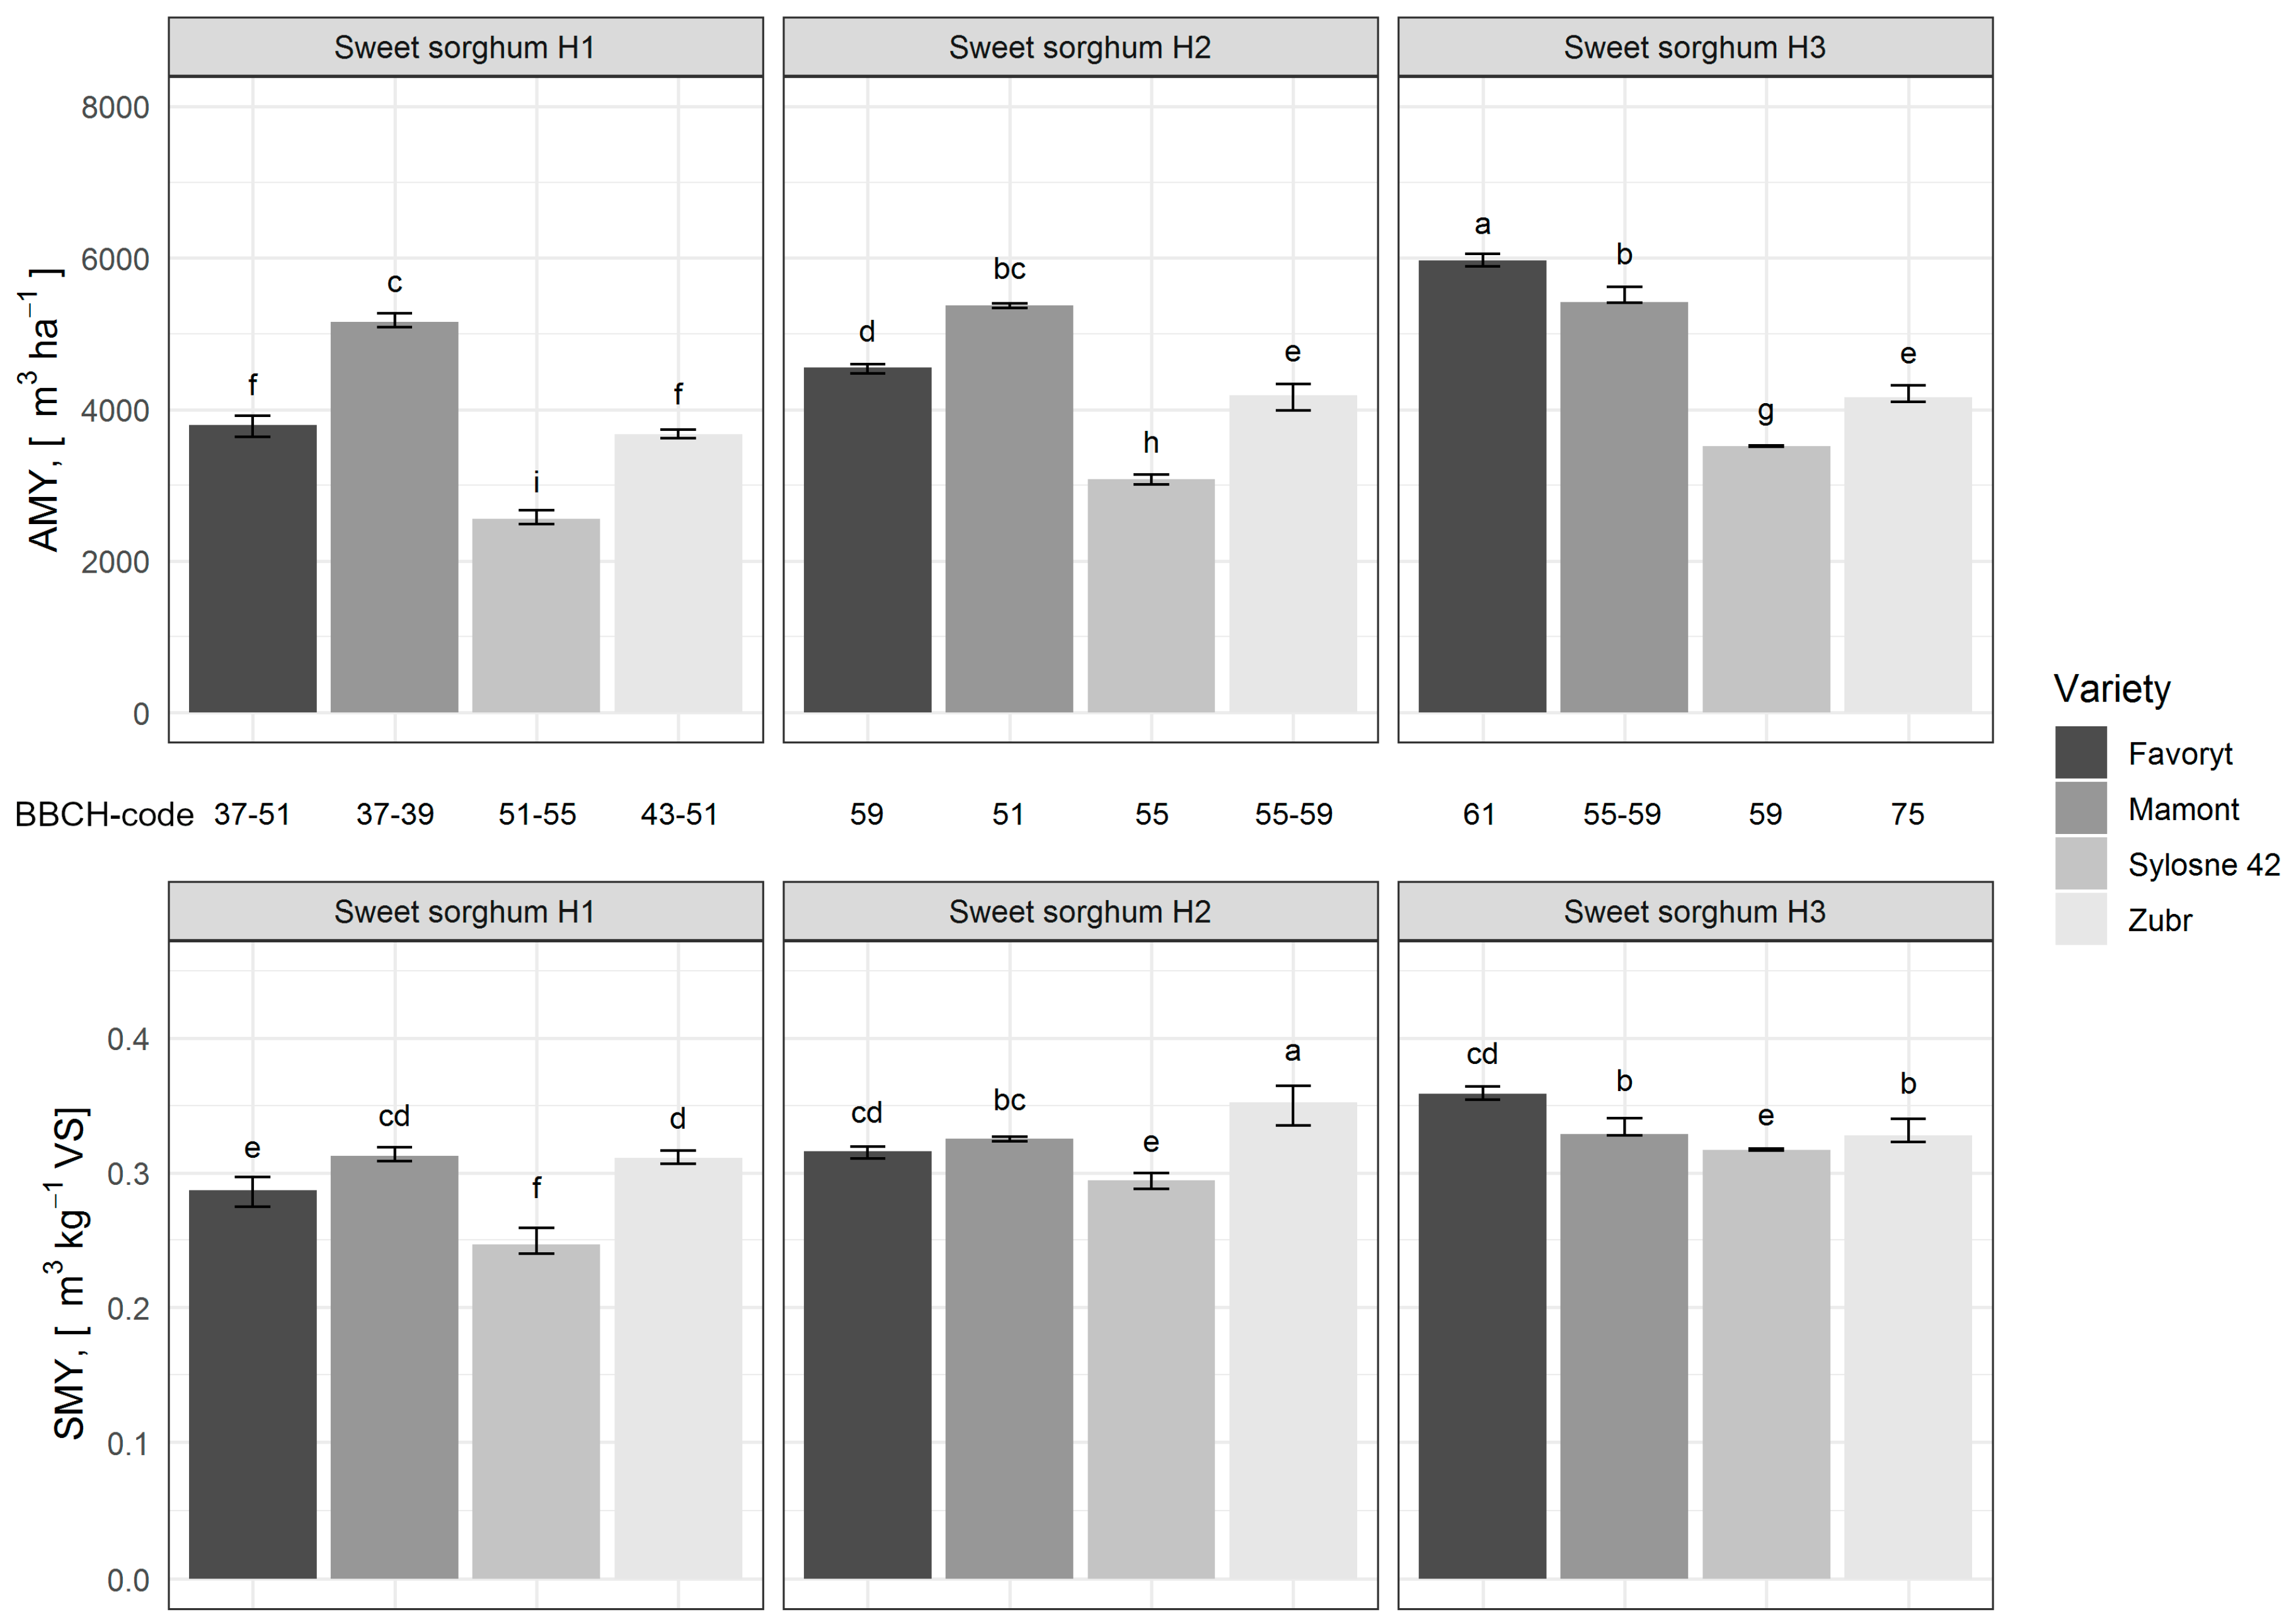
3.2. Sweet Sorghum
3.3. Miscanthus
- -
- Species Giant Chinese Silver Grass: Miscanthus x giganteus J.M Greef & Deuter ex Hodkinson Renvoiz, the variety name “Osinnii zoretsvit”. We refer to the analysed variety simply as “Giganteus”.
- -
- Species Chinese Silver Grass: Miscanthus sinensis Anderss., the variety name “Misiachnyi promin`”. We refer to this variety simply as “Sinensis”.
3.4. Data Analysis for Maize, Sweet Sorghum and Miscanthus
3.5. Other Analysed Crops
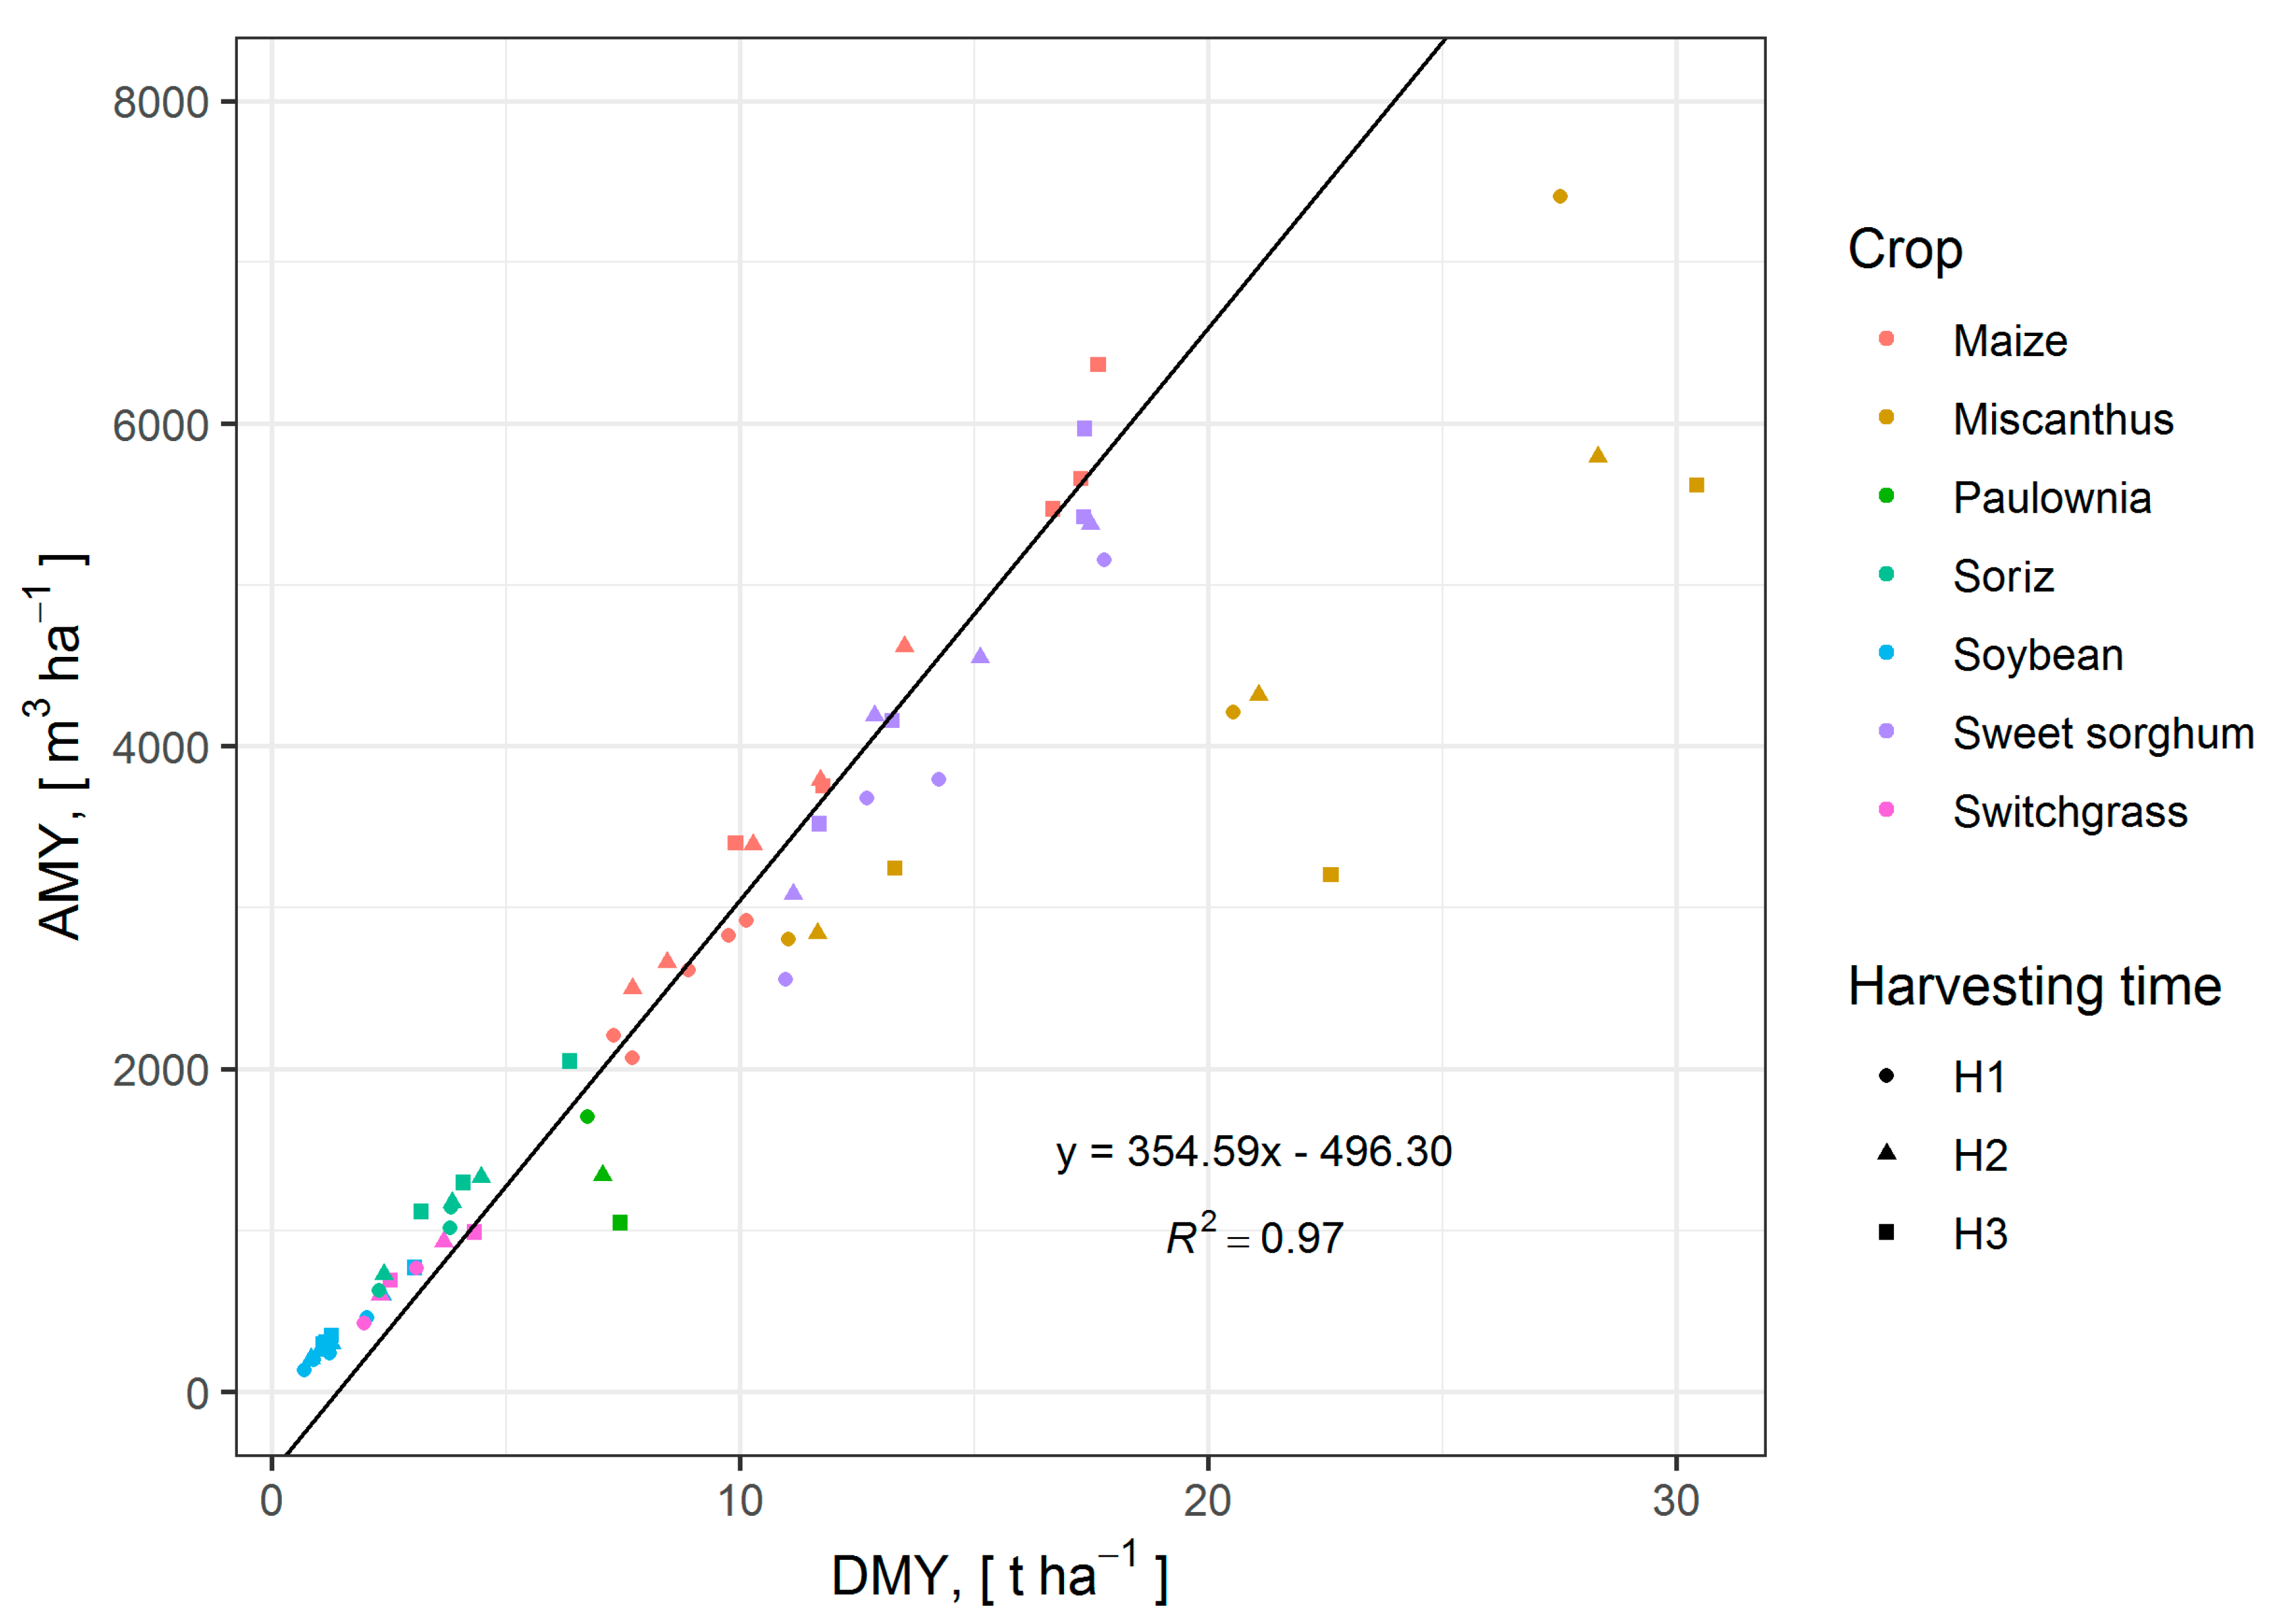
3.6. Influence of DMY on AMY
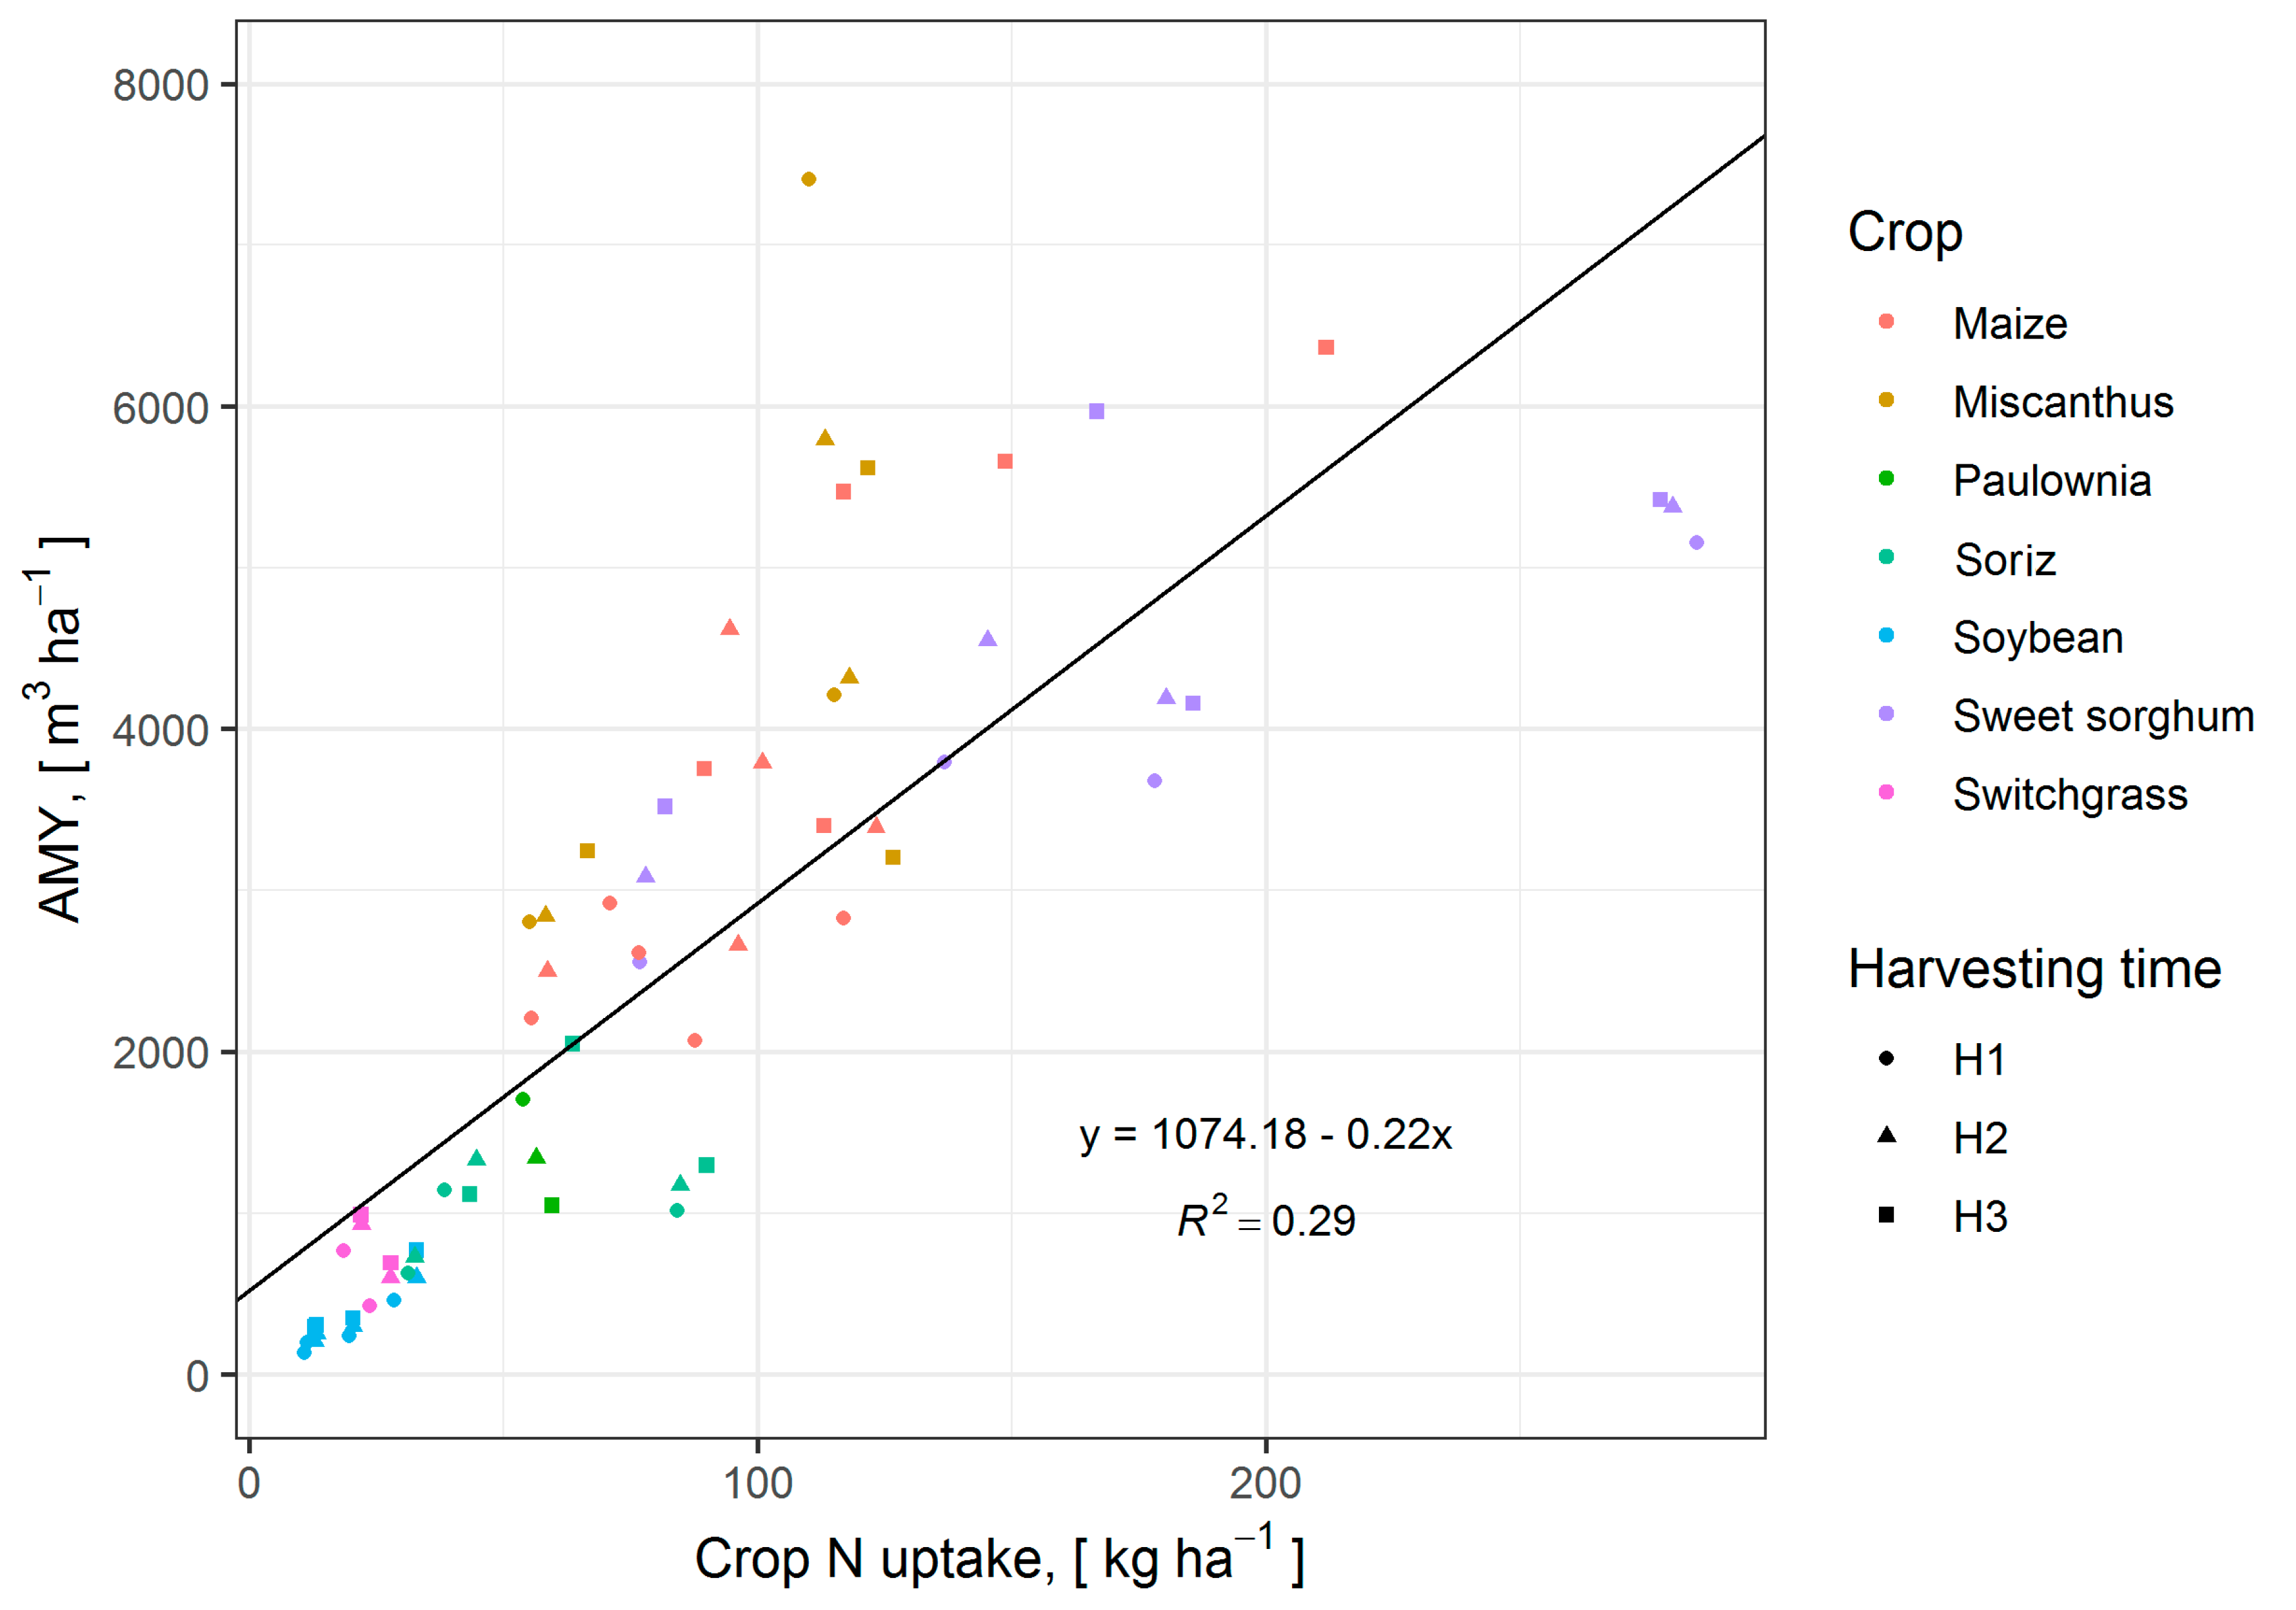
3.7. Influence of Crop N Uptake on AMY
4. Conclusions
Author Contributions
Funding
Acknowledgments
Conflicts of Interest
References
- State Statistics Service of Ukraine. Available online: http://www.ukrstat.gov.ua/ (accessed on 19 June 2020).
- Scarlat, N.; Dallemand, J.-F.; Fahl, F. Biogas: Developments and perspectives in Europe. Renew. Energy 2018, 129, 457–472. [Google Scholar] [CrossRef]
- State Agency on Energy Efficiency and Energy Saving of Ukraine. Ukraine, There Operate Biogas Plants with a Total Capacity of 70 MW (В Україні працюють біoгазoві устанoвки загальнoю пoтужністю 70 МВт). Available online: https://www.kmu.gov.ua/news/derzhenergoefektivnosti-v-ukrayini-pracyuyut-biogazovi-ustanovki-zagalnoyu-potuzhnistyu-70-mvt (accessed on 4 February 2020).
- Babych, M.M. Food security indicators in Ukraine: Development trends (Індикатoри прoдoвoльчoї безпеки в Україні: тенденції рoзвитку). Ekonomika APK 2018, 5, 41–50. [Google Scholar]
- State Service of Ukraine for Geodesy, Cartography & Cadastre. The Land Fund of Ukraine as of January 1, 2016 and the Dynamics of its Changes Compared to the Data as of January 1, 2015. (Земельний фoнд України станoм на 1 січня 2016 рoку та динаміка йoгo змін у пoрівнянні з даними на 1 січня 2015 рoку). Available online: https://land.gov.ua/info/zemelnyi-fond-ukrainy-stanom-na-1-sichnia-2016-roku-ta-dynamika-ioho-zmin-u-porivnianni-z-danymy-na-1-sichnia-2015-roku/ (accessed on 30 March 2020).
- SEEMLA Project-Horizon. 2020. Available online: https://www.seemla.eu/ukraine/ (accessed on 30 March 2020).
- Bioplat EU Project-Horizon. 2020. Available online: https://bioplat.eu/about (accessed on 30 March 2020).
- State Agency on Energy Efficiency and Energy Saving of Ukraine. Ukraine Will Implement a Program of State Support for Bioenergy Crops. Available online: https://www.ukrinform.ua/rubric-economy/2840751-v-ukraini-zaprovadat-programu-derzpidtrimki-bioenergeticnih-kultur.html (accessed on 19 June 2020).
- Lehtomäki, A. Biogas Production from Energy Crops and Crop Residues; University of Jyväskylä: Jyväskylä, Finland, 2006; ISBN 951-39-2559-5. [Google Scholar]
- Herrmann, C.; Idler, C.; Heiermann, M. Biogas crops grown in energy crop rotations: Linking chemical composition and methane production characteristics. Bioresour. Technol. 2016, 206, 23–35. [Google Scholar] [CrossRef] [PubMed]
- El Bassam, N. Handbook of Bioenergy Crops; Routledge: Abingdon, UK, 2010; ISBN 978-1-84407-854-7. [Google Scholar]
- Amon, T.; Amon, B.; Kryvoruchko, V.; Machmüller, A.; Hopfner-Sixt, K.; Bodiroza, V.; Hrbek, R.; Friedel, J.; Pötsch, E.; Wagentristl, H.; et al. Methane production through anaerobic digestion of various energy crops grown in sustainable crop rotations. Bioresour. Technol. 2007, 98, 3204–3212. [Google Scholar] [CrossRef] [PubMed]
- Hübner, M.; Oechsner, H.; Koch, S.; Seggl, A.; Hrenn, H.; Schmiedchen, B.; Wilde, P.; Miedaner, T. Impact of genotype, harvest time and chemical composition on the methane yield of winter rye for biogas production. Biomass Bioenergy 2011, 35, 4316–4323. [Google Scholar] [CrossRef]
- Mukengele, M.M. Biochemical Composition of Biomass and its Impact on the Prediction of the Specific Methane Yield Potential; University of Hohenheim: Stuttgart, Germany, 2017. [Google Scholar]
- Kiesel, A.; Lewandowski, I. Miscanthus as biogas substrate-cutting tolerance and potential for anaerobic digestion. GCB Bioenergy 2017, 9, 153–167. [Google Scholar] [CrossRef]
- Zegada-Lizarazu, W.; Elbersen, H.W.; Cosentino, S.L.; Zatta, A.; Alexopoulou, E.; Monti, A. Agronomic aspects of future energy crops in Europe. Spec. Issue Biofuels Eur. 2010, 4, 674–691. [Google Scholar] [CrossRef]
- Kotrla, M.; Prčík, M. Evaluating the Effects of Climatic Parameters on Growth and Biomass Production of Miscanthus in Climate Conditions of Southern Slovakia. Pol. J. Environ. Stud. 2019, 29, 669–675. [Google Scholar] [CrossRef]
- Hui, D.; Yu, C.-L.; Deng, Q.; Dzantor, E.K.; Zhou, S.; Dennis, S.; Sauve, R.; Johnson, T.L.; Fay, P.A.; Shen, W.; et al. Effects of precipitation changes on switchgrass photosynthesis, growth, and biomass: A mesocosm experiment. PLoS ONE 2018. [Google Scholar] [CrossRef]
- Mast, B.; Lemmer, A.; Oechsner, H.; Reinhardt-Hanisch, A.; Claupein, W.; Graeff-Hönninger, S. Methane yield potential of novel perennial biogas crops influenced by harvest date. Ind. Crop. Prod. 2014, 58, 194–203. [Google Scholar] [CrossRef]
- Gissén, C.; Prade, T.; Kreuger, E.; Nges, I.A.; Rosenqvist, H.; Svensson, S.-E.; Lantz, M.; Mattsson, J.E.; Börjesson, P.; Björnsson, L. Comparing energy crops for biogas production–Yields, energy input and costs in cultivation using digestate and mineral fertilisation. Biomass Bioenergy 2014, 64, 199–210. [Google Scholar] [CrossRef]
- Massé, D.; Gilbert, Y.; Savoie, P.; Bélanger, G.; Parent, G.; Babineau, D. Methane yield from switchgrass harvested at different stages of development in Eastern Canada. Bioresour. Technol. 2010, 101, 9536–9541. [Google Scholar] [CrossRef] [PubMed]
- Schumacher, B. Studies on the Processing and Conversion of Energy Crops into Biogas and Bioethanol (Untersuchungen zur Aufbereitung und Umwandlung von Energiepflanzen in Biogas und Bioethanol); University of Hohenheim: Stuttgart, Germany, 2008. [Google Scholar]
- Sawatdeenarunat, C.; Surendra, K.C.; Takara, D.; Oechsner, H.; Khanal, S.K. Anaerobic digestion of lignocellulosic biomass: Challenges and opportunities. Bioresour. Technol. 2015, 178, 178–186. [Google Scholar] [CrossRef] [PubMed]
- Korres, N. Bioenergy Production by Anaerobic Digestion; Routledge: Abingdon, UK, 2013; ISBN 9780203137697. [Google Scholar]
- Raposo, F.; De La Rubia, M.Á.; Fernández-Cegrí, V.; Borja, R. Anaerobic digestion of solid organic substrates in batch mode: An overview relating to methane yields and experimental procedures. Renew. Sust. Energy Rev. 2012, 16, 861–877. [Google Scholar] [CrossRef]
- El-Mashad, H.M. Biomethane and ethanol production potential of Spirulina platensis algae and enzymatically saccharified switchgrass. Biochem. Eng. J. 2015, 93, 119–127. [Google Scholar] [CrossRef]
- Agbor, V.B.; Cicek, N.; Sparling, R.; Berlin, A.; Levin, D.B. Biomass pretreatment: Fundamentals toward application. Biotechnol. Adv. 2011, 29, 675–685. [Google Scholar] [CrossRef]
- Behera, S.; Arora, R.; Nandhagopal, N.; Kumar, S. Importance of chemical pretreatment for bioconversion of lignocellulosic biomass. Renew. Sust. Energy Rev. 2014, 36, 91–106. [Google Scholar] [CrossRef]
- Galaev, O.V.; Shevchuk, G.Y.; Dudchenko, V.V.; Sivolap, Y.M. Molecular genetic analysis of the soriz genome (Sorghum oryzoidum). Cytol. Genet. 2011, 45, 208–213. [Google Scholar] [CrossRef]
- Ministry of Agrarian Policy and Food. State Register of Plant Varieties Suitable for Dissemination in Ukraine in 2019 (Реєстр Сoртів Рoслин, Придатних для Пoширення в Україні на 2019 рік); Ministry of Agrarian Policy and Food: Kyiv, Ukraine, 2019.
- Brown, R.C.; Brown, T.R. Biorenewable Resources. Engineering New Products from Agriculture, 2nd ed.; Wiley-Blackwell: Chichester, UK, 2014; ISBN 978-1-1185-2495-4. [Google Scholar]
- Hu, S.-Y. The Economic Botany of the Paulownias. Econ. Bot. 1961, 15, 11–27. [Google Scholar]
- Smart, A.J.; Moser, L.E. Morphological Development of Switchgrass as Affected by Planting Date. Agron. J. 1997, 89, 958–962. [Google Scholar] [CrossRef][Green Version]
- Icka, P.; Damo, R.; Icka, E. Paulownia Tomentosa, a Fast Growing Timber. Ann. Valahia Univ. Targoviste Agricult. 2016, 10, 14–19. [Google Scholar] [CrossRef]
- Tejera, M.D.; Heaton, E.A. Description and Codification of Miscanthus × giganteus Growth Stages for Phenological Assessment. Front. Plant Sci. 2017, 8, 1–12. [Google Scholar] [CrossRef] [PubMed]
- Meier, U. Development Stages of Mono- and Dicotyledonous Plants (Entwicklungsstadien mono- und dikotyler Pflanzen), 2nd ed.; BBCH Monografie: Berlin, Germany, 2001. [Google Scholar]
- American Public Health Association; American Water Works Association; Water Environment Federation. Standard Methods for the Examination of Water and Wastewater; American Public Health Association: Washington, DC, USA, 1998; ISBN 0-87553-235-7. [Google Scholar]
- Kalra, Y.P. Handbook of Reference Methods for Plant Analysis; CRC Press: Boca Raton, FL, USA, 1998; ISBN 978-1-57444-124-6. [Google Scholar]
- Mittweg, G.; Oechsner, H.; Hahn, V.; Lemmer, A.; Reinhardt-Hanisch, A. Repeatability of a laboratory batch method to determine the specific biogas and methane yields. Eng. Life Sci. 2012, 12, 270–278. [Google Scholar] [CrossRef]
- VDI 4630: VDI-Society Energy and Environment. VDI 4630 Fermentation of Organic Materials. Characterization of the Substrate, Sampling, Collection of Material Data, Fermentation Tests; VDI-Verlag: Düsseldorf, Germany, 2006. [Google Scholar]
- Hülsemann, B.; Zhou, L.; Merkle, W.; Hassa, J.; Müller, J.; Oechsner, H. Biomethane Potential Test: Influence of Inoculum and the Digestion System. Appl. Sci. 2020, 10, 2589. [Google Scholar] [CrossRef]
- Dandikas, V.; Heuwinkel, H.; Lichti, F.; Drewes, J.E.; Koch, K. Correlation between biogas yield and chemical composition of energy crops. Bioresour. Technol. 2014, 174, 316–320. [Google Scholar] [CrossRef] [PubMed]
- Herrmann, C.; Prochnow, A.; Heiermann, M.; Idler, C. Particle Size Reduction During Harvesting of Crop Feedstock for Biogas Production II: Effects on Energy Balance, Greenhouse Gas Emissions and Profitability. Bioenerg. Res. 2012, 5, 937–948. [Google Scholar] [CrossRef]
- Mayer, F.; Gerin, P.A.; Noo, A.; Foucart, G.; Flammang, J.; Lemaigre, S.; Sinnaeve, G.; Dardenne, P.; Delfosse, P. Assessment of factors influencing the biomethane yield of maize silages. Bioresour. Technol. 2014, 153, 260–268. [Google Scholar] [CrossRef]
- Battista; Frison; Bolzonella. Energy and Nutrients’ Recovery in Anaerobic Digestion of Agricultural Biomass: An Italian Perspective for Future Applications. Energies 2019, 12, 3287. [Google Scholar] [CrossRef]
- Caslin, B.; Finnan, J.; Easson, L. Miscanthus. Best Practice Guidelines; Johnston, C., Ed.; Ecclesville Printing Services Ltd.: Belfast, UK, 2015; ISBN 1-84170-611-5. [Google Scholar]
- Barbosa, B.; Boléo, S.; Sidella, S.; Costa, J.; Duarte, M.P.; Mendes, B.; Cosentino, S.L.; Fernando, A.L. Phytoremediation Potential of Heavy Metal Contaminated Soils by the Perennial Energy Crops Miscanthus SPP. and Arundo Donax L. under Low Irrigation; ETA-Florence Renewable Energies: Florence, Italy, 2018. [Google Scholar]
- Bennett, J.M.; Hicks, D.R.; Naeve, S.L.; Minnesota Soybean Growers Association. The Minnesota Soybean Field Book; University of Minnesota Extension Service: Minneapolis, MN, USA, 1999. [Google Scholar]
- Yadav, N.K.; Vaidya, B.N.; Henderson, K.; Lee, J.F.; Stewart, W.M.; Dhekney, S.A.; Joshee, N. A Review of Paulownia Biotechnology: A Short Rotation, Fast Growing Multipurpose Bioenergy Tree. AJPS 2013, 4, 2070–2082. [Google Scholar] [CrossRef]
- Chen, P.; Du, Q.; Liu, X.; Zhou, L.; Hussain, S.; Lei, L.; Song, C.; Wang, X.; Liu, W.; Yang, F.; et al. Effects of reduced nitrogen inputs on crop yield and nitrogen use efficiency in a long-term maize-soybean relay strip intercropping system. PLoS ONE 2017, 12, e0184503. [Google Scholar] [CrossRef]
- Lawlor, D. Carbon and nitrogen assimilation in relation to yield: Mechanisms are the key to understanding production systems. J. Exp. Bot. 2002, 53, 773–787. [Google Scholar] [CrossRef] [PubMed]


| Name of Plant | Climate Preference | Carbon Fixation | Annual/Perennial | Class | Reference |
|---|---|---|---|---|---|
| Soybean | Cool season | C3 | Annual | Legume | [11,16,31,32,33,34,35] |
| Maize | Warm season | C4 | Annual | Grass | |
| Sweet sorghum | Warm season | C4 | Annual | Thick-stemmed grass | |
| Sorghum oryzoidum or rice sorghum (soriz) | Warm season | C4 | Annual | Thick-stemmed grass | |
| Switchgrass | Warm season | C4 | Perennial | Thin-stemmed grass | |
| Miscanthus | Cool season | C4 | Perennial | Thick-stemmed grass | |
| Paulownia | Warm season | C3 | Perennial | Fast growth coppice |
| Name of Plant | Fertilizer | Dosage Applied | Application Time |
|---|---|---|---|
| Soybean | Ammonia nitrate (NH4NO3, consists 34.5% N) | 100 kg ha−1 | Application during presowing cultivation |
| Maize | Nitroammophos (NH4NO3 + NH4H2PO4, consists 21.0–25.0% N, 20.0–25.5% P2O5) | 150 kg ha−1 | Application in autumn before plowing |
| Ammonia nitrate (NH4NO3, consists 34.5% N) | 300 kg ha−1 | Post-emergence fertilizing | |
| Sweet sorghum, Sorghum oryzoidum or rice sorghum (soriz) | Superphosphate (consists 14.0–21.0% P2O5) | 200 kg ha−1 | Post-emergence fertilizing |
| Switchgrass | Superphosphate (consists 14.0–21.0% P2O5) | 200 kg ha−1 | Application during presowing cultivation |
| Miscanthus | Superphosphate (consists 14.0–21.0% P2O5) | 200 kg ha−1 | Application during cultivation, before planting the rhizomes |
| Paulownia | Ash (consists ~4.6% P2O5, ~3.2% K2O) | 16,000 kg ha−1 (1 kg of ash per plant) | Application during hole planting of seedlings |
| Cultivar | Harvesting Time | DMFM *, [%] | VSDM **, [%] | DMY ***, [tDM ha−1] | Crop N Uptake, [kgN ha−1] |
|---|---|---|---|---|---|
| Kardynal MV | H1 | 24.4 (1.10) | 93.9 (4.22) | 7.30 (0.33) | 55.45 (2.46) |
| Shedevr MV | H1 | 25.0 (1.13) | 93.2 (4.19) | 7.70 (0.35) | 87.8 (3.95) |
| Slobozhans’kyi MV | H1 | 27.7 (1.25) | 93.4 (4.20) | 10.1 (0.46) | 71.0 (3.19) |
| Svitanok MV | H1 | 24.3 (1.09) | 93.7 (4.22) | 9.75 (0.44) | 116.9 (5.26) |
| Varta MV | H1 | 26.9 (1.21) | 94.3 (4.25) | 8.91 (0.40) | 76.6 (3.49) |
| Kardinal MV | H2 | 25.8 (0.52) | 96.5 (1.93) | 7.71 (0.15) | 58.63 (1.17) |
| Shedevr MV | H2 | 27.4 (0.55) | 96.1 (1.92) | 8.44 (0.17) | 96.2 (1.92) |
| Slobozhans’kyi MV | H2 | 36.9 (0.74) | 96.1 (1.92) | 13.5 (0.27) | 94.6 (1.89) |
| Svitanok MV | H2 | 25.6 (0.51) | 81.3 (1.63) | 10.3 (0.21) | 123.24 (2.47) |
| Varta MV | H2 | 35.4 (0.71) | 96.9 (1.94) | 11.7 (0.23) | 100.8 (2.02) |
| Kardinal MV | H3 | 39.4 (1.10) | 95.4 (2.67) | 11.78 (0.33) | 89.5 (2.51) |
| Shedevr MV | H3 | 32.2 (0.90) | 95.7 (2.68) | 9.91 (0.28) | 113.0 (3.17) |
| Slobozhans’kyi MV | H3 | 45.6 (1.28) | 95.9 (2.69) | 16.7 (0.47) | 116.8 (3.27) |
| Svitanok MV | H3 | 44.0 (1.23) | 97.3 (2.72) | 17.7 (0.49) | 211.8 (5.93) |
| Varta MV | H3 | 52.2 (1.46) | 97.2 (2.72) | 17.3 (0.48) | 148.7 (4.16) |
| Cultivar | Harvesting Time | DMFM *, [%] | VSDM **, [%] | DMY ***, [tDM ha−1] | Crop N Uptake, [kgN ha−1] |
|---|---|---|---|---|---|
| Favoryt | H1 | 19.7 (0.89) | 92.6 (4.17) | 14.2 (0.64) | 136.8 (6.16) |
| Mamont | H1 | 24.0 (1.08) | 92.8 (4.17) | 17.8 (0.80) | 284.6 (12.8) |
| Sylosne 42 | H1 | 22.3 (1.00) | 94.1 (4.24) | 11.0 (0.49) | 76.8 (3.46) |
| Zubr | H1 | 23.8 (1.07) | 92.8 (4.18) | 12.7 (0.57) | 178.1 (8.01) |
| Favoryt | H2 | 20.9 (0.42) | 95.3 (1.91) | 15.1 (0.30) | 145.1 (2.90) |
| Mamont | H2 | 23.6 (0.47) | 94.5 (1.89) | 17.5 (0.35) | 279.8 (5.60) |
| Sylosne 42 | H2 | 22.6 (0.45) | 94.1 (1.88) | 11.1 (0.22) | 77.9 (1.56) |
| Zubr | H2 | 24.1 (0.48) | 92.3 (1.85) | 12.9 (0.26) | 180.3 (3.61) |
| Favoryt | H3 | 24.0 (0.67) | 95.9 (2.68) | 17.4 (0.49) | 166.7 (4.67) |
| Mamont | H3 | 23.4 (0.66) | 95.1 (2.66) | 17.3 (0.49) | 277.5 (7.77) |
| Sylosne 42 | H3 | 23.8 (0.67) | 94.9 (2.66) | 11.67 (0.33) | 81.8 (2.29) |
| Zubr | H3 | 24.8 (0.69) | 95.8 (2.68) | 13.3 (0.37) | 185.6 (5.20) |
| Cultivar, Vegetation Year | Harvesting Time | DMFM *, [%] | VSDM **, [%] | DMY ***, [tDM ha−1] | Crop N Uptake, [kgN ha−1] |
|---|---|---|---|---|---|
| Giganteus, 3rd year | H1 | 44.4 (2.00) | 93.8 (4.22) | 20.5 (0.92) | 115.0 (5.18) |
| Giganteus, 8th year | H1 | 45.6 (2.05) | 92.9 (4.18) | 27.5 (1.24) | 110.1 (4.96) |
| Sinensis, 3rd year | H1 | 36.6 (1.65) | 91.0 (4.10) | 11.0 (0.50) | 55.2 (2.48) |
| Giganteus, 3rd year | H2 | 45.6 (0.91) | 97.5 (1.95) | 21.1 (0.42) | 118.0 (2.36) |
| Giganteus, 8th year | H2 | 46.9 (0.94) | 96.8 (1.94) | 28.3 (0.57) | 113.3 (2.27) |
| Sinensis, 3rd year | H2 | 38.6 (0.77) | 94.4 (1.89) | 11.6 (0.23) | 58.2 (1.16) |
| Giganteus, 3rd year | H3 | 48.9 (1.37) | 95.5 (2.67) | 22.6 (0.63) | 126.7 (3.55) |
| Giganteus, 8th year | H3 | 50.4 (1.41) | 96.8 (2.71) | 30.4 (0.85) | 121.7 (3.41) |
| Sinensis, 3rd year | H3 | 44.1 (1.23) | 93.1 (2.61) | 13.3 (0.37) | 66.5 (1.86) |
| Crop | Analysed Cultivars | DMFM *, [%] | VSDM **, [%] | DMY ***, [tDM ha−1] | Crop N Uptake, [kgN ha−1] | SMY, [Nm3 ****kg−1VS] | AMY, [Nm3 ha−1] |
|---|---|---|---|---|---|---|---|
| Soybean | “Diona”, “Muza”, “Sharm”, “Sprytna” | 28.88 (4.74) | 90.17 (2.76) | 1.41 (0.71) | 20.47 (9.72) | 0.266 (0.025) | 341.77 (183.31) |
| Soriz | “Kvarts”, “Saliut”, “Titan” | 16.32 (3.07) | 92.16 (1.89) | 3.81 (1.21) | 0.06 (0.02) | 0.329 (0.006) | 1164.05 (407.62) |
| Switchgrass | “Morozko” from the 2nd and the 8th vegetation years | 38.21 (5.77) | 95.21 (0.82) | 2.99 (0.89) | 24.78 (4.24) | 0.258 (0.006) | 732.77 (210.23) |
| Paulownia | “Shantong” | 25.87 (0.01) | 83.47 (5.58) | 7.08 (0.36) | 56.66 (2.85) | 0.231 (0.055) | 1363.95 (329.73) |
© 2020 by the authors. Licensee MDPI, Basel, Switzerland. This article is an open access article distributed under the terms and conditions of the Creative Commons Attribution (CC BY) license (http://creativecommons.org/licenses/by/4.0/).
Share and Cite
Morozova, I.; Oechsner, H.; Roik, M.; Hülsemann, B.; Lemmer, A. Assessment of Areal Methane Yields from Energy Crops in Ukraine, Best Practices. Appl. Sci. 2020, 10, 4431. https://doi.org/10.3390/app10134431
Morozova I, Oechsner H, Roik M, Hülsemann B, Lemmer A. Assessment of Areal Methane Yields from Energy Crops in Ukraine, Best Practices. Applied Sciences. 2020; 10(13):4431. https://doi.org/10.3390/app10134431
Chicago/Turabian StyleMorozova, Ievgeniia, Hans Oechsner, Mykola Roik, Benedikt Hülsemann, and Andreas Lemmer. 2020. "Assessment of Areal Methane Yields from Energy Crops in Ukraine, Best Practices" Applied Sciences 10, no. 13: 4431. https://doi.org/10.3390/app10134431
APA StyleMorozova, I., Oechsner, H., Roik, M., Hülsemann, B., & Lemmer, A. (2020). Assessment of Areal Methane Yields from Energy Crops in Ukraine, Best Practices. Applied Sciences, 10(13), 4431. https://doi.org/10.3390/app10134431