Abstract
This paper analyzes the pore morphology of two different concrete mixtures (plain and fiber-reinforced) under two different curing conditions, through the use of a CT scanner and post-processing software. Twelve cylinders of 45.2 mm in diameter and 50 mm in height were cast. Half of the specimens were kept in a humidity-controlled room, at 20 °C and 60% humidity, and the rest in a curing room, at 20 °C and 100% humidity. All the specimens were scanned at the age of 28 days, using a micro CT scanner. The results reveal that the presence of fibers substantially modifies the pore morphology in the way of increasing the volume of voids and the pore-size, reducing the shape factor of the voids and reorienting the voids toward a direction more aligned to the one showed by the fibers. In general, the curing conditions do no exhibit a great impact on the results.
1. Introduction
Fiber-reinforced concrete is a structural solution of growing use. In most current uses, fibers are used to improve the mechanical and/or structural behavior of hardened concrete. The most common use of fibers is to reduce the cracking in concrete, thus directly improving the durability of concrete [1,2,3], although it cannot be strictly considered as a structural use of fibers.
From a structural point of view, fibers are currently being used to improve the tensile strength of concrete, replacing totally or partially the conventional rebars. The research reveals that fibers have a positive impact on the post-peak behavior of concrete, although it strongly depends on fiber amount and orientation [4,5,6,7,8,9,10,11]. Other current uses are to improve the fatigue behavior of concrete [11,12,13,14,15,16,17], the behavior under impact loads [18] or freeze–thaw cycles [19,20,21], among others. Moreover, during the past few years, a lot of research has been conducted regarding new types of fibers, beyond the most conventional ones (i.e., steel, polypropylene, carbon, glass, etc.) [22,23,24,25].
It has been commonly assumed that, in general, the fibers do not modify the concrete matrix, except for the interface between concrete matrix and fiber, which tends to be more porous. However, some research has been conducted in the last years showing that fibers modify the concrete matrix [26,27,28].
This work aims to demonstrate that steel fibers modify the concrete matrix because they significantly alter the main geometrical parameters of the internal voids. This fact could have an impact on certain mechanical behaviors directly related to porosity, e.g., freeze–thaw cycles or fatigue.
Computer tomography (CT) scan technology was used to observe the different geometrical patterns of internal voids due to presence of fibers inside the concrete specimens. This is a relatively new technology for concrete, although in some other fields, like medicine, it has been used since more than 40 years ago. Most of the previous research mainly focused on the fiber orientation inside the concrete [29,30,31,32,33,34,35]. However, in recent years, there is an increasing interest on the study of concrete porosity and several interesting works have been published in this field. Most of them are focused on plain concrete and, more particularly, on pervious concrete [36,37,38,39,40,41,42,43,44,45]. Most of this research analyzes the correlation between porosity and macroscopic behavior, like fatigue or freeze–thaw cycles, among others.
Hardened concrete always includes voids which play a vital role for concrete property. Some of the voids are unavoidable, as they are filled by air due to the loss of water during the curing process. In other cases, concrete is designed with a preset amount of internal voids, depending on functional needs [35,46,47,48,49,50]. In these cases, the shape of the voids, their size distribution, etc., influence the macroscopic behavior of hardened concrete.
According to the International Union of Pure and Applied Chemistry (IUPAC), pores can be classified according to their size into micropores (smaller than 2 nm), mesopores (from 2 to 50 nm) and macropores (larger than 50 nm) [51,52,53]. Several methods to analyze the voids can be found in the literature. The most traditional ones are mercury-intrusion porosimetry (MIP) and nitrogen absorption. These methods have two main limitations. First, they can only provide the pore-size distribution but not the pore distribution, shape, etc. Second, these techniques can only provide information about the open porosity and not about the closed porosity. In this situation, CT-Scan technology can overcome the limitations of the traditional methods and is able to provide information about the shape of all the voids inside the concrete specimen.
In this study, two different concrete mixtures were studied: plain concrete (PC) and steel-fiber-reinforced concrete (SFRC). In both cases the concrete mixture is identical. The only difference is that SFRC includes steel fibers. In order to study how humidity affects pore morphology, half of the specimens were hardened in a curing room, with 20 °C and 100% humidity, and the rest of them were cured in a humidity-controlled room, with 20 °C and 60% humidity. All the specimens were scanned, using a CT scanner to detect the voids and the fibers (these last ones in the case of steel-fiber-reinforced concrete specimens). Using post-processing routines, especially developed by the authors, we observed and compared the main parameters regarding the pore morphology in both mixtures: porosity, pore-size distribution, pore shape, void’s orientation, fibers’ orientation, etc.
In this case, all the specimens were scanned at the age of 28 days, i.e., when the hardening process of concrete was almost finished and no relevant variations of the pore morphology were expected. The analysis of the evolution of the pore morphology during the hardening process has been previously studied [54,55].
This paper is structured as follows: The experimental procedure is presented in Section 2, the results of the tests are described and discussed in Section 3; and, finally, the conclusions are found in Section 4. Next, the materials used in this research, the manufacturing procedure and the scanning process are described.
2. Experimental Program
In this section, the materials used in the research, the specimen manufacturing process and the scanning process are described in detail.
2.1. Materials
This study was conducted with the use of 12 concrete cylinders of 45.2 mm diameter and 50 mm height. Six of them were cast with plain concrete (PC), and the rest were cast with steel-fiber-reinforced concrete (SFRC). Table 1 shows the mixture proportions of two mixtures.

Table 1.
Mixture proportions.
The steel fibers used were Dramix OL 8/16 (provided by BEKAERT, Zwevegem, Belgium), 8 mm in length and 0.16 mm in thickness. The volume of the fiber fraction was 0.1%. The superplasticizer used was Glenium 52 (provided by BASF, Ludwigshafen am Rhein, Germany). The nano-silica used was MasterRoc MS 685 (provided by BASF). The Portland cement used was CEM I 52.5 R [56]. The fine aggregate (4 mm nominal size) was siliceous.
Compressive strength for each mixture was tested, using 40 mm side cubes, which were cut from 40 × 40 × 160 mm prisms, according to EN 196-1:2016 [57]. The average concrete compressive strength was 71.2 MPa, with an average standard deviation of 1.8 MPa, and no relevant differences between both mixtures were observed.
2.2. Specimens Manufacturing Process
Similar to the research conducted by Mínguez, Vicente and co-workers [53,54], the molds for the concrete specimens were made by using PVC cylinders of 45.2 mm inner diameter, 50 mm outer diameter and 50 mm height. A PVC disc of 60 mm diameter and 3 mm thickness was welded at the bottom of each pipe, in order to guarantee a tight connection (Figure 1).
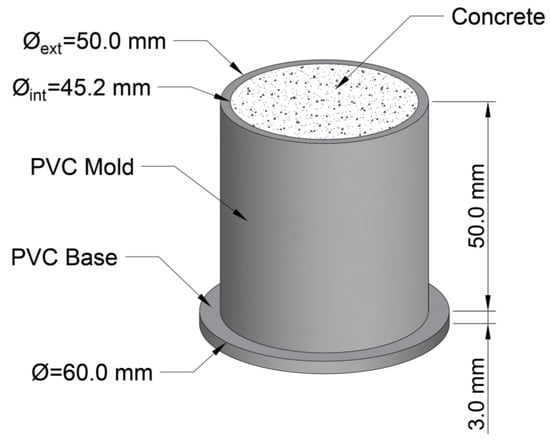
Figure 1.
Mold and specimen [54,55].
A cement mortar mixer was used to mix all the components of the cement paste, following the EN 196-1:2016 [57] standard. A small scoop was used to pour concrete inside the molds, and they were filled in two approximately equal layers. No vibration was applied, but some small punches were applied on the sides of the molds, once they were filled with mortar, to help the mortar expel the entrapped air. Finally, the upper surface of each mold was smoothed with a trowel.
Once the specimens were cast, three of them belonging to each series were cured in a curing room, with 20 °C and 100% humidity. The rest of the specimens were kept in a temperature and humidity-controlled room, where they remain at 20 °C and 60% humidity. The first ones are herein referred to as “moist-cured” specimens, and the last ones are “air-cured”. All the specimens were cured for 28 days. During the curing period, only the upper face of the cylinders was exposed to air, since the molds were kept during all the time.
The air-cured series simulates the behavior of a small piece of a greater concrete element (i.e., a concrete slab), where only one face is in contact with the air, and water can only escape from the concrete matrix through this face. On the contrary, the moist-cured series simulate the behavior of the inner regions of a volumetric concrete element (i.e., a concrete dam), far from the free surface and with no possibility of losing water.
After the curing process, the specimens were scanned, using a CT scanner, to investigate the concrete properties.
2.3. Scanning Process
In this study, concrete specimens were scanned by a GE Phoenix v|tome|x device equipped with a tube of 300 kV/500 W. Using the post-processing software VGSTUDIO MAX (Volume Graphics, Heidelberg, Germany), 2000 2D slices of 2048 × 2048 pixels (Figure 2) were obtained throughout the height of the specimen from the CT scanner machine. In this case, for a section of 45.2 mm diameter, the horizontal resolution is 25 × 25 μm2, and the vertical distance between the slices was 25 μm. After that, a 3D image of the whole specimens was generated, using all the 2D images mentioned above.

Figure 2.
Slices belonging to different mixtures and curing conditions.
The post-processing software provides a gray value to each voxel (volumetric pixel), which is an integer number between 0 and 255, where 0 means pure black and 255 means pure white. A value of 255 is assigned to the densest voxel, and a value of 0 is assigned to the less dense voxel. For the rest of the voxels, a linear relation is considered. The conclusion of the scanning process is a file including X, Y and Z Cartesian coordinates of the voxel center of gravity and an integer number, from 0 to 255, regarding the density. The total amount of voxels in a specimen is around 4.3 × 10⁹. A detailed explanation of the scanning process was previously described by Vicente et al. [34,42,58].
The next step in this process was to identify and isolate each individual void inside the specimen, with image analysis software. To do this, the digital image processing (DIP) software AVIZO (FEI Visualization Sciences Group, Hillsboro, OR, USA) was used. First, the software identified the voxels belonging to voids, which are the ones showing a gray value inside a range. In the case of steel-fiber-reinforced concrete, the voxels belonging to fibers were also identified and isolated. In this case, once the histogram of gray scale was studied, the considered range for voids was between 0 and 65, and for fibers between 200 and 255 (Figure 3). The voxels between 65 and 200 belong to the concrete matrix.
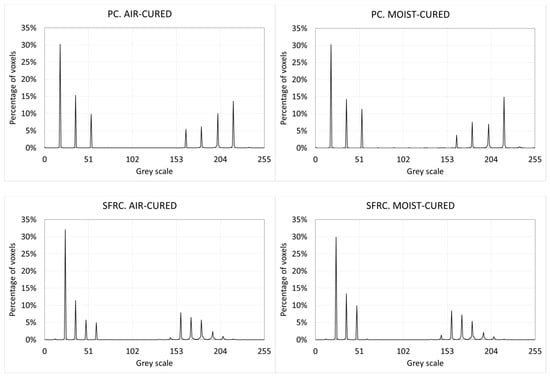
Figure 3.
Histograms of gray scale.
It can be observed that a great number of the dark voxels belong to the ones placed outside the mold. In consequence, the diagrams in Figure 3 are not valid to obtain the percentage of voids in the specimen.
Next, all the voxels placed outside the inner face of the mold were deleted, because they did not belong to the concrete specimen. Then, all the voxels in contact were merged, since they come from the same void. The software identifies and isolates the different voids. The final result of this image analysis is a dot matrix containing the Cartesian coordinates X, Y and Z of the center of gravity of each void, as well as some other geometrical parameters of the voids (length and volume among others). Figure 4 shows an isometric view of one specimen of each mixture and each mixture condition.
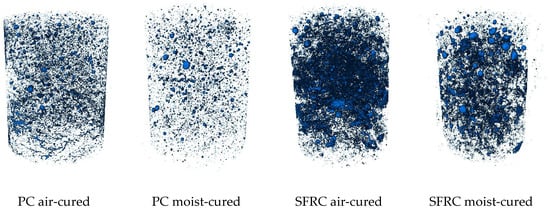
Figure 4.
Three-dimensional views of the pores belonging to different mixtures and curing conditions.
Analogously, in the case of the SFRC specimens, the voxels belonging to the fibers were identified and isolated. A new dot matrix was performed to each specimen, including the X, Y and Z Cartesian coordinates to the center of gravity of each fiber, as well as many other geometrical parameters of the fibers (Figure 5).
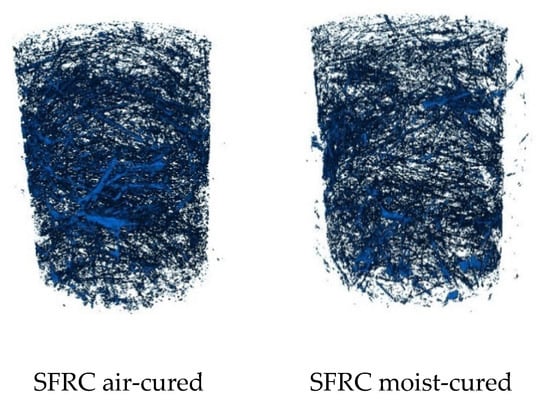
Figure 5.
Three-dimensional views of the fibers belonging to different curing conditions.
It can be observed in Figure 2 that some of the largest voids are in contact to the inner face of the mold. In order to avoid these facts on the analysis, the whole specimen was not studied, but an inner cylinder of the specimen with a diameter 90% of the nominal diameter of the concrete specimen, i.e., 40.7 mm. This fact can be explained by the wall-effect of concrete and also by the shrinkage.
In this work, only voids with less than three voxels in the largest direction (i.e., 75 µm length, approximately) were discarded, because they are too small, and the CT scan does not provide enough sharpness to clearly identify them. Additionally, voids larger than 10 mm in the largest direction were discarded, since they are non-representative voids. The results shown in this paper are the average values of the three specimens.
3. Experimental Results and Discussion
The direct observation of the 3D image is not enough to detect differences between the specimens and, even less, to be able to quantify them. Therefore, it is necessary to perform a numerical post-process in order to extract the huge amount of useful information provided by the CT scanner. The data presented in the different tables and figures are the average values of the three specimens belonging to the same mixture and the same curing conditions.
3.1. Total Volume of Voids and Porosity
The first parameter to be studied in all the specimens is the total volume of voids and the porosity. This last parameter is defined as the quotient between the total volume of voids and the volume of the specimen. Table 2 shows the average values of the total volume of voids and the porosity for the different mixtures and curing conditions. The values in brackets are the standard deviation.

Table 2.
Total volume of voids and porosity.
The values of porosity shown in Table 2 are, in general, low, since not all the porosity was measured; as explained before, only voids with a length between 75 µm and 10 mm were considered.
Table 2 shows that fiber-reinforced concrete specimens have significantly higher total volume of voids and porosity compared to plain concrete specimens, of around two or three times higher. This happens in both moist-cured and air-cured concrete. It is concluded that, in this case, steel fibers help to increase the internal porosity.
Beyond the porosity that is trapped during the concreting process, most of the air voids in hardened concrete are because of the loss of water during the curing process. Water consumption during the hydration process and evaporation of water are the two main causes of air voids inside concrete.
In the case of plain concrete, simultaneously with the water consumption and the appearance of voids, they tend to collapse (at least partially) because of the hydrostatic pressure of fresh concrete, as well as its low stiffness. This space is filled by the fresh concrete paste. This process leads to a reduction of the porosity, and the macroscopic effects are the well-known phenomena of plastic settlement of concrete and initial plastic shrinkage.
In the case of steel-fiber-reinforced concrete, fibers provide higher viscosity to fresh concrete paste and also greater stiffness, which implies a less tendency to the voids’ collapse.
Additionally, plain concrete specimens subjected to air curing show a slight greater volume of voids and porosity. This is directly related to the moisture of the room where the specimens were cured. In the case of air-cured specimens, more evaporation occurs compared to moist-cured specimens. The lower loss of water in this last case implies a lower porosity. This phenomenon is less clear in the case of fiber-reinforced concrete.
The difference between air-cured concretes and moist-cured concrete is small, since the concrete-exposed surface is small. In addition, in the case of steel-fiber-reinforced concrete, fibers help to mitigate the voids’ collapse, even close to the exposed surface.
3.2. Variation of the Total Porosity along the Depth
The porosity is not equally distributed throughout the depth of the specimens. Figure 6 shows this variation, in both mixtures, as well as in both curing conditions. In all cases, relative depth is shown, i.e., varying from 0 to 1, where 0 belongs to the exposed surface of the specimens.
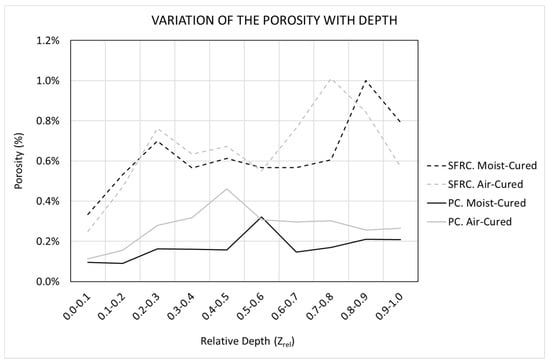
Figure 6.
Variation of the porosity along the depth.
The results shown in Figure 6 agree with the ones shown in Table 2. First, it is observed that plain concretes show a porosity clearly smaller than fiber-reinforced concretes. This happens in both air-cured and moist-cured concretes. As explained before, this is due to the lower capacity of plain concrete to retain the largest voids, which directly implies a reduction of the porosity.
In the case of fiber-reinforced concrete, it is observed that porosity shows the minimum value in the exposed surface (depth range 0.0–0.1), and it tends to increase with the depth. In this region, smaller components show a higher percentage. In addition, the capacity to retain voids in fresh concrete is small, as fresh concrete is less viscous, as well as less stiff.
In the case of plain concrete, this phenomenon can be also observed, although it is less relevant, since low porosity values are observed in all the depth.
3.3. Porosity and Porosimetric Curves
Post-processing the data provided by the CT scanner allows the ability to obtain the shape of each individual void and all of their related parameters. Particularly, the length and the volume of each void is of interest. The pore length is defined as the maximum distance between two voxels of the same void.
Using these data from all the voids, we can plot the pore volume curves and the porosimetric curves. A pore volume curve is defined as the graph correlating the void’s length and the sum of the volumes of the voids with a length equal or lower than that one. On the other hand, the porosimetric curve is defined as the graph correlating the void’s length and the sum of the volumes of the voids with a length equal or lower than that one divided by the total volume of pores. In both cases, these graphs represent the pore size distribution.
Figure 7 shows the pore volume curves and the porosimetric curves belonging to the different mixtures and curing conditions. The horizontal axis is limited to 10 mm pore length, since greater pores are residual and not of interest.
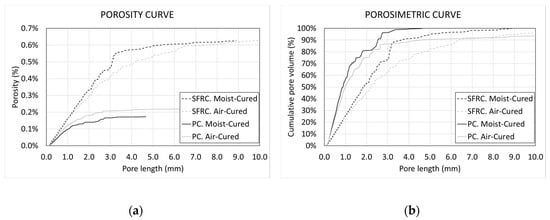
Figure 7.
(a) Pore volume curves and (b) porosimetric curves.
Figure 7a shows that the fiber-reinforced concrete specimens show a porosity greater than that of the plain concrete. Moreover, the curves belonging to fiber-reinforced concrete are over the ones belonging to plain concrete, which means that those ones show more voids in all the lengths.
The differences between air-cured and moist-cured concretes are very small. In the case of fiber-reinforced concrete, it seems that the larger voids are more dominant than the smaller voids. On the contrary, in the case of plain concrete, it seems that smaller voids are more dominant than the larger ones.
Figure 7b provides information complementary to the curve shown in Figure 7a. It highlights that fiber-reinforced concrete curves are to the right of the plain concrete curves, which means that fiber-reinforced concretes are able to retain a greater percentage of large-size voids.
This can be explained by the mechanisms that occur while concrete paste remains fresh. Because of the hydrostatic pressure that fresh concrete paste exerts on the pore walls, it tends to collapse. The void’s stability depends on the viscosity of fresh concrete, as well as its stiffness and the void’s diameter. The larger the diameter, the less stable the void is. In addition, the greater the fluidity of the fresh concrete paste and the smaller the stiffness, the less stable the void is.
While concrete remains fresh, the fiber-reinforced concrete matrix is less fluid and stiffer. In consequence, it is able to retain larger voids. On the contrary, the plain concrete matrix is more fluid and less stiff. In consequence, it is not able to retain larger voids, and the voids tend to collapse, becoming smaller voids. Additionally, a part of the air of the collapsed pore gets off, and the global porosity reduces.
In all cases, the porosimetric curves show two parts clearly different. In the first part, the curves are approximately straight. It goes from 0 to approximately 1.5 mm in the case of plain concrete, and to around 3.0 mm in the case of fiber-reinforced concrete. This pore length can be named as a “critical pore length”, and it seems to be related to the stability of the voids. Beyond the critical pore length, the slopes of the curves are progressively reduced.
During the first part, the pore volume shows a uniform distribution, i.e., the percentage of pore volume belonging to, for example, the pore length range 0.0–0.5 mm is the same that the one belonging to, for example, the pore length range 1.0–1.5 mm.
On the contrary, during the second part of the curve, the participation of the different pore length ranges decreases, while the pore length increases. This means, for example, that the pore length range 3.0–3.5 mm retains more pore volume than the pore length range 4.0–4.5 mm.
In addition, Figure 8 shows that, in general, moist-cured concretes are to the left of the air-cured concretes. This means that the ambient moisture influences the morphology of the voids, in such a way that the higher the moisture, the smaller the voids are.
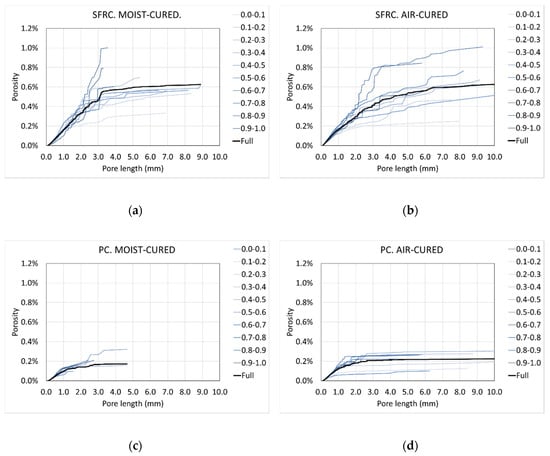
Figure 8.
Porosity curves along the depth: (a) SFRC moist-cured, (b) SFRC air-cured, (c) PC moist-cured and (d) PC air-cured.
An interesting parameter related to the pore size distribution is the nominal maximum pore size (NMPS), defined as the pore length corresponding to a cumulative pore volume of 90%. This parameter is analogous to the “nominal maximum aggregate size” or NMAS, commonly used in coarse aggregates. Table 3 shows the values of NMPS for all the series.

Table 3.
Nominal maximum pore size (NMPS).
It can be observed in Table 3 that, under the same curing conditions, the NMPS of fiber-reinforced concrete is greater than the one of plain concrete. In consequence, fiber-reinforced concrete retains more pore volume and also larger voids. In addition, moist-cured concretes show smaller values of NMPS than air-cured, meaning that a higher environmental moisture helps to obtain smaller voids. These results agree with the ones previously shown.
3.4. Variation of Porosity and Porosimetric Curves along the Depth
Voids are not equally distributed along the depth. The distance to the exposed surface, where evaporation and water interchange occurs, is relevant to understand how the porosity is distributed along the depth. Next, the porosity curves of the different mixtures and curing conditions are shown for the different depth ranges (Figure 8).
It is highlighted that the thickest graphs represent the complete porosity curves (the ones shown in Figure 7a) which are, in fact, the average of the rest of the curves.
Figure 8 shows some interesting data. First, it is observed that, in general, curves belonging to the lower half of the specimens are placed over the full curve, while the curves belonging to the upper half are placed below the full curve. This phenomenon is observed in all cases, both in fiber-reinforced concrete and plain concrete, as well as in moist-cured concrete and air-cured concrete. This means that, mainly the porosity is concentrated in the lower half of the specimens. This is because they are far from the free surface and, in consequence, it is more difficult for the trapped air to get off while the concrete paste remains fresh.
In the case of plain concrete, curves belonging to the depth ranges 0.4–0.5 and/or 0.5–0.6 show an abnormal behavior, different from their neighbors. This is because the cylinders were cast in two times and a small horizontal construction joints appeared. This phenomenon is less clear in fiber-reinforced concrete because fibers act as stitches between the two faces of the joint.
Additionally, the curves belonging to the depth range 0.0–0.1 show a behavior different from the rest of curves. In this range, the porosity is small and also shows lower porosity in all the pore sizes.
Next, the porosity curves of the different mixtures and curing conditions are shown for the different depth ranges (Figure 9).
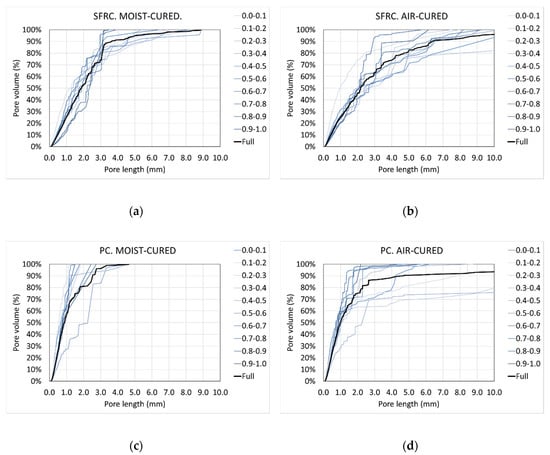
Figure 9.
Porosimetric curves along the depth: (a) SFRC moist-cured, (b) SFRC air-cured, (c) PC moist-cured and (d) PC air-cured.
Analogously, in this case, the thickest graphs represent the complete porosimetric curves (the ones shown in Figure 7b), which are, in fact, the average of the rest of the curves.
Figure 9 shows some interesting data. Firstly, it is observed that there are not relevant differences between the curves belonging to the upper half of the specimens and the ones belonging to the lower part: All of them are close to each other, and they are also close to the full curve. This means that the percentages of pore volume are similarly distributed along the depth. Pore size distribution is strongly related to the spaces that remain in the concrete matrix that are also related to the composition of the concrete matrix. As this composition is uniformly distributed along the depth, the spaces available for voids are uniformly distributed and, in consequence, the porosimetric curves are similar.
In the case of plain concrete, it is observed that the porosimetric curve belonging to the depth 0.4–0.5 in one case and the one belonging the depth 0.5–0.6 in the other case are significantly displaced to the right. These curves show the effect of the horizontal construction joint. In this zone, a higher pore volume is observed (Figure 8c,d) and greater pores, too (Figure 9c,d).
In general, porosimetric curves belonging to the range 0.0–0.1 (exposed surface) are slightly displaced to the left. This means that, in this region, the smaller voids are more dominant, since they are easier to retain.
3.5. Shape Factor of the Voids
Using the pore length and the volume of each individual void, it is possible to obtain its shape factor, defined as the ratio between the volume of the void and the volume of the sphere circumscribed to it (Equation (1)).
where is the volume of the void, and is the pore length. Figure 10 shows the histograms of the shape factor of the different mixtures and the different curing conditions.
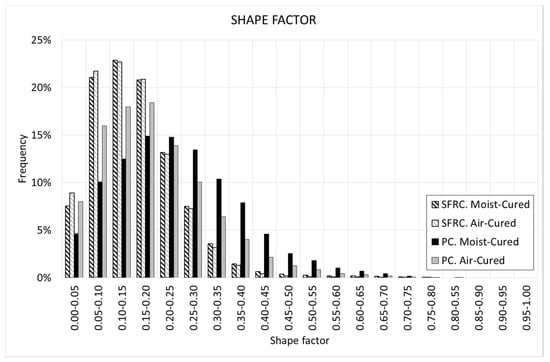
Figure 10.
Histogram of the shape factor.
Figure 10 show some interesting results. Firstly, it can be observed that, in all cases, pores are far from a perfect sphere, since, in all cases, the shape factors are far from 1.0.
Fiber-reinforced concretes show smaller shape factors, showing a mode between 0.10 and 0.15 and with more than 90% of the voids with a shape factor below 0.3. On the contrary, plain concretes show a slightly larger shape factor, showing a mode between 0.10 and 0.25, and with more than 90% of the voids with a shape factor below 0.4.
Voids, which are the less-dense and the less-stiff component of the concrete matrix, tend to occupy the space that the rest of the components are not able to occupy. These spaces are not rounded, but elongated. In the case of fiber-reinforced concretes, spaces become more elongated because of the presence of the fibers, and, in consequence, the voids are more elongated too.
In the case of fiber-reinforced concretes, there is almost no difference in the histograms of shape factor for air-cured and moist-cured concretes. On the contrary, in the case of plain concretes, there is a significant difference in the histograms. Moist-cured concrete shows a histogram of shape factor moved to the right, with means that voids tend to be a bit more rounded. This means that curing conditions affect the pore morphology.
Pore morphology shows relevant variations along the depth. Figure 11 shows the histograms of shape factor along the depth for the different mixtures and curing conditions.
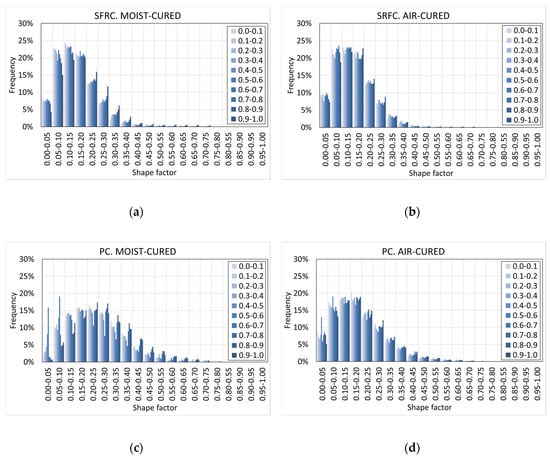
Figure 11.
Histograms of shape factor along the depth: (a) SFRC moist-cured, (b) SFRC air-cured, (c) PC moist-cured and (d) PC air-cured.
Figure 11 shows that, in general, the histograms of shape factor vary with the depth, in such a way that, when the depth increases, the histogram moves to the right.
This means that the voids tend to be more rounded. This phenomenon is observed in all concretes, although it is clearer in moist-cured concretes, both in plain and fiber-reinforced concretes. This is because of the increase of the hydrostatic pressure with the depth when concrete paste is fresh, which favors the creation of voids with a more efficient geometry, i.e., closer to the sphere.
In the case of plain concrete, the influence of the horizontal construction joint is shown as a greater percentage of stretched voids.
3.6. Correlation between the Pore and the Fiber Orientation
Since voids are not rounded, but elongated, it is possible to obtain their orientation. Additionally, in the case of steel-fiber-reinforced concrete, it is possible to obtain the fiber orientation. By correlating the orientation of both voids and fibers, it is possible to check if the fibers influence in any way the orientation of the voids. Again, this information is obtained from the CT scanner and the post-processing and the image analysis software.
In order to analyze the voids’ and fibers’ orientation, the following angles are used: θ (theta) and φ (phi) (Figure 12). Theta is a polar angle, i.e., the angle between the main axis of the void or fiber (the one containing its length) and the Z axis. Phi is the azimuthal angle, i.e., the angle between the projection of the main axis on the XY plane and the X axis. Theta varies from 0° to 90°, while phi varies from −180° to 180°.
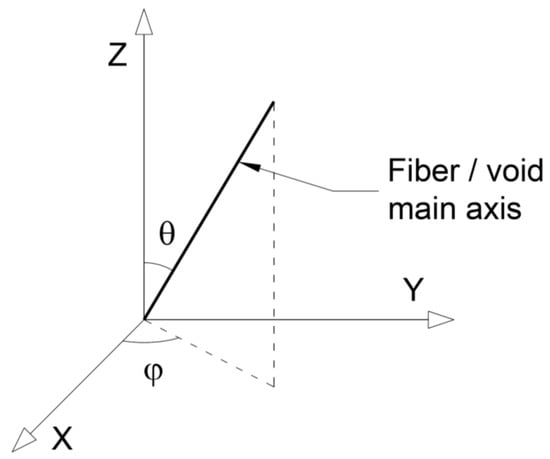
Figure 12.
Identification of θ (theta) and φ (phi) angles.
Next, the histograms of voids’ and fibers’ orientation are shown for the different mixtures and the different curing conditions (Figure 13 and Figure 14).
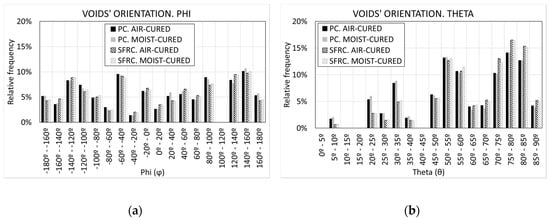
Figure 13.
Voids’ orientation: (a) phi and (b) theta.
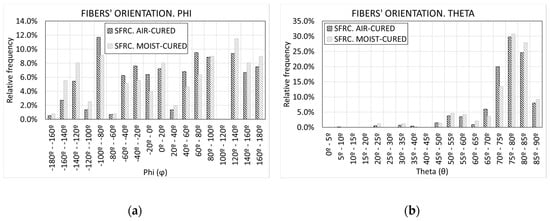
Figure 14.
Fibers’ orientation: (a) phi and (b) theta.
Figure 13 reveals that, in all cases, voids are mainly oriented in the XY plane, i.e., the horizontal plane, since Figure 13 reveals that the greater percentage of the pores shows a theta angle close to 90°. Additionally, inside the XY plane, there is not a dominant direction, since Figure 13a reveals that, approximately, the phi angle is uniformly distributed.
These tendencies can be observed in both plain concrete and steel-fiber-reinforced concrete mixtures and also in both air-cured and moist-cured concretes. In the case of the phi angle, it can be highlighted that, in all cases, there is a uniform distribution of the voids inside the XY plane. No relevant differences can be observed between plain concrete and steel-fiber-reinforced concrete mixtures, and there are also no relevant differences between air-cured and moist-cured concretes. In the case of the theta angle, it can be highlighted that pores belonging to steel-fiber-reinforced concrete mixtures tend to be more horizontal, since they show higher relative frequency in the range of 70°–90° than plain concrete mixtures.
Figure 14 reveals that fibers also show an orientation similar to the voids’ one. Again, fibers are mainly oriented in the XY plane, since Figure 14b reveals that the greater percentage of the fibers shows a theta angle close to 90°. Additionally, inside the XY plane, there is no dominant direction, since Figure 14a reveals that, approximately, the phi angle is uniformly distributed.
In order to define numerically the orientation along Z axis (theta angle), the efficiency index () is used (Vicente et al. 2014) according to the following equation (Equation (2)):
where is the relative frequency of each bar of the histogram, and is the average value of the theta angle of each bar of the histogram. The efficiency index can show values from 0 to 1, where 0 means that all the elements (voids or fibers in this case) are oriented perpendicularly to the Z axis, and 1 means that all the elements (voids or fibers in this case) are oriented parallel to the Z axis.
Table 4 shows the values of the efficiency index of both voids and fibers for all the mixtures and all the curing conditions.

Table 4.
Efficiency index.
Table 4 reveals some significant results. First, it can be noticed that, in the case of the voids, the plain concrete mixtures show a greater value of efficiency index than the steel-fiber-reinforced concrete mixtures. Again, it is demonstrated that the presence of fibers modifies the pore morphology of the cement paste. The difference between the air-cured mixtures and the moist-cured mixtures is almost null, which means that the curing conditions has no influence on the voids’ orientation.
Fibers show a value of efficiency index smaller than voids, and, again, there is no significant difference between air-cured mixture and moist-cured mixture.
It can be concluded that fibers tend to align the voids to their own orientations. The efficiency indexes to the voids belonging to the steel-fiber-reinforced concrete mixtures show an intermediate value between the ones of the voids belonging to the plain concrete mixtures and the ones of the fibers belonging to the steel-fiber-reinforced concrete mixtures. This means that the orientation of the voids belonging to the steel-fiber-reinforced concrete mixtures is partially conditioned by the cement-paste matrix and partially conditioned by the fibers.
4. Conclusions
This paper analyzes the variation of the internal pore morphology of two different mixtures cured under two different curing conditions, through the use of a CT scanner and a DIP software.
Some findings were obtained. First, it can be noticed that the steel-fiber-reinforced concrete specimens show a greater amount of pore volume than the plain concrete ones. This happens in both moist-cured and air-cured concrete. Two phenomena can explain this, both of them related to fresh concrete. First, fibers may trap and retain more pores during the concreting process. Second, the voids created due to the internal water-consumption process can be easily retained in the case of steel-fiber-reinforced concrete.
In the case of steel-fiber-reinforced concrete, a higher porosity is observed in the interior of the specimen, i.e., far from the exposed surface, where the porosity is smaller. This phenomenon can be observed in both air-cured and moist-cured specimens. In the case of plain concrete, this phenomenon can also be observed, although it is less intense. In this case, no relevant differences between air-cured and moist-cured concretes have been detected.
When both the pore volume curves and the porosimetric curves are studied, it can be observed that steel-fiber-reinforced concrete specimens are capable of retaining greater voids. This fact can be explained in terms of fresh concrete. Fibers provide additional stiffness to the fresh cement paste, allowing SFRC specimens to retain a greater number of large-size voids. Again, no relevant differences between air-cured and moist-cured concretes were detected.
When the nominal maximum pore size (NMPS) was studied, it was revealed that steel-fiber-reinforced concrete specimens are able to have a higher value of NMPS than the one of plain concrete and, additionally, air-cured mixtures show a higher value of NMPS than the one of moist-cured mixtures. This means that curing conditions modify the pore-size distribution.
When we studied how the pore volume curves and the porosimetric curves evolve along the depth, some interesting results were observed. First, the percentage of small pores increases with the depth. This happens in both mixtures and in both curing conditions. This variation is less intense in the case of steel-fiber-reinforced concrete than in plain concrete. Again, the rheology of fresh concrete seems to be behind these observations.
The study of the shape factor reveals that voids are far away from a sphere; in fact, they are very flaky or elongated. This phenomenon can be observed in both mixtures and in both curing conditions. However, voids belonging to the steel-fiber-reinforced concrete specimens show a smaller shape factor.
It can also be observed that there is a small variation of the shape factor with the depth, but in all the cases, a progressive increase of it can be observed.
In terms of voids’ orientation, it can be observed that, in all cases, the voids tend to be oriented horizontally, i.e., perpendicular to the vertical direction (which coincides with the concreting direction). In the horizontal plane, no dominant direction can be observed.
In the case of steel-fiber-reinforced concrete specimens, the fibers’ orientation is also obtained, and the results are similar to the ones observed with the voids: Fibers tend to be oriented perpendicularly to the vertical axis, and, in the horizontal plane, they are randomly oriented.
The efficiency index is obtained for all the mixtures and all the curing conditions, for both the voids and the fibers (when it is possible, i.e., in the case of steel-fiber-reinforced concrete). The results demonstrate that fibers influence the voids’ orientation. In this case, the curing conditions are less relevant, but not negligible.
Finally, it can be concluded that the presence of fibers significantly modifies the pore morphology, in several aspects: Fibers increase the porosity of concrete, modify the pore-size distribution, increasing the percentage of small voids, modify the orientation toward an orientation more aligned to the fibers, and modify the shape of the voids, causing them to become more elongated.
The differences observed in pore morphology and distribution between plain and fiber-reinforced-concrete and between moist- and air-cured conditions could have an impact on certain mechanical behaviors directly related to porosity, e.g., freeze–thaw cycles or fatigue.
Author Contributions
Design of the experiment, D.C.G., M.A.V. and R.H.; analysis of the results of the scanner, J.M. and M.R.; data interpretation, D.C.G., J.M., M.A.V. and R.H.; funding acquisition and project administration, D.C.G. and M.A.V.; writing, reviewing and editing the paper, D.C.G., M.A.V and R.H. All authors have read and agreed to the published version of the manuscript.
Funding
This study was funded by the Ministerio de Economía y Competitividad, Gobierno de España (Spain) (grant number BIA2015-68678-C2-R).
Conflicts of Interest
The authors declare no conflict of interest.
References
- Saradar, A.; Tahmouresi, B.; Mohseni, E.; Shadmani, A. Restrained Shrinkage Cracking of Fiber-Reinforced High-Strength Concrete. Fibers 2018, 6, 12. [Google Scholar] [CrossRef]
- Vrijdaghs, R.; di Prisco, M.; Vandewalle, L. Uniaxial tensile creep of a cracked polypropylene fiber reinforced concrete. Mater. Struct. 2018, 51, 5. [Google Scholar] [CrossRef]
- Zia, A.; Ali, M. Behavior of fiber reinforced concrete for controlling the rate of cracking in canal-lining. Constr. Build. Mater. 2017, 155, 726–739. [Google Scholar] [CrossRef]
- Minguez, J.; González, D.C.; Vicente, M.A. Influence of fibre volume fraction and fibre orientation on the residual flexural tensile strength of fibre-reinforced concrete. Hormigón y Acero 2019, 70, 15–21. [Google Scholar]
- Mínguez, J.; González, D.C.; Vicente, M.A. Fiber geometrical parameters of fiber-reinforced high strength concrete and their influence on the residual post-peak flexural tensile strength. Constr. Build. Mater. 2018, 168, 906–922. [Google Scholar] [CrossRef]
- Ruiz, G.; de la Rosa, A.; Wolf, S.; Poveda, E. Model for the compressive stress–strain relationship of steel fiber-reinforced concrete for non-linear structural analysis. Hormigón y Acero 2019, 69, 75–80. [Google Scholar] [CrossRef]
- Nilforoush, R.; Nilsson, M.; Elfgren, L. Experimental evaluation of tensile behavior of single cast-in-place anchor bolts in plain and steel fibre-reinforced normal- and high-strength concrete. Eng. Struct. 2017, 147, 195–206. [Google Scholar] [CrossRef]
- Lee, J.-H. Influence of concrete strength combined with fiber content in the residual flexural strengths of fiber reinforced concrete. Compos. Struct. 2017, 168, 16–225. [Google Scholar] [CrossRef]
- Yoo, D.-Y.; Yoon, Y.-S.; Banthia, N. Flexural response of steel-fiber-reinforced concrete beams: Effects of strength, fiber content, and strain-rate. Cem. Concr. Compos. 2015, 64, 84–92. [Google Scholar] [CrossRef]
- Mobasher, B.; Bakhshi, M.; Barsby, C. Backcalculation of residual tensile strength of regular and high performance fiber reinforced concrete from flexural tests. Constr. Build. Mater. 2014, 70, 243–253. [Google Scholar] [CrossRef]
- Park, S.H.; Kim, D.J.; Ryu, G.S.; Koh, K.T. Tensile behavior of Ultra High Performance Hybrid Fiber Reinforced Concrete. Cem. Concr. Compos. 2012, 34, 172–184. [Google Scholar] [CrossRef]
- Gonzalez, D.C.; Moradillo, R.; Mínguez, J.; Martínez, J.A.; Vicente, M.A. Postcracking residual strengths of fiber-reinforced high-performance concrete after cyclic loading. Struct. Concr. 2018, 19, 340–351. [Google Scholar] [CrossRef]
- Bernard, E.S.; Reid, S.G. Fatigue Assessment of Fiber-Reinforced Concrete Using 1,200-mm Diameter Round Panels. ASCE J. Struct. Eng. 2018, 144, 04018059. [Google Scholar] [CrossRef]
- Al-Azzawi, B.S.; Karihaloo, B.L. Flexural Fatigue Behavior of a Self-Compacting Ultrahigh Performance Fiber-Reinforced Concrete. ASCE J. Mater. Civil. Eng. 2017, 29. [Google Scholar] [CrossRef]
- Rios, J.D.; Cifuentes, H.; Yu, R.C.; Ruiz, G. Probabilistic Flexural Fatigue in Plain and Fiber-Reinforced Concrete. Materials 2017, 10, 767. [Google Scholar] [CrossRef] [PubMed]
- Parvez, A.; Foster, S.J. Fatigue Behavior of Steel-Fiber-Reinforced Concrete Beams. J. Struct. Eng. 2015, 141. [Google Scholar] [CrossRef]
- González, D.C.; Vicente, M.A.; Ahmad, S. Effect of cyclic loading on the residual tensile strength of steel fiber–reinforced high-strength concrete. J. Mater. Civil. Eng. 2015, 27. [Google Scholar] [CrossRef]
- Sanz-Díez, G.; Zanuy, C. Characterisation of the flexural behavior of fibre reinforced concrete under impact loads. Hormigón y Acero 2017, 68, 139–145. [Google Scholar]
- Al Rikabi, F.T.; Sargand, S.M.; Khoury, I.; Hussein, H.H. Material properties of synthetic fiber–reinforced concrete under freeze-thaw conditions. J. Mater. Civil. Eng. 2018, 30. [Google Scholar] [CrossRef]
- Zhao, Y.-R.; Wang, L.; Lei, Z.-K.; Han, X.-F.; Shi, J.-N. Study on bending damage and failure of basalt fiber reinforced concrete under freeze-thaw cycles. Constr. Build. Mater. 2018, 163, 460–470. [Google Scholar] [CrossRef]
- Niu, D.; Jiang, L.; Bai, M.; Miao, Y. Study of the performance of steel fiber reinforced concrete to water and salt freezing condition. Mater. Des. 2013, 44, 267–273. [Google Scholar] [CrossRef]
- Soydan, A.M.; Sari, A.K.; Duymaz, B.; Akdeniz, R.; Tunaboylu, B. Air-Cured Fiber-Cement Composite Mixtures with Different Types of Cellulose Fibers. Adv. Mater. Sci. Eng. 2018. [Google Scholar] [CrossRef]
- Yan, L.; Kasal, B.; Huang, L. A review of recent research on the use of cellulosic fibres, their fibre fabric reinforced cementitious, geo-polymer and polymer composites in civil engineering. Compos. Part B 2016, 92, 94–132. [Google Scholar] [CrossRef]
- Onuaguluchi, O.; Banthia, N. Plant-based natural fibre reinforced cement composites: A review. Cem. Concr. Compos. 2016, 68, 96–108. [Google Scholar] [CrossRef]
- Wei, J.; Meyer, C. Degradation rate of natural fiber in cement composites exposed to various accelerated aging environment conditions. Corros. Sci. 2014, 88, 118–132. [Google Scholar] [CrossRef]
- Hwang, J.P.; Kim, M.; Ann, K.Y. Porosity generation arising from steel fibre in concrete. Constr. Build. Mater. 2015, 94, 433–436. [Google Scholar] [CrossRef]
- Yu, R.; Spiesz, P.; Brouwers, H.J.H. Mix design and properties assessment of Ultra-High Performance Fibre Reinforced Concrete (UHPFRC). Cem. Concr. Res. 2014, 56, 29–39. [Google Scholar] [CrossRef]
- Ríos, J.; Cifuentes, H.; Leiva, C.; Seitl, S. Analysis of the mechanical and fracture behavior of heated ultra-highperformance fiber-reinforced concrete by X-ray computed tomography. Cem. Concr. Res. 2019, 119, 77–88. [Google Scholar] [CrossRef]
- Vicente, M.A.; Ruiz, G.; González, D.C.; Mínguez, J.; Tarifa, M.; Zhang, X. CT-Scan study of crack patterns of fiber-reinforced concrete loaded monotonically and under low-cycle fatigue. Int. J. Fatigue 2018, 114, 138–147. [Google Scholar] [CrossRef]
- Pastorelli, E.; Herrmann, H. Time-efficient automated analysis for fibre orientations in steel fibre reinforced concrete. Proc. Est. Acad. Sci. USA 2016, 65, 28–36. [Google Scholar] [CrossRef]
- Herrmann, H.; Pastorelli, E.; Kallonen, A.; Suuronen, J.P. Methods for fibre orientation analysis of X-ray tomography images of steel fibre reinforced concrete (SFRC). J. Mater. Sci. 2016, 51, 3772–3783. [Google Scholar] [CrossRef]
- Ponikiewski, T.; Golaszewski, J.; Rudzki, M.; Bugdol, M. Determination of steel fibres distribution in self-compacting concrete beams using X-ray computed tomography. Arch. Civ. Mech. Eng. 2015, 15, 558–568. [Google Scholar] [CrossRef]
- Ponikiewski, T.; Katzer, J.; Bugdol, M.; Rudzki, M. Steel fibre spacing in self-compacting concrete precast walls by X-ray computed tomography. Mater. Struct. 2015, 48, 3863–3874. [Google Scholar] [CrossRef]
- Vicente, M.A.; González, D.C.; Mínguez, J. Determination of dominant fibre orientations in fibre-reinforced high strength concrete elements based on computed tomography scans. Nondestruct. Test. Eval. 2014, 29, 164–182. [Google Scholar] [CrossRef]
- Liu, J.; Li, C.; Liu, J.; Cui, G.; Yang, Z. Study on 3D spatial distribution of steel fibers in fiber reinforced cementitious composites through micro-CT technique. Constr. Build. Mater. 2013, 48, 656–661. [Google Scholar] [CrossRef]
- Vicente, M.A.; González, D.C.; Mínguez, J.; Tarifa, M.A.; Ruiz, G. Influence of the pore morphology of high strength concrete on its fatigue life. Int. J. Fatigue 2018, 112, 106–116. [Google Scholar] [CrossRef]
- Lu, H.; Peterson, K.; Chernoloz, O. Measurement of entrained air-void parameters in Portland cement concrete using micro X-ray computed tomography. Int. J. Pavement Eng. 2018, 19, 109–121. [Google Scholar] [CrossRef]
- Chandrappa, A.K.; Biligiri, K.P. Pore Structure Characterization of Pervious Concrete Using X-ray Microcomputed Tomography. J. Mater. Civil. Eng. 2018, 30. [Google Scholar] [CrossRef]
- Wang, Y.-S.; Dai, J.-G. X-ray computed tomography for pore-related characterization and simulation of cement mortar matrix. Ndt E Int. 2017, 86, 28–35. [Google Scholar] [CrossRef]
- Moradian, M.; Hu, Q.; Aboustait, M.; Ley, M.T.; Hanan, J.C.; Xiao, X.; Scherer, G.W.; Zhang, Z. Direct observation of void evolution during cement hydration. Mater. Des. 2017, 136, 137–149. [Google Scholar] [CrossRef]
- Lu, H.; Alymov, E.; Shah, S.; Peterson, K. Measurement of air void system in lightweight concrete by X-ray computed tomography. Constr. Build. Mater. 2017, 152, 467–483. [Google Scholar] [CrossRef]
- Vicente, M.A.; Mínguez, J.; González, D.C. The use of computed tomography to explore the microstructure of materials in civil engineering: From rocks to concrete. In Computed Tomography—Advanced Applications; Mesrur, H.A., Ed.; InTech: London, UK, 2017. [Google Scholar]
- Yuan, J.; Liu, Y.; Li, H.; Yang, C. Experimental investigation of the variation of concrete pores under the action of freeze-thaw cycles. Procedia Eng. 2016, 161, 583–588. [Google Scholar] [CrossRef]
- Kim, K.Y.; Yun, T.S.; Choo, J.; Kang, D.H.; Shin, H.S. Determination of air-void parameters of hardened cement-based materials using X-ray computed tomography. Constr. Build. Mater. 2012, 37, 93–101. [Google Scholar] [CrossRef]
- Promentilla, M.A.B.; Suriyama, T.; Hitomi, T.; Takeda, N. Characterizing the 3D Pore Structure of Hardened Cement Paste with Synchrotron Microtomography. J. Adv. Concr. Technol. 2008, 6, 273–286. [Google Scholar] [CrossRef]
- Ley, M.T.; Welcher, D.; Peery, J.; Khatibmasjedi, S.; LeFlore, J. Determining the air-void distribution in fresh concrete with the Sequential Air Method. Constr. Build. Mater. 2017, 150, 723–737. [Google Scholar] [CrossRef]
- Akand, L.; Yang, M.; Gao, Z. Characterization of pervious concrete through image based micromechanical modeling. Constr. Build. Mater. 2016, 114, 547–555. [Google Scholar] [CrossRef]
- Chen, Y.; Wang, K.; Wang, X.; Zhou, W. Strength, fracture and fatigue of previous concrete. Constr. Build. Mater. 2013, 42, 97–104. [Google Scholar] [CrossRef]
- Jin, S.; Zhang, J.; Huang, B. Fractal analysis of effect of air void on freeze-thaw resistance of concrete. Constr. Build. Mater. 2013, 47, 126–130. [Google Scholar] [CrossRef]
- Kim, H.K.; Jeon, J.H.; Lee, H.K. Workability, and mechanical, acoustic and thermal properties of lightweight aggregate concrete with a high volume of entrained air. Constr. Build. Mater. 2012, 29, 193–200. [Google Scholar] [CrossRef]
- Le, H.T.; Kraus, M.; Siewert, K.; Ludwig, H.M. Effect of macro-mesoporous rice husk ash on rheological properties of mortar formulated from self-compacting high performance concrete. Constr. Build. Mater. 2015, 80, 225–235. [Google Scholar] [CrossRef]
- Vydra, V.; Vodák, F.; Kapičková, O.; Hošková, Š. Effect of temperature on porosity of concrete for nuclear-safety structures. Cem. Concr. Res. 2001, 31, 1023–1026. [Google Scholar] [CrossRef]
- Rouquerol, J.; Avnir, D.; Fairbridge, C.W.; Everett, D.H.; Haynes, J.H.; Pernicone, N.; Ramsay, J.D.F.; Sing, K.S.W.; Unger, K.K. Recommendations for the characterization of porous solids (Technical Report). Pure Appl. Chem. 1994. [Google Scholar] [CrossRef]
- Mínguez, J.; Vicente, M.A.; González, D.C. Pore morphology variation under ambient curing of plain and fiber-reinforced high performance mortar at an early age. Constr. Build. Mater. 2019, 198, 718–731. [Google Scholar] [CrossRef]
- Vicente, M.A.; Mínguez, J.; González, D.C. Variation of the Pore Morphology during the Early Age in Plain and Fiber-Reinforced High-Performance Concrete under Moisture-Saturated Curing. Materials 2019, 12, 975. [Google Scholar] [CrossRef] [PubMed]
- British Standards Institution. Cement. Composition, Specifications and Conformity Criteria for Common Cements; EN 197-1:2011; BSI: London, UK, 2011. [Google Scholar]
- British Standards Institution. Methods of Testing Cement. Determination of Strength; EN 196-1-2016; BSI: London, UK, 2016. [Google Scholar]
- Vicente, M.A.; González, D.C.; Mínguez, J. Recent advances in the use of computed tomography in concrete technology and other engineering fields. Micron 2019, 118, 22–34. [Google Scholar] [CrossRef] [PubMed]
© 2020 by the authors. Licensee MDPI, Basel, Switzerland. This article is an open access article distributed under the terms and conditions of the Creative Commons Attribution (CC BY) license (http://creativecommons.org/licenses/by/4.0/).