Abstract
In recent years, the rapid development of the pharmaceutical industry and the extensive and illicit use of painkillers have led to increased levels of nonsteroidal anti-inflammatory drugs (NSAIDs) in the environment. In view of the significant impact of NSAIDs on living organisms, including humans, their presence in the environment needs to be continuously monitored at trace levels. For this purpose, a combination of molecularly imprinted solid-phase extraction (MISPE) and HPLC-MS analysis is commonly used. MISPE has been utilized in direct, fast, and ecological analysis of drugs using a flowing atmospheric-pressure afterglow ion source for mass spectrometry (FAPA-MS). The new method was applied herein in the determination of naproxen, diclofenac, and ibuprofen. The linear dependence of the intensity of analytical signals on the amount of drugs is in the range of 0.2 μg to 1 g and the method detection limit (MDL) for all drugs is 0.2 μg in environmental samples. The new method also decreased the number of analytical stages, the time and cost of analysis, and the organic solvent consumption, besides being environmentally friendly.
1. Introduction
The recent increase in the human population and the development of industry have been the main contributors to the growing number of pollutants in the natural environment. The introduction of harmful substances into the air, water, and soil, in addition to having a negative impact on ecosystems and climate, is a direct threat to human health. Furthermore, these compounds can be easily transported between water reservoirs, like from wastewater to river water, to dam water, consequently reaching drinking water and becoming a serious threat to human health. These new emerging pollutants are considered very dangerous, even in trace amounts, due to their serious ecological side effects. Therefore, water pollution by nonsteroidal anti-inflammatory drugs (NSAIDs) has become a subject of global interest and of great interest to major international organizations such as the World Health Organization, United States State Agency for Environmental Protection, and the European Commission [1,2,3]. Among several emerging pollutants, NSAIDs are the most common compounds detected in environmental compartments due to their large consumption throughout the world [4]. Pain is a serious public health problem worldwide. About 27% of the adult population suffers from chronic pain [5,6]. If left untreated, it may be associated with the risk of harmful health effects (e.g., delayed wound healing, immunity disorders, or cardiovascular problems). In addition, it can negatively affect quality of life, daily functioning, sleep, interpersonal relationships, and work performance [7,8]. Pain alleviation through medication has resulted in widespread NSAIDs use as over-the-counter drugs. These are analgesics and antipyretics which also have anti-inflammatory effects at higher doses [9,10]. The most common members of this group of drugs are ibuprofen, naproxen, and diclofenac. The widespread availability and abuse thereof may lead to the accumulation of these substances in the environment. Their presence in the aquatic environment could have negative health effects on certain species, while long-time exposure could cause various risks such as drug resistance in humans and animals, even at low concentrations (usually in micro- or nanograms per liter). The nonbiodegradability of NSAIDs makes them easily accumulate in the environment [11,12,13]. Therefore, it is of great importance to develop a sensitive, selective, and cost-effective method to accurately monitor NSAIDs in the environment [14,15,16,17]. According to the literature, the use of molecularly imprinted polymers (MIPs) or magnetic MIPs (mag-MIPs) [18] is a promising approach for the removal of trace pollutants from water. The technology of the production of MIPs is based on the formation of complexes between the analyte/template/guest molecule and the functional monomer/host molecule [19,20]. The technique involves the polymerization of functional monomers and a cross-linker around a template. The analyte–monomer complex is then subjected to polymerization initiated by temperature or irradiation (thermal or photoinitiation), during which a three-dimensional polymer structure is formed [21,22,23]. At the subsequent stage, the template is removed from the obtained polymer structure, leaving empty cavities capable of binding the template molecules as they are complementary to these template molecules in size, shape, and functional group positions. The polymers obtained are chemically stable and water-insoluble, which permits their multiple uses in chemical analysis. Moreover, their synthesis process is relatively simple, reproducible, and cheap [24]. MIPs have been employed in fields requiring a certain degree of selectivity, such as sensing, catalysis, and chromatography. However, nowadays, their use in solid-phase extraction (SPE), so-called MISPE, is by far the most advanced technical application of MIPs. The use of MIPs as selective sorbent materials allows for performing a customized sample treatment step prior to the final determination. This is of special interest in the case of complex samples where the presence of interference could prevent final quantification by typical chromatographic techniques coupled to common detectors [25,26]. Mass spectrometry is the most commonly used analytical technique in the trace analysis of organic compounds. It is used as a separate tool with different sources of ionization or is often coupled with other analytical techniques, e.g., HPLC. As shown in publications, some organic compounds can be determined using direct mass spectrometry [27,28]. However, in the case of trace analysis, which includes NSAID analysis, it is necessary to preconcentrate the analyte. A great solution is to use selective MIPs for this, which preconcentrate the analyte and isolate it from the sample matrix. An additional advantage is the lack of interference by other chemical compounds present in the sample. MIPs are mainly used as sorption materials for sample preconcentration in HPLC-MS analysis. However, they are increasingly used in various fields of chemistry, e.g., as a layer of selective coating on electrodes in electrochemical analysis. In this way, antigens can be analyzed using specific antibodies. However, the process of manufacturing the electrode, optimizing its working conditions, and performing the analysis is much more complicated, time-consuming, and cost-intensive than flowing atmospheric-pressure afterglow (FAPA)-MS analysis [29]. Unfortunately, analysis of proteins by FAPA-MS is not possible due to their high molecular weight. However, when it comes to analyzing organic compounds with low molecular weight, this method is very fast, simple, and cheap. You can use commercially available MIPs or make them by simple synthesis. The analyte enclosed in the MIP polymer structure is additionally stable for a longer period of time, crucial for, e.g., estrogen analysis [23]. The analyte in MIPs can be easily transported and stored. The FAPA-MS analytical technique using MIPs is very simple and does not require additional instrumentation; we skip the sample preparation stages, the analysis is carried out directly from MIPs, the number of errors decreases, the method is repeatable, and its time does not exceed 5 min. Ionization techniques at atmospheric pressure deserve special attention in mass spectrometry. Ambient ionization mass spectrometry comprises a group of various techniques that allow MS analysis at atmospheric pressure. They provide rapid, direct, and high-throughput analyses with no or only minimal sample pretreatment. Moreover, substances can be analyzed directly from surfaces or other matrixes. FAPA-MS techniques involve the generation of a direct current or radiofrequency electrical discharge between a pair of electrodes in contact with a flowing inert gas, creating a stream of ionized molecules, radicals, excited state neutral atoms, and electrons. The plasma species are directed towards the sample, resulting in desorption and ionization of the analyte. Ambient plasma MS techniques have many advantages due to their simple instrumentation, rugged construction of the measuring system, no need for solvents, and generation of singly charged analyte species that are easier to identify than multiply charged ions and various adducts produced by the spray-based techniques [30,31,32,33,34,35].
We propose the use of commercially available AFFINILUTETM MIP-NSAIDs columns to pre-isolate and preconcentrate NSAIDs from solutions, followed by direct analysis using the FAPA ionization source. The obtained results are presented and compared with results obtained via the standard way of analysis by the HPLC-MS method.
2. Materials and Methods
2.1. Chemicals
All reagents used were commercial products. Ibuprofen, naproxen, diclofenac, and AFFINILUTETM MIP-NSAIDs columns were obtained from Merck (Germany). Ammonium formate, formic acid (FA), and all organic solvents were also purchased from Merck (Germany).
2.2. High-Performance Liquid Chromatography–Mass Spectrometry (HPLC-MS)
HPLC-MS spectra were recorded on a quadrupole mass spectrometer with electrospray ionization (ESI). As a standard, an Impact HD mass spectrometer was connected to an ultra-HPLC (UHPLC) liquid chromatograph (UltiMate 3000) Thermo Scientific/Dionex with a fast (200 Hz) diode detector. The mass spectrometer was operated in the mass range 177–400 m/z. The capillary voltage was set at −4.5 kV and the endplate offset at −500 V. The nebulizer pressure was 1.5 bar, and the dry gas flow was 9 Lmin−1. In the HPLC analyses, a Kinetex 2.6 u C18 column (100 × 2.10 mm) was used. The column temperature was 35 °C, the injection volume was 50 µL, and the mobile phase flow was 0.3 mLmin−1. A concentration gradient was used. The change in the composition of the mobile phase is shown in Table 1.

Table 1.
The percentage composition of the mobile phase (A: H2O + 0.1% FA; B: Acetonitrile + 0.1% FA) in gradient HPLC-MS analysis.
2.3. FAPA-MS
FAPA-MS spectra were recorded using an AmaZon SL ion trap (Bruker, Bremen, Germany) equipped with a FAPA ambient plasma source (ERTEC, Wroclaw, Poland) (Figure 1). The apparatus was operated in the so-called “enhanced resolution mode” (mass range: 50–2200 m/z, scanning rate: 8100 m/z per second). The capillary voltage was set at −4.5 kV and the endplate offset at −500 V. The source temperature was 80 °C and the desolvation temperature was 250 °C. Helium was used as the cone gas and desolvating gas (nitrogen) at flow rates of 50 Lh−1 and 800 Lh−1, respectively.
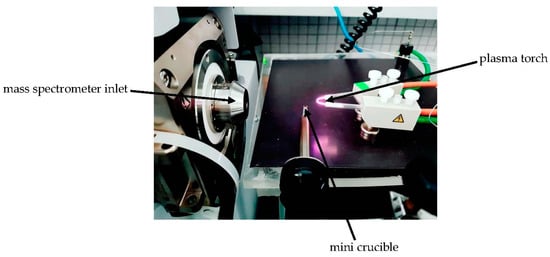
Figure 1.
The flowing atmospheric-pressure afterglow (FAPA)-MS measuring system.
FAPA was used to generate plasma, allowing the ionization of analyte particles released thermally from a heated crucible, with temperature regulation from 50 to 500 °C at a temperature increase rate of 3 °C·s−1. The desorption temperature of the analytes was close to the melting points of the analytes and varied between 50 and 300 ± 10 °C. The mini crucible allowing the temperature-controlled desorption was placed ca. 10 mm below the ion stream. The distance between the inlet of the mass spectrometer and the FAPA ion source should be about 10 cm.
2.4. Analytical Procedures
2.4.1. HPLC-MS Method
Three different series of aqueous solution samples were prepared, containing ibuprofen, naproxen, and diclofenac in the concentration range from 0.02 μgL−1 to 3 mgL−1. All samples were subjected to HPLC-MS analysis. The mass spectra as the intensity of signals versus mass-to-charge ratio were recorded. The dependence of signal intensity [M+H]+ on the concentrations of individual analytes was plotted. From these data, the range of measurement linearity and limit of detection (LOD) were determined.
In the next stage, all high-dilution samples with an analyte amount below the LOD were subjected to the following procedure: Samples were analyzed according to the commercial procedure using AFFINILUTETM MIP-NSAIDs columns and HPLC-MS. For this purpose, an AFFINILUTETM MIP-NSAIDs column was conditioned using 1 mL acetonitrile, 1 mL methanol, and 1 mL 10 mM ammonium formate (pH = 3). Next, 5 mL of the prepared NSAIDs sample was loaded on the column. In the next step, the column was washed with 1 mL water and 1 mL acetonitrile/water at 40:60 (v/v). Then, the NSAIDs were eluted by 2 × 1 mL 1% acetic acid diluted in 20:80 (v/v) acetone/methanol. Finally, the eluate was evaporated to dryness, and 150 μL of the mobile phase of HPLC was added. The HPLC-MS spectra were recorded. This procedure is represented in Figure 2. The concentration of the NSAIDs in solution was determined. The process was repeated three times.
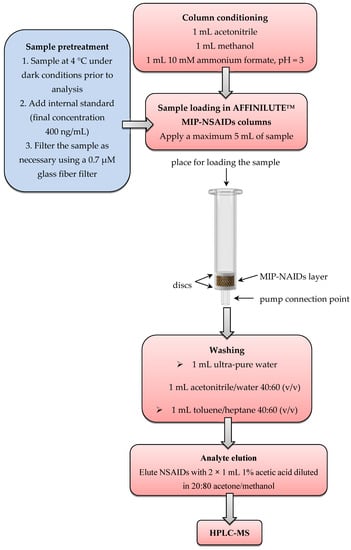
Figure 2.
The analytical procedure for the determination of nonsteroidal anti-inflammatory drugs (NSAIDs) using an AFFINILUTETM molecularly imprinted polymer MIP-NSAIDs column and HPLC-MS.
2.4.2. FAPA-MS Method
In the FAPA-MS method, a sample ionized at atmospheric pressure can be introduced into a mini crucible in solution or solid form. To determine the range of measurement linearity and detection limits of the method, three aqueous solutions of ibuprofen, naproxen, and diclofenac at a concentration of 3 mgL−1 were prepared. Then, different volumes (10–1000 μL) of solution were added to the mini crucible and the mass spectra were recorded. The relationship between the signal intensity [M+H]+ and the amount of analyte was plotted.
Analysis of NSAIDs by the FAPA-MS method with an AFFINILUTETM MIP-NSAIDs column was realized as follows: After conditioning the AFFINILUTETM MIP-NSAIDs column using 1 mL acetonitrile, 1 mL methanol, and 1 mL 10 mM ammonium formate (pH = 3), a specific amount of analyte (maximum of 25 mg NSAIDs in the total volume of sample solution) was loaded directly into the column. Twenty-five milligrams of NSAIDs was the column capacity. The column was washed with 1 mL of 50:50 (v/v) acetonitrile/water and dried. In the next step, MIP (15 mg) from the column was transferred to a mini-cup of the spectrometer, and a measurement was made by recording the mass spectrum of the sample. The analytical procedure is presented in Figure 3. The concentration of NSAIDs was determined. The process was repeated three times.
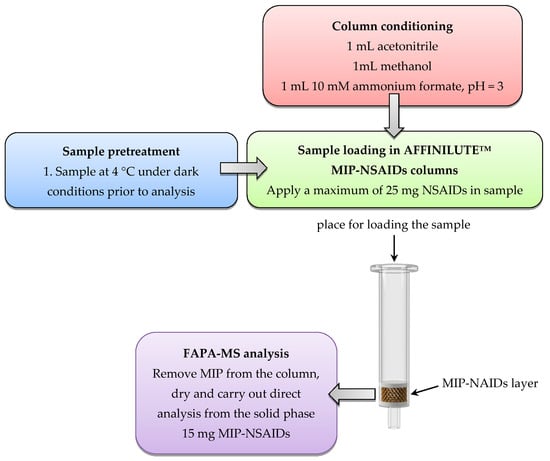
Figure 3.
The analytical procedure for the determination of NSAIDs using an AFFINILUTETM MIP-NSAIDs column and FAPA-MS.
3. Results and Discussion
The HPLC-MS method was used to analyze (Figures S1–S3) standard NSAIDs solutions consisting of naproxen (0.229 mgL−1), diclofenac (0.295 mgL−1), and ibuprofen (2.041 mgL−1). The retention time for analytes in HPLC was determined, and using the mass spectrometer, the value of m/z signals of analytical significance was determined. For each of the compounds, the analytical signal from the proton attachment was selected. For naproxen, m/z 231 [M+H]+; for diclofenac, m/z 296 [M+H]+; and for ibuprofen, m/z 207 [M+H]+ (Figure 4).
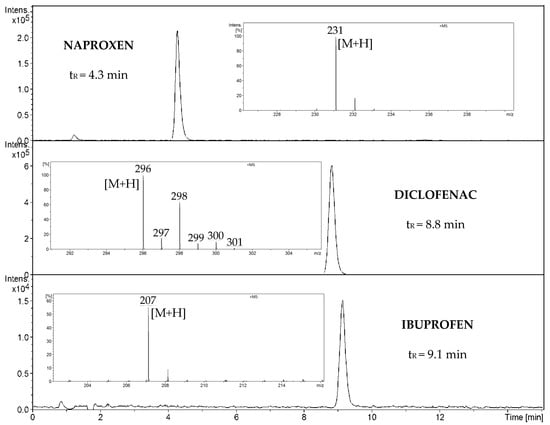
Figure 4.
Extracted ion chromatogram (EIC) HPLC-MS spectra of naproxen, diclofenac, and ibuprofen.
The signals in the spectrometry mass apparatus were recorded in two modes: total ion chromatogram (TIC) and extracted ion chromatogram (EIC). Next, using five different concentrations of analytes, the range of linearity of intensity signals [M+H]+ versus the concentration of drugs and the method detection limit (MDL) were determined (Table 2). The MDL is defined as the minimum measured concentration of a substance that can be reported with 99% confidence that the measured concentration is distinguishable from method blank results. The concentration of a substance that can be reported with 99% confidence indicates that the measured concentration is distinguishable from blank samples.
Table 2.
Analytical parameters for HPLC-MS in the analysis of drug solutions.
The determined MDL values of drugs in solution using direct HPLC-MS analysis are high and significantly exceed the concentrations of drugs present in waters, sewage, and the environment, so it is necessary to pre-concentrate the samples before further analysis. The analytes were concentrated using AFFINILUTETM MIP-NSAIDs columns. The samples were prepared according to the previously described analytical procedure; in these experiments, we used solutions in the concentration range from 0.02 μgL−1 to 3.0 mgL−1. The HPLC-MS spectra of the eluent were recorded. Table 3 presents the obtained results regarding analytical parameters.
Table 3.
Analytical parameters for HPLC-MS in the analysis of drug solutions using AFFINILUTETM MIP-NSAIDs columns.
The obtained results indicate that it is a well-functioning and useful analytic tool. However, sample preparation consists of many stages that can accumulate various errors. These errors can significantly affect the result, especially in the case of trace analysis. In addition, sample preparation is time- and cost-consuming, which are crucial factors for large-scale analysis. An additional threat to the environment is the amount of waste generated during sample preparation. Particular attention should be paid to the amount of organic solvents used. In response to this problem, other analytical options using the known analytical techniques and commercially available means were considered.
In the first step of direct analysis by FAPA-MS, different amounts of analytes were placed on a mini crucible and their mass spectra were recorded. For ibuprofen, two signals corresponding to m/z 207 [M+H]+ and m/z 224 [M+H2O]•+ were recorded (Figure 5). For naproxen, signals m/z 231 [M+H]+ and m/z 248 [M+H2O]•+ and a signal from the fragmentation ion m/z 185 (Figure 6) were found. For diclofenac, the m/z 296 [M+H]+ signal and the signal resulting from the loss of the water molecule m/z 278 (Figure 7) were recorded.
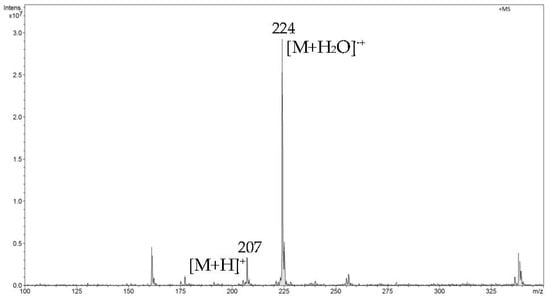
Figure 5.
The FAPA-MS spectrum of ibuprofen.
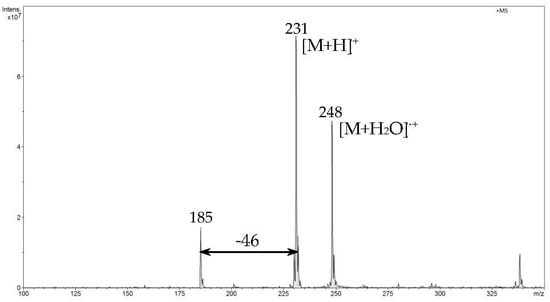
Figure 6.
The FAPA-MS spectrum of naproxen.
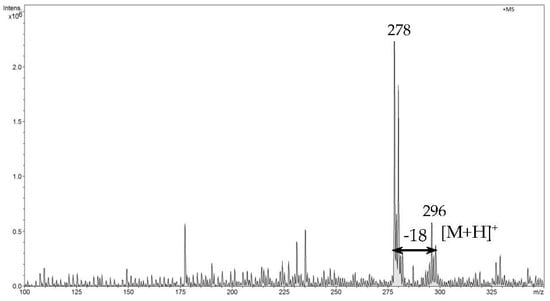
Figure 7.
The FAPA-MS spectrum of diclofenac.
Then, the dependence of the analytical signal intensity ([M+H]+ and [M+H2O]+ for ibuprofen and naproxen and [M+H]+ and [M-H2O]+ signals for diclofenac) on the amount of analyte was plotted (Figure S4). The range of measurement linearity and method detection limits for all compounds were determined. The linear dependence of the intensity of analytical signals on the amount of drugs is in the range of 0.2 μg to 1 g and the MDL for all drugs is 0.2 μg. In the next step, the scope of applicability of the FAPA-MS analytical method for the determination of NSAIDs was defined for samples containing a mix of drugs. During the measurement, the heating was started at 50 °C with a gradual increase to 300 °C. In Figure 8, the first signal from ibuprofen appears when the temperature of the heating source is around 70 °C because the melting point of ibuprofen varies between 75 °C and 78 °C. Then, as the temperature rises, a signal from naproxen appears, which is intensively released at about 150 °C, because its melting point is 152–155 °C. The release of diclofenac occurs at the same time, due to its melting point of 156–158 °C.
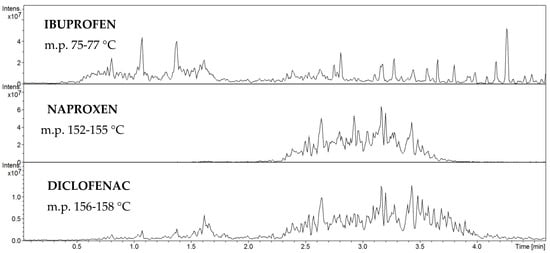
Figure 8.
Total ion current chromatogram for FAPA-MS analysis of ibuprofen, naproxen, and diclofenac.
Then, the FAPA-MS spectra obtained directly from the AFFINILUTETM MIP-NSAIDs column after absorbing NSAIDs were recorded. In the initial heating phase, we observed signals from ibuprofen (I), which was released first due to it having the lowest melting point (Figure 9). In the first phase of measurements, we also observed a low-intensity signal from naproxen (N).
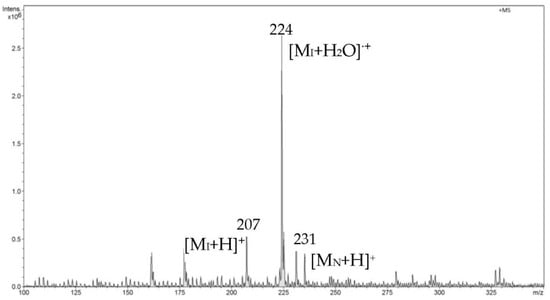
Figure 9.
FAPA-MS spectrum recorded in the initial heating phase from 20 °C to 120 °C.
In the second phase of measurements, when the crucible temperature per sample reached approximately 150 °C, we recorded the most intense signals from naproxen at m/z 231 and m/z 248. Then, with increasing temperature, the signals from ibuprofen begin to weaken, which indicates that most of this analyte had already been desorbed. A low-intensity signal appears from diclofenac (D) m/z 296, which desorbs the latest due to it having the highest melting point (Figure 10).
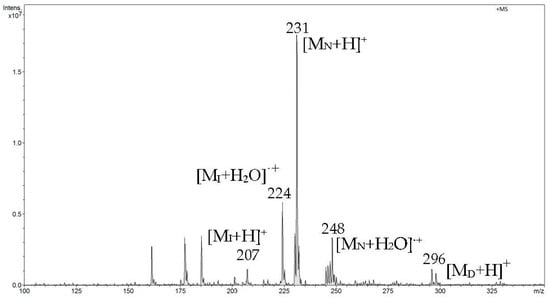
Figure 10.
FAPA-MS spectrum recorded in the second heating phase from 120 °C to 155 °C.
In the next analytical phase, we recorded one spectrum of all analytical signals from the three compounds analyzed (Figure 11). It confirms that ibuprofen, naproxen, and diclofenac were bound in the MIP structure and underwent successive thermodesorption during the analysis.
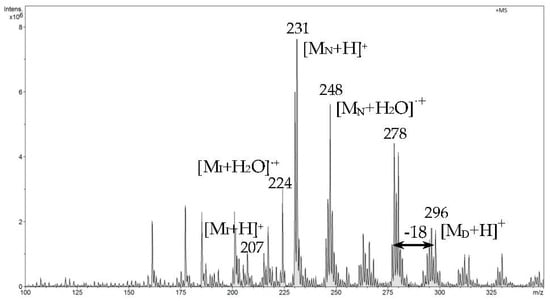
Figure 11.
FAPA-MS spectrum of all analytical signals recorded at 160 °C.
In the last stage of measurements, as expected, the signal from ibuprofen disappears, the signal from naproxen decreases significantly, and the signal from diclofenac is the most intense for the longest time (Figure 12).
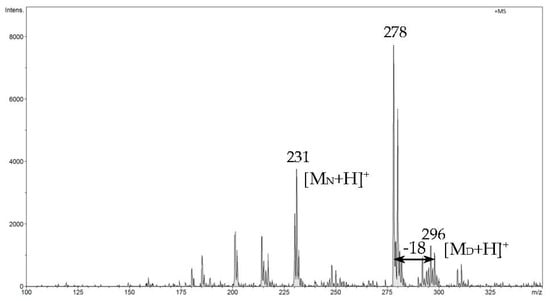
Figure 12.
FAPA-MS spectrum recorded in the last heating phase from 160 °C to 300 °C.
To validate the method described in the experimental section, the FAPA-MS analytical technique, the molecularly imprinted polymer from the AFFINILUTETM MIP-NSAIDs columns, and drug solutions with concentrations of 0.5–1.50 μg (Table 4) were used.
Table 4.
Analytical parameters for FAPA-MS in the analysis of drug solutions using AFFINILUTETM MIP-NSAIDs columns.
Szymonik et al. [34] reported that NSAIDs in wastewater reached 0.005–1.59 μgL−1 for diclofenac, 0.05–3.35 μgL−1 for ibuprofen, and 0.03–0.7 μgL−1 for naproxen. Kosjek et al. [35] reported that the diclofenac content in river water was 0.009–0.282 μgL−1 and the naproxen content was 0.021–0.313 μgL−1. The presented analytical method allows for the determination of the concentration of individual NSAIDs at these levels. The sample was concentrated by adding the appropriate volume of river/lake or sewage water (minimum amount of NSAIDs: 0.2 g in the whole volume) to the column, but not exceeding the total volume of 100 mL. Using a larger volume of water sample applied to the column can reduce the method detection limit by 20 times.
4. Conclusions
A new analytical technique combining the use of a molecularly imprinted polymer technique and direct FAPA-MS analysis for the determination of ibuprofen, naproxen, and diclofenac was proposed herein. Commercially available AFFINILUTETM MIP-NSAIDs columns containing an NSAID-selective polymer layer were used. Preconcentration of trace amounts of analytes was performed via the MISPE method. Two types of analyses were performed: the standard HPLC-MS and the new one, direct FAPA-MS. In the standard method, the analysis consisted of five stages. Sample feeding is preceded by conditioning the column, and the sample must be washed before analysis. Approximately 8 mL of various solvents is used in the whole process. In addition, the sample preparation process is time-consuming and the HPLC analysis time is 15 min. In the proposed method, a raw sample is dosed to the column. MIP with the analyte is washed with 1 ml of a solvent, which is the total amount of solvent used in this analytical process. Then, direct and quick FAPA-MS analysis is performed in about 2 min. The use of MISPE concentration only vaguely improved the analytical parameters determined by the HPLC-MS method. However, the combination of MISPE and FAPA-MS not only improved the detection limit of all analytes to 0.2 μg ibuprofen/naproxen/diclofenac applied once per spoon, but also allowed for shortened analysis time, reduced number of analytical steps, and reduced possibility of errors. An additional advantage was the reduction of the amount of solvent used, due to which the proposed method is not only analytically attractive, but also environmentally friendly and compliant with the principles of Green Chemistry.
The presented new analytical method combining MISPE and FAPA-MS can be a successful alternative to MISPE in HPLC-MS. Besides this, the presented method allows us to quickly and easily determine low-molecular-weight organic compounds. By choosing MIPs selective for different particles, we can analyze different groups of compounds, e.g., drugs in wastewater, performance-enhancing drugs in the blood, unauthorized substances in legal highs, and many others. The main limitations of the method are the existence or possibility of the synthesis of relevant MIPs and the ability to detect ions obtained by FAPA by a mass spectrometer.
Supplementary Materials
The following are available online at https://www.mdpi.com/2076-3417/10/12/4217/s1, Figure S1: HPLC-MS full-range spectrum of naproxen, Figure S2: HPLC-MS full-range spectrum of diclofenac, Figure S3: HPLC-MS full-range spectrum of ibuprofen, Figure S4: Calibration curve (partial) of ibuprofen, naproxen, and diclofenac for FAPA-MS.
Author Contributions
Conceptualization, M.G. and G.S.; methodology, M.G.; software, M.G.; validation, M.G.; formal analysis, M.G.; investigation, M.G.; resources, M.G.; data curation, M.G.; writing—original draft preparation, M.G.; writing—review and editing, G.S.; visualization, M.G.; supervision, G.S.; project administration, G.S.; funding acquisition, G.S. All authors have read and agreed to the published version of the manuscript.
Funding
This research was funded by the National Science Centre, Poland, under grant number 2016/21/B/ST4/02082. The work was supported by grant no. POWR.03.02.00-00-I023/17 co-financed by the European Union through the European Social Fund under the Operational Program Knowledge Education Development.
Conflicts of Interest
The authors declare no conflict of interest.
References
- Madikizela, L.M.; Tavengwa, N.T.; Chimuka, L. Applications of molecularly imprinted polymers for solid-phase extraction of non-steroidal anti-inflammatory drugs and analgesics from environmental waters and biological samples. J. Pharm. Biomed. Anal. 2018, 147, 624–633. [Google Scholar] [CrossRef] [PubMed]
- Martinez-Sena, T.; Armenta, S.; de la Guardia, M.; Esteve-Turrillas, F.A. Determination of non-steroidal anti-inflammatory drugs in water and urine using selective molecular imprinted polymer extraction and liquid chromatography. J. Pharm. Biomed. Anal. 2016. [Google Scholar] [CrossRef] [PubMed]
- Silver, S.A.; Nash, D.M.; Wald, R. Association of NSAID Use and Renal Complications. JAMA Intern. Med. 2019, 179, 586. [Google Scholar] [CrossRef] [PubMed]
- Gilart, N.; Marcé, R.M.; Fontanals, N.; Borrull, F. A rapid determination of acidic pharmaceuticals in environmental waters by molecularly imprinted solid-phase extraction coupled to tandem mass spectrometry without chromatography. Talanta 2013, 110, 196–201. [Google Scholar] [CrossRef] [PubMed]
- Jaria, G.; Calisto, V.; Otero, M.; Esteves, V.I. Monitoring pharmaceuticals in the aquatic environment using enzyme-linked immunosorbent assay (ELISA)—A practical overview. Anal. Bioanal. Chem. 2020. [Google Scholar] [CrossRef] [PubMed]
- Tsioulias, G.J.; Go, M.F.; Rigas, B. NSAIDs and Colorectal Cancer Control: Promise and Challenges. Curr. Pharmacol. Rep. 2015, 1, 295–301. [Google Scholar] [CrossRef] [PubMed]
- Brecht, D.; Uteschil, F.; Schmitz, O.J. Thermogravimetry coupled to an atmospheric pressure photo ionization quadrupole mass spectrometry for the product control of pharmaceutical formulations and the analysis of plasticizers in polymers. Talanta 2019, 198, 440–446. [Google Scholar] [CrossRef]
- Mlynek, F.; Himmelsbach, M.; Buchberger, W.; Klampfl, C.W. A new analytical workflow using HPLC with drift-tube ion-mobility quadrupole time-of-flight/mass spectrometry for the detection of drug-related metabolites in plants. Anal. Bioanal. Chem. 2020. [Google Scholar] [CrossRef] [PubMed]
- Blanca-Lopez, N.; Soriano, V.; Garcia-Martin, E.; Canto, G.; Blanca, M. Nsaid-induced reactions: Classification, prevalence, impact, and management strategies. J. Asthma Allergy 2019, 12, 217–233. [Google Scholar] [CrossRef] [PubMed]
- Bacchi, S.; Palumbo, P.; Sponta, A.; Coppolino, M.F. Clinical Pharmacology of Non-Steroidal Anti-Inflammatory Drugs: A Review. Antiinflamm. Antiallergy Agents Med. Chem. 2012, 11, 52–64. [Google Scholar] [CrossRef] [PubMed]
- Iqbal, M.Y.; Rao, K.M.V.N.; Sridhar, G.; Raju, P.P.; Deshpande, G.R.; Babu, J.M. Characterization and relative response factor determination of process related impurity in Naproxen by nuclear magnetic resonance spectroscopy. J. Pharm. Biomed. Anal. 2011, 56, 484–490. [Google Scholar] [CrossRef] [PubMed]
- Tsikas, D.; Kayacelebi, A.A.; Hanff, E.; Mitschke, A.; Beckmann, B.; Tillmann, H.C.; Gutzki, F.M.; Müller, M.; Bernasconi, C. GC–MS and GC–MS/MS measurement of ibuprofen in 10-μL aliquots of human plasma and mice serum using [α-methylo-2H3]ibuprofen after ethyl acetate extraction and pentafluorobenzyl bromide derivatization: Discovery of a collision energy-dependent H/D isotope. J. Chromatogr. B Anal. Technol. Biomed. Life Sci. 2017, 1043, 158–166. [Google Scholar] [CrossRef] [PubMed]
- Mura, P.; Faucci, M.T.; Maestrelli, F.; Furlanetto, S.; Pinzauti, S. Characterization of physicochemical properties of naproxen systems with amorphous β-cyclodextrin-epichlorohydrin polymers. J. Pharm. Biomed. Anal. 2002, 29, 1015–1024. [Google Scholar] [CrossRef]
- Wongrakpanich, S.; Wongrakpanich, A.; Melhado, K.; Rangaswami, J. A comprehensive review of non-steroidal anti-inflammatory drug use in the elderly. Aging Dis. 2018, 9, 143–150. [Google Scholar] [CrossRef]
- Sultan, M.; Stecher, G.; Stoggl, W.M.; Bakry, R.; Zaborski, P.; Huck, C.W.; El Kousy, N.M.; Bonn, G.K. Sample Pretreatment and Determination of Non Steroidal Anti-Inflammatory Drugs (NSAIDs) in Pharmaceutical Formulations and Biological Samples (Blood, Plasma, Erythrocytes) by HPLC-UV-MS and μ-HPLC. Curr. Med. Chem. 2005, 12, 573–588. [Google Scholar] [CrossRef]
- Iuliani, P.; Carlucci, G.; Marrone, A. Investigation of the HPLC response of NSAIDs by fractional experimental design and multivariate regression analysis. Response optimization and new retention parameters. J. Pharm. Biomed. Anal. 2010, 51, 46–55. [Google Scholar] [CrossRef]
- Park, S.Y.; Myung, S.W. Simultaneous Determination of Nonsteroidal Anti-Inflammatory Drugs in Aqueous Samples Using Dispersive Liquid–Liquid Microextraction and HPLC Analysis. Bull. Korean Chem. Soc. 2015, 36, 2901–2906. [Google Scholar] [CrossRef]
- Mieloch, A.A.; Żurawek, M.; Giersig, M.; Rozwadowska, N.; Rybka, J. Bioevaluation of superparamagnetic iron oxide nanoparticles (SPIONs) functionalized with dihexadecyl phosphate (DHP). Sci. Rep. 2020, 10, 1–11. [Google Scholar] [CrossRef]
- Guć, M.; Schroeder, G. The Molecularly Imprinted Polymers. Influence of Monomers on the Properties of Polymers—A Review. World J. Res. Rev. 2017, 5, 36–47. [Google Scholar]
- Chrzanowska, A.M.; Díaz-Álvarez, M.; Wieczorek, P.P.; Poliwoda, A.; Martín-Esteban, A. The application of the supported liquid membrane and molecularly imprinted polymers as solid acceptor phase for selective extraction of biochanin A from urine. J. Chromatogr. A 2019, 1599, 9–16. [Google Scholar] [CrossRef]
- Guć, M.; Pawlaczyk, M.; Schroder, G. A molecularly imprinted polymer coated-nanocomposite of magnetic nanoparticles for organic compounds recognition. In Proceedings of the 4th World Congress on Recent Advances in Nanotechnology, Rome, Italy, 14–16 April 2019. [Google Scholar]
- Guć, M.; Schroeder, G. Application of molecularly imprinted polymers (MIP) and magnetic molecularly imprinted polymers (mag-MIP) to selective analysis of quercetin in flowing atmospheric-pressure afterglow mass spectrometry (FAPA-MS) and in electrospray ionization mass spectrom. Molecules 2019, 24, 2364. [Google Scholar] [CrossRef]
- Guć, M.; Schroeder, G. Molecularly imprinted polymers and magnetic molecularly imprinted polymers for selective determination of estrogens in water by ESI-MS/FAPA-MS. Biomolecules 2020, 10, 672. [Google Scholar] [CrossRef] [PubMed]
- Li, W.; Chen, N.; Zhu, Y.; Shou, D.; Zhi, M.; Zeng, X. A nanocomposite consisting of an amorphous seed and a molecularly imprinted covalent organic framework shell for extraction and HPLC determination of nonsteroidal anti-inflammatory drugs. Microchim. Acta 2019, 186, 76. [Google Scholar] [CrossRef]
- Román-Hidalgo, C.; Dvořák, M.; Kubáň, P.; Martín-Valero, M.J.; Bello-López, M.Á. Direct capillary electrophoresis analysis of basic and acidic drugs from microliter volume of human body fluids after liquid-phase microextraction through nano-fibrous membrane. Anal. Bioanal. Chem. 2020, 412, 181–191. [Google Scholar] [CrossRef] [PubMed]
- Guć, M.; Reszke, E.; Cegłowski, M.; Schroeder, G. The Application of the Microwave Plasma Ionization Source in Ambient Mass Spectrometry. Plasma Chem. Plasma Process. 2019, 1–17. [Google Scholar] [CrossRef]
- Castiglioni, S.; Thomas, K.V.; Kasprzyk-Hordern, B.; Vandam, L.; Griffiths, P. Testing wastewater to detect illicit drugs: State of the art, potential and research needs. Sci. Total Environ. 2014, 487, 613–620. [Google Scholar] [CrossRef]
- Daughton, C.G. Emerging pollutants, and communicating the science of environmental chemistry and mass spectrometry: Pharmaceuticals in the environment. J. Am. Soc. Mass Spectrom. 2001, 12, 1067–1076. [Google Scholar] [CrossRef]
- Jolly, P.; Tamboli, V.; Harniman, R.L.; Estrela, P.; Allender, C.J.; Bowen, J.L. Aptamer-MIP hybrid receptor for highly sensitive electrochemical detection of prostate specific antigen. Biosens. Bioelectron. 2016, 75, 188–195. [Google Scholar] [CrossRef] [PubMed]
- Guć, M.; Reszke, E.; Cegłowski, M.; Schroeder, G. Construction of Plasma Ion Sources to be Applied in Analysis of Small Organic Compounds Using Mass Spectrometry. Plasma Chem. Plasma Process. 2020, 40, 235–260. [Google Scholar] [CrossRef]
- Chen, X.; Huang, J.; Zhang, S.; Mo, F.; Su, S.; Li, Y.; Fang, L.; Deng, J.; Huang, H.; Luo, Z.; et al. Electrochemical Biosensor for DNA Methylation Detection through Hybridization Chain-Amplified Reaction Coupled with a Tetrahedral DNA Nanostructure. ACS Appl. Mater. Interfaces 2019, 11, 3745–3752. [Google Scholar] [CrossRef] [PubMed]
- Kuhlmann, C.; Heide, M.; Engelhard, C. Fast screening and quantitative mass spectral imaging of thin-layer chromatography plates with flowing atmospheric-pressure afterglow high-resolution mass spectrometry. Anal. Bioanal. Chem. 2019, 411, 6213–6225. [Google Scholar] [CrossRef] [PubMed]
- Ayodeji, I.; Vazquez, T.; Song, L.; Donovan, J.; Evans-Nguyen, T.; Badal, S.P.; MacLean, G.M.; Shelley, J.T. Coupling Flowing Atmospheric Pressure Afterglow (FAPA) with Differential Mobility Spectrometry-Mass Spectrometry (DMS-MS) for rapid analysis of solid metal complexes. Int. J. Mass Spectrom. 2019, 438, 157–165. [Google Scholar] [CrossRef]
- Szymonik, A.; Lach, J.; Malińska, K. Fate and removal of pharmaceuticals and illegal drugs present in drinking water and wastewater. Ecol. Chem. Eng. S 2017, 24, 65–85. [Google Scholar] [CrossRef]
- Kosjek, T.; Heath, E.; Krbavčič, A. Determination of non-steroidal anti-inflammatory drug (NSAIDs) residues in water samples. Environ. Int. 2005, 31, 679–685. [Google Scholar] [CrossRef] [PubMed]
© 2020 by the authors. Licensee MDPI, Basel, Switzerland. This article is an open access article distributed under the terms and conditions of the Creative Commons Attribution (CC BY) license (http://creativecommons.org/licenses/by/4.0/).