Article

Development of a Simulation Model for HMT of a 50 kW Class Agricultural Tractor

1
Department of Biosystems Machinery Engineering, Chungnam National University, Daejeon 34134, Korea
2
Department of Smart Agriculture Systems, Chungnam National University, Daejeon 34134, Korea
3
Smart Agricultural Machinery R&D Group, Korea Institute of Industrial Technology (KITECH), Gimje 54325, Korea
*
Authors to whom correspondence should be addressed.
Appl. Sci. 2020, 10(12), 4064; https://doi.org/10.3390/app10124064
Submission received: 20 May 2020 / Revised: 9 June 2020 / Accepted: 10 June 2020 / Published: 12 June 2020

Abstract

:
This study was conducted to develop a simulation model of a 50 kW class hydro mechanical transmission (HMT) tractor and to verify the model by comparing the measured and simulated data, including the axle torque, rotational speed, and power transmission efficiency. The platform of the HMT was composed of the engine, hydrostatic unit (HSU), compound planetary gear, range shift, spiral bevel gear, and final reduction gear. The HMT had three gear stages and a maximum forward speed of 40 km/h. To evaluate the performance of the HTM, a test bench was installed based on the engine of the HMT platform, and a simulation model was developed using 3D simulation software. To compare the results of the simulation, a bench test using the platform was performed according to the gear stages. The similarities between the measured and simulated data were analyzed using the t-test. As a result, there were no significant differences for the axle torque, rotational speed, and power transmission efficiency. Finally, the power transmission efficiency between the measured and simulated results was compared and analyzed using linear regression analysis to validate the accuracy of the simulation model. The trend of the power transmission efficiency between the measured and simulated results appeared to be similar in all sections, and we obtained a simulation model with the accuracy of an R-squared value of more than 0.97. In conclusion, the measured and simulated results were similar to each other. Considering the results of this study, it will be useful to develop the HMT tractor and to improve the power transmission efficiency for the optimal design.

1. Introduction

The growing role of agricultural mechanization and the need to save fossil energy are important factors in the fuel consumption and emissions of agricultural machinery, such as tractors [1,2,3]. Power transmission is a critical component of a tractor and has evolved from traditional manual transmission (MT) into newer continuously variable transmission (CVT), and dual clutch transmission (DCT) types [4,5,6]. Among them, CVT is a variable solution not only to retain the characteristics of stepless speed regulation and maintain a high efficiency but also to improve fuel efficiency by adjusting the engine operating conditions [7,8,9]. CVTs can be classified into V belt types, hydrostatic transmissions (HST), and hydro mechanical transmissions (HMT) [10]. V belt-CVT is widely equipped in passenger cars. However, the power level is too low to meet the requirements of agricultural machinery, such as tractors [11,12].
The hydraulic pump and motor, which is representative of HST, has gained wide interest owing to the small size of its hydraulic components, low weight, and the important advantages it provides compared with other forms of stepless transmission. However, the low power transmission efficiency of less than 70% and high cost is a disadvantage of HST [13,14]. Accordingly, an HMT structure was proposed. In this transmission structure, a hydrostatic component is set parallel to a planetary gear to improve the overall efficiency and to reduce the difficulty of developing a high power hydrostatic transmission [15]. The control strategy of HMT is determined based on the HMT structure, and the arrangements for the planetary gear (PG) train and hydrostatic components [16].
The following studies were conducted with regard to the HMT structures. A study on the HMT structures was conducted using a new HMT system for the purpose of improving power transmission efficiency. The basic characteristics such as speed ratio, torque, and power transmission efficiency were analyzed and compared with an existing HMT system [17]. The results showed that the efficiency of the developed HMT was higher than the pure hydrostatic transmission and that the new transmission structure achieved the low-speed increased-torque effect, which is important for engineering and agricultural vehicles. In another study, an HMT, composed of an HSU and PG, was analyzed in regard to the characteristics of gear shift using lever analysis and of output speed according to change of HSU stroke [18]. The tractor speed increased as the HSU stroke change from −1 to 1 based on the gear stage. The power transmission efficiency of the HMT was the highest and changed parabolic shape when the HSU stroke was zero for each gear shift. In other studies, based on the extended network theory, a simulation program was developed to analyze an HMT system, consisting of two hydrostatic pump motors, several PGs, and a steering differential gear [19]. The results showed that the extended network analysis program could predict the power circulation, as well as the magnitude of torque and speed for each transmission element and could be used as a useful design tool for an overall power transmission system.
Various studies have been conducted analyzing the power transmission efficiency of HMT as well as the structural analysis for an HMT. Conventionally, power transmission efficiency has been analyzed as one of the representative performance indicators of the transmission [20]. A study on the design of an HMT was performed as an optimization problem in which the objective function was the average power transmission efficiency. Meanwhile, the design variables were the displacements of the two hydraulic machines and gear ratios of the ordinary and planetary gears [21]. The results show that the optimization problem was solved by a direct search algorithm based on the swarm method, which showed a good speed convergence and the ability to overcome local minima.
In another study, a simulation model of HMT for an agricultural tractor was developed and verified using a simulation model, and then the HSU stroke and power transmission efficiency were analyzed [22]. The results showed that the HMT continuously shifted the HSU stroke to perform gear selection and increased the driving speed of the tractor, and the power transmission efficiency of the HMT increased as the driving speed increased for each gear stage, and then decreased again after reaching the maximum point.
In previous research, the characteristics for structures and power transmission of the HMT were analyzed using a network model and simulation model. In addition, since the tractor has a heavy load during agricultural operations, unlike a general vehicle, it is necessary to design it in consideration of the workload for agricultural operations [23]. To do this, the performance evaluation through bench tests and field tests under various conditions is necessary. However, the performance evaluation of the transmission using the bench test and the field test is costly and time-consuming [24]. Recently, the performance evaluation of the transmission using the simulation has been actively used [12]. The performance verification using simulation has the advantage of being simple and saving time. In the field of agricultural machinery, the simulation model has been used not only to evaluate the tractor performance but also to improve and optimize the transmission for the tractor.
A study on the design of the HMT was performed to present multi-range HMT and to evaluate its performance using a bench test and simulation model [25]. A simulation model was built in the AMESim (version 16, Simens AG, Munich, Germany), and a corresponding test bench was performed to verify the characteristics. The proposed HMT presented a mean efficiency of about 83% in a wide speed range. In another study, the development of a simulation model for tractors was performed to evaluate the fuel efficiency using SimulationX (version 3.6, ESI ITI GmbH, Dresden, Germany) and the simulation results were compared and analyzed with the measured data [26]. The fuel consumption and efficiency between the field test and simulation were 14.04 and 14.19 km/h and 0.30 and 0.33 kg/kWh, respectively, during the rotary tillage, As a result of the t-test, the researchers found that there was no significant difference of fuel consumption and efficiency between the field test and simulation. In another study, a simulation model of the tractor was developed to improve the transmission error and tooth load distribution using KISSsoft (version 2017, KISSsoft AG, Zurich, Switzerland), and the tip and root relief were modified with micro-geometry in the profile direction, and the crowning was modified [27]. As a result of modifying the tip and relief in the profile direction, the transmission error was reduced up to 40.7%, and the tooth load was more evenly distributed than before and decreased the stress on the tooth surface in the case of modifying the crowning in the lead direction. However, the simulation test may be inaccurate in comparison with the performance evaluation using a bench test. Accordingly, it is important to verify the simulation model in comparison with the results of the bench test [28]. Therefore, in this study, the prototype of HMT and the simulation model were developed, and the bench test and simulation were performed. To verify the simulation model, the axle torque, rotational speed, and power transmission efficiency between the measured and simulated according to the gear stages were compared and analyzed.
This study is the basic research on the development of an HMT tractor, and the simulation model was developed and verified through a prototype of the HMT platform. The objectives of this paper were (1) to develop a prototype of an HMT tractor; (2) to develop a simulation model that reflected the specifications of the parts used in the prototype of the HMT platform; (3) to collect load data through the bench test for the axle torque, rotational speed, and power transmission efficiency; (4) to verify the simulation model through a comparison of the measured and simulation results according to gear stages. The final objective was to develop a reliable simulation model that can be used to develop and supplement HMT tractors.

2. Materials and Methods

2.1. Powertrain Configurations

Figure 1 shows the power flow of the HMT tractor for a 50 kW class agricultural tractor. HST is mainly used for small tractors of less than 30 kW in Korea [29]. In this study, for the complement of low efficiency, the HSU, and compound planetary gear were used together, and a range shift of three gear stages was added to reduce the capacity of the HSU. The HMT tractor consisted of the engine, HSU, compound planetary gear, range shift, spiral bevel gear, final reduction gear, and axle. The engine power was divided into two paths: the mechanical and hydraulic paths. In this study, the developed HMT is input coupled transmission (IPCT), which integrates the power at the compound planetary gear from the mechanical and hydraulic path. After that, the power is transmitted through a range shift, spiral bevel gear, final reduction gear, and axle. This HMT had three stages: the first gear stage (0–10 km/h), second gear stage (10–20 km/h), and third gear stage (20–40 km/h). It had a maximum forward speed of 40 km/h. The specifications of the key component for the HMT tractor are shown Table 1. The engine (TD2.9 L4, Deutz AG, Cologne, Germany) was selected at 55 kW of rated power, and the HSU (HT-42, Kanzaki Kokyukoki Mfg. Co., Ltd., Amagasaki, Japan) was selected with 42 cc/min of displacement and was composed of a variable pump and fixed motor.

2.2. Hydrostatic Circuit

The layout of the HSU is shown in Figure 2. In this study, a fixed hydraulic motor was selected in the hydrostatic circuit for the lower cost and simplification of the control process. The circuit was mainly composed of two basic hydraulic components, a variable displacement pump, and a fix displacement motor. The gear ratio of the engine and pump is shown in Equation (1), considering the volumetric efficiency, and the rotational speed of the output shaft is calculated in Equation (2). In this transmission, the pump input shaft is driven by the engine through a pair of gears. The following layout explains the concept form of the circuit. The complete transmission circuit is more complex, including a flushing valve for cooling, a reservoir for leakage oil, and a charge circuit for the whole loop. In this hydrostatic circuit, when the engine output speed is constant, the output shaft speed of the motor is determined by the coefficient of the variable displacement pump. The motor output speed changes from n max to n max as the coefficient varies from −1 to 1.
i p = n e n p
where i p is the gear ratio of the engine and pump, n p is the rotational speed of the pump (r/min), and n e is the rated rotational speed of the engine (r/min).
n o u t = n m i m = n e V p η v , p η v , m ε i p i m V m
where n o u t is the rotational speed of the output shaft (r/min), i m the is the gear ratio of the motor and output shaft, n m is the rotational speed of the motor (r/min), V p is the displacement of the pump (cc/rev), ε is the coefficient of the variable pump with a range of −1 to 1, V m is the displacement of the motor (cc/rev), η v , p is the volumetric efficiency of the pump (%), and η v , m is the volumetric efficiency of the motor (%).

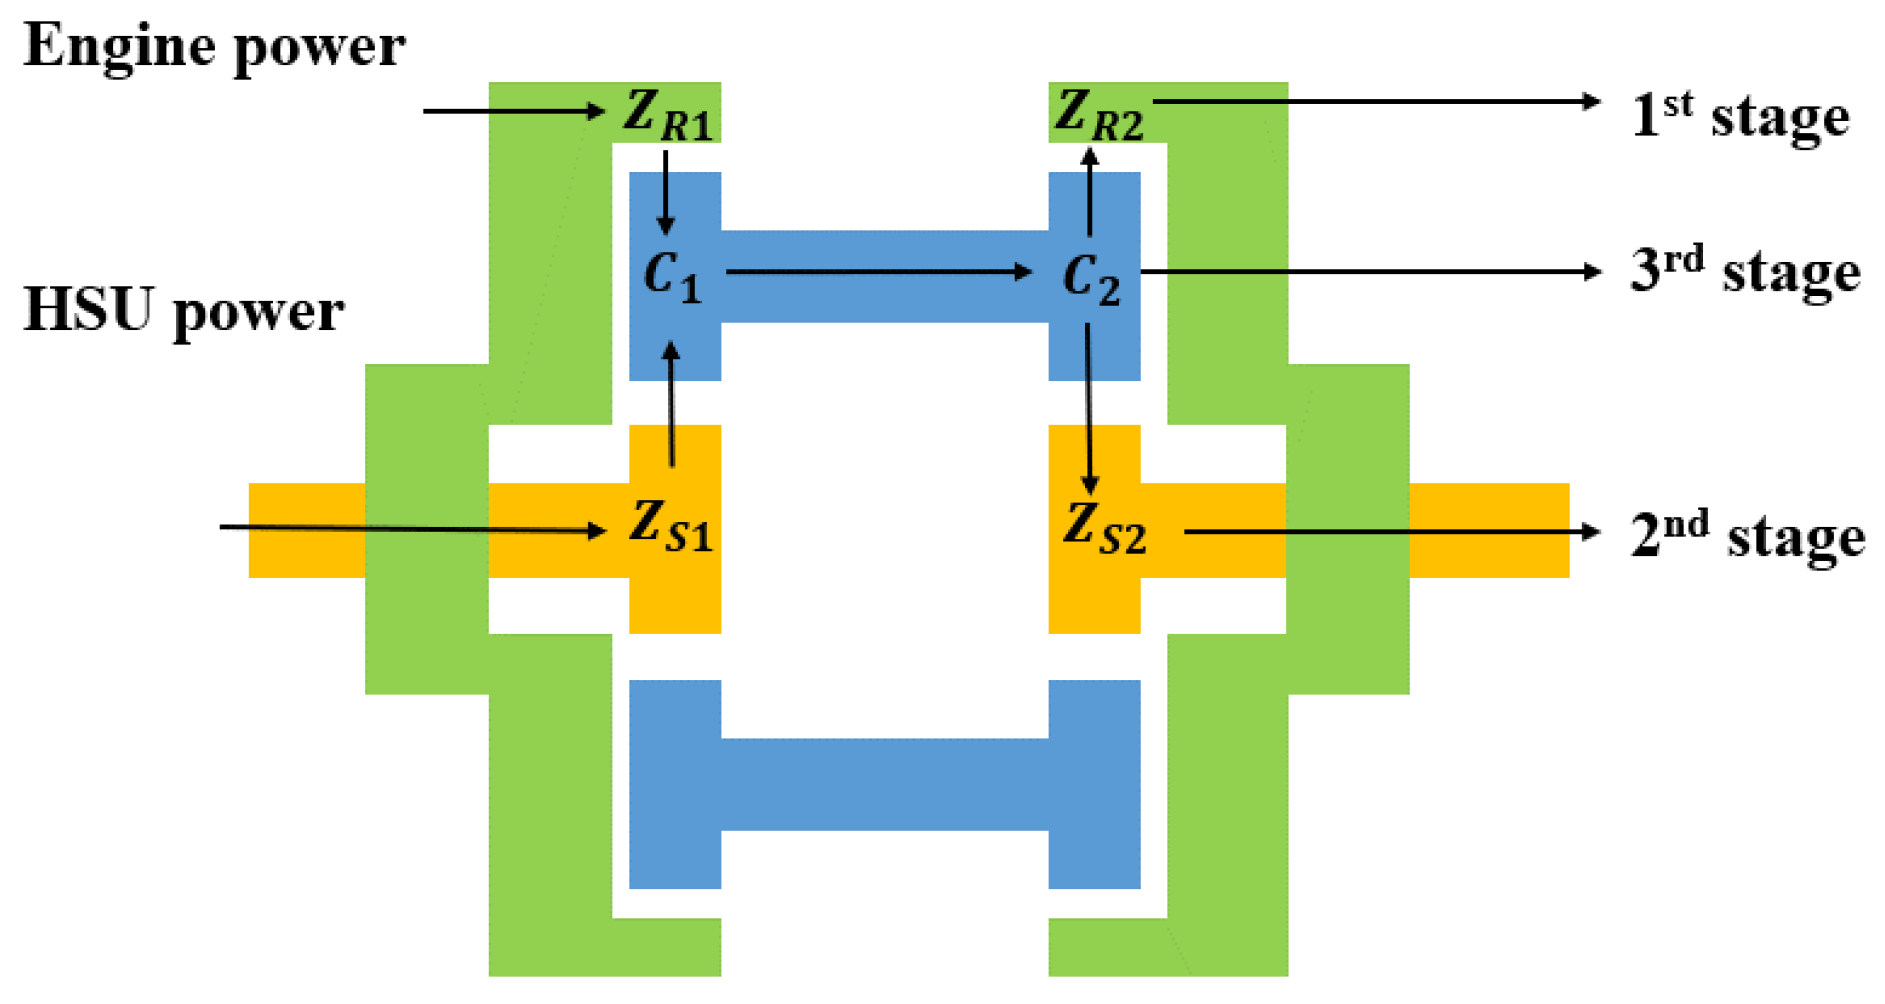
2.3. Compound Planetary Gear

Figure 3 shows the schematic diagram for the compound planetary gear of the HMT. The compound planetary gear is the most important part of making a continuous speed diagram in the HMT [30]. To do that, the rotational speeds before and after shifting should be set equal to each other, and it is important to make the speed diagram compact [31]. In this study, the compound planetary gear consisted of two planetary gear sets, which were each composed of a sun gear, ring gear, and planet gear considering the compact structure and the efficient power transmission of a high gear ratio [32]. The engine power was transmitted to the ring gear of the first planetary gear set, and the HSU power was transmitted to the sun gear of the first planetary gear set. After that, the power is transmitted to the ring gear, sun gear, and carrier of the second planetary gear set according to each gear stage. The output of the first planetary gear set is input to the carrier of the second planetary gear set. Considering this, the reduction ratio of the compound planetary gear can be calculated using the method for a general planetary gear ratio. The rotational speed of the output shaft of the compound planetary gear for each gear stage is shown in Equations (3)–(5) by the number of teeth and rotational speed of the two planetary gear sets.
ω 1 = ( Z R 2 + Z R 1 ) Z S 1 ω S 1 + ( Z R 2 Z S 1 ) Z R 1 ω R 1 Z R 2 ( Z S 1 + Z R 1 )
ω 2 = ( Z S 2 Z R 1 ) Z S 1 ω S 1 + ( Z S 2 + Z S 1 ) Z R 1 ω R 1 Z S 2 ( Z S 1 + Z R 1 )
ω 3 = Z S 1 ω S 1 + Z R 1 ω R 1 Z S 2 ( Z S 1 + Z R 1 )
where ω n is the rotational speed for the n t h output shaft of the compound planetary gear to be connected to the range shift (r/min), ω Sn the rotational speed for the sun gear of the n t h planetary gear set (r/min), ω Rn is the rotational speed for the ring gear of the n t h planetary gear set (r/min), Z Sn is the number of the sun gear of the n t h planetary gear set, and Z Rn is the number of the ring gear of the n t h planetary gear set.

2.4. Simulation Model

The simulation model of HMT was developed using Romax DESIGNER (R18, Romax technology, Nottingham, United Kingdom). It is composed of the engine, HSU, compound planetary gear, range shift, spiral bevel gear, and final reduction gear, as shown in Figure 4. Each single component reflects the actual specifications of the parts. Also, the power flow of the simulation model for each stage was set as the prototype of the HMT. The HSU is connected to the sun gear of the first planetary gear set, and the ring gear of the first planetary gear set is directly connected to the engine. By inputting the engine power, the output power of the axle is determined. The simulation was conducted in the same way as the performance evaluation using a bench test. The internal temperature of the transmission was set to 50 °C, and the simulation was performed for 400 s.

2.5. Performance Evaluation

According to the schematic of the HMT, we designed and manufactured a prototype machine for experimental verification. A test bench was designed to simulate a working HMT. Figure 5 shows the diagram of the HMT test bench. The HMT test bench is composed of the input motor, two torque and speed sensors, the dynamometer, controller, and PC. Two AC motors were placed to afford the driving force and load to the HMT, respectively. By controlling the input driving torque and load torque, we can obtain the performance of the HMT. Two torque and speed sensors were connected to the input and output shaft of the HMT and motor, respectively, to obtain the torque and rotational speed. The specifications of the test bench are listed in Table 2. The test bench is shown in Figure 6. There were two jigs for fixing the test bench in the input and output shaft. The input shaft jig was designed based on the rated torque and rotational speed of the engine at 220 Nm and 2200 rpm, and the output shaft jig was designed based on the gear ratio of HMT. The gear ratios, according to the gear stages, were 57.6:1, 28.8, and 14.4. The process of the bench test was as follows [33]: (1) to fix the prototype of HMT horizontally in the test bench, (2) to check the oil level of the lubricant, (3) to calibrate the torque and speed sensor, (4) to rotate the prototype HMT manually, (5) to fix the differential device, (6) to start from the highest gear stage while maintaining the temperature of the lubricant at 50 °C, and (7) to record the data for the power transmission efficiency based on the axle torque and rotational speed according to the gear stage.

2.6. Analysis Method

The results for the HMT, including the axle torque, rotational speed, and power transmission efficiency, were compared and analyzed using a bench test and simulation. The power transmission efficiency of the HMT was calculated with Equation (6) using the torque and rotational speed of the input and output shaft [34].
η = T o u t × n o u t T i n × n i n × 100
where η is the power transmission efficiency (%), T i n is the input torque (Nm), n i n is the input rotational speed (r/min), T o u t is the output torque (Nm), and n o u t is the output rotational speed (r/min).
In order to validate the simulation model for the HMT, the t-test and linear regression analysis were performed through the statistical software IBM SPSS Statistics (SPSS 24, IBM Corp., Armonk, USA), and the correlation of the data between measured and simulated was compared and analyzed. The t-test was conducted for the axle torque, rotational speed, and power transmission between the measured and simulated results. Finally, the error and accuracy of the simulation model for the power transmission efficiency of HMT were analyzed through the coefficient of determination, root-mean-square error (RMSE), and relative deviation (RD), derived by the linear regression, to see if the power transmission efficiency under each gear stage showed high accuracy in comparison with the measured values. Generally, we judged that a model with an R-squared of more than 0.9 was reliable [35]. The R-squared, RMSE, and RD through regression analysis were calculated through Equations (7)–(9) [36,37,38].
R 2 = i ( y ^ i y ¯ ) 2 i ( y i y ¯ ) 2 = 1 i ( y i y ^ i ) 2 i ( y i y ¯ ) 2
R M S E = 1 N i ( y i y ^ i ) 2  
where R 2 is the coefficient of determination of the regression equation, R M S E is the root-mean-square error, y is the measured value, y ^ is the simulated value, and N is the number of pairs of values.
R D = R M S E η M e a n × 100
where RD is the relative deviation (%), and η M e a n is the average of power transmission efficiency.

3. Results

3.1. Load Analysis

3.1.1. Axle Torque

The axles of the tractors had the same size wheels and the same weight distribution ratio, so the axle torque of the HMT was expressed as the sum of the left and right axles [39,40]. Figure 7 provides a comparison of the measured and simulated results of the axle torque according to the gear stages. The axle torque rapidly decreased in the first gear stage, and gradually decreased as the gear stage was increased. The ranges of the measured torques were 10,030.99–20,054.67, 4801.75–10,031.64, and 2376.00–4418.15 Nm, respectively to the gear stages, and the range of simulated torque were 9938.64–20,019.61, 4544.49–9656.74, and 2271.54–4273.19 Nm, respectively, to the gear stages. The simulation results showed similar trends in all gear stages; however, the largest difference of axle torque between the measured and simulated results was 2521.67 Nm in the first gear stage. The delay for the control of the HSU speed occurred in the prototype of the HMT [24].
The average of the simulated axle torque was smaller than the average of the measured value in all gear stages. This is because the bench test was performed in harsher conditions than the simulation analysis [41]. In the performance evaluation for the power transmission efficiency, the transmitted power was affected by the internal temperature of the transmission [14,33]. Keeping the internal temperature of the transmission constant was difficult during the bench test, while the temperature was constant in the simulation. Table 3 lists the axle torque differences between the measured and simulated results based on the gear stages. The maximum differences of axle torque between the measured and simulated results for each gear stages were 2521.67, 375.64, and 156.86 Nm, respectively. As a result, the p-values for each of the gear stages were more than 0.05 under all gear stages, and, thus, we considered that there was no significant difference of the axle torque between the measured and simulated results. Therefore, the simulation model was available to evaluate the axle torque of the HMT tractor.

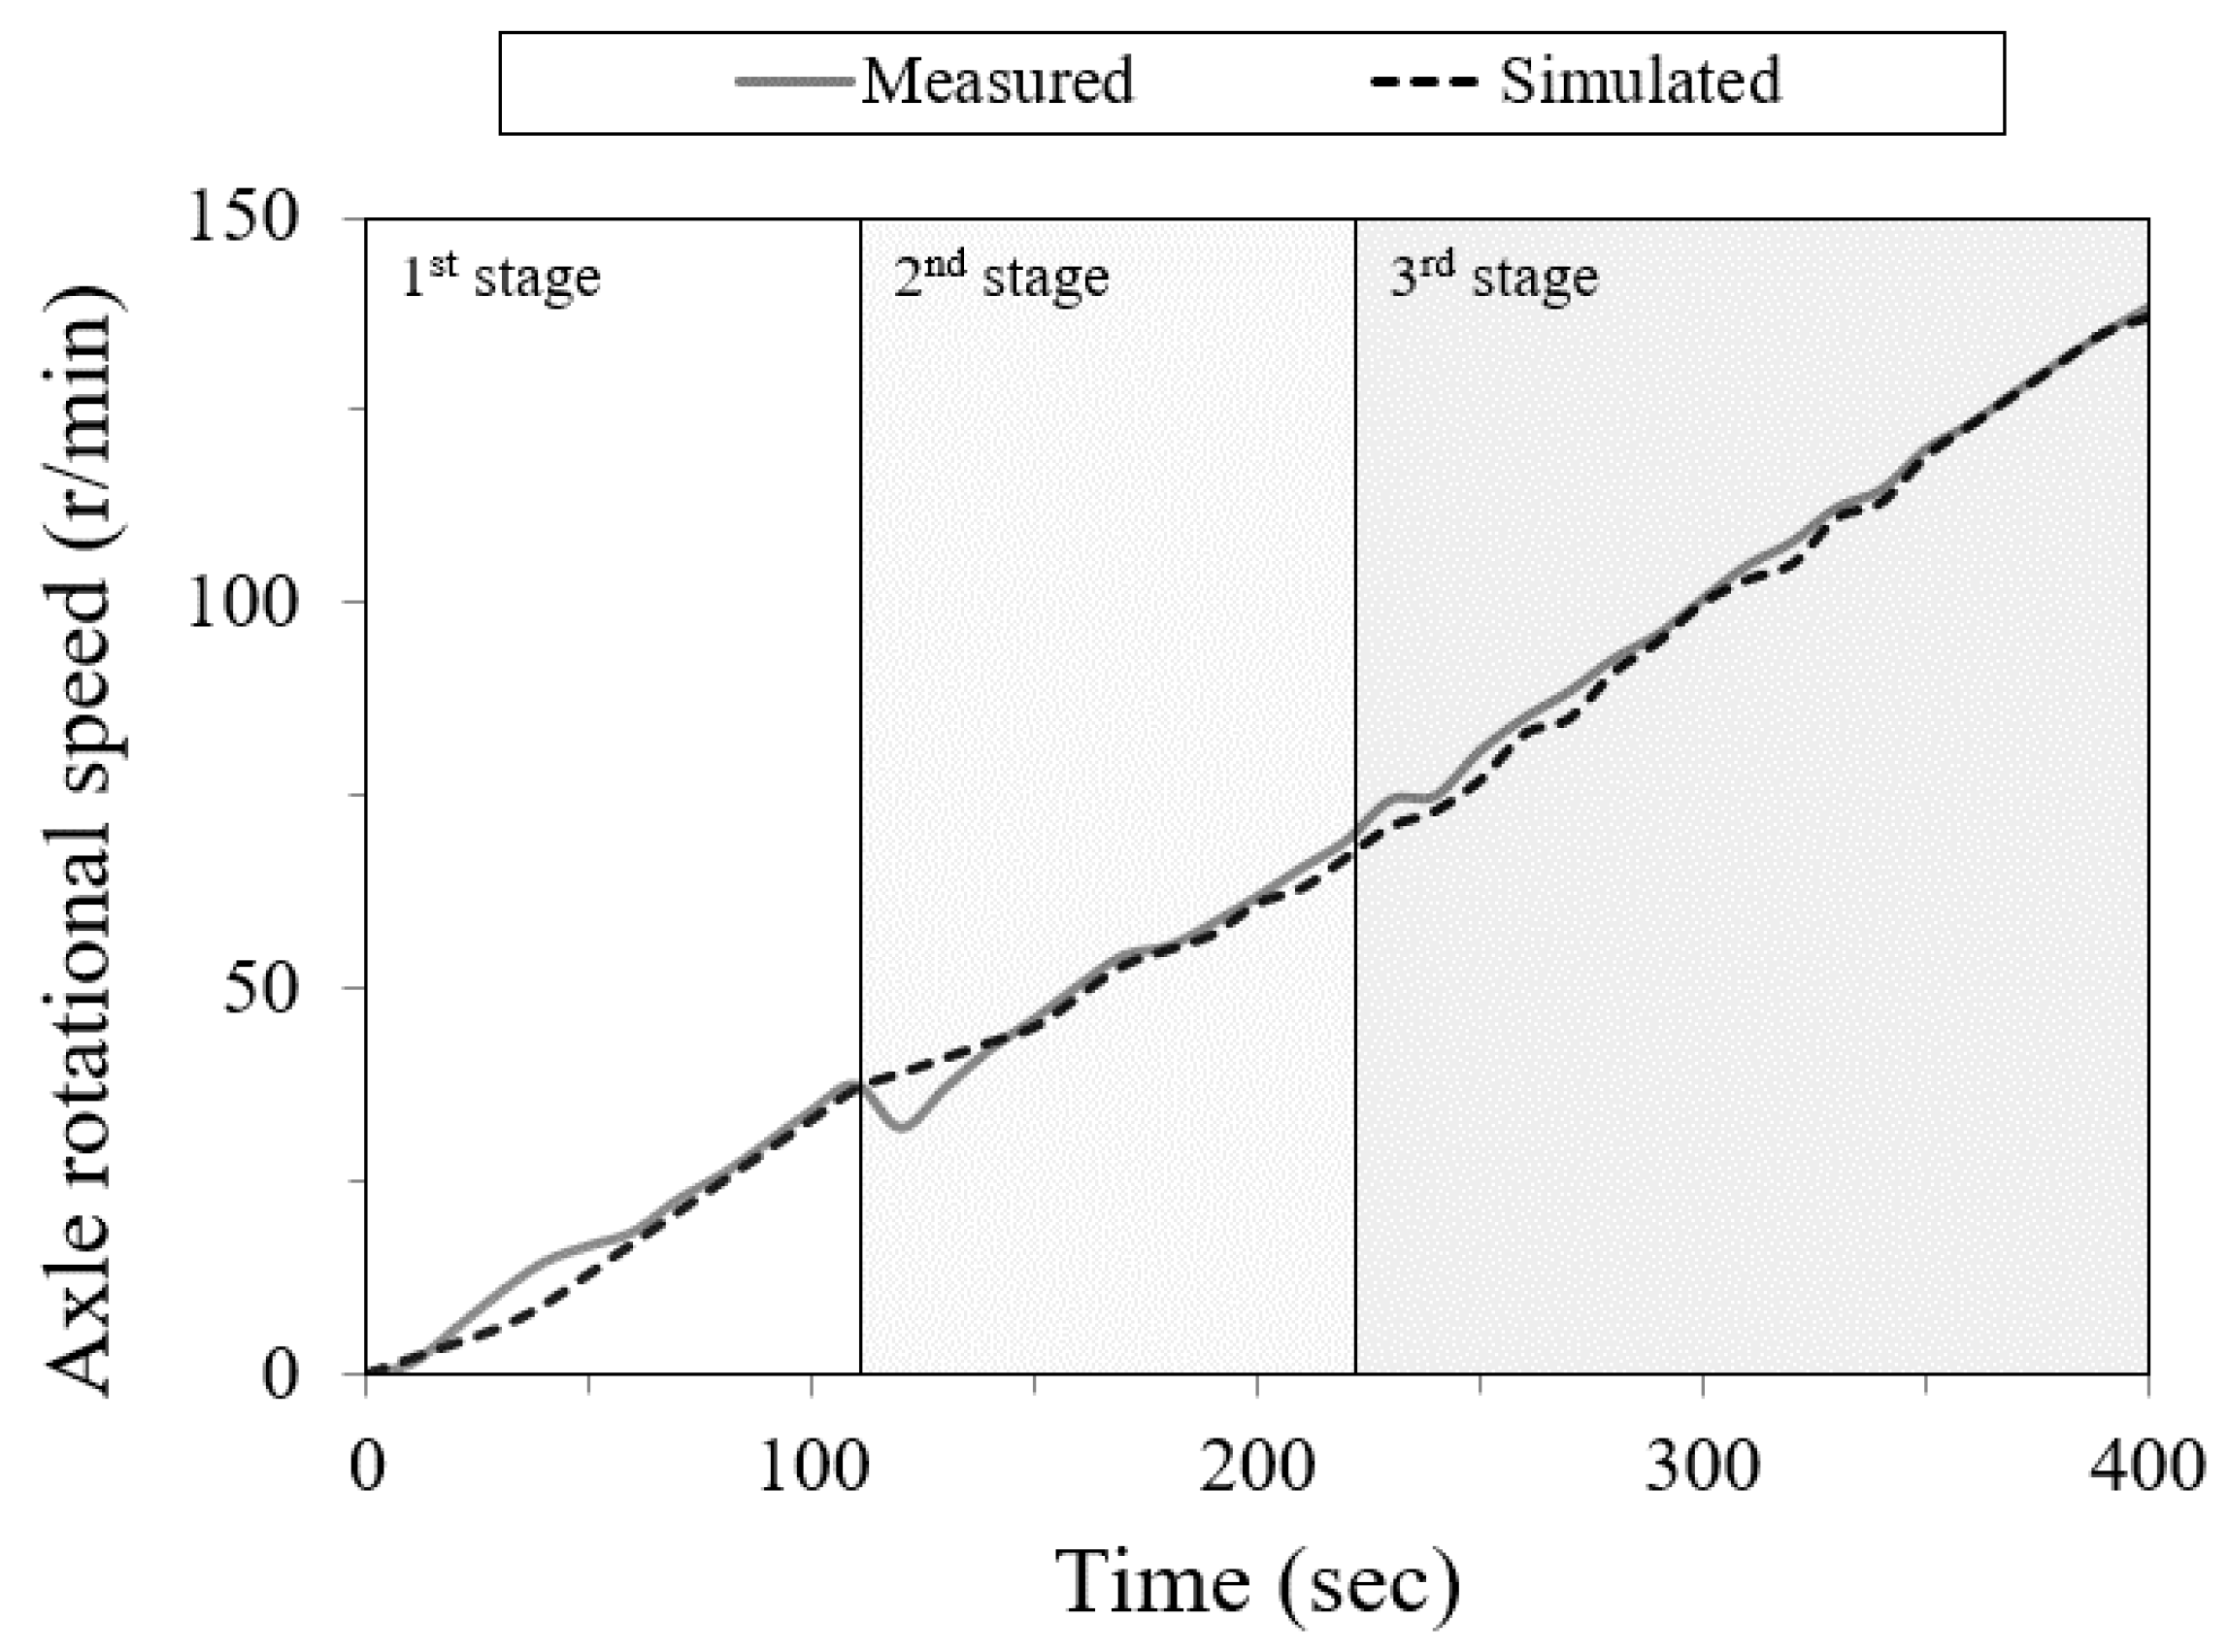
3.1.2. Axle Rotational Speed

The rotational speed for the left and right axles appeared to be very similar because this test was not a driving or agricultural operation test. Therefore, the axle rotational speed of the HMT was expressed as the average of the left and right axles [42]. Figure 8 provides a comparison of the axle rotational speed between the measured and simulated results based on the gear stage. We found that both the measured and simulated results increased constantly, and the measured value decreased slightly in shifting sections. The range of the measured axle rotational speed according to the gear stages were 0–37.57, 31.96–74.55, and 75.05–138.46 rpm, respectively, and the range of the simulated axle rotational speeds for each of the gear stages were 0–37.15, 38.04–71.00, and 73.61–137.45 rpm, respectively. The simulation results showed similar trends with the measured values in all gear stages.
Table 4 shows the comparison of the axle rotational speed between the measured and simulated results based on the gear stages. The maximum differences of the axle rotational speed torque between the measured and simulated results for each of the gear stages were 5.53, 7.04, and 3.94 rpm. The simulation results were similar to the bench test results. As a result, the p-values for each of the gear stages were more than 0.05 in all gear stages, indicating no significant differences between the measured and simulated results of axle rotational speed. Therefore, the simulation model was available to evaluate the axle rotational speed of the HMT tractor during operation.

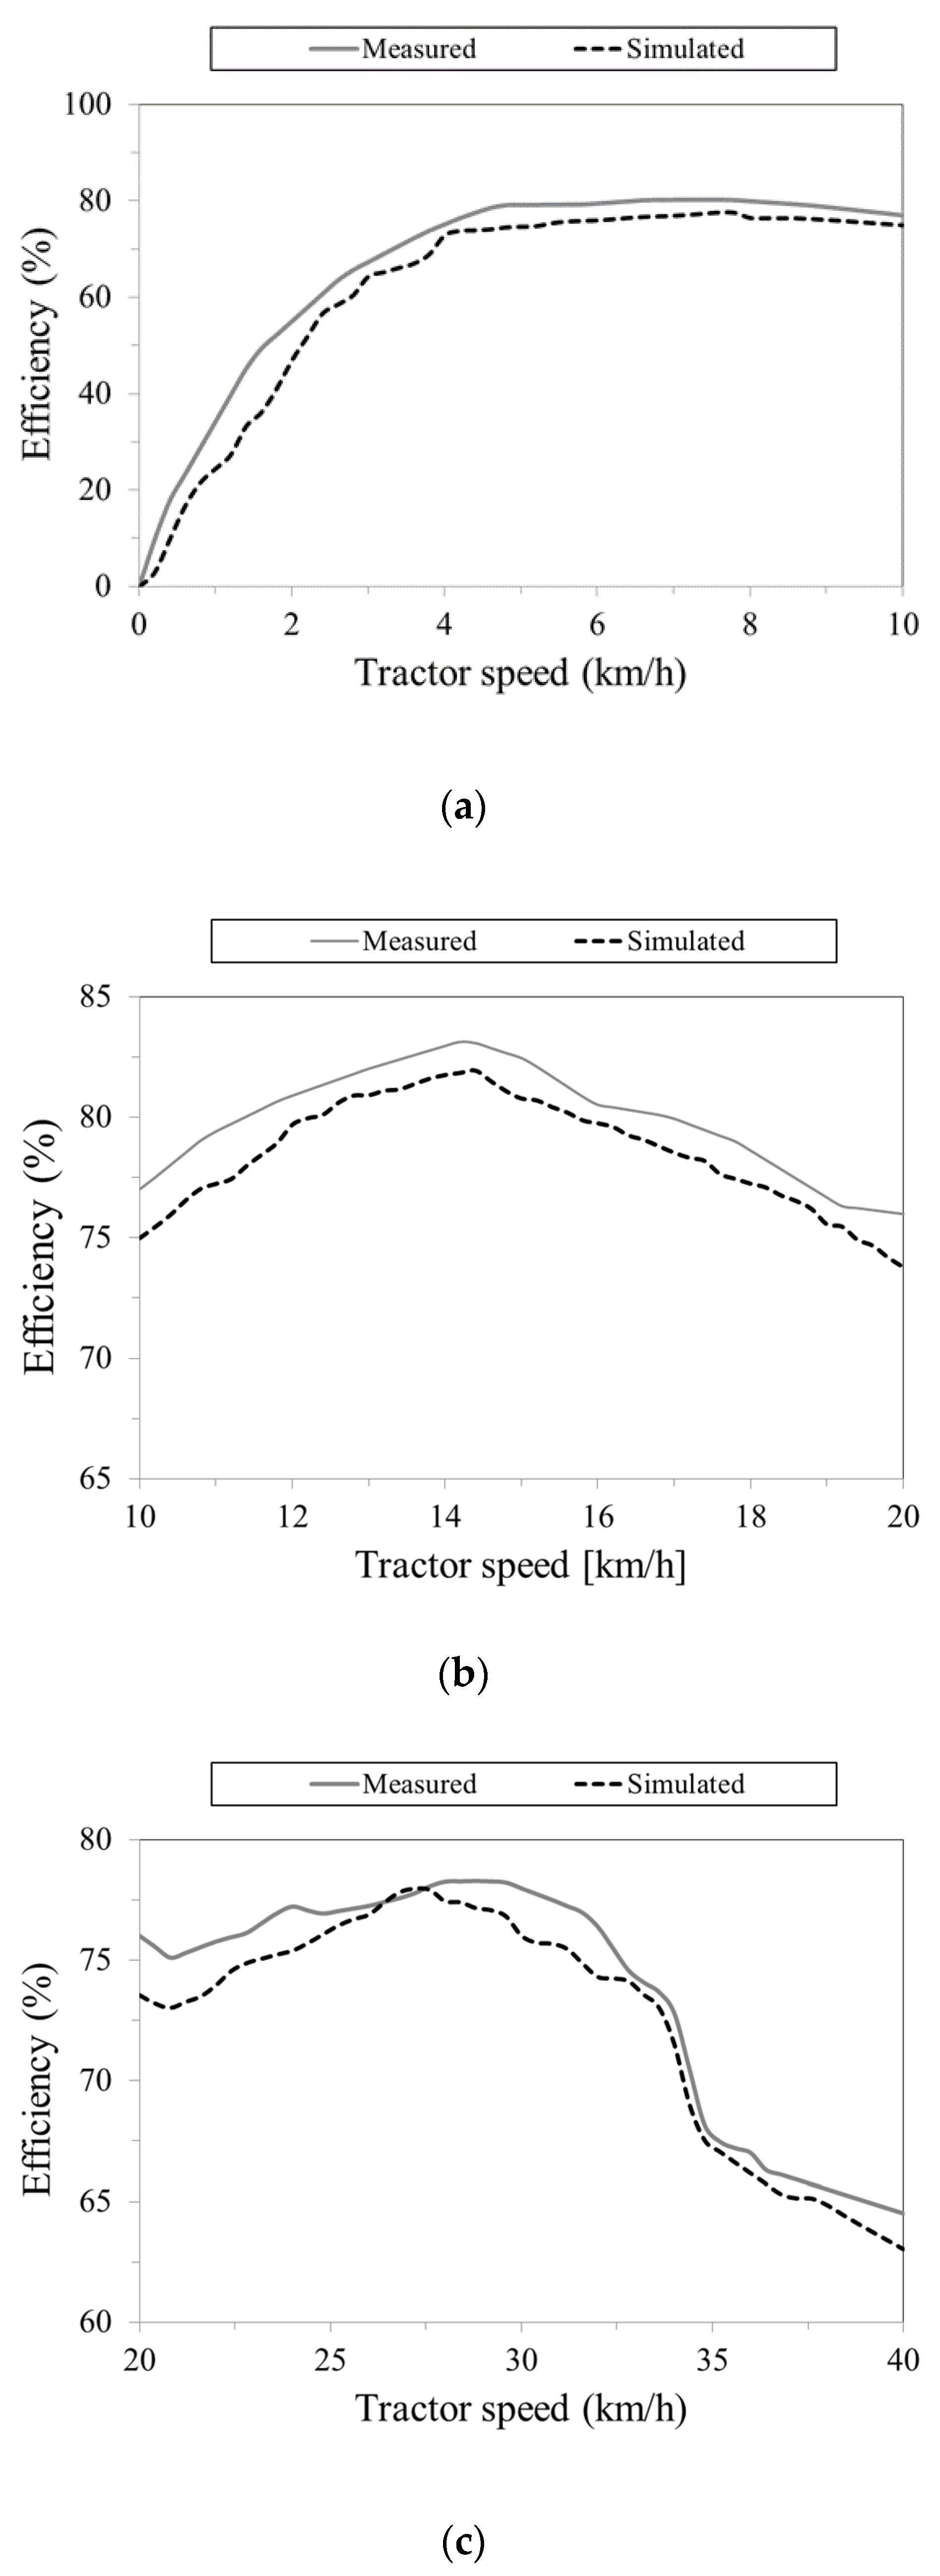
3.2. Power Transmission Efficiency

Figure 9 provides the power transmission efficiency for the prototype of the HMT based on the gear stage. In the bench test, the ranges of the power transmission efficiency for each of the gear stages were 0–80.26, 76.00–83.13, and 64.50–78.28%, respectively. As a result of the simulation, the ranges of power transmission efficiency for each of the gear stages were 0–77.64, 73.78–81.93, and 63.02–77.99%, respectively. The power transmission efficiency of the first gear stage appeared to increase, and the power transmission efficiency of the second and third gear stages appeared to decrease after increasing to the maximum point. The result is because the HMT had the highest power transmission efficiency when the swash plate angle of the hydraulic pump was 0° [15]. The overall power transmission efficiency of HMT showed the same trend with the proposed results in previous research [25]. The simulation results showed similar trends in all gear stages.
Table 5 lists the comparison of power transmission efficiency between the measured and simulated results based on gear stages. The averages of the measured power transmission efficiency for each gear stages were 66.76, 79.96, and 78.56% respectively, and the averages of simulated power transmission efficiency were 62.14, 78.56, and 72.44%, respectively. In general, an HMT has low power transmission efficiency at the low gear stage because it mainly uses HSU power to generate high torque [43]. In this study, the average power transmission efficiency was the lowest in the 1st gear stage, and the highest in the 2nd gear stage. The maximum differences of power transmission efficiency between the measured and simulated results for each of the gear stages were 13.24, 2.29, and 2.45%, respectively. The simulation results were similar to the bench test results. As a result of the t-test, the p-values for each of the gear stages were more than 0.05 under all gear stages, and there was no significant difference for the power transmission efficiency between the measured values and simulation results. Therefore, the simulation model was available to evaluate the power transmission efficiency of the HMT tractor during operation.
Figure 10 provides the results of a linear regression analysis for the power transmission efficiency between the measured and simulated values according to gear stages. In the first gear stage, the results of linear regression showed an R-squared value of 0.988, an RMSE of 5.461, and an RD of 8.18, as shown in Figure 10a. The results of linear regression at the second gear stage showed an R-squared of 0.971, an RMSE of 1.473, and an RD of 1.84, as shown in Figure 10b. On the other hand, the results of linear regression at the third gear stage showed an R-squared of 0.980, an RMSE of 1.345, and an RD of 1.84, as shown in Figure 10c. The RMSE and RD of the first gear stage were the highest. The most engine power was generally transmitted through the HSU in the first gear stage, which required more torque [16]. However, the swash angle control algorithm of the HSU model was not completely reflected in the simulation model of the HMT. The RMSE and RD of the second and third gear stage appeared to be less than 2%. The trend of the power transmission efficiency between the measured and simulated results appeared to be similar in all sections, and the R-squared was more than 0.97 in all gear stages.

4. Discussion

The axle torque, rotational speed, and power transmission efficiency between the measured and simulated results showed similar trends in all gear stages except when the gear shifting occurred. However, the measured values tended to be higher than the simulation results in most sections. The bench test was conducted in harsher conditions. As a result of the t-test, there were no significant differences for the axle torque, rotational speed, and power transmission efficiency between the measured and simulated results. Also, as a result of the linear regression analysis, the R-squared for power transmission efficiency between the measured and simulated results was more than 0.97 in all gear stages. Through this study, a simulation model with the accuracy of an R-squared value of more than 0.97 was developed.
The previous researches have relied on empirical methods for HMT design and evaluation, which results in significant losses in terms of time and cost [44]. We solved these existing problems using simulation software, developed the simulation model of applicable for a design and evaluation of the HMT, and finally validated the simulation model. The power transmission efficiency of the tractor is influenced by many variables, such as a temperature of the transmission and type of oil [33]. However, since it is difficult to consider all of these conditions, repeated experiments are necessary to improve the power transmission efficiency of the HMT. We can perform simulation analysis repeatedly by setting various conditions and change the specifications of the HMT model. So, it is judged to be useful in the optimization and performance test of the HMT tractor.
In this study, the concept of the HMT tractor was presented, and the prototype of the HMT was developed. Based on the prototype, a simulation model was developed and verified using the bench test for important indicators of transmission, such as the axle torque, rotational speed, and power transmission efficiency. However, the developed simulation model of HMT is limited to a 50 kW class agricultural tractor. So, it is necessary to review the configuration of the HMT in order to apply it to the tractor of the large horsepower. For mass production of the tractor, qualification test for various performances metrics, such as durability, shift time, and shift shock are required [14,25]. Therefore, in order to improve the verification of the simulation model of the HMT, we should perform additional empirical tests for other performance indicators of the transmission. In the future study, the reliability of the simulation model will be improved through the analysis of the endurance life of the HMT using agricultural workload data.

5. Conclusions

In this study, we developed and evaluated the performance of a prototype of an HMT for a 50 kW class agricultural tractor. To evaluate the load data, such as the axle torque, rotational speed, and power transmission efficiency, which are important indicators of transmission for agricultural tractors, we carried out a bench test for the prototype of the HMT. The simulation model for the HMT was developed and analyzed using Romax DESIGNER. To verify the simulation model, a t-test was carried out between the measured and simulated results based on the gear stages. Finally, the accuracy of the simulation model for the HMT was evaluated by comparing the power transmission efficiency between the measured and simulated results according to the gear stages. The main results of this study are as follows:
(1)
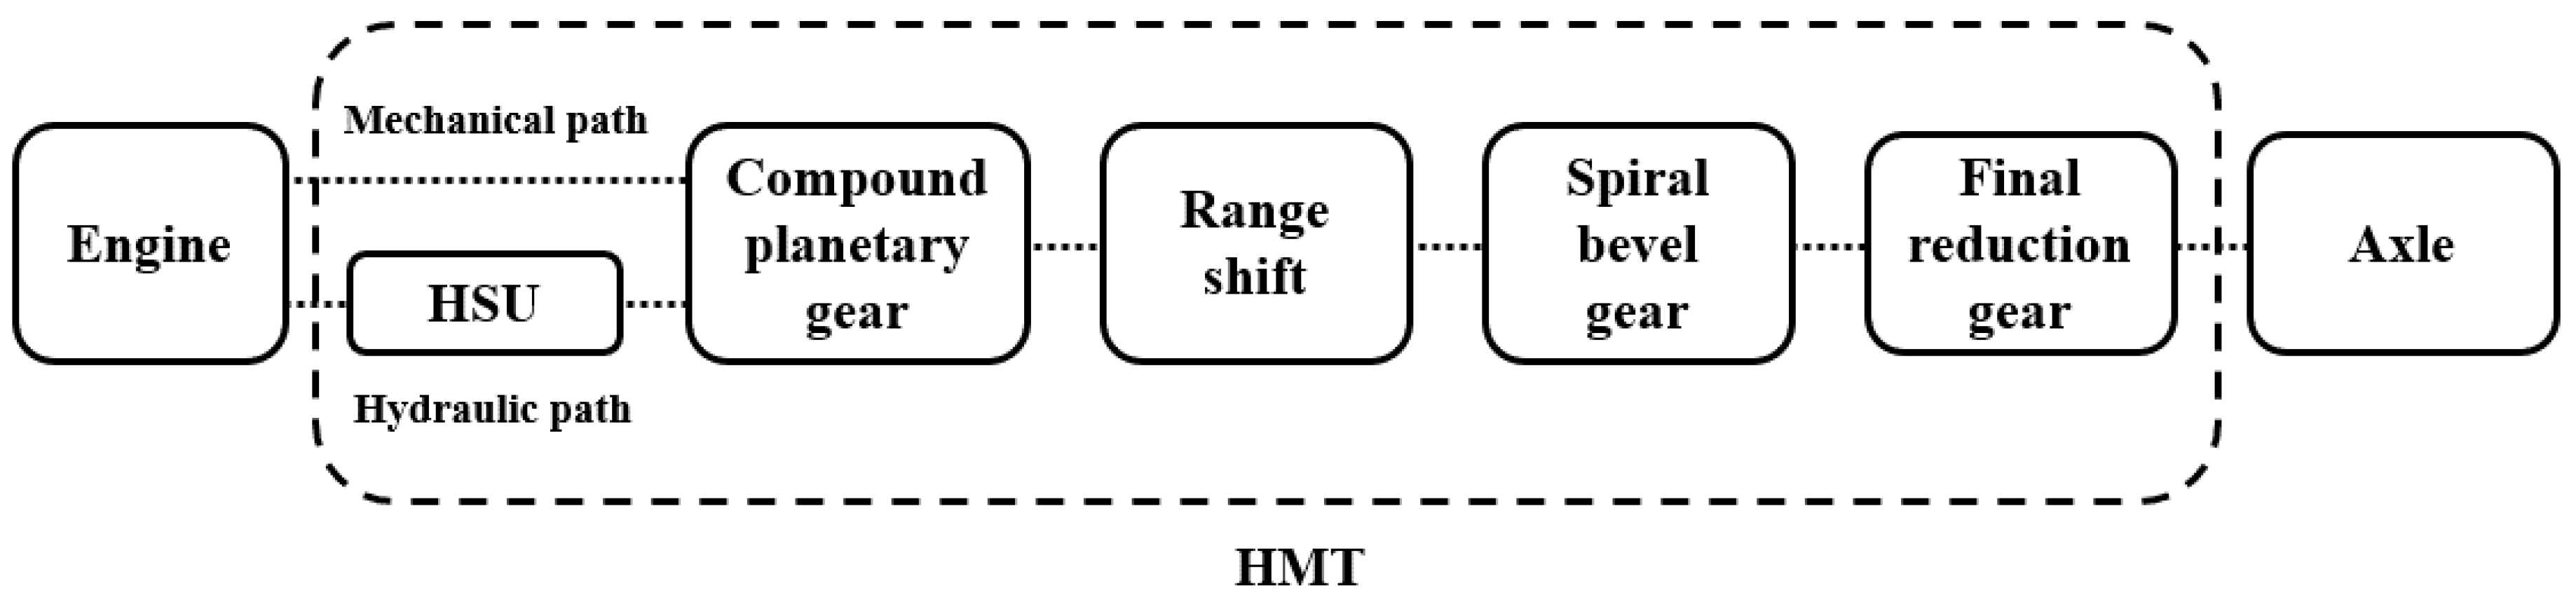
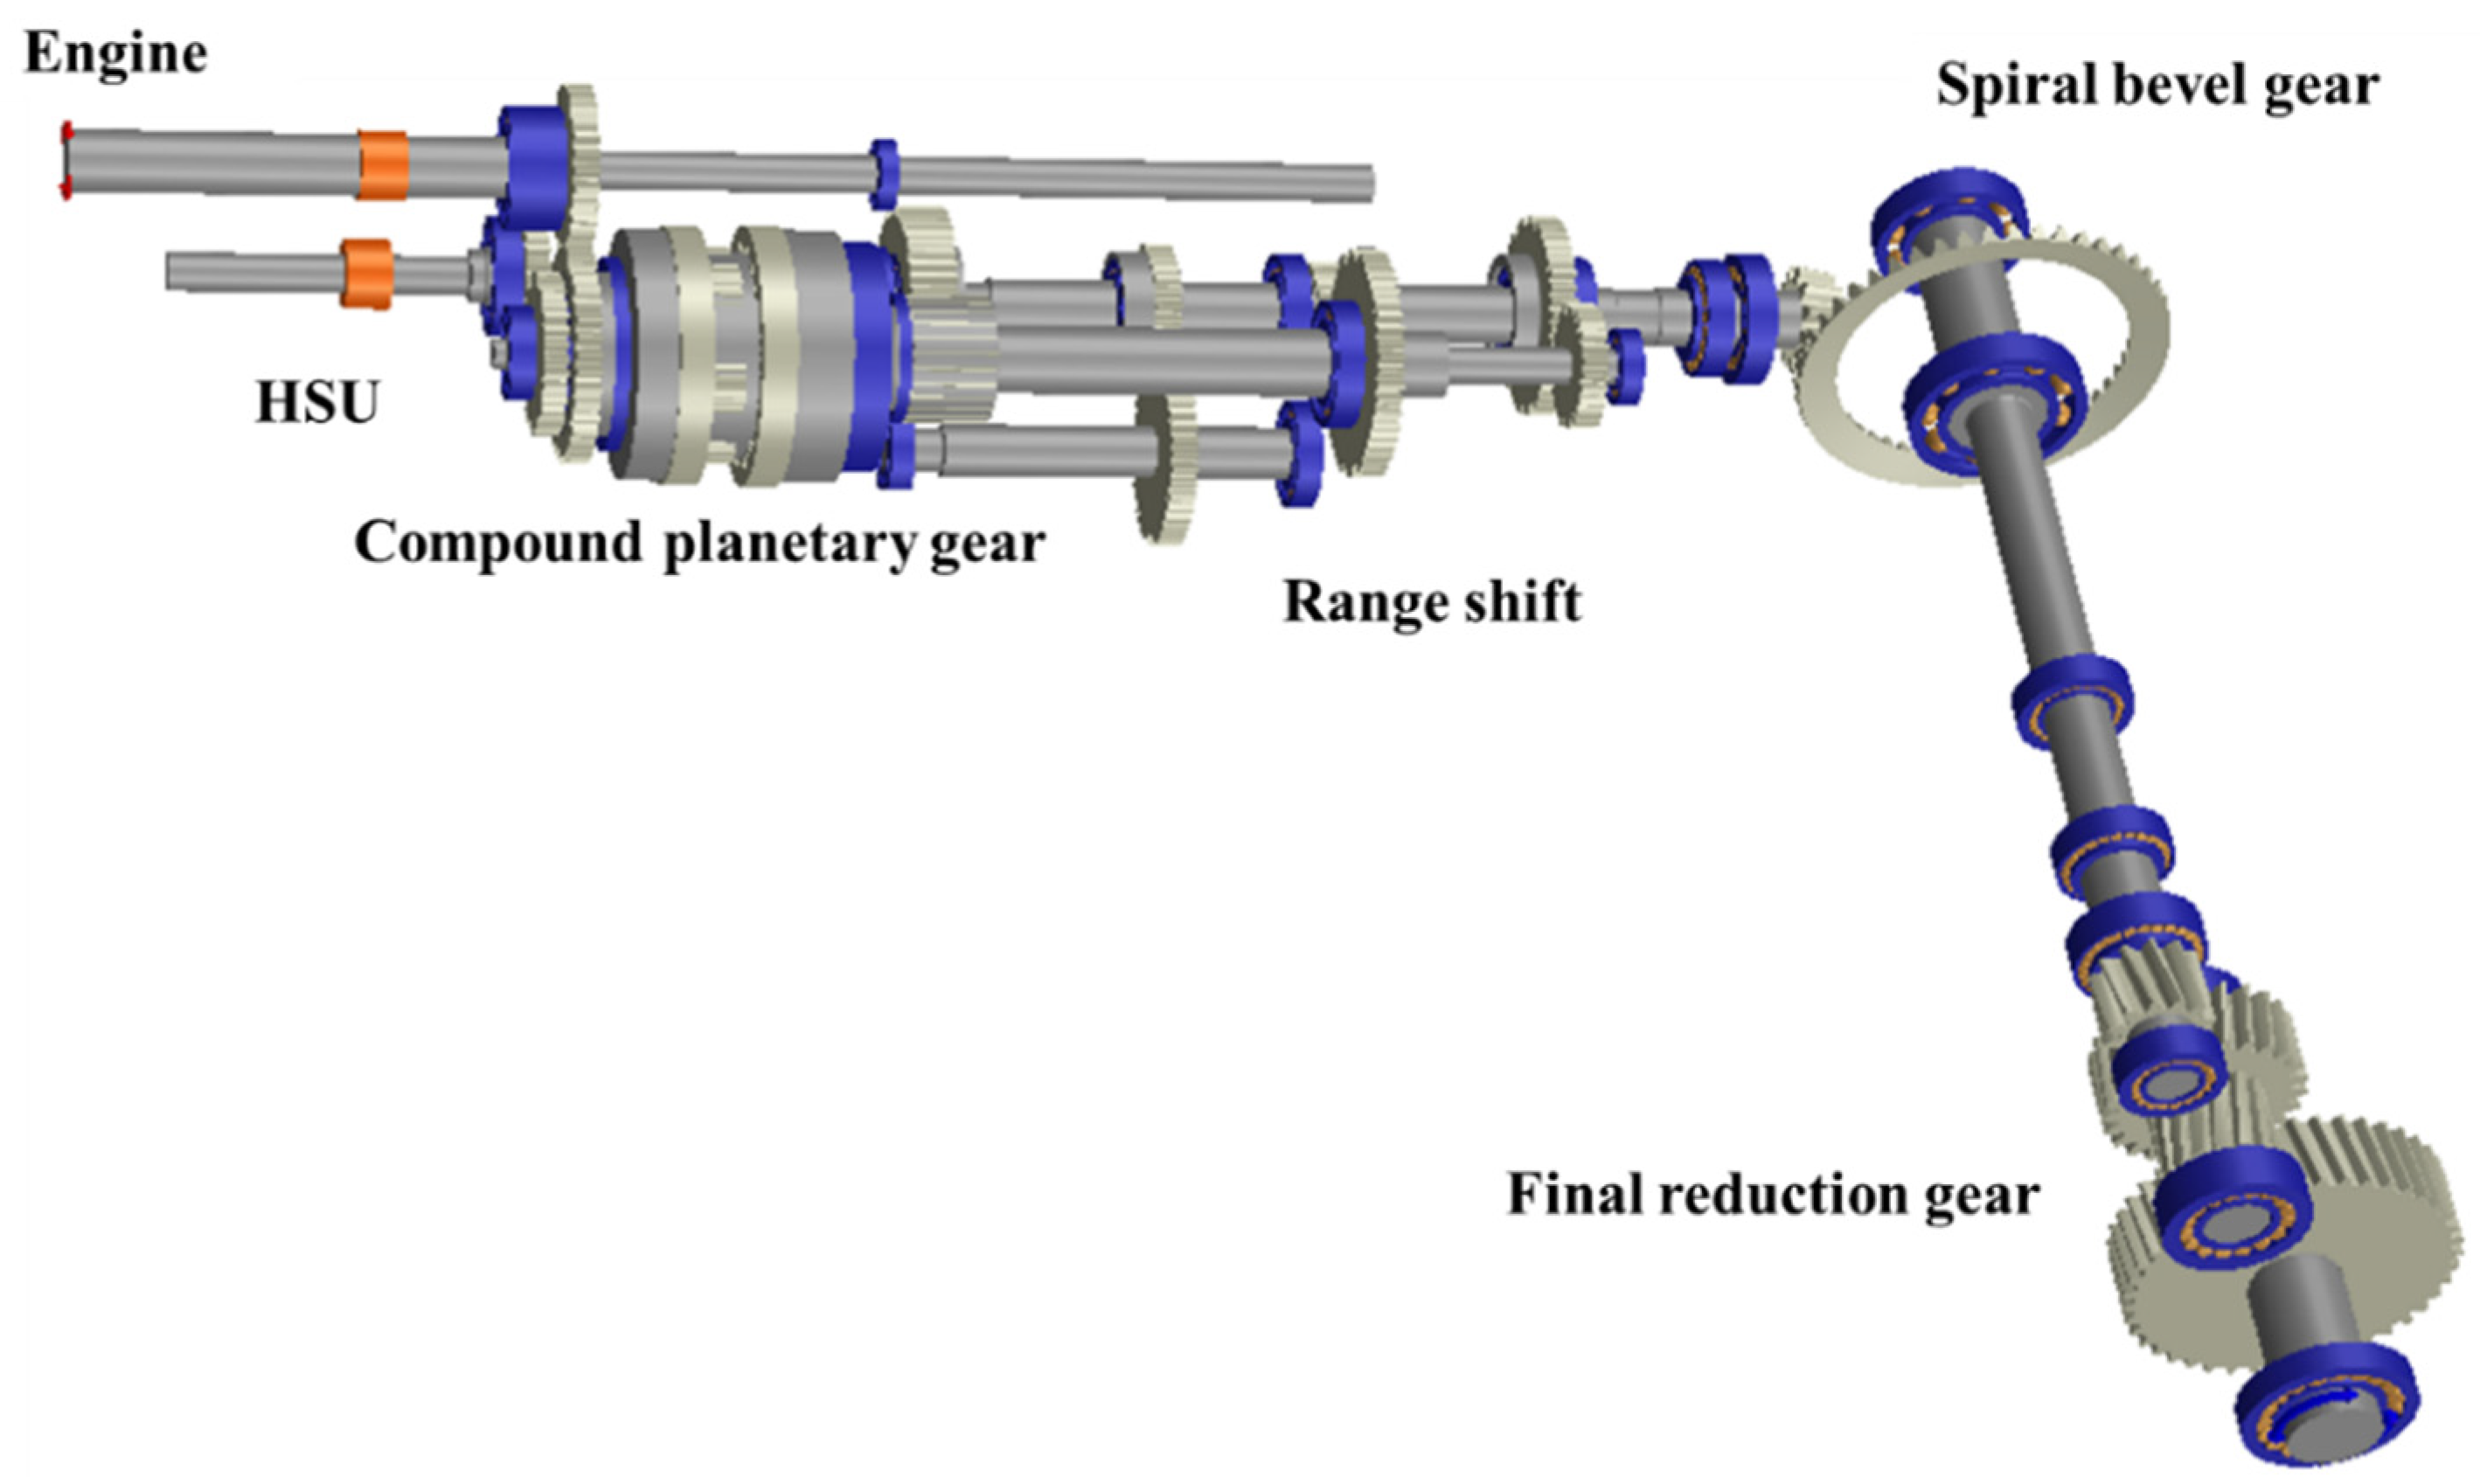
The prototype of the HMT for a 50 kW class agricultural tractor was composed of an HSU, compound planetary gear, range shift, spiral bevel gear, and final reduction gear, and this HMT had three stages and a maximum forward speed of 40 km/h. The simulation model was developed to be the same as the prototype of the HMT. For the performance evaluation, the test bench was installed based on engine conditions of the prototype of the HMT. The axle torque, rotational speed, and power transmission efficiency were measured and simulated according to the gear stages using a bench test and simulation.
(2)
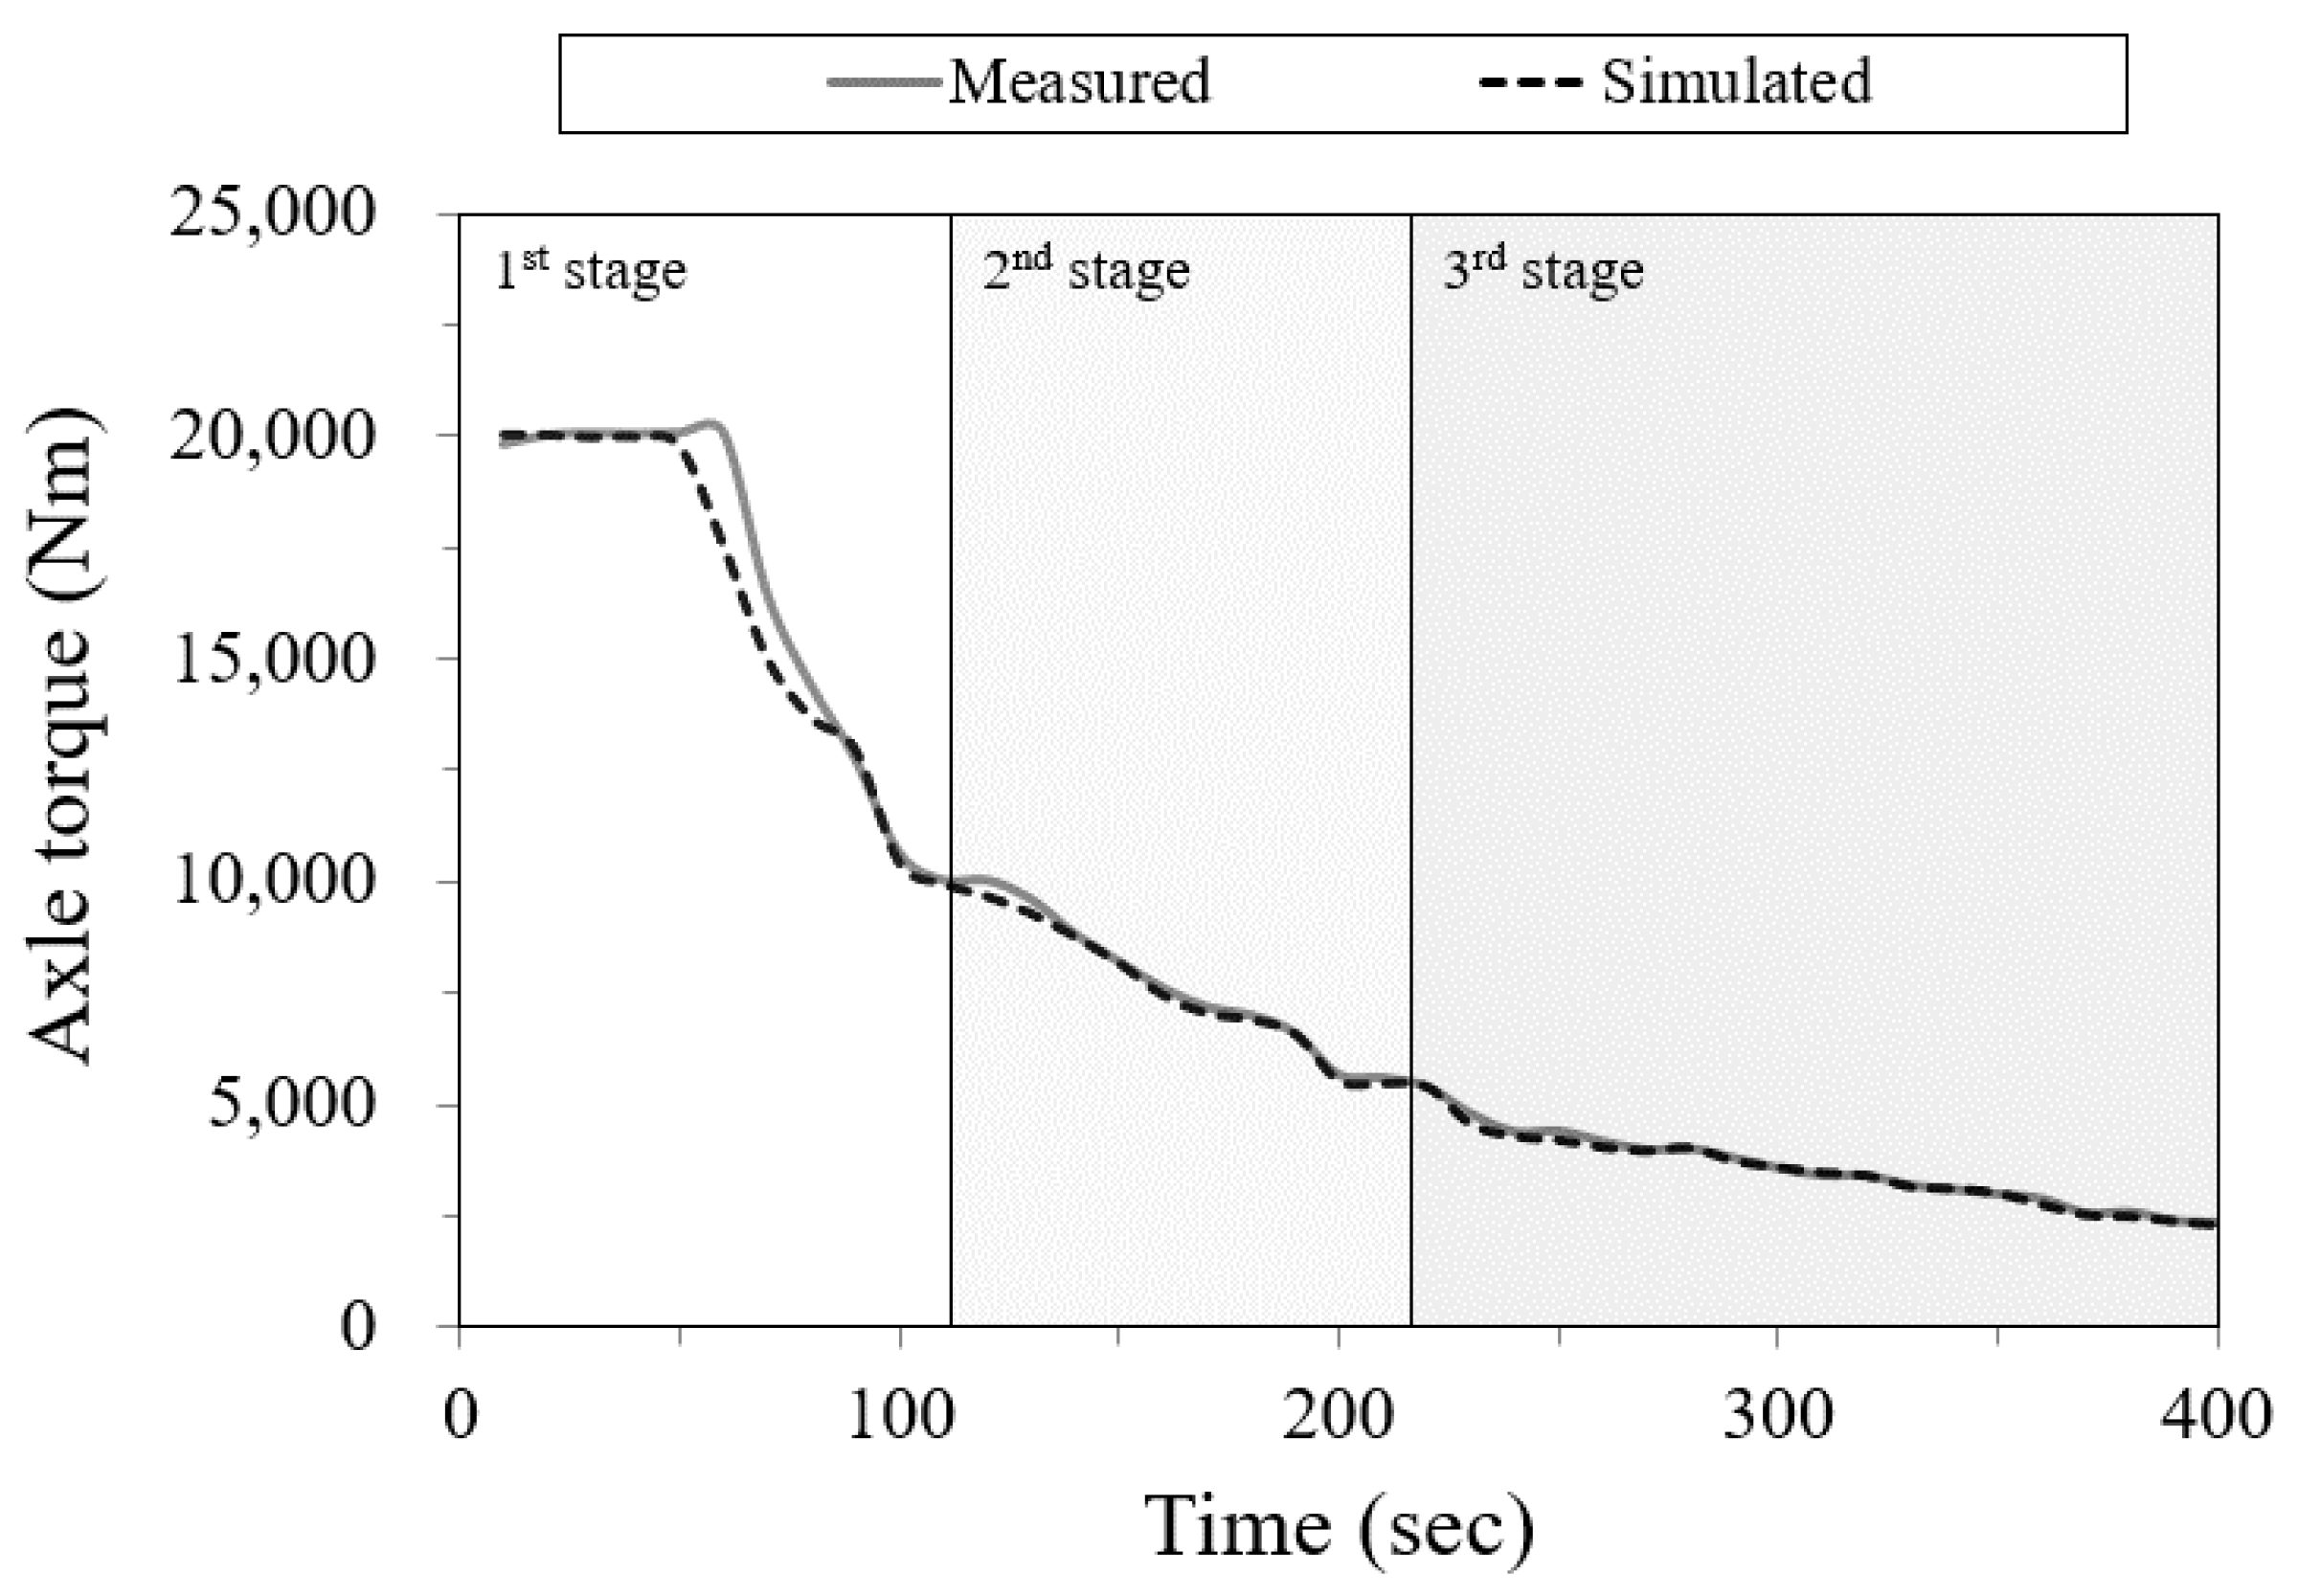
As a result, the axle torque rapidly decreased in the first gear stage and gradually decreased as the gear stage was increased. We also found that both the measured and simulated axle rotational speed increased constantly, and the measured value decreased slightly in the shifting sections. On the other hand, the power transmission efficiency of the first gear stage appeared to increase, and the power transmission efficiency of the second and third gear stages appeared to decrease after increasing to the maximum point. From the t-test results, there were no significant differences between the measured and simulated load data, such as axle torque, rotational speed, and power transmission of the HMT.
(3)
The results of linear regression showed an R-squared value of 0.988, an RMSE of 5.461, and an RD of 8.18 in the first gear stage. The results of linear regression at the second gear stage showed an R-squared of 0.971, an RMSE of 1.473, and an RD of 1.84. On the other hand, the results of linear regression at the third gear stage showed an R-squared of 0.980, an RMSE of 1.345, and an RD of 1.84. The trend of power transmission efficiency between the measured and simulated results appeared to be similar in all sections, and we obtained a simulation model with the accuracy of an R-squared value of more than 0.97.
In conclusion, the measured and simulated results were similar to each other. The results of this study will be useful information for the development of HMT tractors and to improve the power transmission efficiency for the optimal design of agricultural tractors. In a future study, we plan to develop the HMT tractor and measure the load data through agricultural operations, such as plow tillage and rotary operations. In addition, the results of this study are considered to be useful for research on the design of tractor power transmission systems and improvements of HMT for agricultural tractors.

Author Contributions

All authors contributed to the research presented in this work. Their contributions are presented below. Conceptualization, S.-M.B. and Y.-J.K.; methodology, S.-M.B.; software, S.-M.B. and W.-S.K.; validation, Y.-S.K. and S.-Y.B.; writing—original draft preparation, S.-M.B.; writing—review and editing, S.-M.B., S.-Y.B.; supervision, Y.-J.K.; project administration, Y.-J.K.; funding acquisition, Y.-J.K. All authors have read and agreed to the published version of the manuscript.

Funding

This research was supported by the Agricultural, Forestry, Food Research Center Support Program (Project No.: 714002-07), Ministry of Agricultural, Food and Rural Affairs.

Conflicts of Interest

The authors declare no conflict of interest.

References

  1. Kim, Y.J.; Chung, S.O.; Choi, C.H.; Lee, D.H. Evaluation of Tractor PTO Severeness during Rotary Tillage Operation. J. Biosyst. Eng. 2011, 36, 163–170. [Google Scholar] [CrossRef] [Green Version]
  2. Kim, Y.J.; Chung, S.O.; Park, S.J.; Choi, C.H. Analysis of Power Requirement of Agricultural Tractor by Major Field Operation. J. Biosyst. Eng. 2011, 36, 79–88. [Google Scholar] [CrossRef]
  3. Kim, Y.J.; Lee, D.H.; Chung, S.O.; Park, S.J.; Choi, C.H. Analysis of Power Requirement of Agricultural Tractor during Baler Operation. J. Biosyst. Eng. 2011, 36, 243–251. [Google Scholar] [CrossRef] [Green Version]
  4. Siddique, A.A.; Kim, T.J.; Kim, Y.J. Technical Trend of the Power Shift Transmission (PST) of Agricultural Tractor. J. Drive Control 2020, 17, 68–75. [Google Scholar]
  5. Kim, W.S.; Kim, Y.J.; Kim, Y.S.; Baek, S.Y.; Baek, S.M.; Lee, D.H.; Nam, K.C.; Kim, T.B.; Lee, H.J. Development of control system for automated manual transmission of 45-kW agricultural tractor. Appl. Sci. 2020, 10, 2930. [Google Scholar] [CrossRef]
  6. Xu, X.; Dong, P.; Liu, Y.; Zhang, H. Progress in Automotive Transmission Technology. Automot. Innov. 2018, 1, 187–210. [Google Scholar] [CrossRef] [Green Version]
  7. Yang, S.; Bao, Y.; Tang, X.; Jiao, X.; Yang, D.; Wang, Q. Integrated control of hydromechanical variable transmissions. Math. Probl. Eng. 2015, 2015. Available online: https://pdfs.semanticscholar.org/3611/f920b490810513344f74171f18d792e0b029.pdf (accessed on 26 July 2015). [CrossRef] [Green Version]
  8. Xia, Y.; Sun, D.; Qin, D.; Zhou, X. Optimisation of the power-cycle hydro-mechanical parameters in a continuously variable transmission designed for agricultural tractors. Biosyst. Eng. 2020, 193, 12–24. [Google Scholar] [CrossRef]
  9. Rossetti, A.; MacOr, A. Multi-objective optimization of hydro-mechanical power split transmissions. Mech. Mach. Theory 2013, 62, 112–128. [Google Scholar] [CrossRef]
  10. Bae, M.H.; Bae, T.Y.; Choi, S.K. The Strength Analysis of Gears on Hydro-Mechanical Continuously Variable Transmission for Forklift. J. Drive Control 2016, 13, 45–51. [Google Scholar] [CrossRef] [Green Version]
  11. Jung, G.H.; Kim, H.E.; Kim, J.K. Performance and Transmission Efficiency Analysis of 2-Mode Hydro Mechanical Transmission. J. Korean Soc. Automot. Eng. 2005, 13, 90–98. [Google Scholar]
  12. Choi, S.H.; Kim, H.J.; Ahn, S.H.; Hong, S.H.; Chai, M.J.; Kwon, O.E.; Kim, S.C.; Kim, Y.J.; Choi, C.H.; Kim, H.S. Modeling and Simulation for a Tractor Equipped with Hydro-Mechanical Transmission. J. Biosyst. Eng. 2013, 38, 171–179. [Google Scholar] [CrossRef] [Green Version]
  13. Jung, G.H. Gear Train Design of 8-Speed Automatic Transmission for Tractor. J. Korean Soc. Fluid Power Constr. Equip. 2013, 10, 30–36. [Google Scholar]
  14. Jung, D.S.; Lee, Y.B.; Kang, B.S.; Kim, D.S.; Lee, G.C. Study of Test for and Evaluation of HMT for a Tractor. J. Appl. Reliab. 2019, 19, 275–783. [Google Scholar] [CrossRef]
  15. Park, S.U.; Bae, M.H.; Choi, S.K. Development of Hydro-Mechanical Continuously Variable Transmission for Forklift. J. Drive Control 2018, 15, 61–69. [Google Scholar]
  16. Jung, D.S.; Mun, J.H. Development of Hydro-Mechanical Transmission for Tractor. J. Drive Control 2018, 15, 70–76. [Google Scholar]
  17. Xia, Y.; Sun, D. Characteristic analysis on a new hydro-mechanical continuously variable transmission system. Mech. Mach. Theory 2018, 126, 457–467. [Google Scholar] [CrossRef]
  18. Sung, D.H.; Kim, H.E.; Lee, G.H.; Kim, H.S. Power Transmission Characteristics of a Hydro-Mechanical Transmission. Trans. Korean Soc. Mech. Eng. 2001, 25, 1854–1862. [Google Scholar]
  19. Kim, W.; Chung, S.B.; Kim, H.S. Analysis of Power Transmission Characteristics for Hydro-Mechanical Transmission Using Extended Network Theory. Trans. Korean Soc. Mech. Eng. 1996, 5, 1426–1435. [Google Scholar]
  20. Kim, J.H.; Kim, K.U.; Wu, Y.G. Analysis of transmission load of agricultural tractors. J. Terramech. 2000, 37, 113–125. [Google Scholar] [CrossRef]
  21. MacOr, A.; Rossetti, A. Optimization of hydro-mechanical power split transmissions. Mech. Mach. Theory 2011, 46, 1901–1919. [Google Scholar] [CrossRef]
  22. Park, Y.J.; Kim, S.C.; Kim, J.G. Analysis of Power Transmission Characteristics on the Hydromechanical Transmission for Agricultural Tractor. J. Drive Control 2015, 12, 96–100. [Google Scholar] [CrossRef]
  23. Kim, Y.S.; Kim, T.J.; Kim, Y.J.; Lee, S.D.; Park, S.U.; Kim, W.S. Development of a Real-Time Tillage Depth Measurement System for Agricultural Tractors: Application to the Effect Analysis of Tillage Depth on Draft Force during Plow Tillage. Sensors 2020, 20, 912. [Google Scholar] [CrossRef] [PubMed] [Green Version]
  24. Lee, D.H.; Choi, C.H.; Chung, S.O.; Kim, Y.J.; Inoue, E.; Okayasu, T. Evaluation of tractor fuel efficiency using dynamometer and baler operation cycle. J. Fac. Agric. Kyushu Univ. 2016, 61, 173–182. [Google Scholar]
  25. Liu, F.; Wu, W.; Hu, J.; Yuan, S. Design of multi-range hydro-mechanical transmission using modular method. Mech. Syst. Signal Process. 2019, 126, 1–20. [Google Scholar] [CrossRef]
  26. Kim, W.S.; Kim, Y.J.; Chung, S.O.; Lee, D.H.; Choi, C.H.; Yoon, Y.W. Development of simulation model for fuel efficiency of agricultural tractor. Korean J. Agric. Sci. 2016, 43, 116–126. [Google Scholar] [CrossRef] [Green Version]
  27. Lee, N.G.; Kim, Y.J.; Kim, W.S.; Kim, Y.S.; Kim, T.J.; Baek, S.M.; Choi, Y.; Kim, Y.K.; Choi, I.S. Study on the Improvement of Transmission Error and Tooth Load Distribution using Micro-geometry of Compound Planetary Gear Reducer for Tractor Final Driving Shaft. J. Drive Control 2020, 17, 1–12. [Google Scholar]
  28. Kim, T.J.; Kim, W.S.; Kim, Y.S.; Chung, S.O.; Park, S.U.; Hong, S.J.; Choi, C.H.; Kim, Y.J. Strength analysis of mechanical transmission using equivalent torque of plow tillage of an 82 kW-class tractor. Korean J. Agric. Sci. 2019, 46, 723–735. [Google Scholar]
  29. Baek, S.M.; Kim, W.S.; Park, S.U.; Kim, Y.J. Analysis of Equivalent Torque of 78 kW Agricultural Tractor during Rotary Tillage. J. Korea Inst. Inf. Electron. Commun. Technol. 2019, 12, 359–365. [Google Scholar]
  30. Lee, K.J.; Kim, J.M. Power Flow Analysis for Manufacturing of Planetary Gears in an 8-speed Automatic Transmission (II): 4–8 Speeds. J. Korean Soc. Manuf. Process Eng. 2016, 15, 57–65. [Google Scholar]
  31. Lee, K.J.; Kim, J.M. Power Flow Analysis for Manufacturing of Planetary Gears in a 8-Speed Automatic Transmission (I): 1–3 Speeds. J. Korean Soc. Manuf. Process Eng. 2016, 15, 48–56. [Google Scholar]
  32. Han, S.G.; Shin, Y.I.; Yoon, C.H.; Song, C.K. Strength and Durability Analysis of the Double Planetary Gears. J. Korean Soc. Manuf. Process Eng. 2014, 13, 28–34. [Google Scholar]
  33. Bietresato, M.; Friso, D.; Sartori, L. Assessment of the efficiency of tractor transmissions using acceleration tests. Biosyst. Eng. 2012, 112, 171–180. [Google Scholar] [CrossRef]
  34. Lee, D.H.; Kim, Y.J.; Chung, S.O.; Choi, C.H.; Lee, K.H.; Shin, B.S. Analysis of the PTO load of a 75 kW agricultural tractor during rotary tillage and baler operation in Korean upland fields. J. Terramech. 2015, 60, 75–83. [Google Scholar] [CrossRef]
  35. Shafaei, S.M.; Kamgar, S. A comprehensive investigation on static and dynamic friction coefficients of wheat grain with the adoption of statistical analysis. J. Adv. Res. 2017, 8, 351–361. [Google Scholar] [CrossRef]
  36. Basak, J.K.; Qasim, W.; Okyere, F.G.; Khan, F.; Lee, Y.J.; Park, J.; Kim, H.T. Regression Analysis to Estimate Morphology Parameters of Pepper Plant in a Controlled Greenhouse System. J. Biosyst. Eng. 2019, 44, 57–68. [Google Scholar] [CrossRef]
  37. Kumar, A.A.; Tewari, V.K.; Nare, B. Embedded digital draft force and wheel slip indicator for tillage research. Comput. Electron. Agric. 2016, 127, 38–49. [Google Scholar] [CrossRef]
  38. Ashok Kumar, A.; Tewari, V.K.; Gupta, C.; Pareek, C.M. A device to measure wheel slip to improve the fuel efficiency of off road vehicles. J. Terramech. 2017, 70, 1–11. [Google Scholar] [CrossRef]
  39. Lee, D.H.; Kim, Y.J.; Choi, C.H.; Chung, S.O.; Inoue, E.; Okayasu, T. Development of a parallel hybrid system for agricultural tractors. J. Fac. Agric. Kyushu Univ. 2017, 62, 137–144. [Google Scholar]
  40. Lee, D.H.; Choi, C.H.; Chung, S.O.; Kim, Y.J.; Lee, K.H.; Shin, B.S. Development of a plow tillage cycle for an agricultural tractor. Trans. ASABE 2016, 59, 445–454. [Google Scholar]
  41. Baek, S.Y.; Kim, W.S.; Kim, Y.S.; Kim, Y.J.; Park, C.G.; An, S.C.; Moon, H.C.; Kim, B.S. Development of a Simulation Model for an 80 kW-class Electric All-Wheel-Drive (AWD) Tractor using Agricultural Workload. J. Drive Control 2020, 17, 27–36. [Google Scholar]
  42. Kim, W.S.; Kim, Y.S.; Kim, T.J.; Park, S.U.; Choi, Y.; Choi, I.S.; Kim, Y.K.; Kim, Y.J. Analysis of power requirement of 78 kW class agricultural tractor according to the major field operation. Trans. Korean Soc. Mech. Eng. 2019, 43, 911–922. [Google Scholar] [CrossRef]
  43. Li, Q.; Zhou, X.; Wang, S.; Liang, J. Power split transmission with continuously variable planetary ratio. Mech. Mach. Theory 2019, 140, 765–780. [Google Scholar] [CrossRef]
  44. Baek, S.Y.; Kim, Y.S.; Kim, W.S.; Baek, S.M.; Kim, Y.J. Development and Verification of a Simulation Model for 120 kW Class Electric AWD (All-Wheel-Drive) Tractor during Driving Operation. Energies 2020, 13, 2422. [Google Scholar] [CrossRef]
Figure 1. Schematic diagram of the prototype of hydro mechanical transmission (HMT).
Applsci 10 04064 g001
Figure 2. Layout of the HSU of the HMT prototype tractor used in this study.
Applsci 10 04064 g002
Figure 3. Schematic diagram for the compound planetary gear of the HMT.
Applsci 10 04064 g003
Figure 4. Simulation model for the power transmission system of the HMT using Romax DESIGNER.
Applsci 10 04064 g004
Figure 5. Diagram of the test bench for the performance evaluation of the HMT such as axle torque and rotational speed, power transmission efficiency.
Applsci 10 04064 g005
Figure 6. Photo of the test bench for the performance evaluation of the HMT used in this study.
Applsci 10 04064 g006
Figure 7. Comparison of axle torque of the HMT for the measured and simulated results according to the gear stages.
Applsci 10 04064 g007
Figure 8. Comparison of axle rotational speed of the HMT for the measured and simulated results according to the gear stages.
Applsci 10 04064 g008
Figure 9. Comparison of the power transmission efficiency of the HMT for the measured and simulated results according to the gear stages: (a) first gear stage; (b) second gear stage; (c) third gear stage.
Applsci 10 04064 g009
Figure 10. Results of linear regression for the measured and simulated power transmission efficiency based on the gear stages: (a) first gear stage; (b) second gear stage; (c) third gear stage.
Applsci 10 04064 g010aApplsci 10 04064 g010b
Table 1. Specifications of the engine and hydrostatic unit (HSU) of the HMT tractor prototype.
ItemSpecification
EngineLength × Width × Height (mm)648 × 560 × 685
Weight (kg)237
Bore/Stroke (mm)92/110
Displacement (L)2.9
Number of cylinders4
Max. Power (kW @r/min)55.4 @2200
Max. torque (Nm @r/min)260 @1800
HSUDisplacement (cc/min)Pump0~42 (Variable)
Motor42 (Fixed)
Weight (kg)30
Max. speed (r/min)3200
OilISO VG46
Relief valve (MPa)34.3
Charge pump (cc/min)11.8
Table 2. Specifications of the test bench.
ItemSpecification
Input motorMax. Power (kW)1000
Max. torque (Nm)2600
DynamometerMax. Power (kW)1000
Max. torque (Nm)2600
Torque and speed sensorRange0–5000 Nm, 0–5000 r/min
Accuracy±0.05%
Table 3. Comparison of the axle torque between the measured and simulated results based on the gear stages.
Gear StageAxle Torque (Nm)p-Value
MeasuredSimulated
1st15,347.13±6210.03 *14,934.94±6078.320.871
2nd7215.97±1700.067057.00±1655.990.819
3rd3378.36±682.863304.68±669.990.753
Note: * average ± standard deviation.
Table 4. Comparison of the axle rotational speed between the measured and simulation results based on the gear stages.
Gear StageAxle Rotational Speed (rpm)p-Value
MeasuredSimulated
1st18.13±12.41 *16.33±12.640.728
2nd53.97±13.0153.67±10.530.951
3rd107.95±19.66107.95±20.450.818
Note: * Average ± standard deviation.
Table 5. Comparison of power transmission efficiency between the measured and simulated results based on the gear stages.
Gear StagePower Transmission Efficiency (%)p-Value
MeasuredSimulated
1st66.76±20.62 *62.14±22.240.280
2nd78.56±2.3177.91±2.660.190
3rd73.58±4.9672.43±4.870.245
Note: * Average ± standard deviation.

