Article

Possibility of Using Fermented Curly Kale Juice to Manufacture Feta-Type Cheese

by
Magdalena Michalak
1,*,
Katarzyna Skrzypczak
2,
Maciej Nastaj
3,
Konrad Terpiłowski
4,
Tomasz Skrzypek
5,
Adam Waśko
1 and
Magdalena Polak-Berecka
1,*
1
Department of Biotechnology, Microbiology and Human Nutrition, University of Life Sciences in Lublin, Skromna 8, 20-704 Lublin, Poland
2
Department of Plant Food Technology and Gastronomy, University of Life Sciences in Lublin, Skromna 8, 20-704 Lublin, Poland
3
Department of Milk Technology and Hydrocolloids, University of Life Sciences in Lublin, Skromna 8, 20-704 Lublin, Poland
4
Department of Interfacial Phenomena, Maria Curie Skłodowska University, M. Curie Skłodowska Sq. 3, 20-031 Lublin, Poland
5
Laboratory of Confocal and Electron Microscopy, Interdisciplinary Research Center, John Paul II Catholic University of Lublin, 20-708 Lublin, Poland
*
Authors to whom correspondence should be addressed.
Appl. Sci. 2020, 10(11), 4020; https://doi.org/10.3390/app10114020
Submission received: 10 May 2020 / Revised: 30 May 2020 / Accepted: 8 June 2020 / Published: 10 June 2020
(This article belongs to the Special Issue Functional Fermented Food Products)

Abstract

:
This paper reports the potential use of fermented curly kale juice in Feta-type cheese production. The rheological study and Turbiscan assay demonstrated that fermented curly kale juice coupled with rennet accelerated curd formation resulted in a stronger curd compared to the sample containing rennet alone. Laboratory-scale cheese was manufactured from cow’s milk with the use of fermented curly kale juice. Several parameters that affect the quality of cheese were investigated, including physicochemical, textural and microstructure characteristics. The content of amino acids and fatty acids was determined, surface properties were assessed and microbial enumeration of the experimental cheese was carried out before and after ripening. The values of pH and the content of lactose and protein significantly decreased as a result of maturation. In turn, an increase in LAB growth as well as saturated and unsaturated fatty acids was observed. The use of the fermented curly kale juice improved the textural characteristics and changed the microstructure of the obtained cheese. Finally, the ripening process enhanced the amino acid profile of the Feta-type cheese. These findings indicate that the fermented curly kale juice can be used for manufacture of cheese with improved characteristics and functional properties.

Graphical Abstract

1. Introduction

Nowadays, to meet consumer expectations about novel food, products with enhanced probiotic properties, sensory quality and increased nutritional value have been developed. For this purpose, considerable research attention is recently focused on searching for new isolates of lactic acid bacteria (LAB) exhibiting desired technological and health-promoting properties that have particular significance in production of functional dairy foods. Such foods demonstrate great potential in promoting human health and well-being. Furthermore, matrices for food production that are carriers of bacteria (e.g., cabbage) can provide additional desirable functional value [1]. As a result, the intake of plant-based products, which are rich sources of bioactive compounds, increases notably [2]. Consequently, curly kale (Brassica oleracea var. sabellica), which represents Brassica vegetables, has experienced a renaissance in recent years. Consumption of curly kale, considering its superfood nature, can provide a variety of biological substances (starting from glucosinolates, polyphenols and phenolic acids ending with carotenoids) with well-documented health benefits [3,4,5,6,7]. Furthermore, fermentation of curly kale with autochthonous lactic acid bacteria (LAB) was found to contribute to many favorable food features, for example, improved nutritional quality, safety and organoleptic characteristics [8]. Moreover, due to the presence of LAB, consumption of such foods can provide beneficial effects on the human organism by enhancing mucosal barriers, inhibiting intestinal inflammatory processes, decreasing cholesterol content, inhibiting the growth of pathogenic bacteria and mitigating the course of diarrhea [9,10].
Currently, fermented foods account for almost 25–30% of diets worldwide. Especially in the western diet, fermented milk products (in which cheese occupies an important place) represent 60% of fermented foods [11].
In the cheese production process, enzymatic coagulation of milk is a key step, since it defines the final features of the product. After the addition of rennet, this step begins with the enzymatic cleavage of the Met 105– Phe 106 bond of κ-casein present on the surface of casein micelles [12]. In general, coagulation of milk with calf rennet is the most commonly used procedure [13]. Recently, proteases from various plants have been investigated and used in cheesemaking. Most of them are classified as aspartic proteases; however, cysteine and serine proteases have also been reported to exhibit the ability to clot milk in appropriate conditions [13]. These include a novel thrombolytic protease discovered in Aster yomena [14], a cysteine protease from the latex of Ficus microcarpa [15], a glycosylated protease from Euphorbia cf. lactea latex [16] or a serine/threonine-endopeptidase from Moringa oleifera Lam. leaves [17]. Moreover, Sun et al. [18] have shown protease activity in Brassica vegetables, such as broccoli having a probable serine protease as one of the most promising activities among 90 plant resources. Based on this, other vegetables belonging to the Brassicaceae family, such as curly kale could be another potential source of these enzymes.
Lactobacillus plantarum 332, Lb. paraplantarum G2114 and Pediococcus pentosaceus 2211, previously isolated from spontaneously fermented curly kale, were used in the present study as a starter culture for making Feta-type cheese. These strains demonstrated significant technological and functional properties and suitability for the use as a starter culture in vegetable juice production [19].
In the current study, curly kale juice was used as a new plant-derived coagulant agent and a carrier of bacteria exhibiting functional properties [20] for the production of ripening cheese for the first time. The major aim of the study was to investigate the potential of the technological use of fermented curly kale juice in the dairy industry, including cheesemaking.

2. Materials and Methods

2.1. Bacterial Strains and Growth Conditions

The three species of LAB used in this study, that is, Lb. plantarum 332 (KY883559), Lb. paraplantarum G2114 (KY883562) and Pediococcus pentosaceus 2211 (KY883563) [20], were previously isolated from spontaneously fermented curly kale leaves and identified by recA gene multiplex analysis and 16S rRNA gene sequencing. The technological and functional properties of the strains in terms of their effectiveness as a starter culture for juice fermentation have also been studied in detail. The strains have demonstrated the ability to survive low pH value and high sodium chloride concentration [19,20]. The bacteria were maintained at −80 °C in 20% (w/v) glycerol and grown in Man, Ragosa and Sharp broth (MRS, BTL, Łódź, Poland) in anaerobic conditions (30 °C for 48 h) for analysis.

2.2. Preparation of Fermented Curly Kale Juice

A cultivar of curly kale (Brassica oleracea L. var. sabellica L.) growing in summer was harvested in late October and early November 2018 from our own cultivation (51°07′54.2″ N 22°59′52.7″ E). Juice was prepared using an electric juicer (Angel 8500s, Busan, Korea) as described previously [19]. The obtained juice was diluted with distilled water (in ratio 1:3), filtered and then subjected to pasteurization (70 °C for 25 min). Next, the freshly prepared juice was inoculated with three LAB species in a ratio of 1:1:1 (5% v/v). For this purpose, each culture was centrifuged (12,000× g for 5 min), washed twice with sterilized water and dissolved in sufficient water to obtain optical density at 600 nm of 1.0 measured using a BioRad Smart Spec Plus spectrophotometer (Bio-Rad, Hercules, CA, USA). Fermentation was carried out for 72 h at room temperature (18–20 °C). The obtained juice had pH value of 3.55 ± 0.08 and cell count of 10.5 ±0.1 CFU.

2.3. Milk Clotting Ability of Fermented Curly Kale Juice

Fermented curly kale juice was subjected to initial analysis which tested its ability to coagulate milk. For this purpose, three types of samples were prepared—(i) milk with rennet (Beaugel 50, Ets A. Coquard, France; in amount recommended by the manufacturer), (ii) milk with rennet and fermented curly kale juice (5% v/v) and (iii) milk with fermented curly kale juice. The samples were used in rheological and Turbiscan measurements as described below.

2.3.1. Rheological Measurement

All rheological experiments were carried out using a Kinexus Lab+ rheometer (Malvern Panalytical Ltd., Malvern, UK) equipped with a concentric cylinder system with a rotating bob and a fixed cup with the gap of 2 mm. To monitor the coagulation process, the changes in storage (G’) and loss (G”) moduli as well as the phase angle (δ) values were recorded at 0.1 Hz and strain amplitude 0.01% at 30 °C. The samples were covered with a thin oil film to minimize evaporation during measurements. Each sample was measured in triplicate. The data were gathered by rSpace software (Malvern Panalytical Ltd., Malvern, UK).

2.3.2. Turbiscan

The cheese coagulation process was measured using Turbiscan LabExpert (L’Union, France) with the TLab Cooler cooling module. The inoculated milk in a glass vial was placed in a thermostatted chamber. An electroluminescence diode emitted a collimated light beam (λ = 880 nm) passing through the sample. The transmission detector recorded the light passing through the sample at the angle of 0° towards the incident light direction. Another diode acted as a backscattering detector registering the light scattered at the angle of 135°. The results are presented in the form of curves, which show the intensities of backscattering as a function of time. The Turbiscan Stability Index (TSI) values were also calculated from the experimental results using the Turbiscan Easy Soft from the equation:
TSI = i = 1 n ( x i x BS ) 2 n 1 ,
where xi is the mean backscattering every 5 min of the measurement, xBS is the mean xi and n is the number of scans.

2.4. Laboratory Scale Cheese Manufacture and Sampling

The preliminary studies reviled that fermented curly kale juice enhanced rennet activity. Thus, the juice was used to manufacture laboratory scale cheese as described below.
The cheeses were made from 10 l of cow milk, to which 0.02% (v/v) of a CaCl2 aqueous solution (40%) was added (Figure 1). The composition of the cheese milk (microfiltered and pasteurized) was as follows—protein 3.0% (w/w), fat 3.2% (w/w), carbohydrates 4.7% (w/w), saturated fatty acids 1.8% (w/w) and salt 0.1% (w/w). For cheese production, the milk was heated to 33 °C. Then, the fermented curly kale juice prepared previously (described above) was directly incorporated (as the carrier of the starter culture) to the milk in an amount of 5% (v/v). The dosage was selected on the basis of preliminary experiments (the volume was the smallest amount of fermented juice that yielded suitable acid curd in the shortest time in the indicated conditions). Then, the inoculated milk was incubated for 1 h at 33 °C. Subsequently, commercial rennet (Beaugel 50, Ets A. Coquard, France) was added into milk according to manufacturer’s instructions. After the coagulation process, the coagulum was cut into cubes (30 × 30 mm), left for 10 min at 33 °C and gently stirred for 15 min with gradually raising the temperature (1 °C/2 min). Then, whey was removed and the mass of cheese grains was divided in two equal portions (each of 300 g), which were transferred into round-shaped (13 × 7 cm) microperforated plastic molds lined with cheesecloth. Cheese pressing was performed at 18 °C for 24 h by applying a pressure of 2 kg on the top of the round molds. To drain the whey effectively, the fresh cheeses were rotated every 2 h. Then, salting was performed by immersion in saturated brine (18% NaCl; pH = 4.8; temp. 18 °C/2 h) with rotation of the cheeses every 30 min. Thereafter, samples of salted fresh cheeses were collected and subjected to analyses. Then, the cheeses were subjected to the first stage of the ripening process in brine (8% NaCl; pH = 4.8; temp. 13 °C) for 8 weeks. Afterwards, they were transferred to 6 °C and subjected to the second stage of maturation in brine (8% NaCl; pH = 4.8) for another 8 weeks. During the entire maturing process, the cheeses were rotated systematically (once a day). The final products (cheeses after 16 weeks of ripening) were subjected to further analyses.

2.5. Cheese Analysis

2.5.1. Physico-Chemical Analyses

The pH of the cheese samples was measured using a pH meter (Hanna HI 221; Hanna Instruments, Woonsocket, RI, USA). Nitrogen content was analyzed with the Kjeldahl method, with conversion to protein content using a factor of 6.38.
For lactose determination, the cheese samples were deproteinized with acetonitrile and centrifuged at 12 000× g for 15 min. In each supernatant, the concentration of lactose was determined using an HPLC system (Gilson Inc., Middleton, WI, USA) coupled with a refractive index detector (Knauer GmbH, Berlin, Germany) and a Bio-Rad Aminex Carbohydrate HPX 87H column (Bio-Rad, Hercules, CA, USA). Sulfuric acid (0.05 M) was used as the mobile phase at a flow rate of 0.5 mL/min and the separation temperature was 42 °C. Chromatograms were analyzed using Chromax 2007 software version 1.0a (Pol-Lab, Warszawa, Poland). The content of lactose was calculated by comparison of the peak areas and the retention time with that obtained for the pure carbohydrate.
The salt concentration was measured with flame atomic absorption spectrometry (FAAS) using an Agilent Technologies AA280FS spectrometer (Agilent Technologies, Mulgrave, Victoria, Australia) coupled with a Varian hollow-cathode lamp. Prior to the analysis, the cheese samples (0.5 g) were mineralized with a CEM Mars 5 Xpress (CEM, Matthews, NC, USA) microwave mineralization system using 2 mL HNO3. Digestion of the cheese samples was performed according to a microwave program composed of three stages—the first stage: power 400 W, time 5 min, temperature 90 °C; the second stage: power 800 W, time 10 min, temperature 120 °C; the third stage: power 1600 W, time 30 min, temperature 210 °C. For preparation of the calibration curve, the commercial Na standard at a concentration of 200 mg/L was used as an appropriately diluted standard. The results of the determination of the sodium content in the tested samples were converted into values corresponding to the salt content (NaCl) in cheeses and expressed as percentage values.
Fat content was analyzed in accordance with ISO1735:2004/IDF 005 using a Soxtec Avanti 2055 device (Foss Tecator, Höganäs, Sweden).
Protein, lactose and salt content were expressed as percentage of fresh weight (fw), while fat was expressed as percentage of dry weight (dw).
The color parameters of the cheeses were determined with an X-Rite Colour 8200 spectrophotometer (X-Rite Inc., Grand Rapids, MI, USA). The measurements were performed at room temperature at five randomly selected locations of a freshly cut surface of cheese slices with a thickness of 20 mm using a D-65 illuminant, a 13-mm viewing area and a 10° observer. The color parameters were measured in the CIE L*a*b* and CIE L*C*h° scales. The following parameters were estimated—lightness (L*), redness (a*), yellowness (b*), chroma (C*) and hue angle (). Before use, the spectrophotometer was calibrated using X-Rite’s white and black standards.

2.5.2. Microbial Enumeration

Microbiological analysis was carried out during cheese manufacture and after ripening. To estimate the number of viable cells, Feta-type cheese samples were mixed with saline and homogenized in a Stomacher (Stomacher 80 Biomaster, Seward, UK) for 60 s at room temperature. Serial decimal dilutions were prepared with saline and 0.1 mL of the appropriate dilutions was spread onto MRS agar plates. After incubation in anaerobic conditions (30 °C for 48 hr), the plate counts were performed.

2.5.3. Texture Profile Analysis (TPA)

The TPA determination was carried out using a TA-XT2i Texture Analyzer (Stable Micro Systems, Godalming, UK) according to the method described by Sołowiej [21]. In order to receive samples with the same size and shape, the analyzed cheeses were cut into identical rolls (1.5 cm high and 1.5 cm wide). The samples were subjected to double compression to 50% of deformation by a testing set (15 mm diameter) with a compression rate at the level of 1 mm/s. The following texture parameters were analyzed—gumminess, hardness, cohesiveness, springiness, fracturability and chewiness. The test was performed in seven repetitions for each variant of cheese.

2.5.4. Surface Properties

The surface properties of the cheeses were determined before and after ripening. Advancing (Ѳa) and receding (Ѳr) contact angles as well as the contact angle hysteresis (CAH) of probe water on the cheese surface were measured using a contact angle meter GBX (Romans-sur-Isère, France) equipped with a temperature- and humidity-controlled chamber and a digital camera. The experiment was conducted at 20 °C and 50% humidity. A 6-µl droplet from a syringe was settled on the cheese surface by an automatic deposition system. The advancing contact angle was calculated from the droplet shape by the Win Drop++ software. Subsequently, 2 µl were sucked into the syringe and the receding contact angle was calculated by the same software. All parameters were measured for up to 10 droplets of probe water.

2.5.5. SEM

Cryogenic scanning electron microscope (SEM) was used to examine the microstructure of cheese before and after maturation. The samples were frozen in liquid nitrogen, fractured in the system chamber, sublimated (12 min at—95 °C), sputtered coated with gold and observed using SEM Carl Zeiss Ultra Plus (Oberkochen, Germany).

2.5.6. Polyacrylamide Gel Electrophoresis

SDS-PAGE (sodium dodecyl sulfate-polyacrylamide gel electrophoresis) protein analysis of cheese samples was performed according to the method proposed by Laemmli [22] using 12% acrylamide gel in reducing conditions. The protein bands were stained with Coomassie Brilliant Blue R-250. The bands were analyzed using Core Laboratory Image Quantification Software (CLIQS), TotalLab Ltd.

2.5.7. Amino Acid Determination

Acetonitrile, formic acid, spectrometric-grade water, the mixture of physiological amino acids and the set of amino acids were purchased from Merck (Darmstadt, Germany).
For analysis, cheese samples were prepared and then derivatized as previously described [23]. Briefly, the samples were homogenized in a Stomacher and 0.1 M HCl was added. The mixture was subjected to sonication for 30 min and then centrifugation at 12,000× g for 5 min at room temperature (MiniSpin, Eppendorf AG, Hamburg, Germany). The supernatant was collected and mixed with 0.1 M HCl. For dansylation, the mixture was spiked with an internal standard (20 µg/mL in 0.1 M HCl) and combined with saturated Na2CO3 and dansyl chloride solution. The obtained mixture was incubated in a water bath (40 °C for 1 h) without light. After cooling, ammonia was added for precipitation of the extra dansyl chloride. After 30 min, the obtained solution was filtered through a 0.22 µm pore size nylon syringe filter directly into HPLC vials.
The identification of dansylated amino acids in the crude samples was performed by means of the LC-ESI-Q-TOF-MS (liquid chromatography-electrospray ionization time-of-flight mass spectrometry) system produced by Agilent Technologies (Santa Clara, CA, USA), which contains a mass spectrometer (Agilent G3250AA) and a coupled high performance liquid chromatograph with a photodiode array detector (G1315D), a degasser (G1322A), a binary pump (G1312C), a column thermostat and an autosampler (G1329B).
The analyses were carried out on an Accucore HILIC chromatographic column (150 mm × 2.1 mm, 2.6 µm particle size) (Thermo Fisher Scientific Inc., Waltham, MA, USA) in the following gradient conditions of solvent A (0.1% formic acid) and solvent B (0.1% formic acid in acetonitrile): 0 min—2% A in B, 5 min—18% A in B, 20 min—70% A in B, 40 min—70% A in B, 45 min—2% A in B. The analysis time was set at 70 min and the injection volume at 10 µL.
The flow rate was kept at 0.2 mL/min for the first 36 min of the analysis; later, with an increase in the polarity, it was changed to 0.1 mL/min (36–45 min) and increased again to 0.2 mL/min until the end of the analysis. The column was thermostatted and the temperature was set at 25 °C throughout the analysis. The results were expressed as an amino acid concentration per 1 g of dry weight (dw) of cheese.

2.5.8. Fatty Acid Determination

The profile of fatty acids was determined using a gas chromatograph Varian 450-GC equipped with the Galaxie™ Chromatography Data System. For quantification of the fatty acid methyl esters (FAME), the samples were injected onto a 30 m × 0.25 mm × 0.25 μm fused silica capillary column (SelectTM Biodiesel for FAME, Varian, CA, USA) under a temperature program—22.5 min at 200 °C increasing at 3 °C per min to 235 °C and maintained at 235 °C for 6 min. Helium was the carrier gas at a flow of 1.5 mL/min; split ratio 1:50. The injector and detector temperatures were 250 °C and 270 °C, respectively. Fatty acids were identified by comparison of retention times and fragmentation patterns with those of the known standard. The results were expressed as the fatty acid concentration per 100 g of dw of cheese.

2.6. Statistical Analysis

The analyses at each stage of ripening were conducted in triplicate and were reported as mean ± standard deviation (SD). In order to estimate the significance of the differences between the mean values, Student’s t test was performed and statistical significance was set at p < 0.05 level. The statistical analysis was carried out using the STATISTICA 13.3 software (Dell, Aliso Viejo, CA, USA).

3. Results and Discussion

3.1. Milk Clotting Ability of Fermented Curly Kale Juice

To verify the suitability of fermented curly kale juice in the cheesemaking process, rheological experiments were carried out. As indicated by the values of rheological parameters, there were significant differences in the properties of the obtained cheese curds (Table 1). The storage modulus (G’), loss modulus (G”) and phase angle (δ) values during the fermentation process in the rheometer were dependent on the addition of rennet and fermented curly kale juice and on the reaction time. The cheese curd obtained from milk and fermented curly kale juice demonstrated the highest values of G′ and G″ in comparison with the samples with rennet with or without fermented juice. All samples exhibited spectra characteristics of weak gels, which was confirmed by G’ > G”. The strongest structure was represented by the sample obtained from milk and fermented curly kale juice; however, it should be pointed out that the reaction time was the longest in that case. In the samples with rennet, the fermented curly kale juice had an insignificant impact on the viscoelastic properties of curd. Its addition caused a relevant change in the coagulation time in comparison with the sample containing only fermented juice. The phase angle drops below 45° was noted after 6 min for the sample with rennet only and after 4 min for the sample with rennet and fermented curly kale juice. For the sample obtained from milk and juice, the drop was noted after 665 min. It is known that the rheological properties of fermented milk products are strongly correlated with the ability of bacterial strains to acidify milk. Thus, the acceleration of changes in the phase angle and the improvement of the curd structure when fermented curly kale juice was used can be a consequence of LAB activity. Similar to our findings, Skrzypczak et al. [24] investigated the use of various L. helveticus strains to produce the hardest homogeneous acid curds. As shown in their study, the G’ and G” values increased with the start of the gel formation in all samples analyzed but the gel formation (acidic curd) was the fastest in samples inoculated with L. helveticus T105.
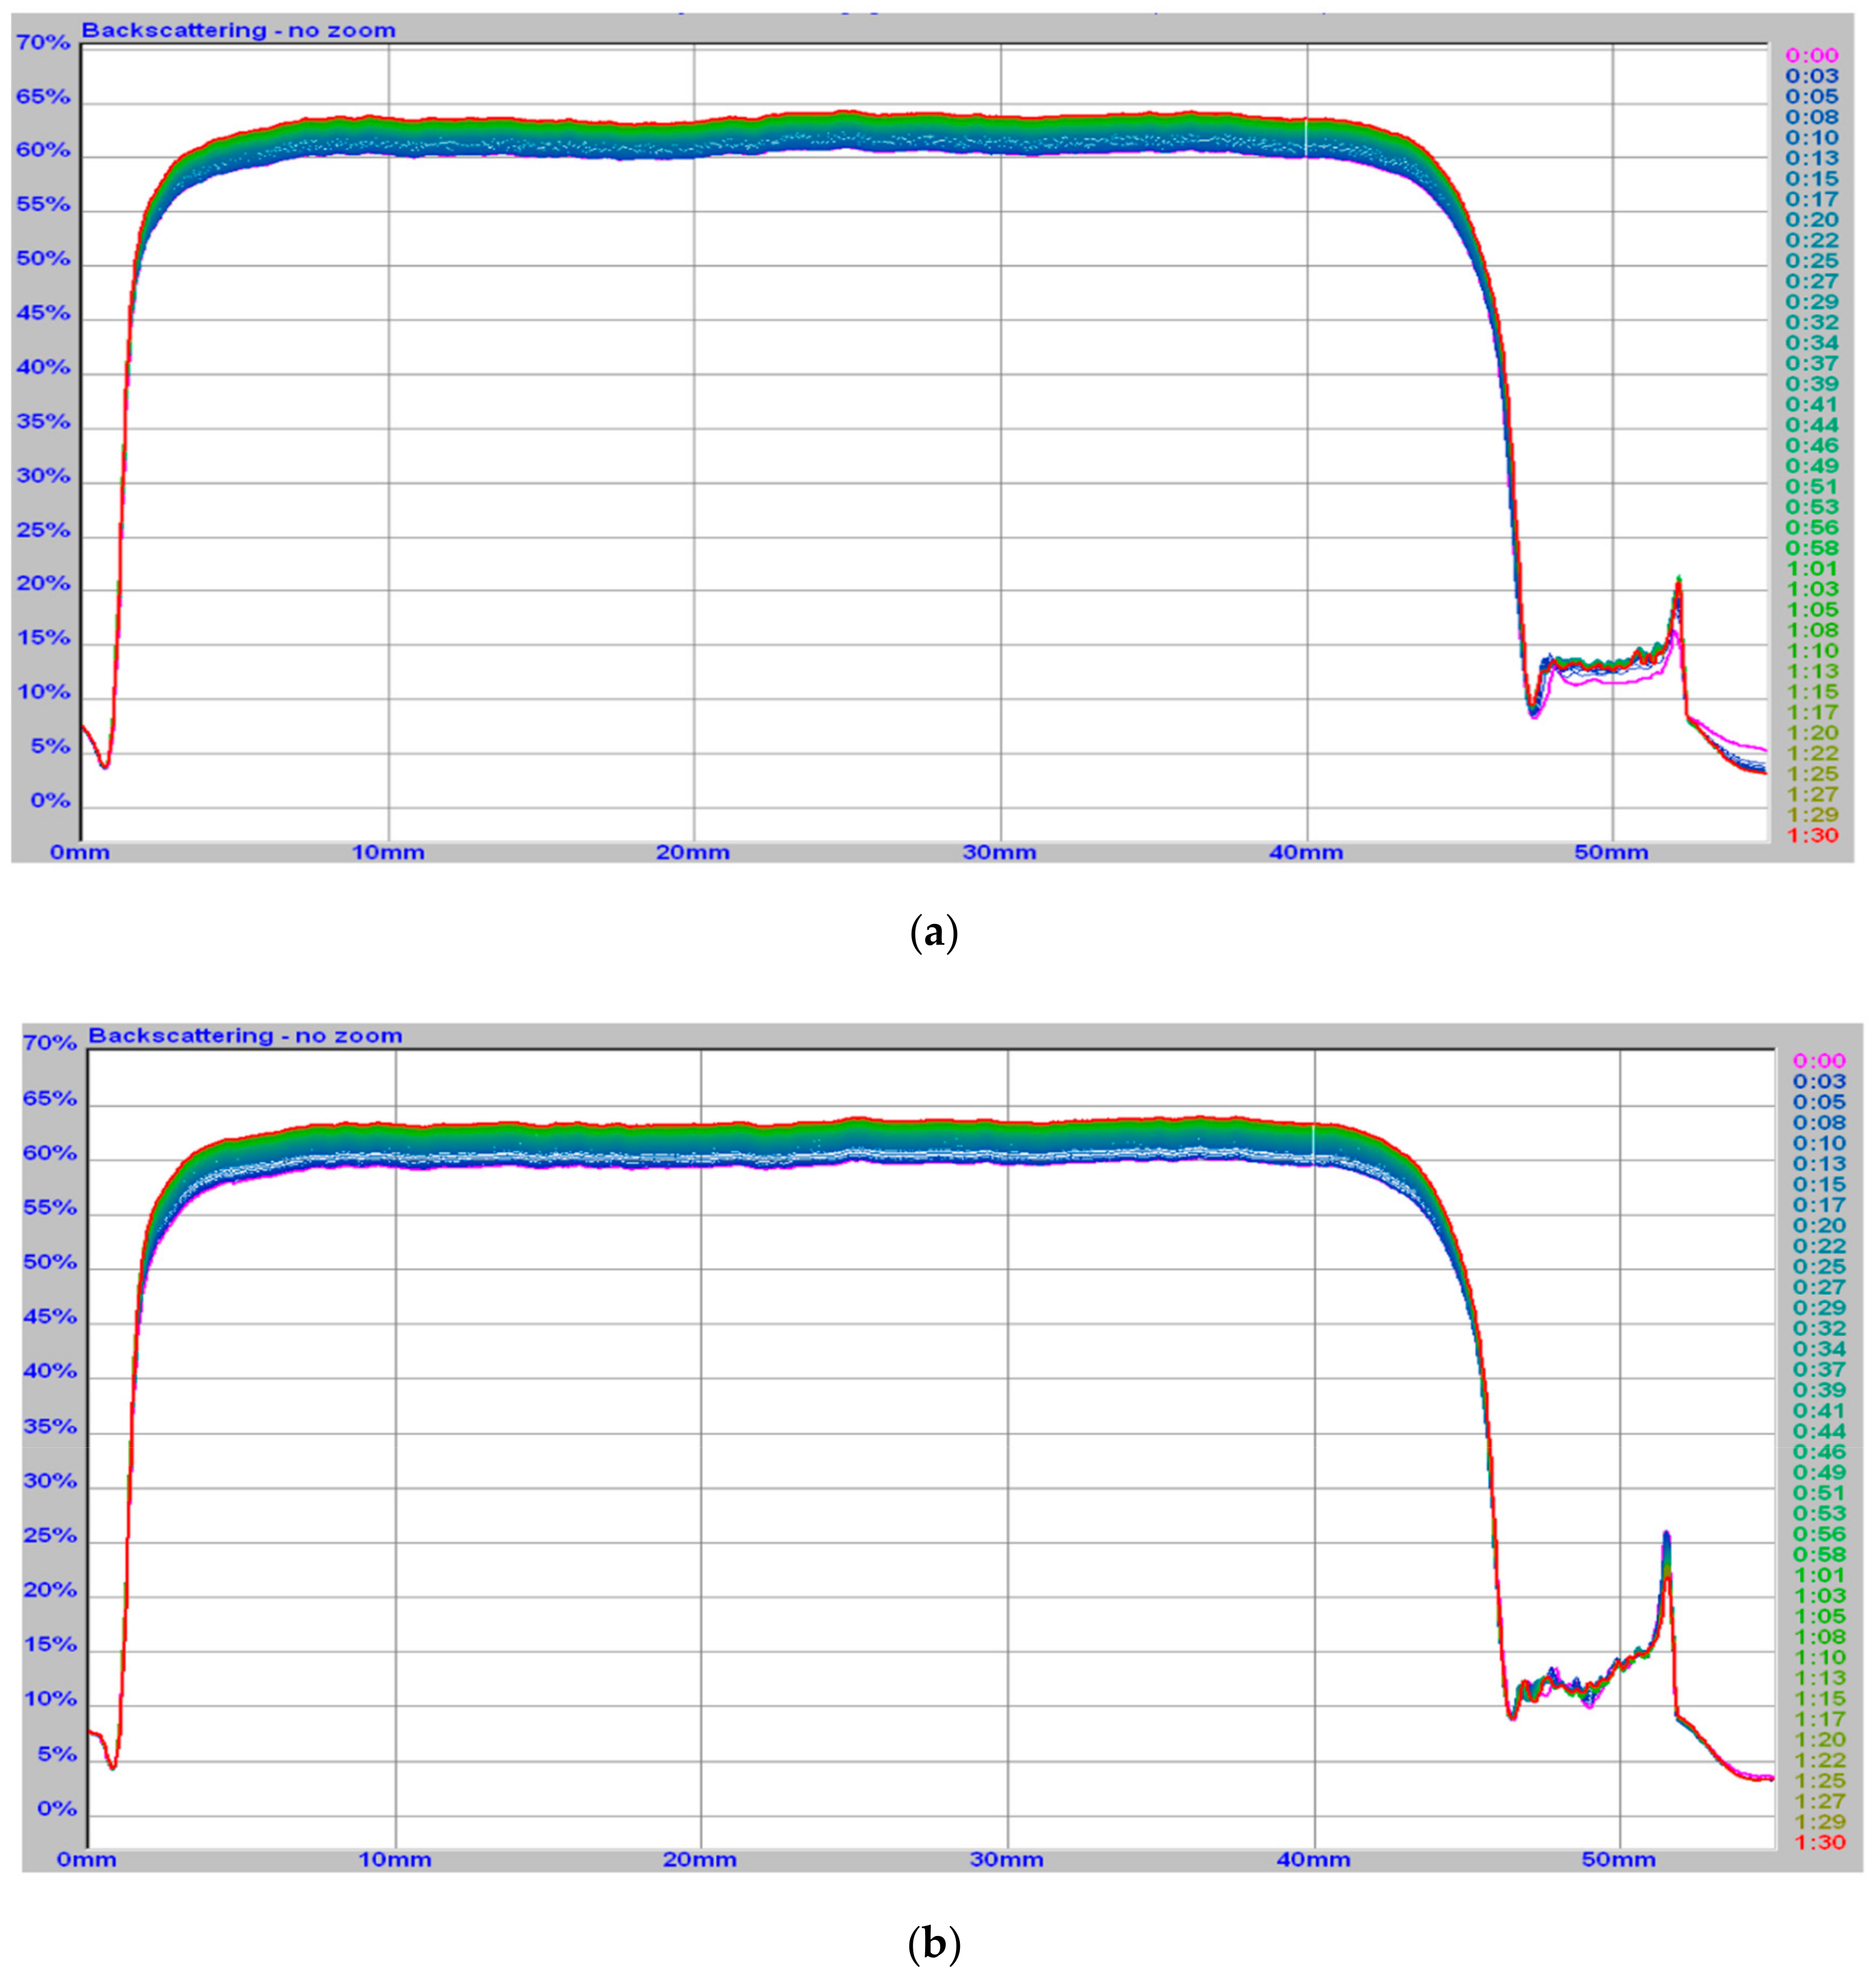
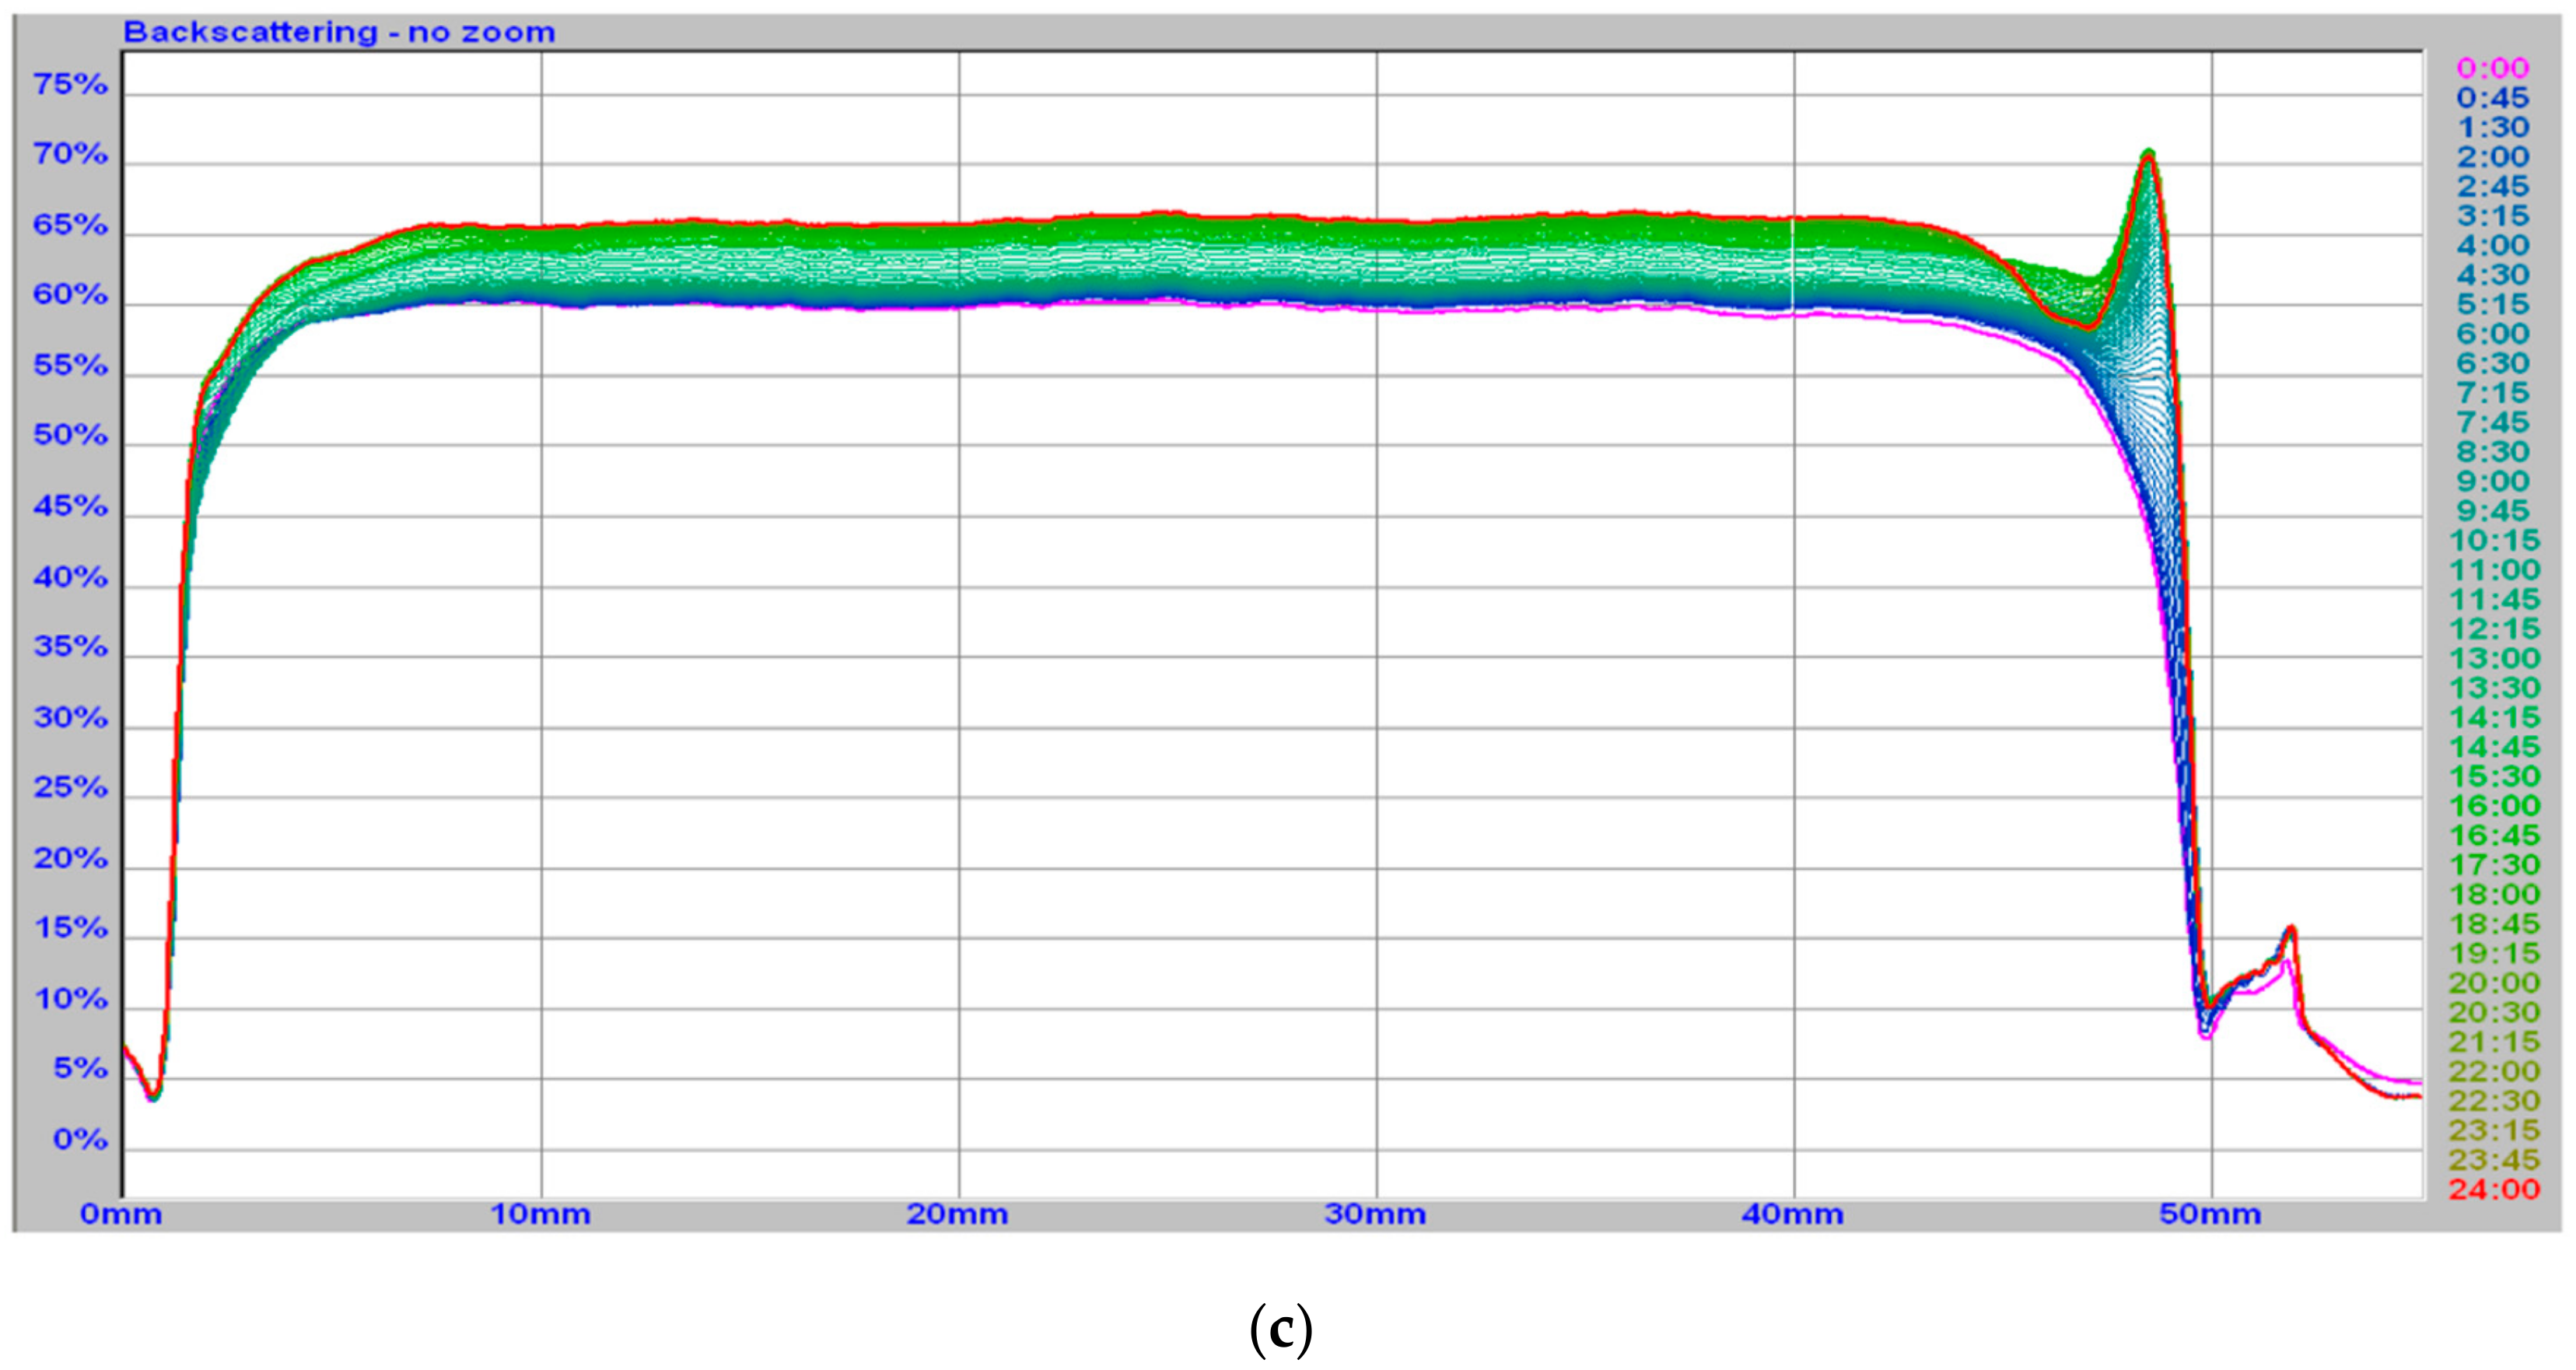
In this study, the Turbiscan was used to monitor the curly kale juice-induced coagulation of milk, since this instrument is able to detect any changes much earlier than the naked eye. The Turbiscan has previously been used to evaluate the formation of milk gels by Cynara cardunculus [25] and to assess the stability characteristics of pH-adjusted goat milk for developing ricotta cheese [26]. The Figures show the evolution of backscattering spectra during curd coagulation at 30 °C for 90 min for the samples with rennet (Figure 2a) and those with rennet and fermented curly kale juice (Figure 2b). For the sample containing only fermented curly kale juice, the process was monitored for 21 h (Figure 2c). In the case of the sample with rennet and that with rennet and fermented curly kale juice, an increased backscattering level could be observed for the first 15 min and the samples coagulated intensively, which is reflected in the scan distribution. For the sample containing only fermented curly kale juice, the backscattering was constant and the process proceeded slowly and evenly. The sample showed completely different dynamics of coagulation and there was no initial coagulation and formation of the curd network, as observed for the samples with rennet. The Turbiscan measurements confirmed our observations made earlier when cheese coagulation was carried out in the rheometer.
The Turbiscan Stability Index (TSI) is given in Table 1. The TSI value refers to stability and varies from 0 to 100. The closer to 100, the more unstable the cheese curd is. TSI is a very valuable parameter used to monitor the destabilization kinetics of systems such as cheese curds, which has been previously used to analyze changes in high-protein yoghurts during fermentation [27]. It is worth noting that, according to the TSI methodology, the sample containing milk and fermented curly kale juice was the most stable during the coagulation; cheese curds obtained with rennet and rennet with fermented curly kale juice were less stable. However, the reaction time for the latter was 90 min. The TSI values recorded for the samples containing milk with rennet and rennet with fermented curly kale juice after 90 min proved that the curd formation was faster than in the sample containing only fermented curly kale juice. The highest TSI was recorded for the curd obtained with milk and rennet, moderate TSI was found for the sample containing milk with rennet and fermented curly kale juice and the lowest value was noted for the sample obtained with milk and fermented curly kale juice.

3.2. Changes in The Physico-Chemical Composition and Microbial Population in Feta-Type Cheese during Ripening

Ripening is an example of a process of complex biofilm maturation, in which biochemical and microbiological changes take place in the curd mostly through the metabolism of residual lactose, lactate and citrate besides proteolysis and lipolysis [28].
Table 2 demonstrates changes in the physico-chemical parameters during the ripening of Feta-type cheese. A strong interaction was observed between the ripening time and the lactose concentration and pH value. The part of lactose maintained in the cheese after curd cutting was catabolized by the starter culture during the ripening period. Thus, after 16 weeks of maturation, no lactose content was detected in the Feta-type cheese, while 2.41 ± 0.11% of this carbohydrate was determined before ripening. Our finding is in agreement with previous studies that reported significant reduction in the lactose concentration during ripening [29]. The pH value in the 16-week-old cheese significantly decreased to 5.3 ± 0.05, which was due to the metabolism of LAB as in the case of lactose. Similar findings were reported by Kumar et al. [30], who found that pH of Feta-type cheese supplemented with Lactobacillus strains was around 5.19–5.3. Previous studies have reported absorption of water in high-pH cheeses (>5.2). This may be also related to the fact that amino acids are released during cheese ripening, thereby increasing the pH value [31]. The protein content decreased during storage from 25.69 ± 0.33 to 19.61 ± 0.97% of fw. The reduction in the protein content may have been a consequence of diffusion of compounds from the cheese curd to the brine during ripening. Studies conducted by Sabbagh et al. [32] and Hayaloglu et al. [33] reported a similar trend for ripened cheese. The dry matter content of the obtained cheese at the start of ripening was 58.31 ± 0.96 and decreased to 55.28 ± 0.32 throughout ripening. The decrease in the dry matter may have been a consequence of migration of various compounds from the cheese matrix to the brine. This involves breaking the peptide bonds and extended proteolysis [34]. An opposite tendency was reported for the salt content, which increased dramatically as the cheese was ripening (Table 2). In line with our findings, Bozoudi et al. [35] and Farahani et al. [36] also demonstrated a similar increasing trend in the salt content during ripening of Feta (4.5% of fw after 60 days) and Siahmazgi cheese (up to 6.49% of fw after 120 days). This salt level is probably related to the fact that when cheese is placed in brine, a dynamic process of diffusion of NaCl molecules occurs in the face of the osmotic pressure difference between the brine and cheese. Similarly, an increase in the fat content in the Feta-type cheese was also observed after the ripening process (from 49.60 ± 0.48 to 52.44 ± 0.33 of dw). Similarly, Barać et al. [37] also reported an increase in the fat content after 50 days of maturation of white cow cheese, which was probably due to the high salt content and the loss of water from the cheese matrix.
The most difficult task in the functional cheese production is survival of bacteria during the long ripening period. Therefore, 106 CFU per milliliter or gram is the most widely accepted minimum concentration of probiotic bacteria in food [38]. After the first manufacture day, the level of LAB was found to be 7.25 ± 0.24 log CFU/g, which significantly increased (7.8 ± 0.15 log CFU/g) after the ripening period. Similarly, other researchers [39,40] reported a population of lactobacilli species after ripening of approx. 8 log. On the other hand, in this same study [39], the authors reported reduction in the lactobacilli numbers after 30 days of ripening, which may be due to the development of adverse conditions of their growth.
Color is one of the most important features defining the quality of edibles. Changes in color parameters during ripening are caused by different factors such as acidification, dehydration and oxidation processes. In our study of the instrumental color parameters, lightness (L*) increased in a statistically significant way (p < 0.05) throughout the ripening process and a similar trend was observed for redness (a*). The negative value obtained for the parameter a* demonstrated that green was prevalent for both cheeses with a final value of −1.77 ± 0.02. The values of yellowness (b*) decreased significantly during cheese ripening (Table 2). Therefore, the results indicate that the analyzed Feta-type cheese gained lightness and lost yellowness during maturation, acquiring its typical whitish color (characteristic for this type of cheese) after ripening. The results of our work correspond to those reported by Delgado et al. [29] for raw goat milk cheese. The opposite tendency was observed in cow milk cheese [41]. The dissimilarities might be a consequence of small sizes of the cheese manufactured in this study and different ripening conditions. Moreover, the decrease in b* was not as significant as in other cheeses, which is associated with the presence of pigments (mostly chlorophyll and its degradation products) in the curly kale juice used for cheesemaking. However, no detailed data on the changes of pigments in chesses enriched with plant extracts are available in literature. In terms of the value of c*, which refers to saturation or intensity of color, a decrease in the color intensity was observed after the ripening period. However, the tone angle (ho) pointed to the existence of significant differences in formulation tonalities.

3.3. Texture

The texture of cheese undergoes continuous changes induced by biochemical activities that occur throughout the ripening process. The textural parameter changes shown in Table 2 clearly demonstrated that ripening had a significant impact on all tested features.
Hardness is defined by the maximum force required by a cheese cube to achieve 70% compression. The effect of the maturation time on the hardness of the Feta-type cheese manufactured with the use of curly kale juice fermented by a starter culture revealed that hardness was significantly affected (p < 0.05) by the ripening time. The maximum hardness of 6.01 ± 0.31 N was found in the cheese before the ripening, while the hardness of 4.50 ± 0.01 N was observed in the sample after 60 days of storage. This was probably related to the breakdown of casein, large peptides and oligopeptides into smaller molecules during ripening, which softened the cheese texture. Our finding is in agreement with the results of other studies [30,42,43], which found a good correlation between hardness and proteolysis and reported softening of cheese samples. On the other hand, depending on the final textures in each type of cheese, differences in the hardness of the product were observed [29].
The distance in the cheese samples during the time between the end of the first bite and the start of the second one is defined as the springiness value. In this study, the increase in cheese springiness (from 0.81 ± 0.01 to 0.87 ± 0.04 N) during ripening was found to be significant (p < 0.05). Throughout cheese storage, an increase in springiness is expected due to the residual action of the coagulant, which relaxes protein chains [44]. This is also probably associated with the increase in moisture and the decrease in cheese fat [29]. Our findings are consistent with the finding reported by Oluk et al. [45]. In contrast, studies conducted on Feta-type cheese made from buffalo milk demonstrated that springiness value decreased [30]. This may have been caused by the proteolytic activity of LAB or loss of moisture [46].
The value for cohesiveness (defined as the strength of the internal bonds of the protein matrix) increased in the cheese samples during ripening. Therefore, at the end of the storage, the value was 0.35 ± 0.04 vs. 0.20 ± 0.01 at the beginning.
Gumminess is defined as energy that is needed to disintegrate a semisolid food before it will be ready to swallow. In the present study, the effect of the ripening period on the gumminess attribute of the Feta-type cheese was found to be significant (p < 0.05). It was revealed (Table 2) that the gumminess increased (from 1.23 ± 0.14 to 1.59 ± 0.15) as the ripening period progressed up to 16 weeks. Similarly, gumminess increased during maturation of other cheeses such as Sharri cheese [47] and Tulum cheese [45]. By contrast, Kumar et al. [30] reported that gumminess of Feta-type cheese supplemented with a Lactobacillus starter culture decreased as the ripening period increased up to 60 days. Similar to the gumminess of the cheese samples, their chewiness increased during the 8-week maturation. The values of chewiness (force and energy required to chew cheese into a uniform form before swallowing) in the Feta-type cheese before and after ripening were 1.00 ± 0.09 and 1.38 ± 0.15, respectively. The increase in this parameter indicated that the storage yielded a cheese that required more energy to be chewed and ingested. Our results were in agreement with studies conducted by Delgado et al. [29] and Sulejmani [47] for goat milk and Sharri cheese, respectively.

3.4. Surface Properties of Feta-Type Cheese

The values of advancing (ѳa) and receding (ѳr) contact angles for the obtained cheeses before and after ripening were 53.6 ± 0.6/37.7 ± 6.3 and 39.6 ± 0.6/22.6 ± 1.8, respectively (Table 3). The apparent surface free energy values calculated from the hysteresis approach were 54.59 ± 2.6 and 61.77 ± 0.6 mJ/m2. The higher contact angle values measured for the cheese before ripening prove that its surface is more hydrophobic than that of the ripened sample. The higher value of energy recorded for the cheese after ripening corresponds with the more hydrophilic character of its surface. This may be related to the fact that the cheese absorbed some salt during ripening in brine, which promoted protein-water interactions, leading to hydration of the casein matrix and the higher hydrophilicity of the surface [48]. As described by Hinrichs [49], an increase in water content in the cheese matrix may be also induced by the hydrophilic properties of whey proteins. In addition, the maturation process also led to changes in the hydrophilicity of the sample. This may be a consequence of generation of hydrophilic peptides during ripening [50]. Moreover, this may also be related to the intensive proteolysis associated with the generation of hydrophilic amino acids (cysteine, alanine, valine, proline, methionine isoleucine, leucine, tyrosine, phenylalanine) (Table 4).

3.5. Analysis of the Microstructure of Cheese

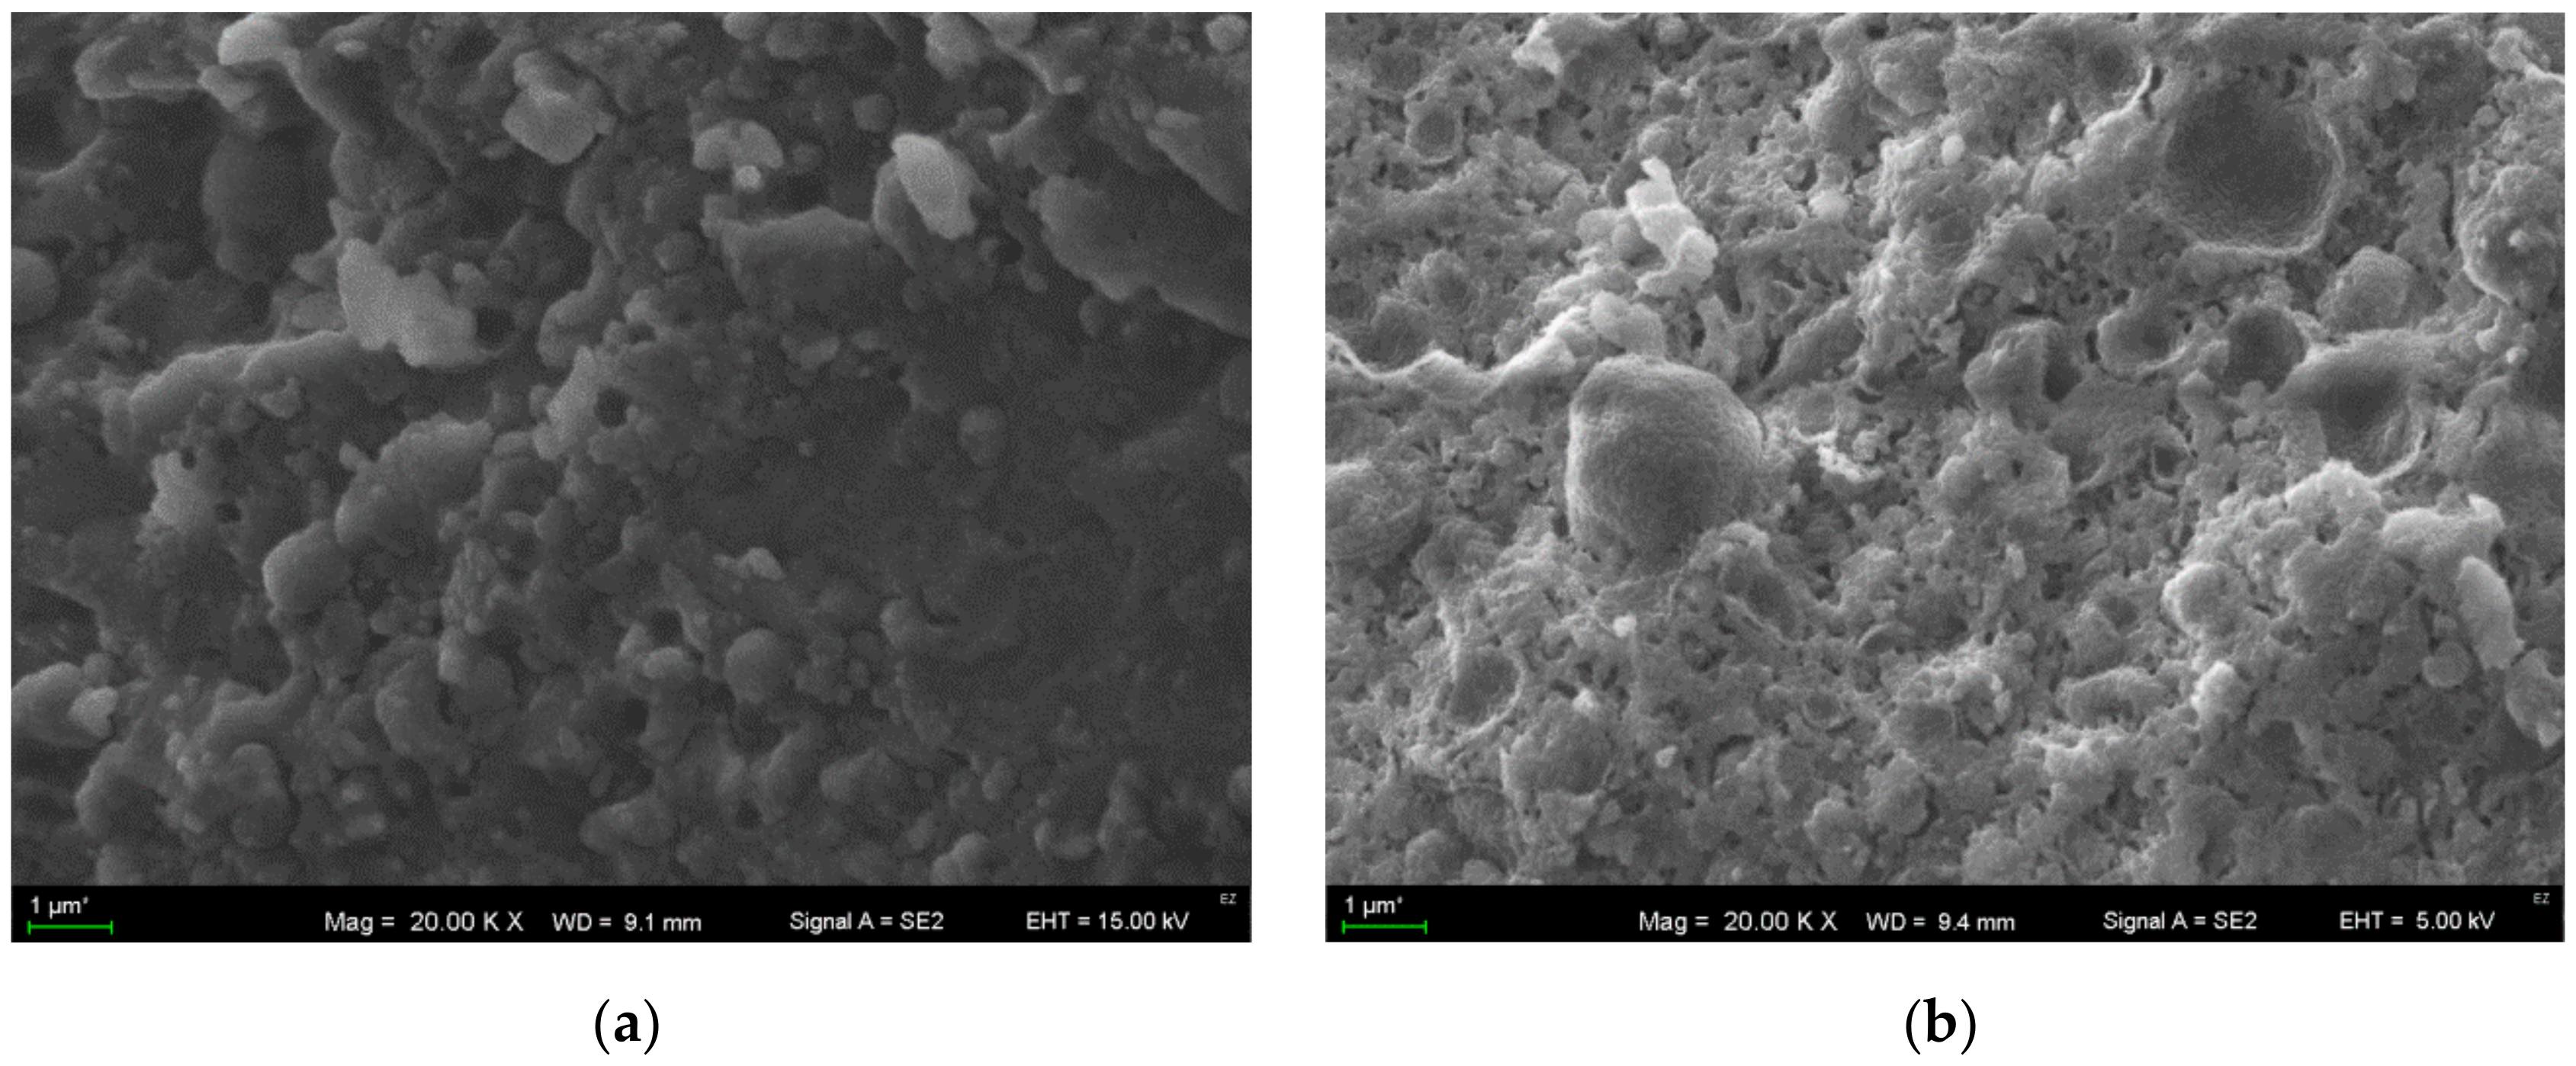
Figure 3 shows the microstructure of Feta-type cheese made with fermented curly kale juice at the 1st and 56th days of ripening. The microstructure of the 1-day fresh cheese (Figure 3a) formed a relatively homogeneous protein matrix, which was interspersed with several unevenly pore spaces. It was observed that the size and shape of these pores were irregular and asymmetrical. Significant differences were observed in the micrographs of the cheese samples analyzed after completion of the maturation process (Figure 3b). The visible cracks and the considerable number of fine pore spaces in the cheese matrix may also be the consequence of bacterial metabolic activity and secondary metabolites produced (e.g., gases). Furthermore, the brine diffusing into the cheese matrix may have also induced destruction of the primary structures of cheese, thereby enhancing the formation of a more heterogeneous structure that is observed in the final product. These results are consistent with findings described by Zhang and Zhao [51], who also observed similar changes in the structure of semi-hard cheese induced by the ripening process. Moreover, the results indicate that modifications of the microstructure of the cheese during ripening may be associated with the changes in the values of the analyzed texture parameters.

3.6. The Protein Profile in Cheeses

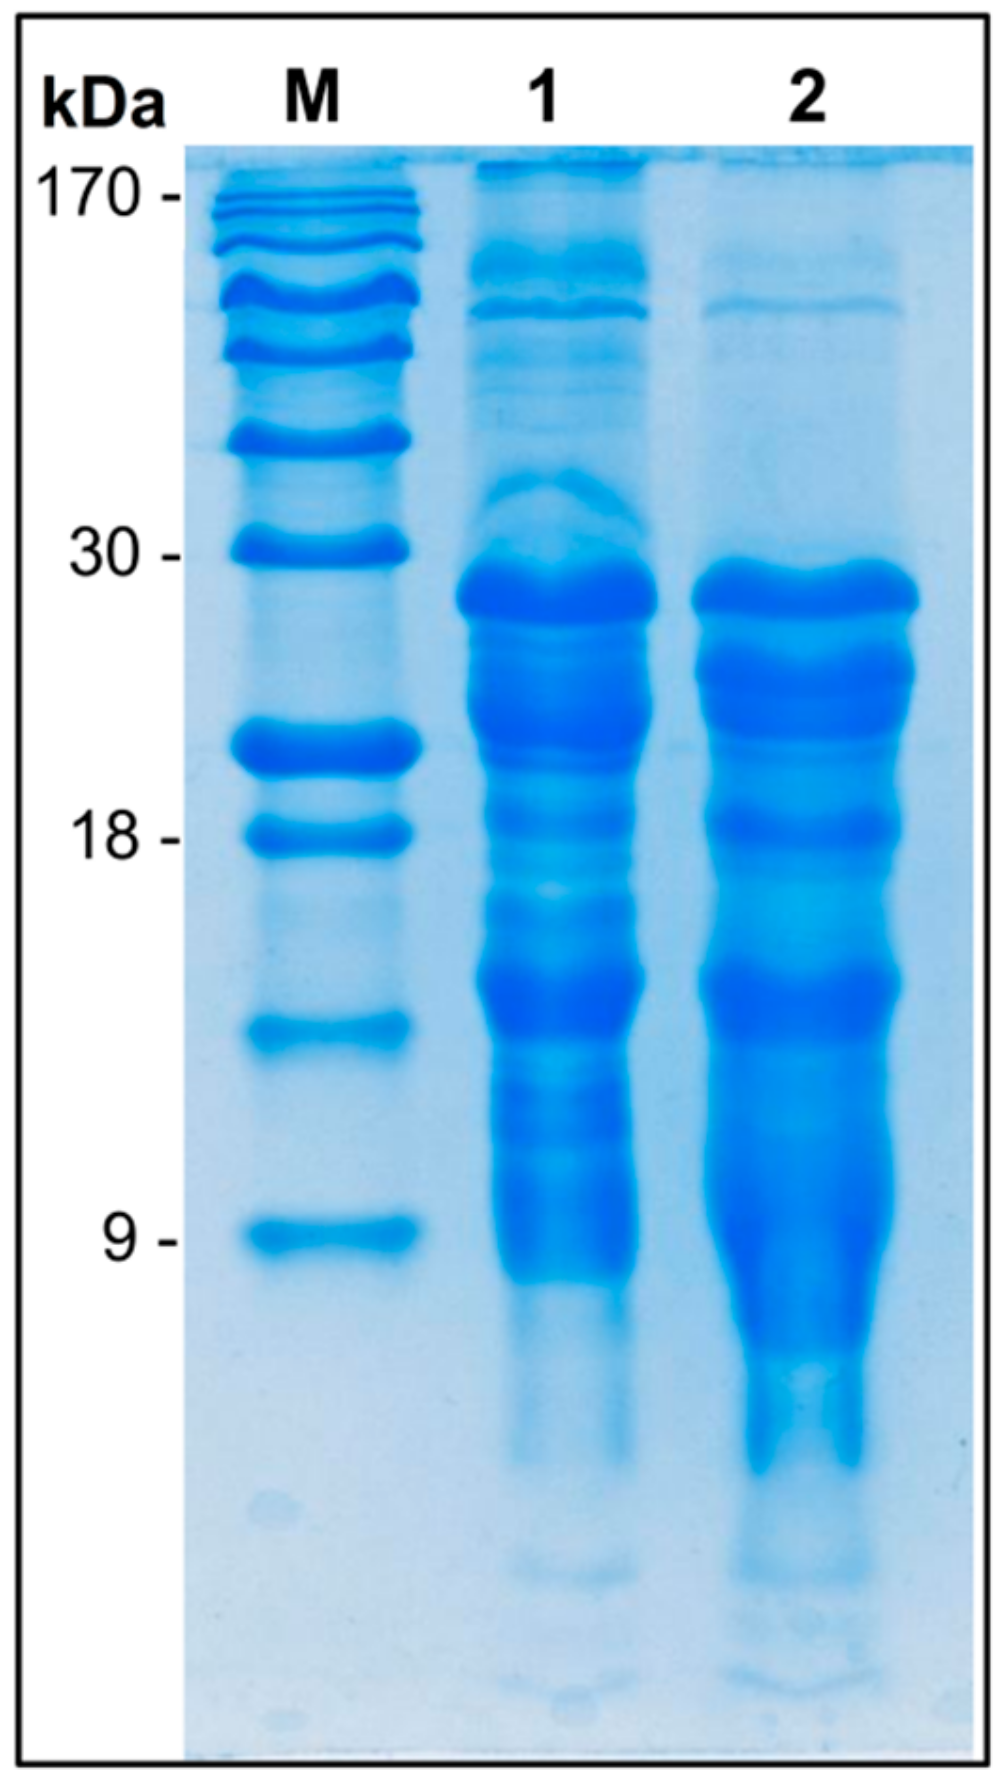
The results of protein profiles in the cheese samples analyzed by SDS-PAGE are presented in Figure 4. Comparison of electropherograms showed differences in the protein profile during cheese ripening. The results indicate that, with the progression of the cheese maturation process, the level of low molecular weight proteins increased, while the intensity as well as the amount of larger compounds decreased. The increase in the low molecular weight products after ripening was visualized by the smear, which indicated the occurrence of many peptides with similar mass. Ong et al. [52] suggested that the small molecular mass products (short peptides and amino acids) come from the activity of bacterial proteases towards products in a range from 28 to 18 kDa (casein fractions and β-lactoglobulin, respectively). During the ripening process, the intensities of bands representing αS- and β- caseins did not change considerably. These small changes can be related to the slower activity of LAB against casein, probably because of the plant origin of the strains. In turn, considering the conditions of cheese ripening (high salt content and low temperature), it can be assumed that they may cause weaker degradation of casein.

3.7. Amino Acid Composition after Ripening

Table 4 shows the evolution of free amino acids in the Feta-type cheese during ripening. The concentration of total amino acids increased significantly (p < 0.05) during ripening from 32.77 ± 1.05 mg/100 g dw to 342.90 ± 5.30 mg/100 g dw. Similar behavior was observed in other types of cheese by various authors [33,50,53,54]. This relationship observed for many types of cheese most likely indicates that some amino acids (valine, isoleucine, methionine, aspartic acid, pyroglutamic acid, alanine, glutamic acid, glycine, lysine, proline, leucine, tyrosine, serine, phenylalanine and ornithine) can be perceived as markers for monitoring the process of cheese maturation [50]. Furthermore, an increased level of amino acids may enhance cheese organoleptic properties such as aroma, taste and flavor, since amino acids are precursors of these features.
The analysis of the amino acid composition revealed that leucine, phenylalanine, valine, lysine, ornithine and glutamic acid were the most abundant compounds at the end of ripening and asparagine, aspartic acid, glutamine and methionine were absent at the beginning of the process. Increased content after ripening was observed for each of the 20 identified amino acids. The predominance of leucine, phenylalanine and valine is in agreement with the results observed for 2-month ripening Feta-type cheese [35] and in other cheeses such as Caciocavallo [53] and Gorgonzola-type [54].
Besides the similar increasing trend in the concentration of total amino acids, a high variability of these compounds is observed, which is related to the use of different milk types, seasons, manufacturing technologies and finally the conditions and duration of ripening [55]. Moreover, the release of amino acids is carried out by peptidases and proteinases of the starter culture, which means that, depending on the bacterial strains used, different concentrations of free amino acids will be detected [33,35]. For example, GABA (4-aminobutanoic acid), that is, a non-protein amino acid, can be produced irreversibly by glutamate decarboxylase. This process has been coupled with the activity of some lactobacillus species such as Lb. plantarum, Lb. brevis, Lb. paracasei, Lb. helveticus, Lb. delbruecki and Lactococcus lactis [53,56,57]. The data obtained in this study revealed a significantly higher level of GABA after ripening. It can be presumed that it was a result of the activity of the starter culture used in the cheese manufacture. GABA has recently gained attention in the food industry due to its different beneficial effects on human health, including its activity as an inhibitory neurotransmitter, hormonal regulator, blood pressure regulator and immunity enhancer. It has also been found to exert a positive effect on cancer, brain and psychiatric diseases and cardiovascular and respiratory system conditions [10,58].

3.8. Impact of Ripening on Changes in Fatty Acid Composition

The fatty acid composition of the lipid fraction from the cheese samples during ripening is presented in Table 5. Of all fatty acids identified, saturated capric (C10:0), lauric (C12:0), myristic (C14:0), palmitic (C16:0) and stearic (C18:0) acids and monounsaturated oleic (C18:0) acid were the most predominant acids in the Feta-type cheese. Similarly, these free fatty acids were also present in large quantities in Feta cheese described by Laskaridis et al. [59]. Palmitic acid with the level of 17.05 ± 0.27 and 18.65 ± 0.10 g/100 g of dw, before and after ripening, respectively, was the most abundant fatty acid in the samples and, in both cases, accounted for almost 50% of all saturated fatty acids (SFA). During the ripening process, a significant increase in the level of SFA, MUFA (monounsaturated fatty acids) and PUFA (polyunsaturated fatty acids) was noted. It is worth noting that unsaturated fatty acids have been reported as useful in prevention of cardiovascular and some inflammatory diseases [60]. Among SFA, short-chain fatty acids decreased during ripening, while medium-chain fatty acids were stable during ripening, except capric acid (C10:0). In contrast, the content of long-chain fatty acids increased at the end of ripening. The changes in the fatty acid profile in the cheese during manufacturing may be a consequence of the lipolytic and esterolytic activities of the starter culture used, since LAB are able to produce enzymes that can release fatty acids [30,61].

4. Conclusions

This study aimed to investigate the possibility of using curly kale juice to manufacture Feta-type cheese and monitor its changes caused by ripening. The results showed that the Feta-type cheese had significantly changed physico-chemical properties, amino acid composition, fatty acid profile, texture and microstructure as a result of ripening. Our preliminary rheological studies demonstrated that the addition of fermented curly kale juice to the milk sample with rennet resulted in accelerated curd formation and yielded stronger curd compared to the sample supplemented with rennet alone. Besides, Turbiscan measurements allow precise determination of the dynamics of curd formation, which may be very useful in the preparation of future cheese formulas.
Fermented curly kale juice can be a potential and effective coagulant; however, its application requires a longer reaction time. However, for better assessment of the new Feta-type cheese, consumer studies should also be conducted in the near future. Given the growing global interest in healthy food, the nutritional benefits of curly kale, the probiotic and technological aspects of fermentation and the proteolytic activity of this vegetable, it is possible to obtain new promising fermented dairy products with functional properties.

Author Contributions

Conceptualization, M.M., K.S., A.W. and M.P.-B.; methodology, M.M., K.S. and M.N.; formal analysis, M.M. and K.S.; investigation, M.M., K.S., M.N., K.T. and T.S.; writing—original draft preparation, M.M., K.S. and M.N.; writing—review and editing, M.M. and M.P.-B.; visualization, M.M. and M.N.; supervision, M.P.-B.; project administration, M.P.-B.All authors have read and agreed to the published version of the manuscript.

Funding

Project financed under the program of the Minister of Science and Higher Education under the name “Regional Initiative of Excellence” in 2019–2022 project number 029/RID/2018/19 funding amount 11 927 330.00 PLN.

Conflicts of Interest

The authors declare no conflict of interest.

References

  1. Beganović, J.; Kos, B.; Leboš Pavunc, A.; Uroić, K.; Jokić, M.; Šušković, J. Traditionally produced sauerkraut as source of autochthonous functional starter cultures. Microbiol. Res. 2014, 169, 623–632. [Google Scholar] [CrossRef] [PubMed]
  2. Henning, S.M.; Yang, J.; Shao, P.; Lee, R.-P.; Huang, J.; Ly, A.; Hsu, M.; Lu, Q.-Y.; Thames, G.; Heber, D.; et al. Health benefit of vegetable/fruit juice-based diet: Role of microbiome. Sci. Rep. 2017, 7, 2167. [Google Scholar] [CrossRef] [PubMed] [Green Version]
  3. Biegańska-Marecik, R.; Radziejewska-Kubzdela, E.; Marecik, R. Characterization of phenolics, glucosinolates and antioxidant activity of beverages based on apple juice with addition of frozen and freeze-dried curly kale leaves (Brassica oleracea L. var. acephala L.). Food Chem. 2017, 230, 271–280. [Google Scholar]
  4. Olsen, H.; Grimmer, S.; Aaby, K.; Saha, S.; Borge, G.I.A. Antiproliferative effects of fresh and thermal processed green and red cultivars of curly kale (Brassica oleracea L. convar. acephala var. sabellica). J. Agric. Food Chem. 2012, 60, 7375–7383. [Google Scholar] [CrossRef] [PubMed]
  5. Ferreres, F.; Fernandes, F.; Sousa, C.; Valentão, P.; Pereira, J.A.; Andrade, P.B. Metabolic and bioactivity insights into Brassica oleracea var. acephala. J. Agric. Food Chem. 2009, 57, 8884–8892. [Google Scholar] [CrossRef] [PubMed]
  6. Šamec, D.; Urlić, B.; Salopek-Sondi, B. Kale (Brassica oleracea var. acephala) as a superfood: Review of the scientific evidence behind the statement. Crit. Rev. Food Sci. Nutr. 2018, 59, 2411–2422. [Google Scholar]
  7. Michalak, M.; Szwajgier, D.; Paduch, R.; Kukula-Koch, W.; Waśko, A.; Polak-Berecka, M. Fermented curly kale as a new source of gentisic and salicylic acids with antitumor potential. J. Funct. Foods 2020, 67, 103866. [Google Scholar] [CrossRef]
  8. Han, Q.; Kong, B.; Chen, Q.; Sun, F.; Zhang, H. In vitro comparison of probiotic properties of lactic acid bacteria isolated from Harbin dry sausages and selected probiotics. J. Funct. Foods 2017, 32, 391–400. [Google Scholar] [CrossRef]
  9. Hashemi, S.M.B.; Mousavi Khaneghah, A.; Barba, F.J.; Nemati, Z.; Sohrabi Shokofti, S.; Alizadeh, F. Fermented sweet lemon juice (Citrus limetta) using Lactobacillus plantarum LS5: Chemical composition, antioxidant and antibacterial activities. J. Funct. Foods 2017, 38, 409–414. [Google Scholar] [CrossRef]
  10. Frias, J.; Martinez-Villaluenga, C.; Peñas, E. Fermented Foods in Health and Disease Prevention; Elsevier: Amsterdam, The Netherlands, 2017; ISBN 9780128025499. [Google Scholar]
  11. Le Boucher, C.; Courant, F.; Jeanson, S.; Chereau, S.; Maillard, M.-B.; Royer, A.-L.; Thierry, A.; Dervilly-Pinel, G.; Le Bizec, B.; Lortal, S. First mass spectrometry metabolic fingerprinting of bacterial metabolism in a model cheese. Food Chem. 2013, 141, 1032–1040. [Google Scholar] [CrossRef] [PubMed]
  12. Gurumallesh, P.; Alagu, K.; Ramakrishnan, B.; Muthusamy, S. A systematic reconsideration on proteases. Int. J. Biol. Macromol. 2019, 128, 254–267. [Google Scholar] [CrossRef] [PubMed]
  13. Shah, M.A.; Mir, S.A.; Paray, M.A. Plant proteases as milk-clotting enzymes in cheesemaking: A review. Dairy Sci. Technol. 2014, 94, 5–16. [Google Scholar] [CrossRef]
  14. Choi, J.H.; Kim, D.W.; Park, S.E.; Choi, B.S.; Sapkota, K.; Kim, S.; Kim, S.J. Novel thrombolytic protease from edible and medicinal plant Aster yomena (Kitam.) Honda with anticoagulant activity: Purification and partial characterization. J. Biosci. Bioeng. 2014, 118, 372–377. [Google Scholar] [CrossRef] [PubMed]
  15. Mnif, I.H.; Siala, R.; Nasri, R.; Mhamdi, S.; Nasri, M.; Kamoun, A.S. A Cysteine Protease Isolated from the Latex of Ficus microcarpa: Purification and Biochemical Characterization. Appl. Biochem. Biotechnol. 2015, 175, 1732–1744. [Google Scholar] [CrossRef] [PubMed]
  16. Siritapetawee, J.; Sojikul, P.; Klaynongsruang, S. Biochemical characterization of a new glycosylated protease from Euphorbia cf. lactea latex. Plant Physiol. Biochem. 2015, 92, 30–38. [Google Scholar] [CrossRef] [PubMed]
  17. Shi, Y.; Prabakusuma, A.S.; Zhao, Q.; Wang, X.; Huang, A. Proteomic analysis of Moringa oleifera Lam. leaf extract provides insights into milk-clotting proteases. LWT 2019, 109, 289–295. [Google Scholar] [CrossRef]
  18. Sun, Q.; Zhang, B.; Yan, Q.J.; Jiang, Z.Q. Comparative analysis on the distribution of protease activities among fruits and vegetable resources. Food Chem. 2016, 213, 708–713. [Google Scholar] [CrossRef] [PubMed]
  19. Michalak, M.; Kubik-Komar, A.; Waśko, A.; Polak-Berecka, M. Starter culture for curly kale juice fermentation selected using principal component analysis. Food Biosci. 2020, 35, 100602. [Google Scholar] [CrossRef]
  20. Michalak, M.; Gustaw, K.; Waśko, A.; Polak-Berecka, M. Composition of lactic acid bacteria during spontaneous curly kale (Brassica oleracea var. sabellica) fermentation. Microbiol. Res. 2018, 206, 121–130. [Google Scholar] [CrossRef] [PubMed]
  21. Sołowiej, B. Evaluation of rheological propertied of reduced-fat processed cheese analogues. Zywnosc. Nauka. Technol. Jakosc 2012, 80, 60–71. [Google Scholar]
  22. Laemmli, U.K. Cleavage of structural proteins during the assembly of the head of bacteriophage T4. Nature 1970, 227, 680–685. [Google Scholar] [CrossRef] [PubMed]
  23. Jia, S.; Kang, Y.P.; Park, J.H.; Lee, J.; Kwon, S.W. Simultaneous determination of 23 amino acids and 7 biogenic amines in fermented food samples by liquid chromatography/quadrupole time-of-flight mass spectrometry. J. Chromatogr. A 2011, 1218, 9174–9182. [Google Scholar] [CrossRef] [PubMed]
  24. Skrzypczak, K.; Gustaw, W.; Waśko, A. Wybrane właściwości technologiczne i probiotyczne szczepów z gatunku Lactobacillus helveticus. Zywnsoc. Nauka. Technol. Jakosc 2015, 22, 61–72. [Google Scholar]
  25. Ben Amira, A.; Makhlouf, I.; Flaviu Petrut, R.; Francis, F.; Bauwens, J.; Attia, H.; Besbes, S.; Blecker, C. Effect of extraction pH on techno-functional properties of crude extracts from wild cardoon (Cynara cardunculus L.) flowers. Food Chem. 2017, 225, 258–266. [Google Scholar] [CrossRef] [PubMed]
  26. Wu, C.-S.; Guo, J.-H.; Lin, M.-J. Stability evaluation of pH-adjusted goat milk for developing Ricotta cheese with a mixture of cow cheese whey and goat milk. Foods 2020, 9, 366. [Google Scholar] [CrossRef] [PubMed] [Green Version]
  27. Nastaj, M.; Sołowiej, B.G.; Gustaw, W.; Peréz-Huertas, S.; Mleko, S.; Wesołowska-Trojanowska, M. Physicochemical properties of High-Protein-Set Yoghurts obtained with the addition of whey protein preparations. Int. J. Dairy Technol. 2019, 72, 395–402. [Google Scholar] [CrossRef]
  28. Castro, J.M.; Tornadijo, M.E.; Fresno, J.M.; Sandoval, H. Biocheese: A food probiotic carrier. Biomed. Res. Int. 2015, 2015, 1–11. [Google Scholar] [CrossRef] [PubMed]
  29. Delgado, F.J.; González-Crespo, J.; Cava, R.; Ramírez, R. Proteolysis, texture and colour of a raw goat milk cheese throughout the maturation. Eur. Food Res. Technol. 2011, 233, 483–488. [Google Scholar] [CrossRef]
  30. Kumar, S.; Kanawjia, S.K.; Kumar, S. Incorporation of Lactobacillus adjuncts culture to improve the quality of Feta-type cheese made using buffalo milk. J. Food Sci. Technol. 2015, 52, 5021–5029. [Google Scholar] [CrossRef] [PubMed] [Green Version]
  31. Karami, M.; Ehsani, M.R.; Mousavi, S.M.; Rezaei, K.; Safari, M. Changes in the rheological properties of Iranian UF-Feta cheese during ripening. Food Chem. 2009, 112, 539–544. [Google Scholar] [CrossRef]
  32. Sabbagh, N.; Gheisari, H.R.; Aminlari, M. Monitoring the chemical and microbiological changes during ripening of Iranian probiotic low-fat white cheese. Am. J. Anim. Veter. Sci. 2010, 5, 249–257. [Google Scholar] [CrossRef] [Green Version]
  33. Hayaloglu, A.A.; Guven, M.; Fox, P.F.; McSweeney, P.L.H. Influence of starters on chemical, biochemical, and sensory changes in Turkish White-brined cheese during ripening. J. Dairy Sci. 2005, 88, 3460–3474. [Google Scholar] [CrossRef]
  34. Shahab Lavasani, A.R.; Ehsani, M.R.; Mirdamadi, S.; Ebrahim Zadeh Mousavi, M.A. Changes in physicochemical and organoleptic properties of traditional Iranian cheese Lighvan during ripening. Int. J. Dairy Technol. 2012, 65, 64–70. [Google Scholar] [CrossRef]
  35. Bozoudi, D.; Kondyli, E.; Claps, S.; Hatzikamari, M.; Michaelidou, A.; Biliaderis, C.G.; Litopoulou-Tzanetaki, E. Compositional characteristics and volatile organic compounds of traditional PDO Feta cheese made in two different mountainous areas of Greece. Int. J. Dairy Technol. 2018, 71, 673–682. [Google Scholar] [CrossRef]
  36. Farahani, G.; Ezzatpanah, H.; Abbasi, S. Characterization of Siahmazgi cheese, an Iranian ewe’s milk variety: Assessment of physico-chemical, textural and rheological specifications during ripening. LWT Food Sci. Technol. 2014, 58, 335–342. [Google Scholar] [CrossRef]
  37. Barać, M.; Smiljanić, M.; Žilić, S.; Pešić, M.; Stanojević, S.; Vasić, M.; Vučić, T. Proteinski profili i ukupni antioksidativni kapacitet u vodi topljivih i netopljivih proteinskih frakcija bijelog sira u salamuri u razlicitim fazama zrenja. Mljekarstvo 2016, 66, 187–197. [Google Scholar] [CrossRef] [Green Version]
  38. Plessas, S.; Bosnea, L.; Alexopoulos, A.; Bezirtzoglou, E. Potential effects of probiotics in cheese and yogurt production: A review. Eng. Life Sci. 2012, 12, 433–440. [Google Scholar] [CrossRef]
  39. Dimitrellou, D.; Kandylis, P.; Sidira, M.; Koutinas, A.A.; Kourkoutas, Y. Free and immobilized Lactobacillus casei ATCC 393 on whey protein as starter cultures for probiotic Feta-type cheese production. J. Dairy Sci. 2014, 97, 4675–4685. [Google Scholar] [CrossRef] [PubMed]
  40. Terpou, A.; Mantzourani, I.; Galanis, A.; Kanellaki, M.; Bezirtzoglou, E.; Bekatorou, A.; Koutinas, A.; Plessas, S. Employment of L. paracasei K5 as a novel potentially probiotic freeze-dried starter for Feta-type cheese production. Microorganisms 2018, 7, 3. [Google Scholar] [CrossRef] [PubMed] [Green Version]
  41. Nedomová, Š.; Kilián, L.; Pytel, R.; Kumbár, V. Effect of ripening time on colour and texture properties in cheese. Potravin. Slovak J. Food Sci. 2017, 11, 296–301. [Google Scholar] [CrossRef] [Green Version]
  42. Kumar, S.; Kanawjia, S.K.; Kumar, S.; Khatkar, S. Effect of rate of addition of starter culture on textural characteristics of buffalo milk Feta type cheese during ripening. J. Food Sci. Technol. 2014, 51, 800–804. [Google Scholar] [CrossRef] [PubMed] [Green Version]
  43. Farbod, F.; Kalbasi, A.; Moini, S.; Emam-Djomeh, Z.; Razavi, H.; Mortazavi, A. Effects of storage time on compositional, micro-structural, rheological and sensory properties of low fat Iranian UF-Feta cheese fortified with fish oil or fish oil powder. J. Food Sci. Technol. 2015, 52, 1372–1382. [Google Scholar] [CrossRef] [PubMed]
  44. Pinto, M.S.; de Carvalho, A.F.; dos Pires, A.C.S.; de Paula, J.C.J.; Sobral, D.; Magalhães, F.A.R. Survival of Listeria innocua in Minas Traditional Serro cheese during ripening. Food Control. 2009, 20, 1167–1170. [Google Scholar] [CrossRef]
  45. Oluk, A.C.; Güven ven, M.; Hayaloglu, A.A. Proteolysis texture and microstructure of low-fat Tulum cheese affected by exopolysaccharide-producing cultures during ripening. Int. J. Food Sci. Technol. 2014, 49, 435–443. [Google Scholar] [CrossRef]
  46. Pena-Serna, C.; Penna, A.L.B.; Lopes Filho, J.F. Zein-based blend coatings: Impact on the quality of a model cheese of short ripening period. J. Food Eng. 2016, 171, 208–213. [Google Scholar] [CrossRef] [Green Version]
  47. Sulejmani, E. Changes in volatile compounds, microstructure and texture of sharri cheese during maturation. J. Nutr. Food Res. Technol. 2018, 1, 6–12. [Google Scholar] [CrossRef] [Green Version]
  48. Lamichhane, P.; Kelly, A.L.; Sheehan, J.J. Symposium review: Structure-function relationships in cheese. J. Dairy Sci. 2018, 101, 2692–2709. [Google Scholar] [CrossRef] [PubMed]
  49. Hinrichs, J. Incorporation of whey proteins in cheese. Int. Dairy J. 2001, 11, 495–503. [Google Scholar] [CrossRef]
  50. Ochi, H.; Sakai, Y.; Koishihara, H.; Abe, F.; Bamba, T.; Fukusaki, E. Monitoring the ripening process of Cheddar cheese based on hydrophilic component profiling using gas chromatography-mass spectrometry. J. Dairy Sci. 2013, 96, 7427–7441. [Google Scholar] [CrossRef] [PubMed] [Green Version]
  51. Zhang, N.; Zhao, X.H. Study of Mucor spp. in semi-hard cheese ripening. J. Food Sci. Technol. 2010, 47, 613–619. [Google Scholar] [CrossRef] [PubMed] [Green Version]
  52. Ong, K.L.; Cheung, B.M.Y.; Man, Y.B.; Lau, C.P.; Lam, K.S.L. Prevalence, awareness, treatment, and control of hypertension among United States adults 1999–2004. Hypertension 2007, 49, 69–75. [Google Scholar] [CrossRef] [PubMed] [Green Version]
  53. Niro, S.; Succi, M.; Tremonte, P.; Sorrentino, E.; Coppola, R.; Panfili, G.; Fratianni, A. Evolution of free amino acids during ripening of Caciocavallo cheeses made with different milks. J. Dairy Sci. 2017, 100, 9521–9531. [Google Scholar] [CrossRef] [PubMed] [Green Version]
  54. Moreira, G.M.M.; Costa, R.G.B.; Teodoro, V.A.M.; Paula, J.C.J.; Sobral, D.; Fernandes, C.; Gloria, M.B.A. Effect of ripening time on proteolysis, free amino acids, bioactive amines and texture profile of Gorgonzola-type cheese. LWT 2018, 98, 583–590. [Google Scholar] [CrossRef]
  55. Eren-Vapur, U.; Ozcan, T. Determination of free amino acids in whole-fat Turkish White Brined Cheese produced by animal and microbial milk-clotting enzymes with and without the addition of starter culture. Mljekarstvo 2012, 62, 241–250. [Google Scholar]
  56. Diana, M.; Rafecas, M.; Arco, C.; Quílez, J. Free amino acid profile of Spanish artisanal cheeses: Importance of gamma-aminobutyric acid (GABA) and ornithine content. J. Food Compos. Anal. 2014, 35, 94–100. [Google Scholar] [CrossRef]
  57. Siragusa, S.; De Angelis, M.; Di Cagno, R.; Rizzello, C.G.; Coda, R.; Gobbetti, M. Synthesis of γ-aminobutyric acid by lactic acid bacteria isolated from a variety of Italian cheeses. Appl. Environ. Microbiol. 2007, 73, 7283–7290. [Google Scholar] [CrossRef] [PubMed] [Green Version]
  58. Saidi, V.; Sheikh-Zeinoddin, M.; Kobarfard, F.; Soleimanian-Zad, S. Bioactive characteristics of a semi-hard non-starter culture cheese made from raw or pasteurized sheep’s milk. 3 Biotech 2020, 10, 85. [Google Scholar] [CrossRef] [PubMed]
  59. Laskaridis, K.; Serafeimidou, A.; Zlatanos, S.; Gylou, E.; Kontorepanidou, E.; Sagredos, A. Changes in fatty acid profile of feta cheese including conjugated linoleic acid. J. Sci. Food Agric. 2013, 93, 2130–2136. [Google Scholar] [CrossRef] [PubMed]
  60. Cossignani, L.; Giua, L.; Urbani, E.; Simonetti, M.S.; Blasi, F. Fatty acid composition and CLA content in goat milk and cheese samples from Umbrian market. Eur. Food Res. Technol. 2014, 239, 905–911. [Google Scholar] [CrossRef]
  61. Collins, Y.F.; McSweeney, P.L.H.; Wilkinson, M.G. Lipolysis and free fatty acid catabolism in cheese: A review of current knowledge. Int. Dairy J. 2003, 13, 841–866. [Google Scholar] [CrossRef]
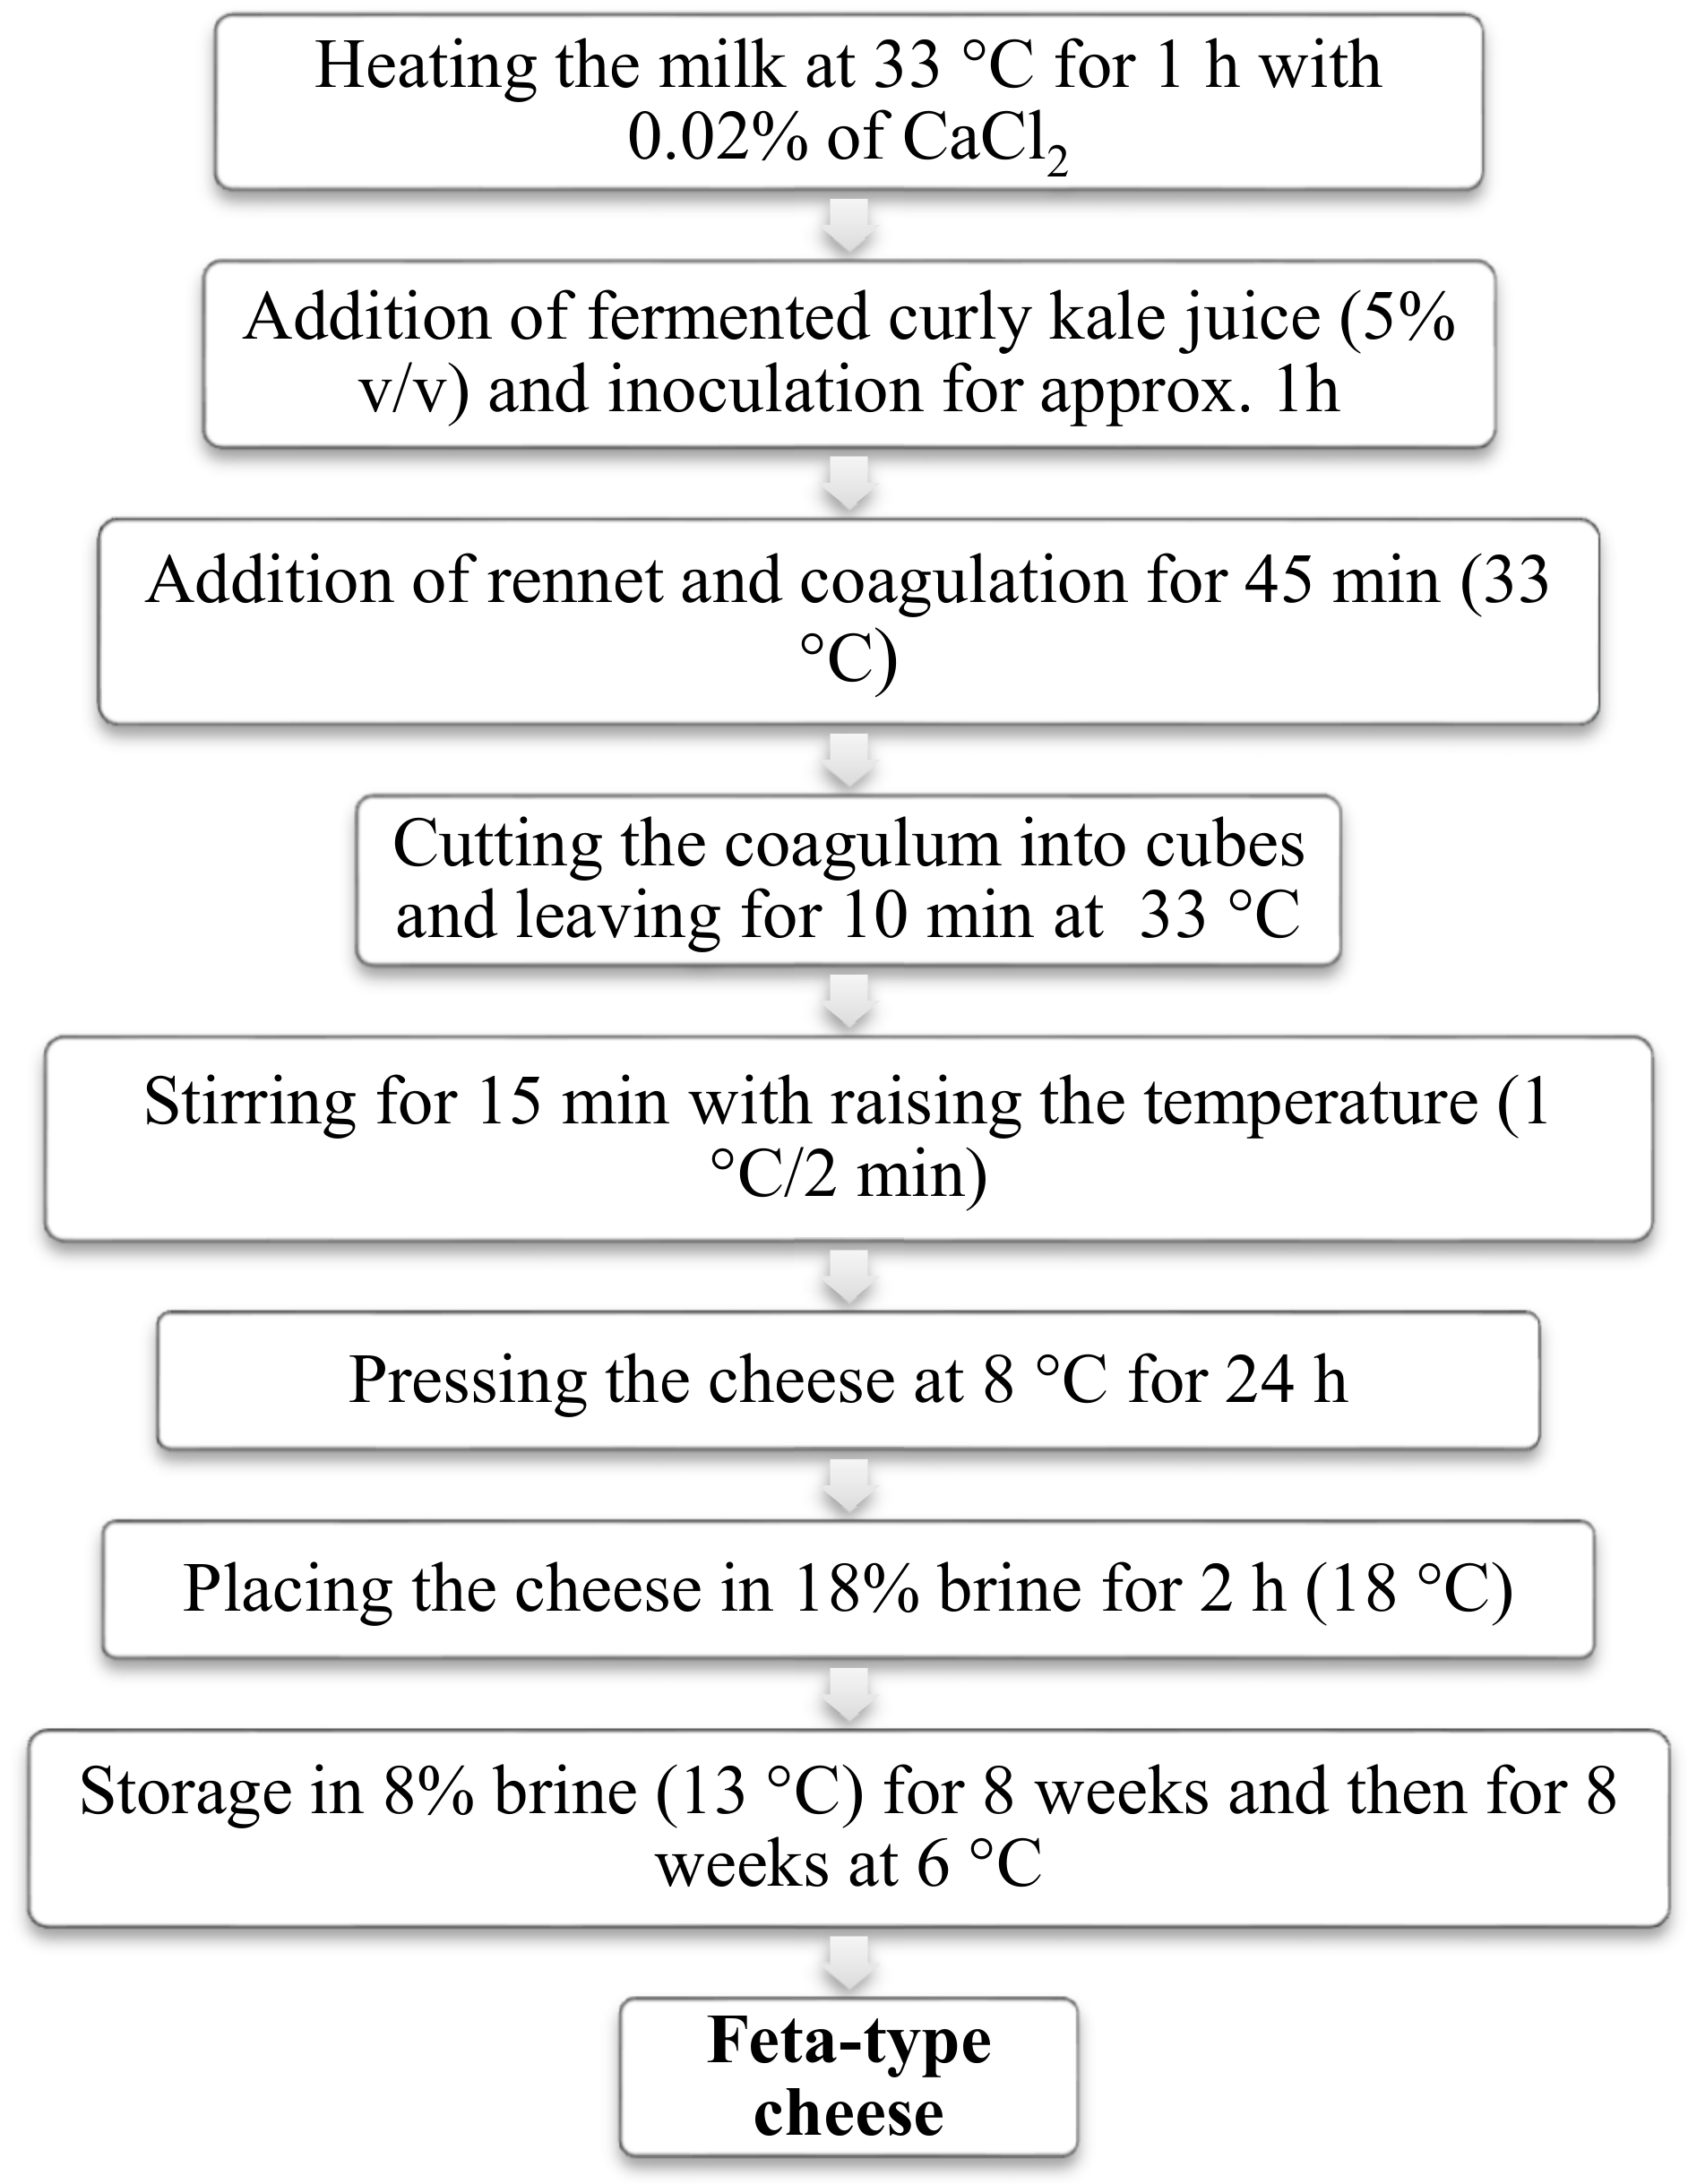
Figure 1. Diagram of Feta-type cheese production.
Applsci 10 04020 g001
Figure 2. Evolution of backscattering spectra during curd coagulation for milk with rennet (a), milk with rennet and fermented juice (b) and milk with fermented curly kale juice (c).
Applsci 10 04020 g002aApplsci 10 04020 g002b
Figure 3. Scanning electron microscopy (SEM) images at magnification × 2000 of Feta-type cheese structure before ripening (a) and after 16 weeks of ripening (b).
Applsci 10 04020 g003
Figure 4. Protein separation products obtained from SDS-PAGE (sodium dodecyl sulphate-polyacrylamide gel electrophoresis) analysis. Lane M contains a protein molecular weight marker. Lane 1 and 2—cheese samples before and after ripening, respectively.
Applsci 10 04020 g004
Table 1. Effect of addition of rennet and curly kale juice on the rheological parameters of cheese curds.
Type of SampleDuration of StudyGel TimePhase Angle ValueG’G’’Turbiscan Stability Index
Milk with rennet90 min1800 s/6 min32.510.120.0823.6
Milk with rennet and fermented curly kale juice90 min1200 s/4 min34.820.100.0721.4
Milk with fermented curly kale juice 21 h39900 s/665 min43.280.160.1520.6
G’—storage modulus; G”—loss modulus.
Table 2. Comparison of selected physico-chemical composition, microbial population and texture parameters of cheeses analyzed at different stages of the ripening process.
Analyzed Manufacture Stage
Cheese before RipeningCheese after Ripening
Physico-chemical composition
pH6.73 ± 0.01 b5.3 ± 0.05 a
Dry matter (%)58.31 ± 0.96 b55.28 ± 0.32 a
Lactose (% of dw)2.41 ± 0.11 b0.00 ± 0.00 a
Protein (% of dw)25.69 ± 0.33 b19.61 ± 0.97 a
Salt (%of dw)0.67 ± 0.08 a4.98 ± 0.72 b
Fat (% of dw)49.60 ± 0.48 a52.44 ± 0.33 b
Microbiological analysis
Log (CFU/g)7.25 ± 0.24 a7.8 ± 0.15 b
Color parameter
L*88.55 ± 0.35 a89.42 ± 0.27 b
a*−1.89 ± 0.04 a−1.77 ± 0.02 b
b*17.27 ± 0.48 b15.03 ± 0.19 a
c*17.37 ± 0.48 b15.14 ± 0.18 a
95.90 ± 0.13 a97.83 ± 0.47 b
Textural properties
Hardness (N)6.01 ± 0.31 b4.50 ± 0.01a
Fracturability7.89 ± 1.26 b5.75 ± 0.29 a
Springiness0.81 ± 0.01 a0.87 ± 0.04 b
Cohesiveness0.20 ± 0.01 a0.35 ± 0.04 b
Gumminess 1.23 ± 0.14 a1.59 ± 0.15 b
Chewiness 1.00 ± 0.09 a1.38 ± 0.15 b
The results are given as mean values ± standard deviation. The uppercase letters (a,b) in the same row express significant differences (p < 0.05) between the cheese samples for the measured parameter. fw—fresh weight, dw—dry weight.
Table 3. Advancing (Ѳa) and receding (Ѳr) contact angles measured for the cheese samples.
Contact Angles
SampleCAHѲaѲr
Cheese before ripening54.59 ± 2.6 a53.6 ± 0.6 b37.7 ± 6.3 b
Cheese after ripening61.77 ± 0.6 b39.6 ± 0.6 a22.6 ± 1.8 a
The results are given as mean values ± standard deviation. The uppercase letters (a,b) in the same column express significant differences (p < 0.05) between the cheese samples for the measured parameter.
Table 4. Amino acid composition (mg/100 g dw) between two stages of Feta-type cheese ripening.
Amino AcidAnalyzed Manufacture Stage
Cheese before RipeningCheese after Ripening
Alanine3.09 ± 0.08 a15.03 ± 0.81 b
Arginine2.38 ± 0.25 a5.84 ± 0.15 b
Asparagine0.00 ± 0.00 a19.79 ± 0.76 b
Aspartic acid0.00 ± 0.00 a7.19 ± 0.09 b
GABA1.54 ± 0.06 a22.04 ± 0.69 b
Glutamine0.00 ± 0.00 a11.49 ± 0.85 b
Glutamic acid3.64 ± 0.20 a24.08 ± 1.29 b
Glycine0.68 ± 0.05 a5.75 ± 0.11 b
Histidine0.79 ± 0.08 a5.36 ± 0.15 b
Isoleucine0.40 ± 0.02 a14.74 ± 0.31 b
Leucine3.16 ± 0.15 a41.35 ± 0.26 b
Lysine4.32 ± 0.38 a29.05 ± 0.84 b
Ornithine2.34 ± 0.07 a27.28 ± 0.67 b
Methionine0.00 ± 0.00 a3.82 ± 0.11 b
Phenylalanine2.87 ± 0.07 a36.29 ± 0.86 b
Proline1.34 ± 0.05 a8.74 ± 0.27 b
Serine1.51 ± 0.09 a13.42 ± 0.37 b
Threonine0.99 ± 0.02 a12.12 ± 0.52 b
Tyrosine0.89 ± 0.03 a5.84 ± 0.17 b
Valine2.83 ± 0.16 a33.67 ± 0.52 b
Total32.77 ± 1.05 a342.90 ± 5.30 b
Mean values ± SD. Results with a different letter in the same row are significantly different (p < 0.05).
Table 5. Fatty acids (g/100 g dw) detected in Feta-type cheese during ripening by the GC-MS (gas chromatography–mass spectrometry) technique.
CompoundAnalyzed Manufacture Stage
Cheese before RipeningCheese after Ripening
C6:00.43 ± 0.01 b0.39 ± 0.01 a
C8:00.58 ± 0.01 b0.50 ± 0.04 a
C10:01.79 ± 0.10 b1.61 ± 0.03 a
C12:02.12 ± 0.04 a2.15 ± 0.05 a
C13:00.07 ± 0.01 a0.08 ± 0.01 a
C14:06.25 ± 0.04 a6.74 ± 0.039 a
C14:C1n50.54 ± 0.03 a0.59 ± 0.01 a
C15:00.68 ± 0.03 a0.73 ± 0.01 a
C16:017.05 ± 0.27 a18.65 ± 0.10 b
C16:ln70.88 ± 0.05 a0.95 ± 0.00 a
C17:00.33 ± 0.01 a0.37 ± 0.02 b
C18:04.69 ± 0.06 a5.07 ± 0.15 b
C18:ln9c + C18:ln9t9.90 ± 0.06 a10.68 ± 0.023 b
C18:2n6c + C18:2n6t1.16 ± 0.05 a1.29 ± 0.02 b
C18:3n3 (alpha)0.20 ± 0.01 a0.21 ± 0.01 a
C20:00.00 ± 0.00 a0.07 ± 0.01 b
C20:3n60.00 ± 0.00 a0.04 ± 0.00 b
C20:4n60.07 ± 0.01 a0.09 ± 0.01 a
SFA34.00 ± 0.30 a36.36 ± 0.17 b
MUFA11.32 ± 0.03 a 12.22 ± 0.023 b
PUFA1.43 ± 0.04 a1.63 ± 0.04 b
OMEGA 30.20 ± 0.01 a0.21 ± 0.01 a
OMEGA 61.23 ± 0.05 a1.42 ± 0.03 b
OMEGA 99.90 ± 0.06 a10.68 ± 0.23 b
Mean values ± SD. Values with a different letter in the same row are significantly different (p < 0.05).