A Learning Analytics Approach to Identify Students at Risk of Dropout: A Case Study with a Technical Distance Education Course

 , , ,
, , ,  , , , and
Abstract
1. Introduction
- RQ1.
- Does the GA approach to hyperparameter optimization outperform traditional techniques?
- RQ2.
- Does the resulting predictive models generated by the use of the GA approach for hyperparameter optimization perform better than models with default hyperparameters?
2. Theoretical Background
3. Proposed Approach
3.1. Case Study
3.2. Fine Tuning with Proposed Genetic Algorithm
- (a)
- Epoch: One complete cycle execution of the GA (from Steps 1 to 5). The proposed approach works with 50 epochs;
- (b)
- Individual (or candidate): A machine learning algorithm/classifier (DT, RF, MLP, LG, and ADA) together with its hyperparameters;
- (c)
- Chromosome: A vector of hyperparameters for a given individual (machine learning algorithm). As different machine learning algorithms have different hyperparameters, the chromosomes in our study have different sizes and meaning according to the machine learning algorithm to which they are referring.
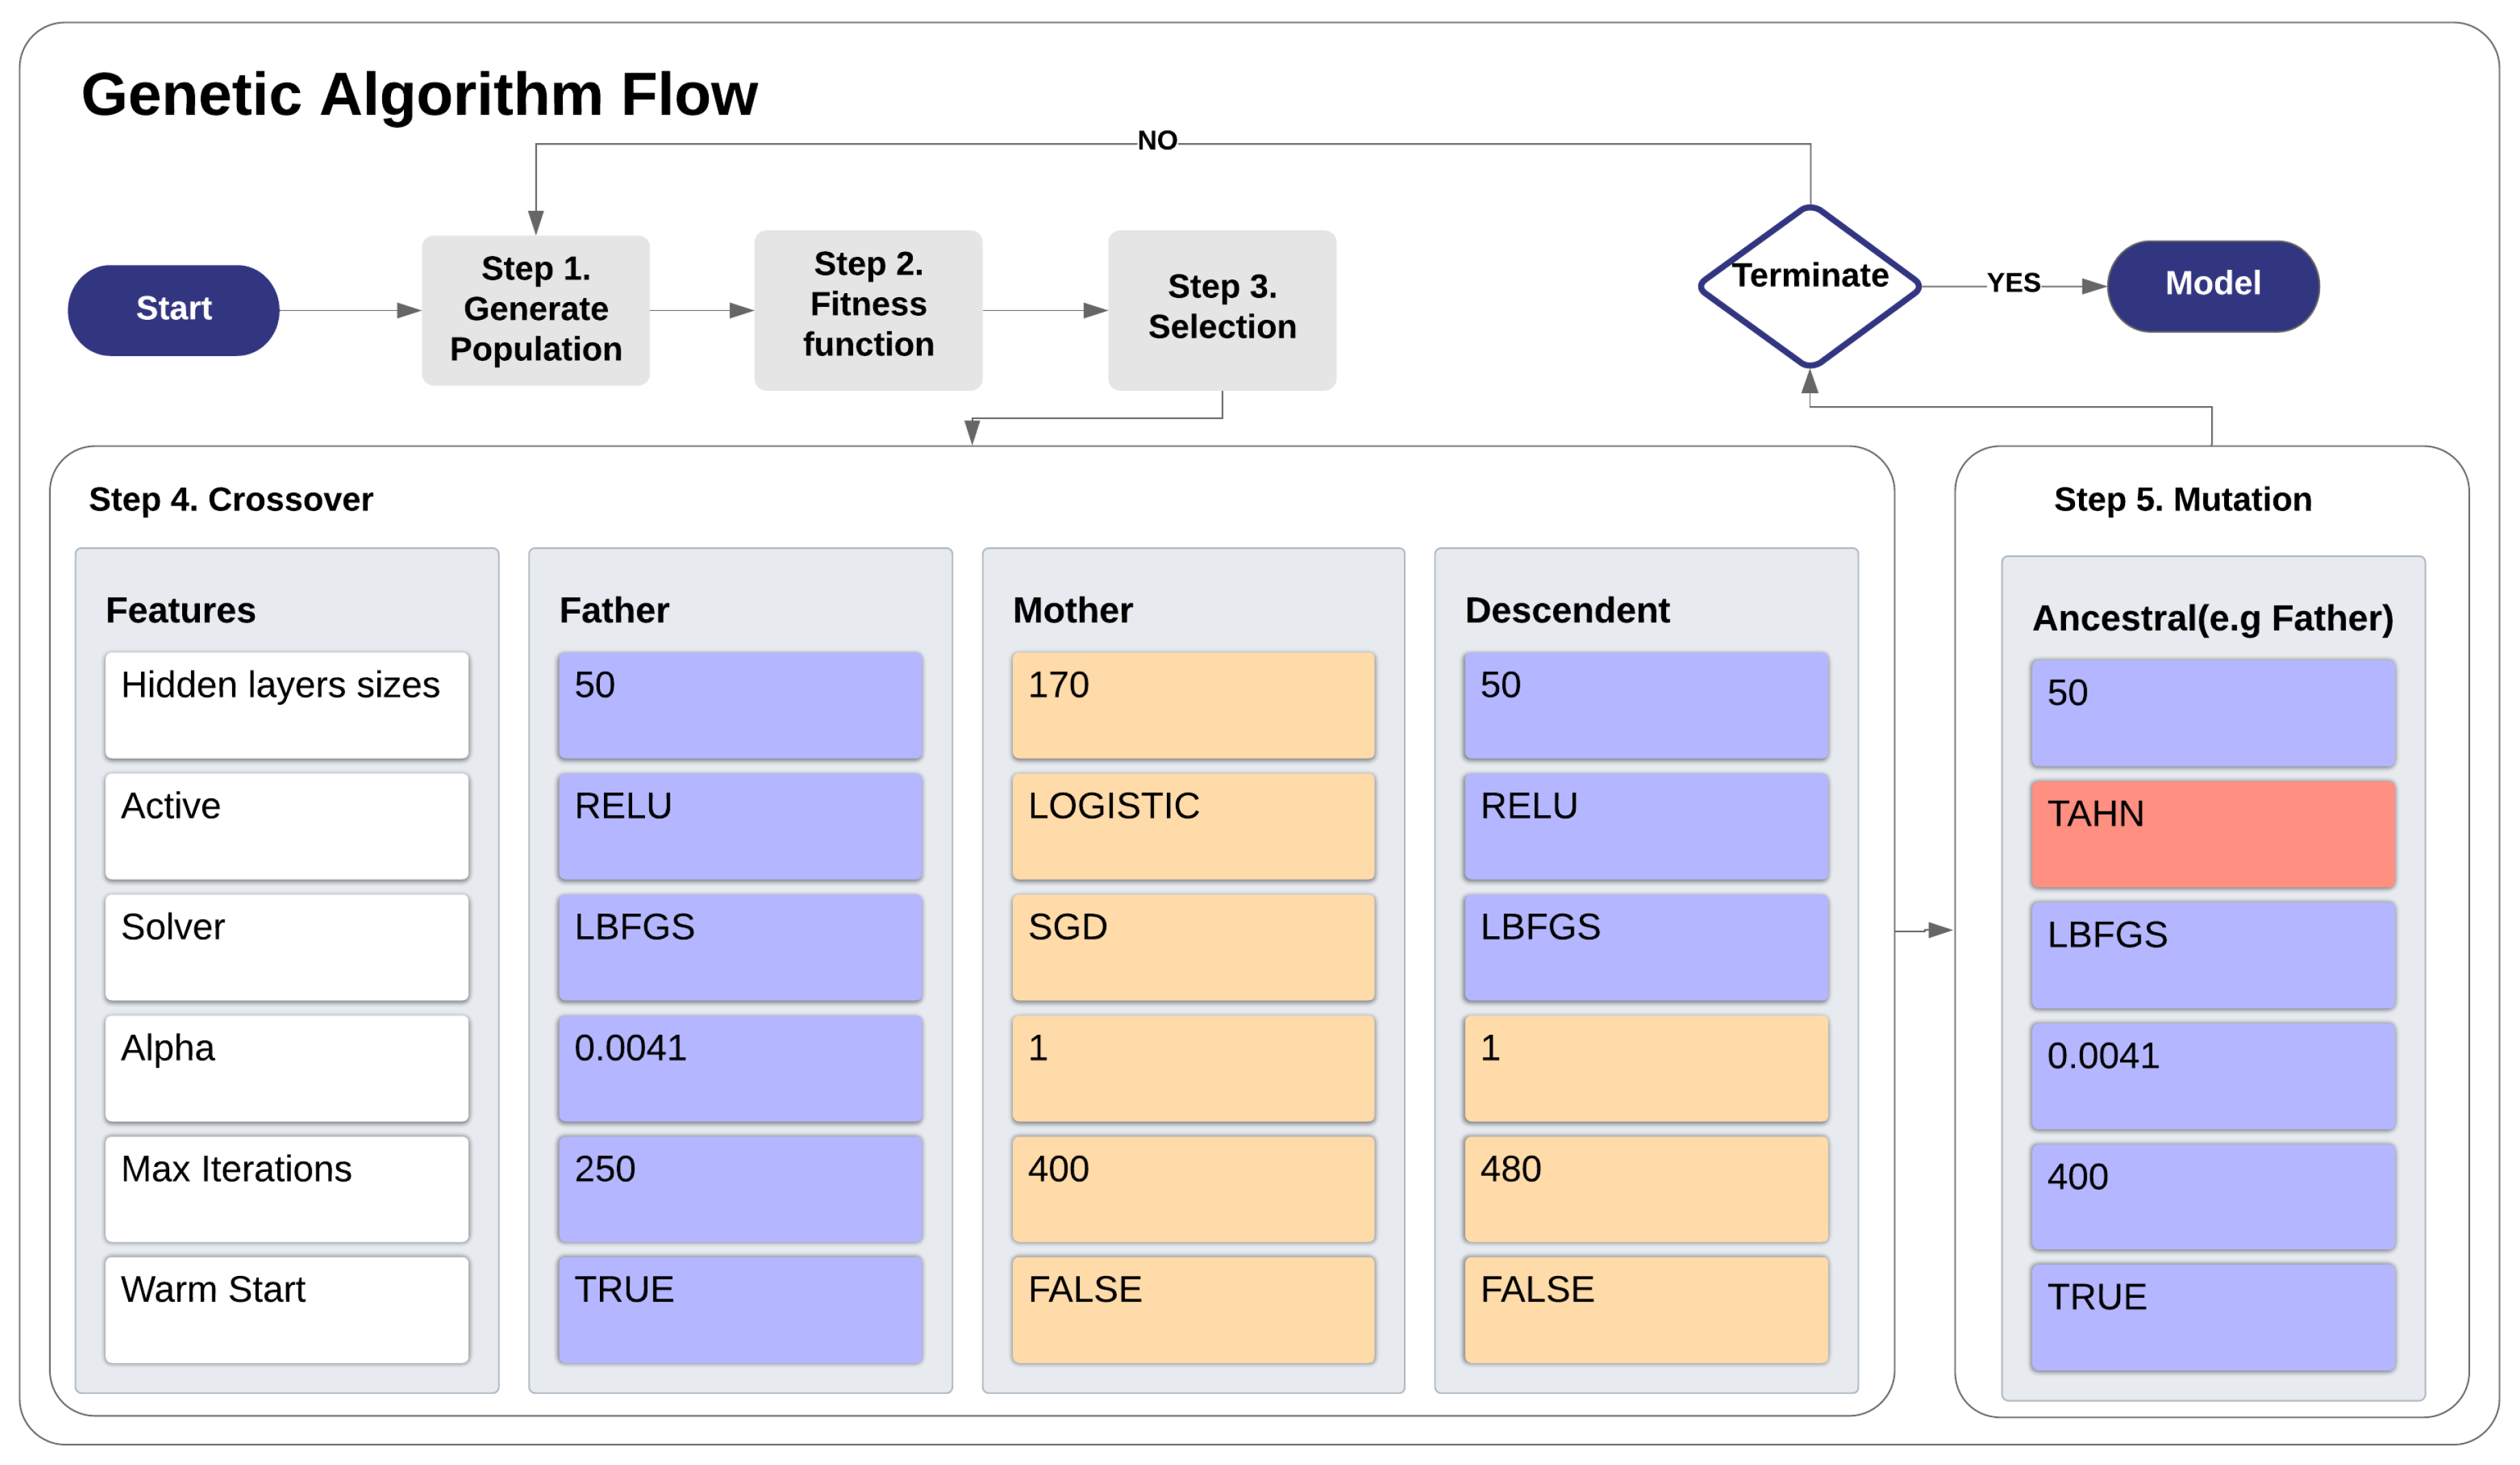
- Step 1 (generate population): The GA generates 100 individuals (candidates) for each machine learning algorithm (DT, RF, MLP, LG, and ADA) with hyperparameters (chromosomes) randomly defined considering the available list of options. The classifiers are trained and tested using 10-fold cross-validation and their performances are measured by using the area under the receiver operating characteristic curve metric (AUROC) [49] and as conducted by Gašević et al. [50].
- Step 2 (fitness function): The performance obtained by each of the 100 individuals of each machine learning algorithm are then compared by the fitness function.
- Step 3 (selection): The 25 individuals with the highest AUC for each machine learning algorithm are selected for the next step.
- Step 4 (crossover): The crossover is conducte using the concept based on the genetic inheritance of sexual reproductions, where each descendant receives a part of the genetic code (chromosome) of the father and part of the mother, as exemplified in Figure 5. Thus, the configurations of the fittest individuals of the last step are combined, one being the father and the other the mother. In the implemented algorithm, the individuals who will assign part of their genetic code to form a new member are chosen randomly from among the 25 best placed of that classifier in the last generation. This step results in 25 new individuals for each machine learning algorithm.
- Step 5 (mutation): This step randomly alters the chromosome (hyperparameter) of the 25 best individuals. In other words, a certain characteristic of an individual selected in the previous step receives a randomly generated configuration. As shown in Figure 5, an individual of the MLP type with hyperparameter “Active” set to “RELU” was changed to “TAHN”. The mutation is set to change only one hyperparameter of the chromosome.
- 25 individuals selected from the previous generation from the fitness function (Steps 2 and 3);
- 25 individuals formed by crossover (Step 4);
- 25 individuals formed by mutations (Step 5); and
- 25 new individuals randomly generated (Step 1).
3.3. Experiments
- AUC ≤ 0.50: Bad discrimination;
- 0.50 < AUC ≤ 0.70: Acceptable discrimination;
- 0.70 < AUC ≤ 0.90: Excellent discrimination; and
- AUC > 0.90: Outstanding discrimination.
4. Results and Discussion
5. Final Remarks
- RQ1.
- Does the approach for hyperparameter optimization with a GA outperform traditional techniques?
- RQ2.
- Does the resulting predictive models generated by the use of the GA approach for hyperparameter optimization perform better than models with default hyperparameters?
Author Contributions
Funding
Conflicts of Interest
Abbreviations
| ADA | ADABoost |
| ANOVA | Analysis of Variance |
| AUC | Area Under the Curve |
| AUROC | Area Under the Receiver Operating Characteristic Curve |
| DT | Decision Tree |
| EDA | Exploratory Data Analysis |
| EDM | Educational Data Mining |
| GA | Genetic Algorithm |
| GBGP | Grammar-Based Genetic Programming |
| GRID | Grid SearchCV |
| IBK | Instance-Based Lazy Learning |
| ICRM | Interpretable Classification Rule Mining Algorithm |
| IFSul | Instituto Federal Sul Rio-grandense |
| INN | I-nearest neighbor |
| kNN | k-Nearest Neighbor |
| LA | Learning Analytics |
| LG | Logistic Regression |
| LMS | Learning Management Systems |
| ML | Machine Learning |
| MAE | Mean Absolute Error |
| MLP | Multilayer Perceptron |
| NDS | Number of Dropout Students |
| PCA | Principal Component Analysis |
| RQ | Research Question |
| RF | Random Forest |
| SAT | Scholastic Aptitude Test |
| SMOTE | Synthetic Minority Over-Sampling Technique |
| SVM | Support Vector Machine |
| TNR | True Negative Rate |
| TPR | True Positive Rate |
| VLE | Virtual Learning Environment |
Appendix A

| Alg. | Hyperparameters | Possibi-Lities | Numberof Ind. | Grid | Eval. |
| DT | criterion: [gini, entropy], max_depth: range (0, 32), min_samples_split: range (1, 15), min_samples_leaf: range (1, 20) | 19.200 | 5.100 | criterion: [gini, entropy], max_depth: [0, 1, 2, 3, 5, 7, 10, 12, 15, 17, 20, 23, 25, 30], min_samples_split: [0, 1, 2, 3, 5, 7, 10, 12, 15] min_samples_leaf: [0, 1, 2, 3, 4, 5, 7, 9, 10, 12, 15, 17, 20] | 3.726 |
| RF | n_estimators: range (1, 200), criterion: [gini, entropy], max_features [1, 2, 3, 4], min_samples_split: range (2, 21), min_samples_leaf: range (1, 2), bootstrap: [True, False] | 128.000 | 5.100 | n_estimators: [1, 10, 20, 30, 40, 50, 70, 100, 120, 130, 150, 170, 190, 200], criterion: [gini, entropy], max_features [1, 2, 3, 4], min_samples_split: [2, 3, 4, 5, 7, 9, 10, 12, 15, 17, 20], min_samples_leaf: [1, 2], bootstrap: [True, False] | 4.928 |
| ADA | algorithm: [SAMME, SAMME.R], n_estimators: range (1, 200), random_state: range (None, 50), learning_rate: range (1e-2, 1) | 2 KK | 5.100 | algorithm: [SAMME, SAMME.R], n_estimators: [1, 10, 20, 30, 40, 50, 70, 100, 120, 130, 150, 170, 190, 200], random_state: [None, 1, 5, 10, 15, 20, 25, 30, 40, 50], learning_rate: [1e-2, 5e-2, 7e-2, 1e-1, 3e-1, 5e-1, 7e-1, 1] | 2.240 |
| MLP | hidden_layer_sizes: range (1, 200), activation: [identity, logistic, tanh, relu], solver: [lbfgs, sgd, adam], max_iter: range (50, 200), alpha: range (1e-4, 1e-1], warm_start: [True, False] | 720 KK | 5.100 | hidden_layer_sizes: [(50, 50, 50), (50, 100, 50), (100), (50), (10), (1), (5)], activation: [identity, logistic, tanh, relu], solver: [lbfgs, sgd, adam], max_iter: [1, 2, 5, 10, 30, 50], alpha: [1e-4, 1e-3, 1e-2, 5e-2, 1e-1], warm_start: [True, False] | 5.040 |
| RL | penalty: [l1, l2, elasticnet], C: [1e-4, 1e-3, 1e-2, 1e-1, 5e-1, 1, 5, 10, 15, 20, 25], dual: [True, False], solver: [newton-cg, lbfgs, lbfgs, sag, saga], multi_class: [ovr, auto], max_iter: range (50, 200) | 99.000 | 5.100 | penalty: [l1, l2, elasticnet], C: [1e-4, 1e-1, 5e-1, 1, 5, 15, 25], dual: [True, False], solver: [newton-cg, lbfgs, lbfgs, sag, saga], multi_class: [ovr, auto], max_iter: [1, 10, 20, 30, 40, 50, 70, 100, 120, 130, 150, 170, 190, 200] | 5.800 |
References
- Chatti, M.A.; Dyckhoff, A.L.; Schroeder, U.; Thüs, H. A reference model for learning analytics. Int. J. Technol. Enhanc. Learn. 2013, 4, 318–331. [Google Scholar] [CrossRef]
- Siemens, G. Learning analytics: The emergence of a discipline. Am. Behav. Sci. 2013, 57, 1380–1400. [Google Scholar] [CrossRef]
- Sheehan, M.; Park, Y. pGPA: A personalized grade prediction tool to aid student success. In Proceedings of the Sixth ACM Conference on Recommender Systems, Dublin City, Ireland, 9–13 September 2012; pp. 309–310. [Google Scholar]
- Manhães, L.M.B.; Cruz, S.d.; Costa, R.J.M.; Zavaleta, J.; Zimbrão, G. Previsão de Estudantes com Risco de Evasão Utilizando Técnicas de Mineração de Dados. In Proceedings of the Anais do XXII SBIE-XVII WIE, Aracaju, Brazil, 21–25 November 2011. [Google Scholar]
- Lykourentzou, I.; Giannoukos, I.; Nikolopoulos, V.; Mpardis, G.; Loumos, V. Dropout prediction in e-learning courses through the combination of machine learning techniques. Comput. Educ. 2009, 53, 950–965. [Google Scholar] [CrossRef]
- Márquez-Vera, C.; Cano, A.; Romero, C.; Noaman, A.Y.M.; Mousa Fardoun, H.; Ventura, S. Early dropout prediction using data mining: A case study with high school students. Expert Syst. 2016, 33, 107–124. [Google Scholar] [CrossRef]
- OECD. Benchmarking Higher Education System Performance; OECD: Paris, France, 2019; p. 644. [Google Scholar] [CrossRef]
- Yukselturk, E. Predicting Dropout Student: An Application of Data Mining Methods in an Online Education Program. Comput. Educ. 2014, 17, 118–133. [Google Scholar] [CrossRef]
- Li, Q.; Baker, R.; Warschauer, M. Using clickstream data to measure, understand, and support self-regulated learning in online courses. Internet High. Educ. 2020, 100727. [Google Scholar] [CrossRef]
- Rastrollo-Guerrero, J.L.; Gómez-Pulido, J.A.; Durán-Domínguez, A. Analyzing and Predicting Students’ Performance by Means of Machine Learning: A Review. Appl. Sci. 2020, 10, 1042. [Google Scholar] [CrossRef]
- Vossensteyn, J.J.; Kottmann, A.; Jongbloed, B.W.; Kaiser, F.; Cremonini, L.; Stensaker, B.; Hovdhaugen, E.; Wollscheid, S. Dropout and Completion in Higher Education in Europe: Main Report. In European Commission; Center for Higher Education Policy Studies and Nordic Institute for Studies in Innovation Research and Education: Enschede, The Nerthland, 2015. [Google Scholar]
- Gregori, E.B.; Zhang, J.; Galván-Fernández, C.; Fernández-Navarro, F.d.A. Learner support in MOOCs: Identifying variables linked to completion. Comput. Educ. 2018, 122, 153–168. [Google Scholar] [CrossRef]
- Censo, E. BR 2018-Relatório Analítico da Aprendizagem a Distância no Brasil. Acesso Em 2018, 16. [Google Scholar]
- Dickson, W.P. Toward a deeper understanding of student performance in virtual high school courses: Using quantitative analyses and data visualization to inform decision making. In A Synthesis of New Research in K–12 Online Learning; Michigan Virtual University: Lansing, MI, USA, 2005; pp. 21–23. [Google Scholar]
- Murray, M.; Pérez, J.; Geist, D.; Hedrick, A. Student interaction with content in online and hybrid courses: Leading horses to the proverbial water. In Proceedings of the Informing Science and Information Technology Education Conference, Santa Rosa, CA, USA, 30 June–6 July 2013; Informing Science Institute: Santa Rosa, CA, USA, 2013; pp. 99–115. [Google Scholar]
- Leitner, P.; Ebner, M.; Ebner, M. Learning Analytics Challenges to Overcome in Higher Education Institutions. In Utilizing Learning Analytics to Support Study Success; Springer: Berlin, Germany, 2019; pp. 91–104. [Google Scholar]
- Gursoy, M.E.; Inan, A.; Nergiz, M.E.; Saygin, Y. Privacy-preserving learning analytics: Challenges and techniques. IEEE Trans. Learn. Technol. 2016, 10, 68–81. [Google Scholar] [CrossRef]
- Drachsler, H.; Greller, W. Privacy and analytics: It’s a DELICATE issue a checklist for trusted learning analytics. In Proceedings of the Sixth International Conference on Learning Analytics & Knowledge, Edinburgh, Scotland, 25–29 April 2016; pp. 89–98. [Google Scholar]
- Baker, R.S.; Inventado, P.S. Educational data mining and learning analytics. In Learning Analytics; Springer: Berlin, Germany, 2014; pp. 61–75. [Google Scholar]
- Olivares, R.; Munoz, R.; Soto, R.; Crawford, B.; Cárdenas, D.; Ponce, A.; Taramasco, C. An Optimized Brain-Based Algorithm for Classifying Parkinson’s Disease. Appl. Sci. 2020, 10, 1827. [Google Scholar] [CrossRef]
- Bergstra, J.S.; Bardenet, R.; Bengio, Y.; Kégl, B. Algorithms for hyper-parameter optimization. In Advances in Neural Information Processing Systems; Curran Associates Inc.: Granada, Spain, 2011; pp. 2546–2554. ISBN 9781618395993. [Google Scholar]
- Li, L.; Jamieson, K.; DeSalvo, G.; Rostamizadeh, A.; Talwalkar, A. Hyperband: A novel bandit-based approach to hyperparameter optimization. J. Mach. Learn. Res. 2017, 18, 6765–6816. [Google Scholar]
- Queiroga, E.; Cechinel, C.; Araújo, R. Predição de estudantes com risco de evasão em cursos técnicos a distância. In Proceedings of the Brazilian Symposium on Computers in Education (Simpósio Brasileiro de Informática na Educação-SBIE), Recife, Brazil, 30 October–2 November 2017; p. 1547. [Google Scholar]
- Queiroga, E.; Cechinel, C.; Araújo, R.; da Costa Bretanha, G. Generating models to predict at-risk students in technical e-learning courses. In Proceedings of the IEEE Latin American Conference on Learning Objects and Technology (LACLO), San Carlos, CA, USA, 3–7 October 2016; pp. 1–8. [Google Scholar]
- Detoni, D.; Cechinel, C.; Matsumura Araújo, R. Modelagem e Predição de Reprovação de Acadêmicos de Cursos de Educação a Distância a partir da Contagem de Interações. Revista Brasileira de Informática na Educação 2015, 23, 1. [Google Scholar]
- Jayaprakash, S.M.; Moody, E.W.; Lauria, E.J.M.; Regan, J.R.; Baron, J.D. Early Alert of Academically At-Risk Students: An Open Source Analytics Initiative. J. Learn. Anal. 2014, 1, 6–47. [Google Scholar] [CrossRef]
- Márquez-Vera, C.; Cano, A.; Romero, C.; Ventura, S. Predicting student failure at school using genetic programming and different data mining approaches with high dimensional and imbalanced data. Appl. Intell. 2013, 38, 315–330. [Google Scholar] [CrossRef]
- Xing, W.; Guo, R.; Petakovic, E.; Goggins, S. Participation-based student final performance prediction model through interpretable Genetic Programming: Integrating learning analytics, educational data mining and theory. Comput. Hum. Behav. 2015, 47, 168–181. [Google Scholar] [CrossRef]
- Munoz, R.; Olivares, R.; Taramasco, C.; Villarroel, R.; Soto, R.; Barcelos, T.S.; Merino, E.; Alonso-Sánchez, M.F. Using black hole algorithm to improve eeg-based emotion recognition. Comput. Intell. Neurosci. 2018, 2018, 22. [Google Scholar] [CrossRef]
- Liz-Domínguez, M.; Caeiro-Rodríguez, M.; Llamas-Nistal, M.; Mikic-Fonte, F.A. Systematic Literature Review of Predictive Analysis Tools in Higher Education. Appl. Sci. 2019, 9, 5569. [Google Scholar] [CrossRef]
- Herodotou, C.; Rienties, B.; Verdin, B.; Boroowa, A. Predictive learning analytics ‘at scale’: Towards guidelines to successful implementation in Higher Education based on the case of the Open University UK. J. Learn. Anal. 2019. [Google Scholar] [CrossRef]
- Hilliger, I.; Ortiz-Rojas, M.; Pesántez-Cabrera, P.; Scheihing, E.; Tsai, Y.S.; Muñoz-Merino, P.J.; Broos, T.; Whitelock-Wainwright, A.; Pérez-Sanagustín, M. Identifying needs for learning analytics adoption in Latin American universities: A mixed-methods approach. Internet High. Educ. 2020, 45, 100726. [Google Scholar] [CrossRef]
- Cechinel, C.; Ochoa, X.; Lemos dos Santos, H.; Carvalho Nunes, J.B.; Rodés, V.; Marques Queiroga, E. Mapping Learning Analytics initiatives in Latin America. Br. J. Educ. Technol. 2020. [Google Scholar] [CrossRef]
- González, P. Factores que favorecen las presencia docente en entornos virtuales de aprendizaje. Tendencias Pedagógicas 2017, 29, 43–58. [Google Scholar]
- De Pablo González, G. La Importancia de la Presencia Docente en Entornos Virtuales de Aprendizaje; Universidad Autónoma de Madrid: Madrid, Spain, 2016. [Google Scholar]
- Herodotou, C.; Rienties, B.; Boroowa, A.; Zdrahal, Z.; Hlosta, M.; Naydenova, G. Implementing predictive learning analytics on a large scale: The teacher’s perspective. In Proceedings of the Seventh International Learning Analytics & Knowledge Conference, Vancouver, BC, Canada, 13–17 March 2017; pp. 267–271. [Google Scholar]
- Zohair, L.M.A. Prediction of Student’s performance by modelling small dataset size. Int. J. Educ. Technol. High. Educ. 2019, 16, 27. [Google Scholar] [CrossRef]
- Whitehill, J.; Mohan, K.; Seaton, D.; Rosen, Y.; Tingley, D. Delving deeper into MOOC student dropout prediction. arXiv 2017, arXiv:1702.06404. [Google Scholar]
- Macarini, B.; Antonio, L.; Cechinel, C.; Batista Machado, M.F.; Faria Culmant Ramos, V.; Munoz, R. Predicting Students Success in Blended Learning—Evaluating Different Interactions Inside Learning Management Systems. Appl. Sci. 2019, 9, 5523. [Google Scholar] [CrossRef]
- Queiroga, E.; Cechinel, C.; Araújo, R. Um Estudo do Uso de Contagem de Interações Semanais para Predição Precoce de Evasão em Educação a Distância. In Proceedings of the Anais dos Workshops do Congresso Brasileiro de Informática na Educação, Maceio, Brazil, 26–30 October 2015; p. 1074. [Google Scholar]
- Swan, K. Learning effectiveness online: What the research tells us. Elem. Qual. Online Educ. Pract. Dir. 2003, 4, 13–47. [Google Scholar]
- Halawa, S.; Greene, D.; Mitchell, J. Dropout Prediction in MOOCs using Learner Activity Features. Eur. MOOC Summit EMOOCs 2014, 37, 1–10. [Google Scholar]
- Minaei-Bidgoli, B.; Punch, W.F. Using genetic algorithms for data mining optimization in an educational web-based system. In Proceedings of the Genetic and eVolutionary Computation Conference, Chicago, IL, USA, 12–16 July 2003; Springer: Berlin, Germany, 2003; pp. 2252–2263. [Google Scholar]
- Silva Filho, R.L.L.; Motejunas, P.R.; Hipólito, O.; Lobo, M.B.d.C.M. A evasão no ensino superior brasileiro. Cadernos de Pesquisa 2007, 37, 641–659. [Google Scholar] [CrossRef]
- Resende, M.L.d.A. Evasão Escolar No Primeiro Ano Do Ensino médio Integrado Do Ifsuldeminas-Campus Machado; Encontro Anual da ANPOCS: Caxambu, Brazil, 2012. [Google Scholar]
- Fonseca, C.M.; Fleming, P.J. Genetic Algorithms for Multiobjective Optimization: Formulation Discussion and Generalization. In Proceedings of the ICGA, San Mateo, CA, USA, 17–22 July 1993; pp. 416–423. [Google Scholar]
- Hartmann, S. A competitive genetic algorithm for resource-constrained project scheduling. Nav. Res. Logist. (NRL) 1998, 45, 733–750. [Google Scholar] [CrossRef]
- Sebastiani, F. Machine learning in automated text categorization. ACM Comput. Surv. (CSUR) 2002, 34, 1–47. [Google Scholar] [CrossRef]
- Fawcett, T. An introduction to ROC analysis. Pattern Recognit. Lett. 2006, 27, 861–874. [Google Scholar] [CrossRef]
- Gašević, D.; Dawson, S.; Rogers, T.; Gasevic, D. Learning analytics should not promote one size fits all: The effects of instructional conditions in predicting academic success. Internet High. Educ. 2016, 28, 68–84. [Google Scholar] [CrossRef]
- Bruce, P.; Bruce, A. Practical Statistics for Data Scientists: 50 Essential Concepts; O’Reilly Media, Inc.: Sebastopol, CA, USA, 2017. [Google Scholar]
- Larrabee Sønderlund, A.; Hughes, E.; Smith, J. The efficacy of learning analytics interventions in higher education: A systematic review. Br. J. Educ. Technol. 2019, 50, 2594–2618. [Google Scholar] [CrossRef]
- Zöller, M.A.; Huber, M.F. Survey on automated machine learning. arXiv 2019, arXiv:1904.12054. [Google Scholar]


| Number of Log Rows | Number of Students | Dropouts (%) | Success (%) |
|---|---|---|---|
| 1,051,012 | 752 | 354 (47%) | 398 (53%) |
| Column | Comment |
|---|---|
| Course | Name of the virtual classroom accessed |
| Time | Day and time of the access |
| IP Address | IP Address of the machine |
| Full name | User (student) name |
| Action Event Name | The action represents the type of interaction that the student performed in the classroom. For instance: (1) Visualization and participation on chats; (2) Visualization and inclusion of posts in forums; (3) Visualization of resources; and (4) Visualization of the course. |
| Description | Detailed description of the event. Example: Download the .pdf file. |
| Variable | Description |
|---|---|
| Daily interactions | Count of interactions of a given day (from 1 to 350 days) |
| Weekly interactions | Count of interactions of a given week (from 1 to 50 weeks) |
| Mean of the week | Average of the count of interactions of a given week |
| Standard deviation of the week | Standard deviation of the count of interactions of a given week |
| Student final status | Dependent variable representing the student final status: Dropout or success |
| Year | Period | Number of Students in Course | Number of Dropout Students (NDS) | NDS Rate | Accumulated NDS | Accmulated NDS Rate |
|---|---|---|---|---|---|---|
| Year 1 | Week 10 | 752 | 87 | 11.56 | 87 | 11.56 |
| Week 20 | 665 | 71 | 10.67 | 158 | 21.01 | |
| Week 30 | 594 | 21 | 3.5 | 179 | 23.27 | |
| Week 40 | 573 | 1 | 0.17 | 180 | 23.4 | |
| Week 50 | 572 | 2 | 0.34 | 182 | 24.20 | |
| Total of First 50 Weeks | 752 | 182 | 24.20 | 182 | 24.20 | |
| Year 2 | Total after 50 Weeks | 572 | 172 | 22.87 | 354 | 47.07 |
| Final Values | Total | 752 | 354 | 47.07 | 354 | 47.07 |
| Approach or Machine Learning Algorithm | Hyperparameter Optimization | AUC Mean | AUC Median | AUC Standard Deviation |
|---|---|---|---|---|
| GA | Yes | 0.8454 | 0.8498 | 0.0637 |
| GRID | 0.7939 | 0.8288 | 0.1056 | |
| ADA | No | 0.7509 | 0.8062 | 0.1342 |
| DT | 0.6771 | 0.7065 | 0.1008 | |
| LG | 0.6943 | 0.7198 | 0.1110 | |
| MLP | 0.7353 | 0.7946 | 0.1277 | |
| RF | 0.7752 | 0.8243 | 0.1150 |
| Hyperparameter Optimization | Hidden Layer Sizes | Activation | Solver | Alpha | Max Iter | Warm Start | AUC |
|---|---|---|---|---|---|---|---|
| yes | 30 | logistic | sgd | 0.2855486101 | 353 | False | 0.9154 |
| no | 100 | relu | adam | 0.0001 | 200 | False | 0.849 |
© 2020 by the authors. Licensee MDPI, Basel, Switzerland. This article is an open access article distributed under the terms and conditions of the Creative Commons Attribution (CC BY) license (http://creativecommons.org/licenses/by/4.0/).
Share and Cite
Queiroga, E.M.; Lopes, J.L.; Kappel, K.; Aguiar, M.; Araújo, R.M.; Munoz, R.; Villarroel, R.; Cechinel, C. A Learning Analytics Approach to Identify Students at Risk of Dropout: A Case Study with a Technical Distance Education Course. Appl. Sci. 2020, 10, 3998. https://doi.org/10.3390/app10113998
Queiroga EM, Lopes JL, Kappel K, Aguiar M, Araújo RM, Munoz R, Villarroel R, Cechinel C. A Learning Analytics Approach to Identify Students at Risk of Dropout: A Case Study with a Technical Distance Education Course. Applied Sciences. 2020; 10(11):3998. https://doi.org/10.3390/app10113998
Chicago/Turabian StyleQueiroga, Emanuel Marques, João Ladislau Lopes, Kristofer Kappel, Marilton Aguiar, Ricardo Matsumura Araújo, Roberto Munoz, Rodolfo Villarroel, and Cristian Cechinel. 2020. "A Learning Analytics Approach to Identify Students at Risk of Dropout: A Case Study with a Technical Distance Education Course" Applied Sciences 10, no. 11: 3998. https://doi.org/10.3390/app10113998
APA StyleQueiroga, E. M., Lopes, J. L., Kappel, K., Aguiar, M., Araújo, R. M., Munoz, R., Villarroel, R., & Cechinel, C. (2020). A Learning Analytics Approach to Identify Students at Risk of Dropout: A Case Study with a Technical Distance Education Course. Applied Sciences, 10(11), 3998. https://doi.org/10.3390/app10113998