Article

BNC Biosynthesis with Increased Productivity in a Newly Designed Surface Air-Flow Bioreactor

by
Izabela Cielecka
*,
Małgorzata Ryngajłło
and
Stanisław Bielecki
Institute of Molecular and Industrial Biotechnology, Lodz University of Technology, 90-924 Lodz, Poland
*
Author to whom correspondence should be addressed.
Appl. Sci. 2020, 10(11), 3850; https://doi.org/10.3390/app10113850
Submission received: 26 April 2020 / Revised: 26 May 2020 / Accepted: 30 May 2020 / Published: 1 June 2020
(This article belongs to the Special Issue Bacterial Cellulose Biomaterials)

Abstract

:

Featured Application

The surface air-flow (SAF) bioreactor for bacterial nanocellulose (BNC) production presented in this study enabled the increased productivity and improved tensile properties through the control of culture ventilation. Bacterial nanocellulose produced in SAF bioreactor meets the requirements of majority of application which demand a biomaterial with a definite shape and high quality. Additionally, the results of our study on the impact of various parameters on the yield and mechanical strength, provide the useful basis for further optimization of the BNC production process.

Abstract

The application of bacterial cellulose (BNC) could be widely expanded if the production costs were reduced. This study aims to determine factors simultaneously affecting the yield and tensile strength of BNC in a newly designed surface air-flow bioreactor (SAF). For this purpose, a two-stage study was done. Firstly, the most important factors for high yield were determined based on the Plackett–Burman Design. Secondly, impact of the chosen variables on both responses was assessed in a wide range of factor values. The greatest influence on the yield and mechanical strength was proved for such factors as air-flow ratio, glucose concentration, and culture time. The productivity in a SAF bioreactor with controlled air-flow ratio was enhanced by 65%. In terms of mechanical properties, the stress of BNC membranes varied from 0.8 to 6.39 MPa depending on the culture conditions. The results of the performed tests make a useful basis for future optimizations.

1. Introduction

Bacterial cellulose (BNC) is known as a material of unique properties. It is synthesized by many bacteria, such as Komagataeibacter, Sarcina, Agrobacterium, and Rhizobium [1]. The most widely studied are the Komagataeibacter (former Gluconacetobacter) species, which produce the chemical pure polymer efficiently without lignin or hemicelluloses, compared to the plant cellulose. BNC has a gelatinous consistency and consists of ultrathin fibers having a width of about 8 nm and a length of approximately 50–80 nm which form a three-dimensional network. Bacterial cellulose is characterized by a high crystallinity which is over 85% and an excellent mechanical strength. Due to its physicochemical properties, BNC can be used in the food industry, acoustic diaphragms, high-strength paper products, and enzyme or drug immobilization. The water holding capacity up to 99% and the biocompatibility of bacterial cellulose make BNC highly attractive for medical applications, such as wound dressing [2], temporary skin substitute [3], artificial blood vessels [4], and scaffold for tissue engineering [5].
Bacterial cellulose biosynthesis yield, its morphology, and physical properties could be influenced by choosing culture methods. Under shaking conditions, BNC accumulates as spheres or pellets in the medium, while in a static culture a pellicle is formed [6]. A BNC membrane is synthesized layer by layer at the air/medium interface by bacterial cells [7], which are present in the aerobic zone of the synthesized BNC [8]. Although both of these culturing methods are commonly employed in various target productions, the majority of applications, especially in medicine and the cosmetic industry, demand a definite shape of cellulosic materials, such as thin membranes, sheets, or tubes. So far, only static culture meets this requirement [9]. It is important to understand the chemical, biological, and physical factors, which can influence the course of biosynthesis and properties of BNC [6,10].
Numerous papers describe the optimization of the BNC yield with different methods. The most common approach is one-factor-at-a-time method where only one factor is changing in a series of experiments. Also, the statistical optimization methods are used increasingly often, e.g., the Plackett–Burman design (PBD) [11,12], the central composite design (CCD) [11,12,13,14], or the factorial design (FD) [15], which require less experiments and show the global impact of variables on studied responses. On the other hand, there is a lack in mechanical properties study in terms of different culture conditions. Numerous studies in the past revealed that various additives in situ or ex situ, such as carboxymethylcellulose [16,17], poly-3-hydroxybutyrate [18], poly (vinyl alcohol) [19], к-carrageenan [5], polysiloxane, and fluorocarbon polymers [20] or polyethylene glycol diacrylate [21] can affect the structure of BNC leading to changes in tensile strength. However, only a few reports are available which discuss the impact of common culture conditions. Ebrahimi et al. studied the effect of different strains, cultivation time, and surface to volume ratio on mechanical properties, but the authors used only two levels for each variable [22]. The present work is focused on a detailed analysis of relationship between culture condition and both the yield and tensile strength. For this purpose, we designed a surface air-flow (SAF) bioreactor set and determined the factors affecting the BNC dry weight using the Plackett–Burman design. Based on statistical analysis, six factors were chosen for further investigation, namely the air-flow ratio, volume and age of inoculum, pH, glucose concentration, and cultivation time. We assessed the impact of these factors on the yield and mechanical properties, such as strain, stress, and Young modulus. The obtained data allow definition of the rational area of input factor variability in static culture of K. xylinus E25. These results give a solid background for further simultaneous optimization of the yield and tensile strength which should lead to the highest production rate without losing the BNC quality.

2. Materials and Methods

2.1. Microorganism and Standard Culture Medium

Komagataeibacter xylinus E25, used in this study, was obtained from the Institut of Molecular and Industrial Biotechnology (IMIB) collection. The strain belongs to Bowil Biotech Ltd., Władysławowo, Poland.
Standard culture was carried out statically for 6 days in Schramm–Hestrin (SH) medium modified with 1% of ethanol and containing 20 g/L of glucose, 5 g/L peptone, 5 g/L yeast extract, 2.7 g/L Na2HPO4, 1.15 g/L of citric acid, and 0.50 g/L of MgSO4. pH was adjusted to 5.7 with 0.1 M NaOH and 0.1 M CH3COOH. Inoculum was prepared in standard Schramm–Hestrin medium for 3 days at 30 °C. Before use, the inoculum was vortexed for 30 s. Cultures were inoculated with 5% of inoculum and pre-incubated for 2 days in flasks at 30 °C. Afterwards, the cultures were transferred into the bioreactor in a sterile environment.

2.2. Purification of Bacterial Nanocellulose

Membranes were purified by rinsing with tap water, until the remaining medium was flushed out and washed with 1% w/v NaOH for bacterial cells removal. Next, the pH of membranes was neutralized with 1% v/v acetic acid and membranes were immersed in distilled water for 24 h. Purified membranes were sterilized by autoclaving at 121 °C and stored at 4 °C before further analytical steps.

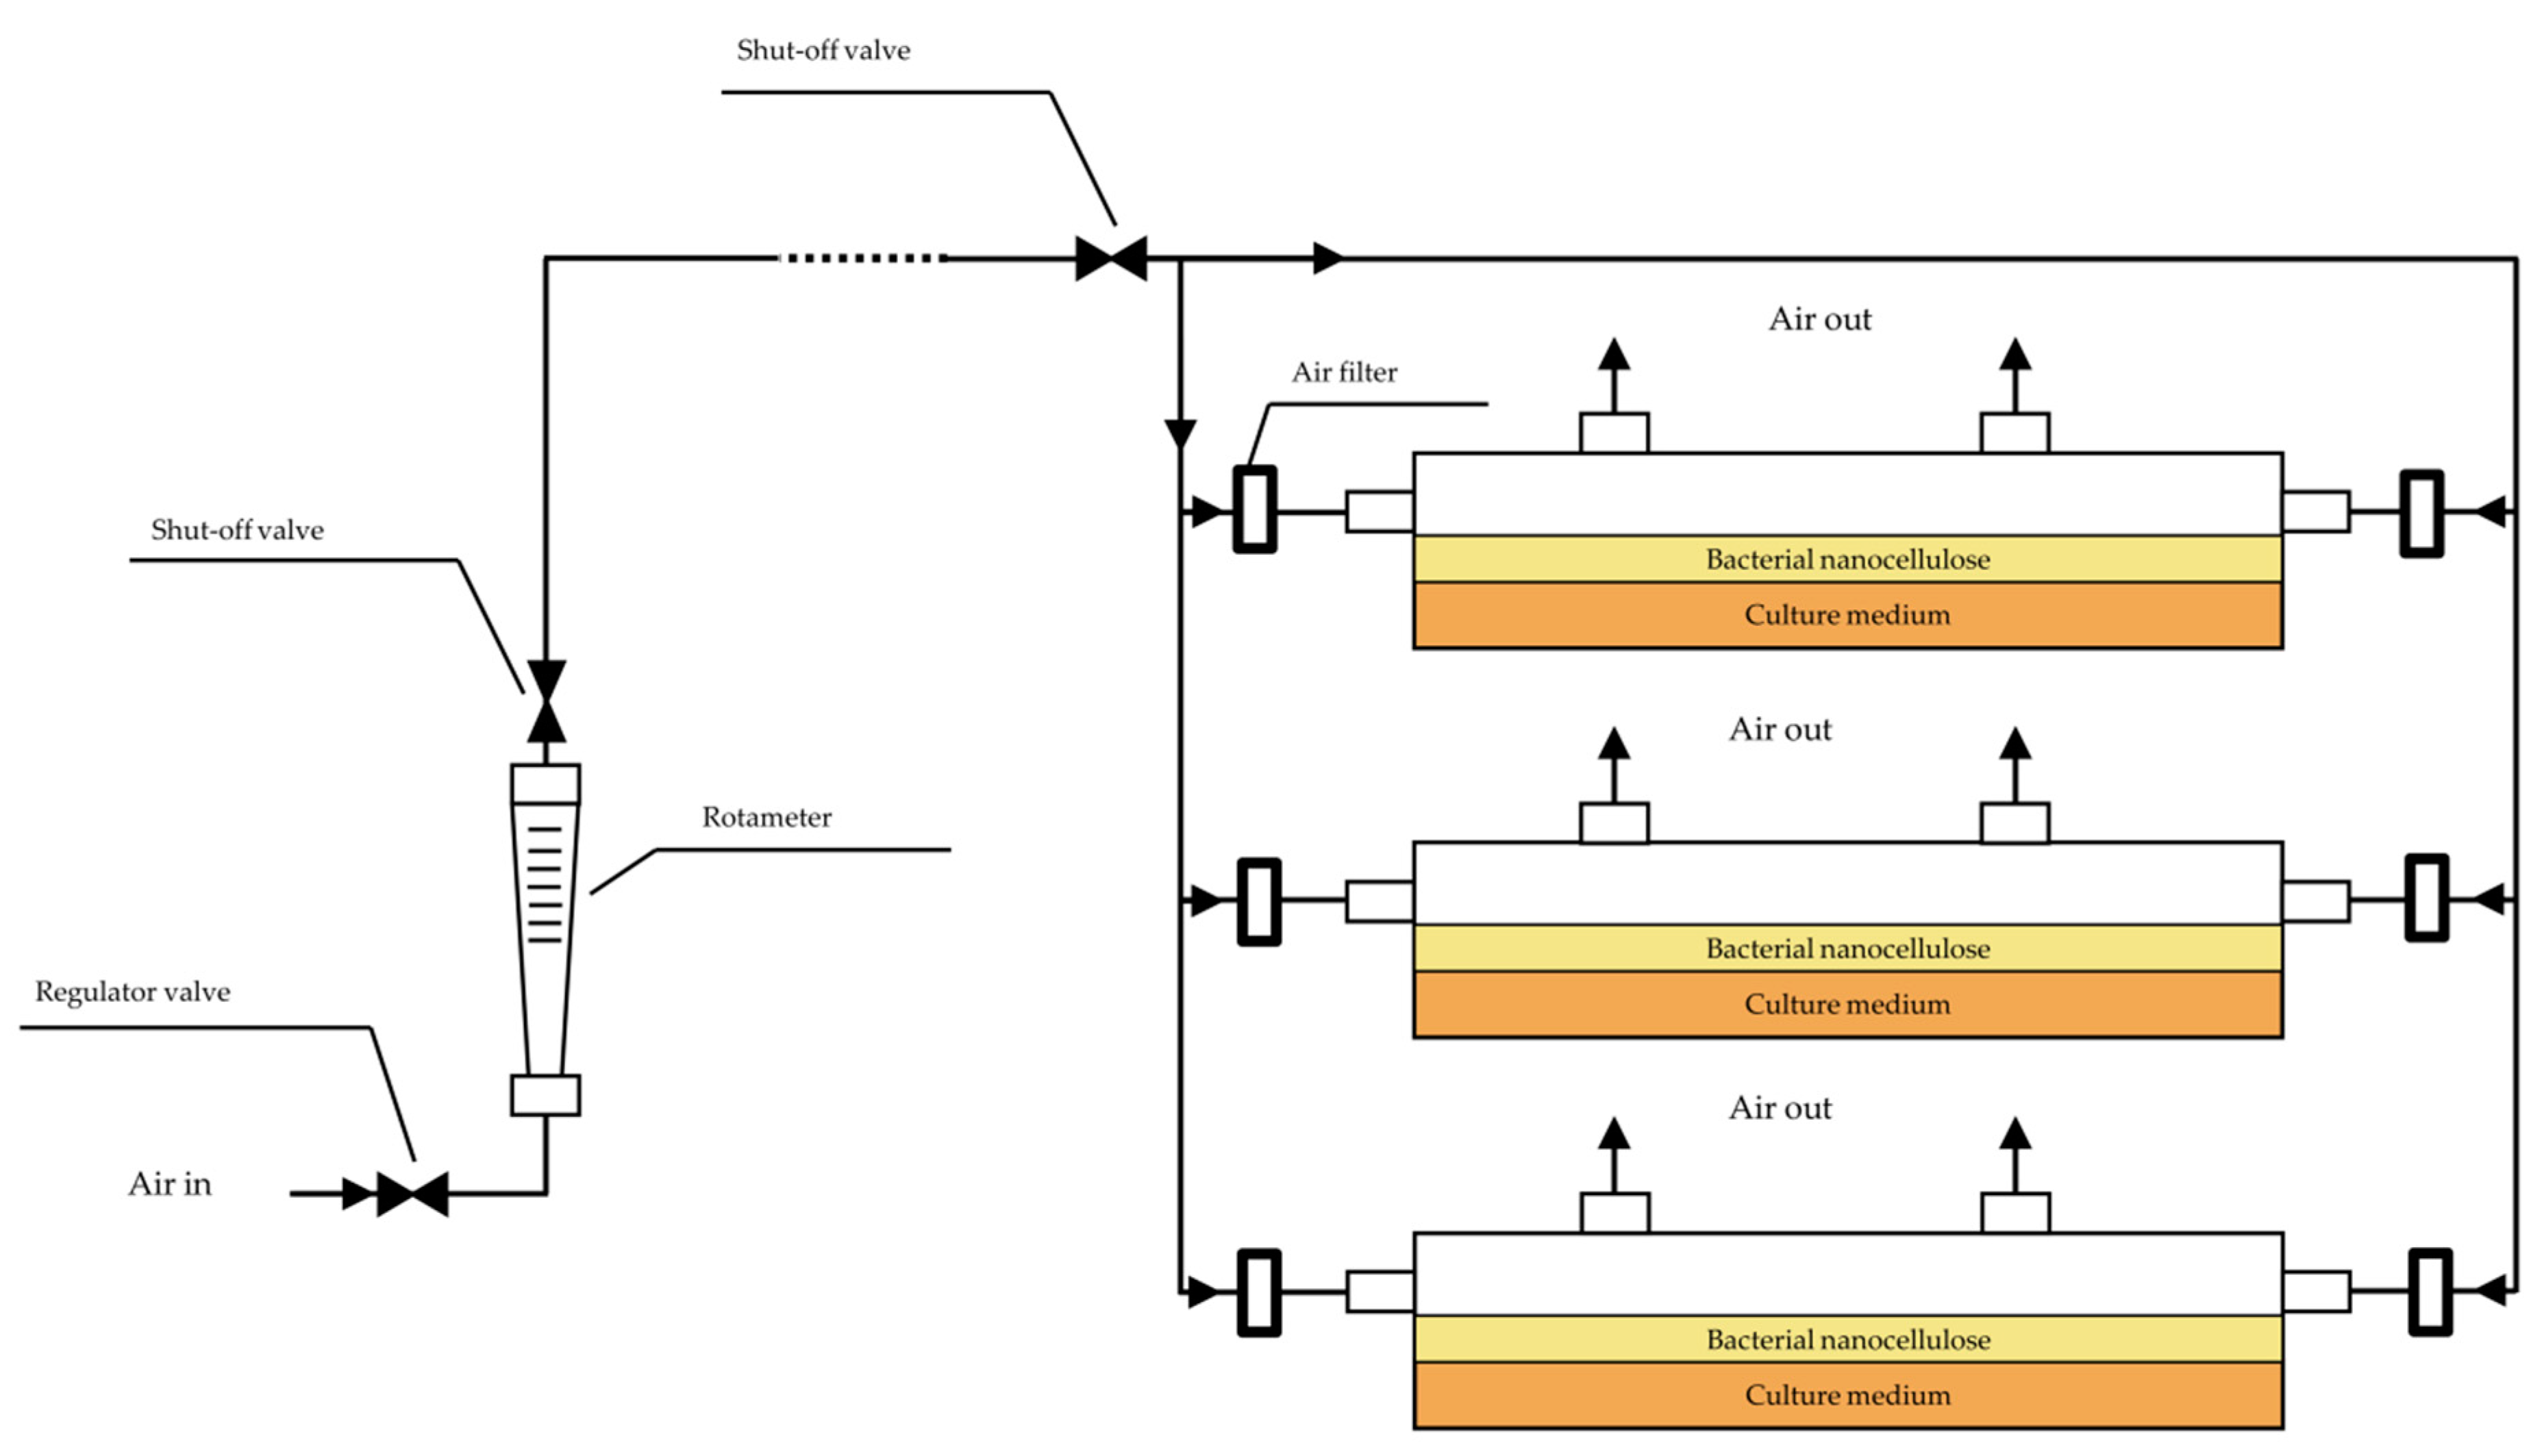
2.3. Air-Flow Bioreactor Set

Stationary production of cellulose pellicles is done in plastic or glass trays with different shapes. In our study, we modified the bioreactor set to achieve higher productivity of BNC. In Figure 1, the schema of the new bioreactor set is shown. The glass trays with dimensions 164 mm × 116 mm × 70 mm and 560 mm × 370 mm × 70 mm were equipped with spigots, which allow introduction of air inside the bioreactors during culture. Air is fed into a compressor and passed through the automatic valve equipped with a flow meter, where the flow ratio is measured and regulated. Air is purified on sterile filters (PTFE, 0.22 µm) and is introduced into the bioreactors by two spigots. Inlets of air are placed opposite to each other and parallel to the surface of the growing membrane, while the two outlets are placed in the top cover. This bioreactor design allows ventilation of the culture without movement of the membrane. The SAF bioreactor was used in the PBD study and in determination of the effect of air flow ratio on BNC yield and mechanical properties.

2.4. Evaluation of Process Parameters on Yield of Bacterial Nanocellulose Biosynthesis

In this research the PBD was employed to determine the main effects of individual process parameters on BNC production. The Plackett–Burman design is a useful tool for screening numerous factors in terms of their affectivity on the process without study of interactions among variables. This statistical method is based on the first order model equation:
Y = β 0 + β i X i ,
where Y represents the studied response, β0 is the model intercept, βi is the regression coefficient, and Xi is the factor.
The impact of nine input factors, namely bioreactor area, surface to volume ratio, air flow ratio, humidity of air, glucose concentration, pH, age and volume of inoculum, and cultivation time, was studied. Process parameters were tested at two levels (low and high, −1 and +1, respectively) in 12 trials (Table 1). Additionally, two dummy factors were considered, which were imaginary variables. The change between levels is not supposed to cause any effects on the studied responses. The use of dummy factors allows evaluation of systematic errors or determination of the unknown significant variables. Variables and dummy factors were arranged randomly in a matrix. The dry weight of cellulose, the glucose conversion into BNC, and the yield, calculated as a dry weight per surface unit, were taken as a response. All experiments were done in the SAF bioreactor. The main effects were calculated as a difference between the average measurements at the high and low level of each variable. The significance of each factor was assessed using Student’s test and a low p-value (<0.05) determines a significant effect. The PBD matrix (Table 2) was generated using MiniTab18®software (Minitab18, Minitab LLC, State College, Pennsylvania, USA, 2018). All experiments were carried out in three replicates.

2.5. Evaluation of Process Parameters on Mechanical Strength and Biosynthesis Yield of Bacterial Nanocellulose

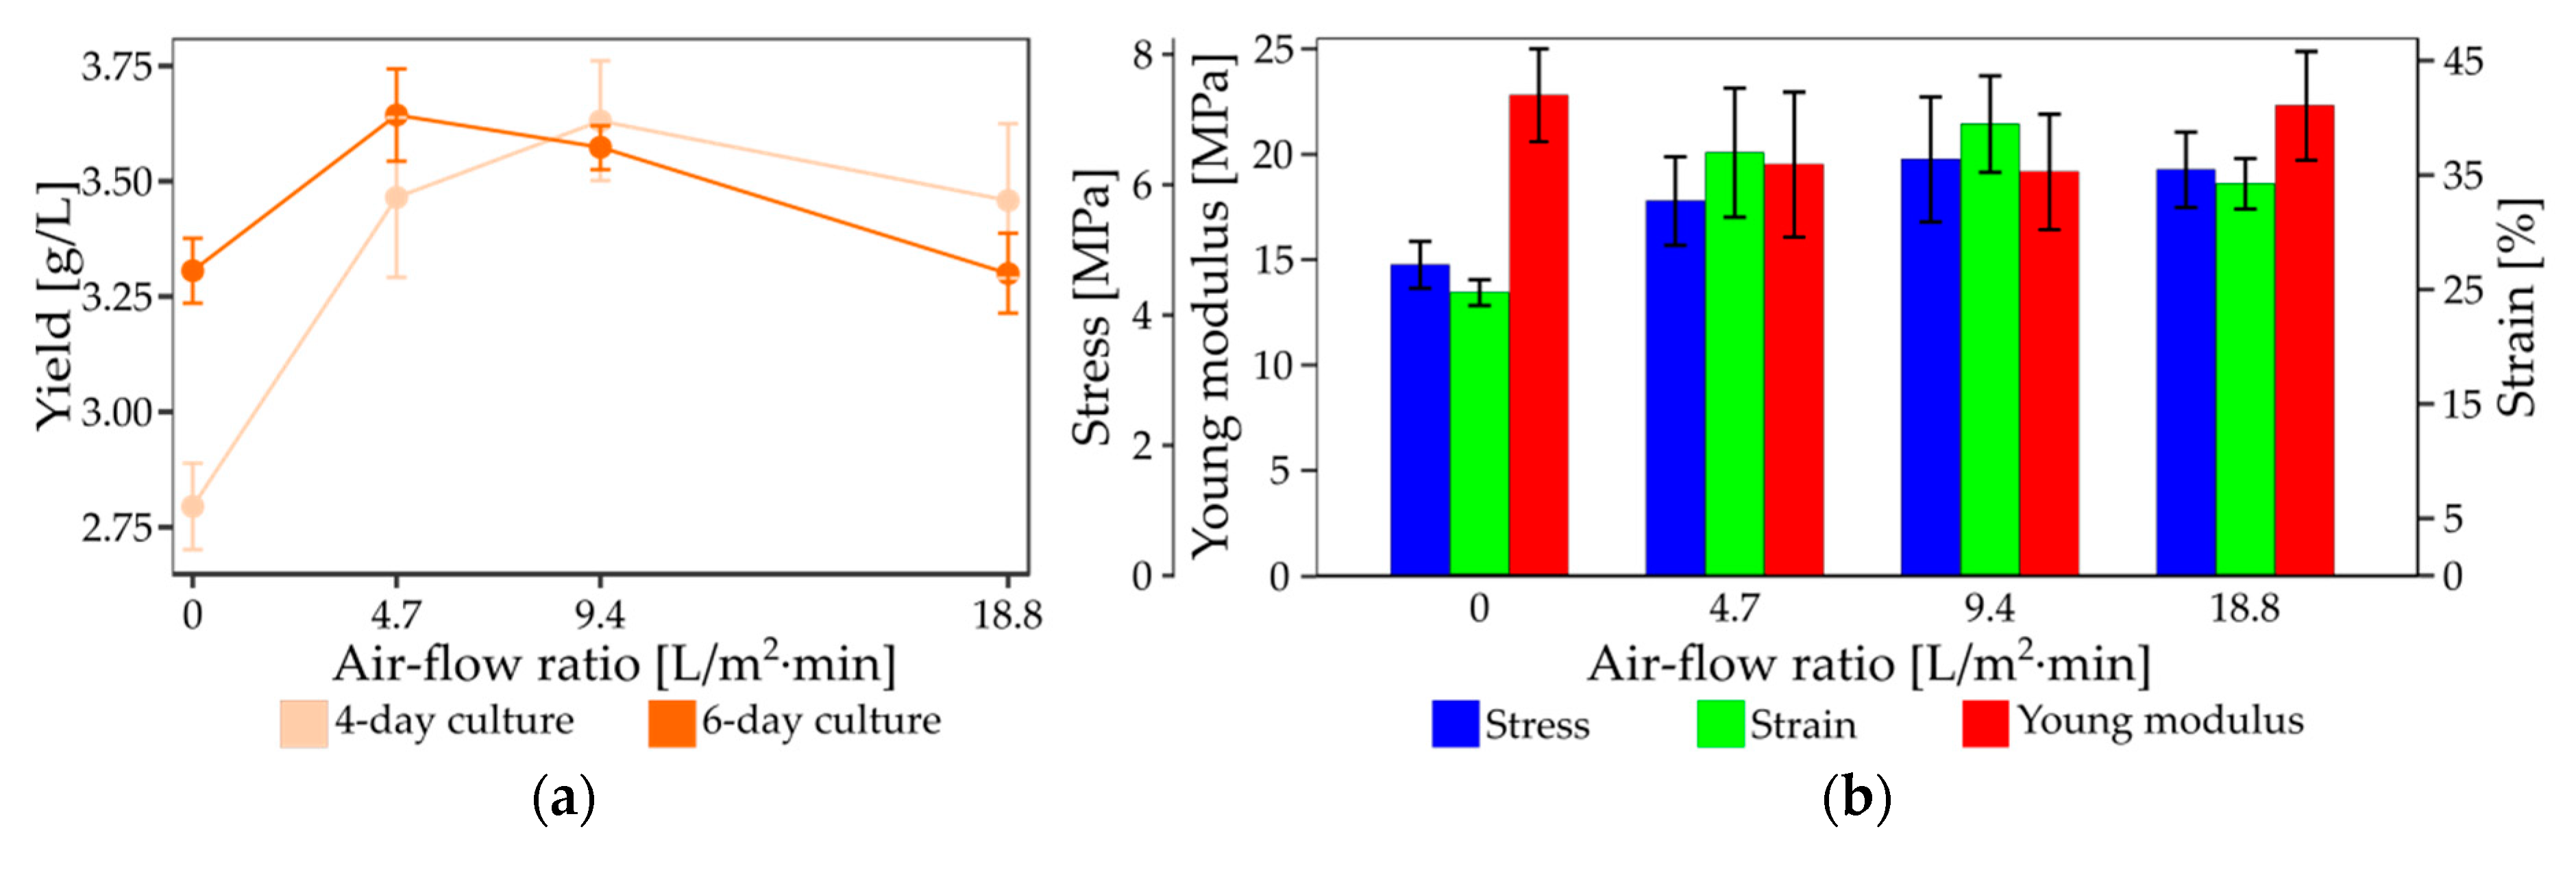
2.5.1. The Influence of Air-Flow Ratio

The experiment was carried out in bioreactors with an area of 2070 cm2 and the air flow ratio was 0, 4.7, 9.4, or 18.8 L/min·m2. The effect of the studied variable was determined after 4- and 6-day culture. Standard SH medium with 1% ethanol was used for each culture. The s/v ratio was 0.71 cm−1. Inoculum was prepared as described in Section 2.1. After culturing, the produced BNC pellicles were separated from the culture broth and purified.

2.5.2. The Effect of Inoculum Parameters

The two parameters of inoculum were assessed in terms of BNC yield and mechanical properties. The impact of the age of inoculum was determined for 1-day to 5-day inoculums, whereas the inoculum volume was in the range between 2% and 10%, with an interval of 2%. Each culture was prepared in standard conditions in the bioreactor with an area of 190 cm−1 and cultivated for 6 days.

2.5.3. The Impact of Culture Conditions

In this experiment the effect of pH, glucose concentration, and culture time was determined. Each factor was studied separately without changing any factors of the standard conditions of culture. The pH varied from 3.5 to 7.0 with interval 0.5, glucose concentration was in the range 5–40 g/L, and the cultivation time was studied daily for 7 days. Each culture was prepared in a standard condition in the bioreactor with an area of 190 cm−1 and cultivated for 6 days.

2.6. Analytical Methods

2.6.1. Measurement of Dry Weight, Glucose Conversion to Cellulose, Yield, and Productivity of Bacterial Nanocellulose

The dry weight of cellulose was assessed by drying membranes in a vacuum gel dryer (Model 543, Bio-Rad, CA, USA) at 80 °C for 4 h until it reached the constant weight. Glucose conversion to cellulose was calculated from the following equation:
C o n v e r s i o n   ( g B N C / g g l u c o s e ) = W d C 0 · V 0 C 1 · V 1 ,
where Wd is the weight of dry membrane and C0 and C1 are initial and final glucose concentration, respectively, and V0 and V1 are volume of medium at the beginning and after cultivation, respectively. The glucose concentration was assessed using a GLUCOSE test (BioMaxima, Lublin, Poland).
The BNC yield was calculated as the dry weight of purified membranes per 1 L of culture medium, whereas productivity was determined as a yield divided by the culture time.
The measurements were carried out at least three times for each culture condition.

2.6.2. Mechanical Strength

Tensile strength measurements were done using a universal testing machine (Zwick/Roell Z1.0, Ulm, Germany), according to the method described by Cielecka et al. [5]. Before the tensile tests, membranes were pressed until 1 mm in thickness was achieved. Three mechanical parameters, namely maximum stress, elongation and Young modulus were determined. The TestXpert@II software (version 3.61, ZwickRoell GmbH & Co.KG, Ulm, Germany, 2015) was used for estimation of the maximum stress and elongation. Stress (MPa) was calculated as F/A, where F is the loading force (N) and A is the cross-section area of a sample (m2). Strain (%) was calculated as ΔL/L0 × 100%, where L0 is the initial length and ΔL is the exerted extension from starting point. The Young modulus under tension was determined from the stress/strain curve. The measurements were performed in at least nine replicates.

3. Results and Discussion

This study aimed to determine the process parameters simultaneously affecting the yield and mechanical properties of bacterial cellulose. The first stage of research was focused on factors influencing the bacterial cellulose production. There were two terms related to the yield taken into account, namely dry weight of cellulose and glucose conversion into cellulose. Additionally, analysis of the yield calculated as the dry weight per surface unit was performed (Appendix A). The second part of studies was based on classical one-factor-at-a-time (OFAT) and the yield and tensile properties were assessed depending on each independent factor chosen after the PBD study.

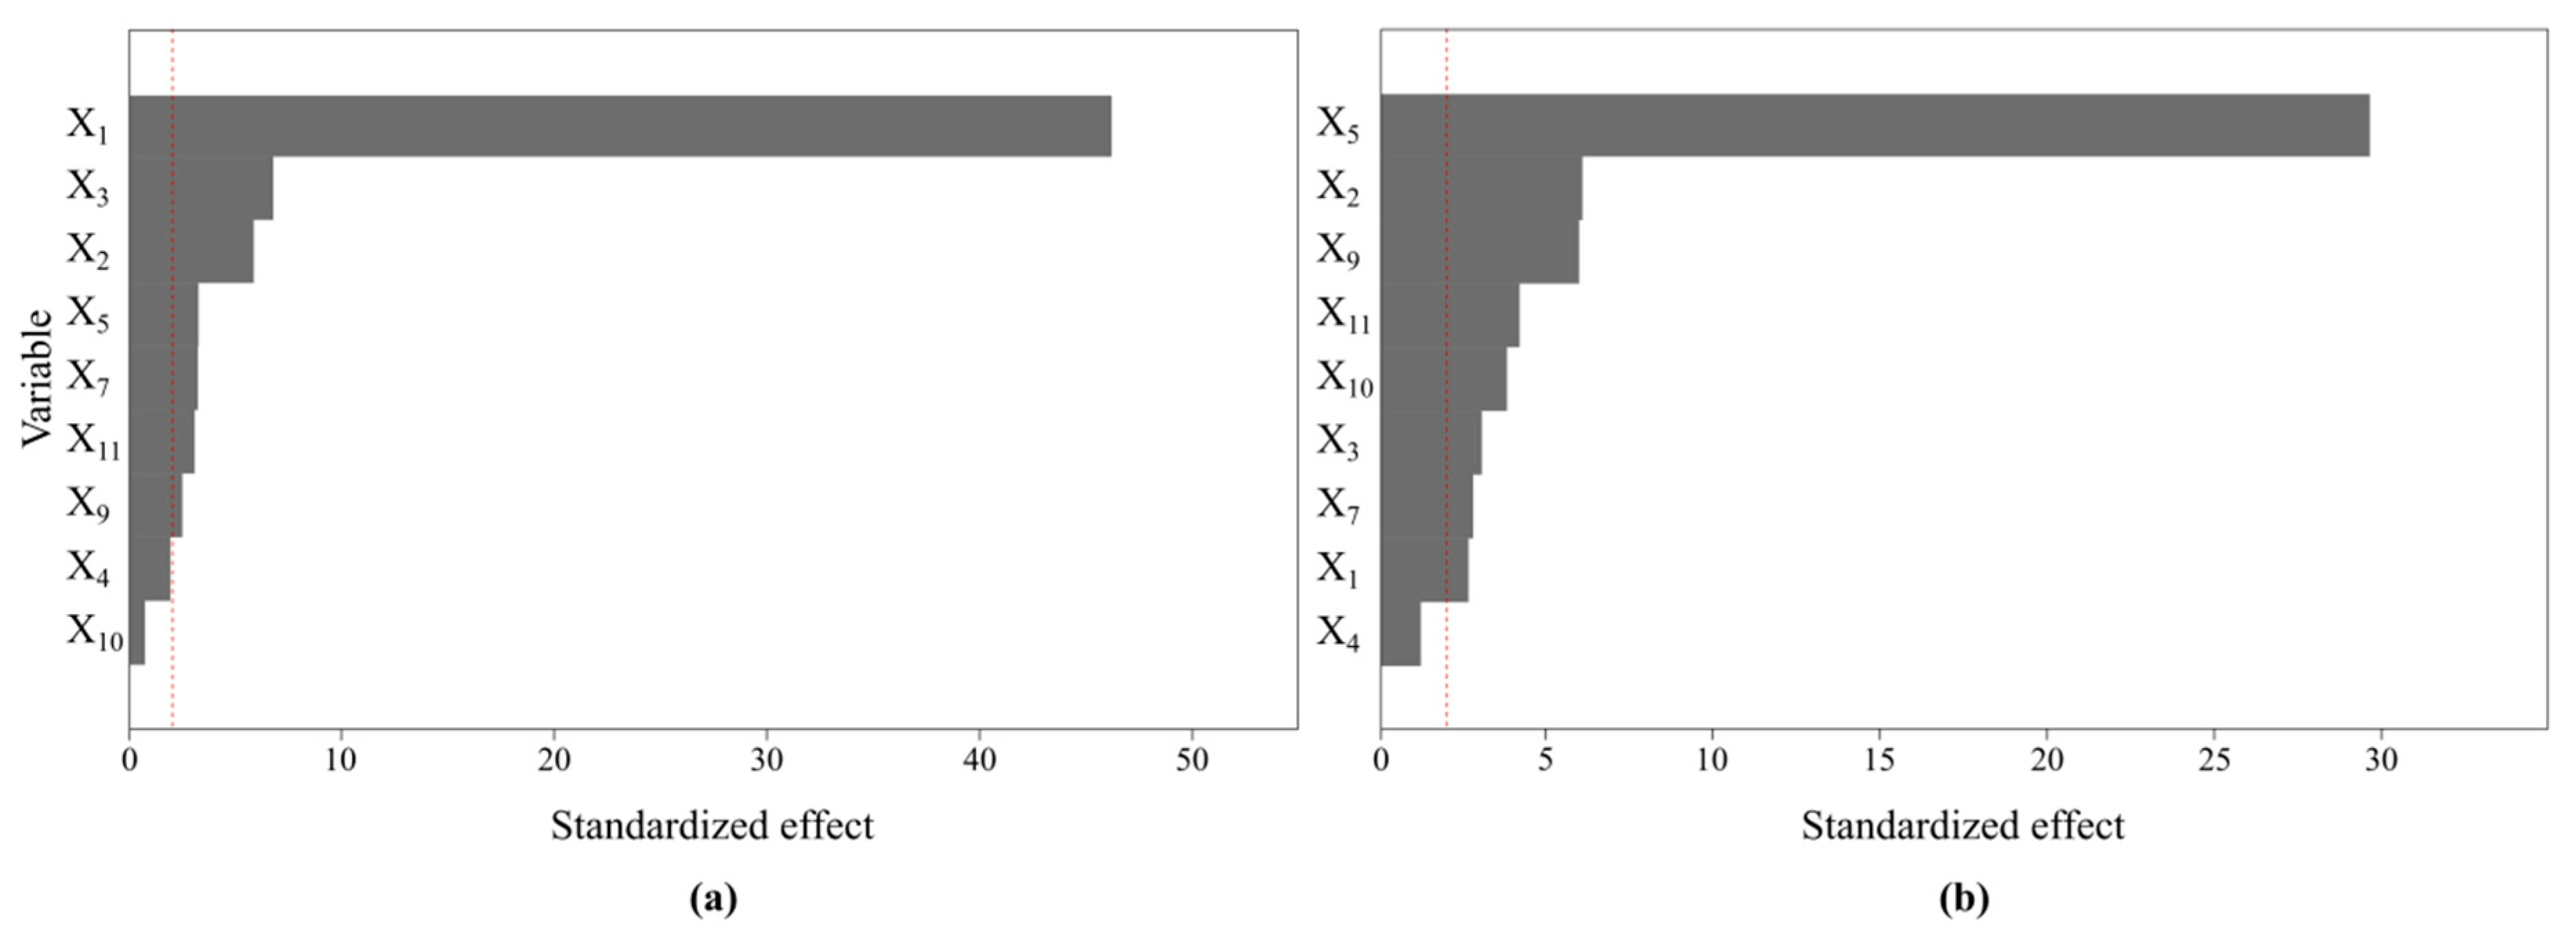
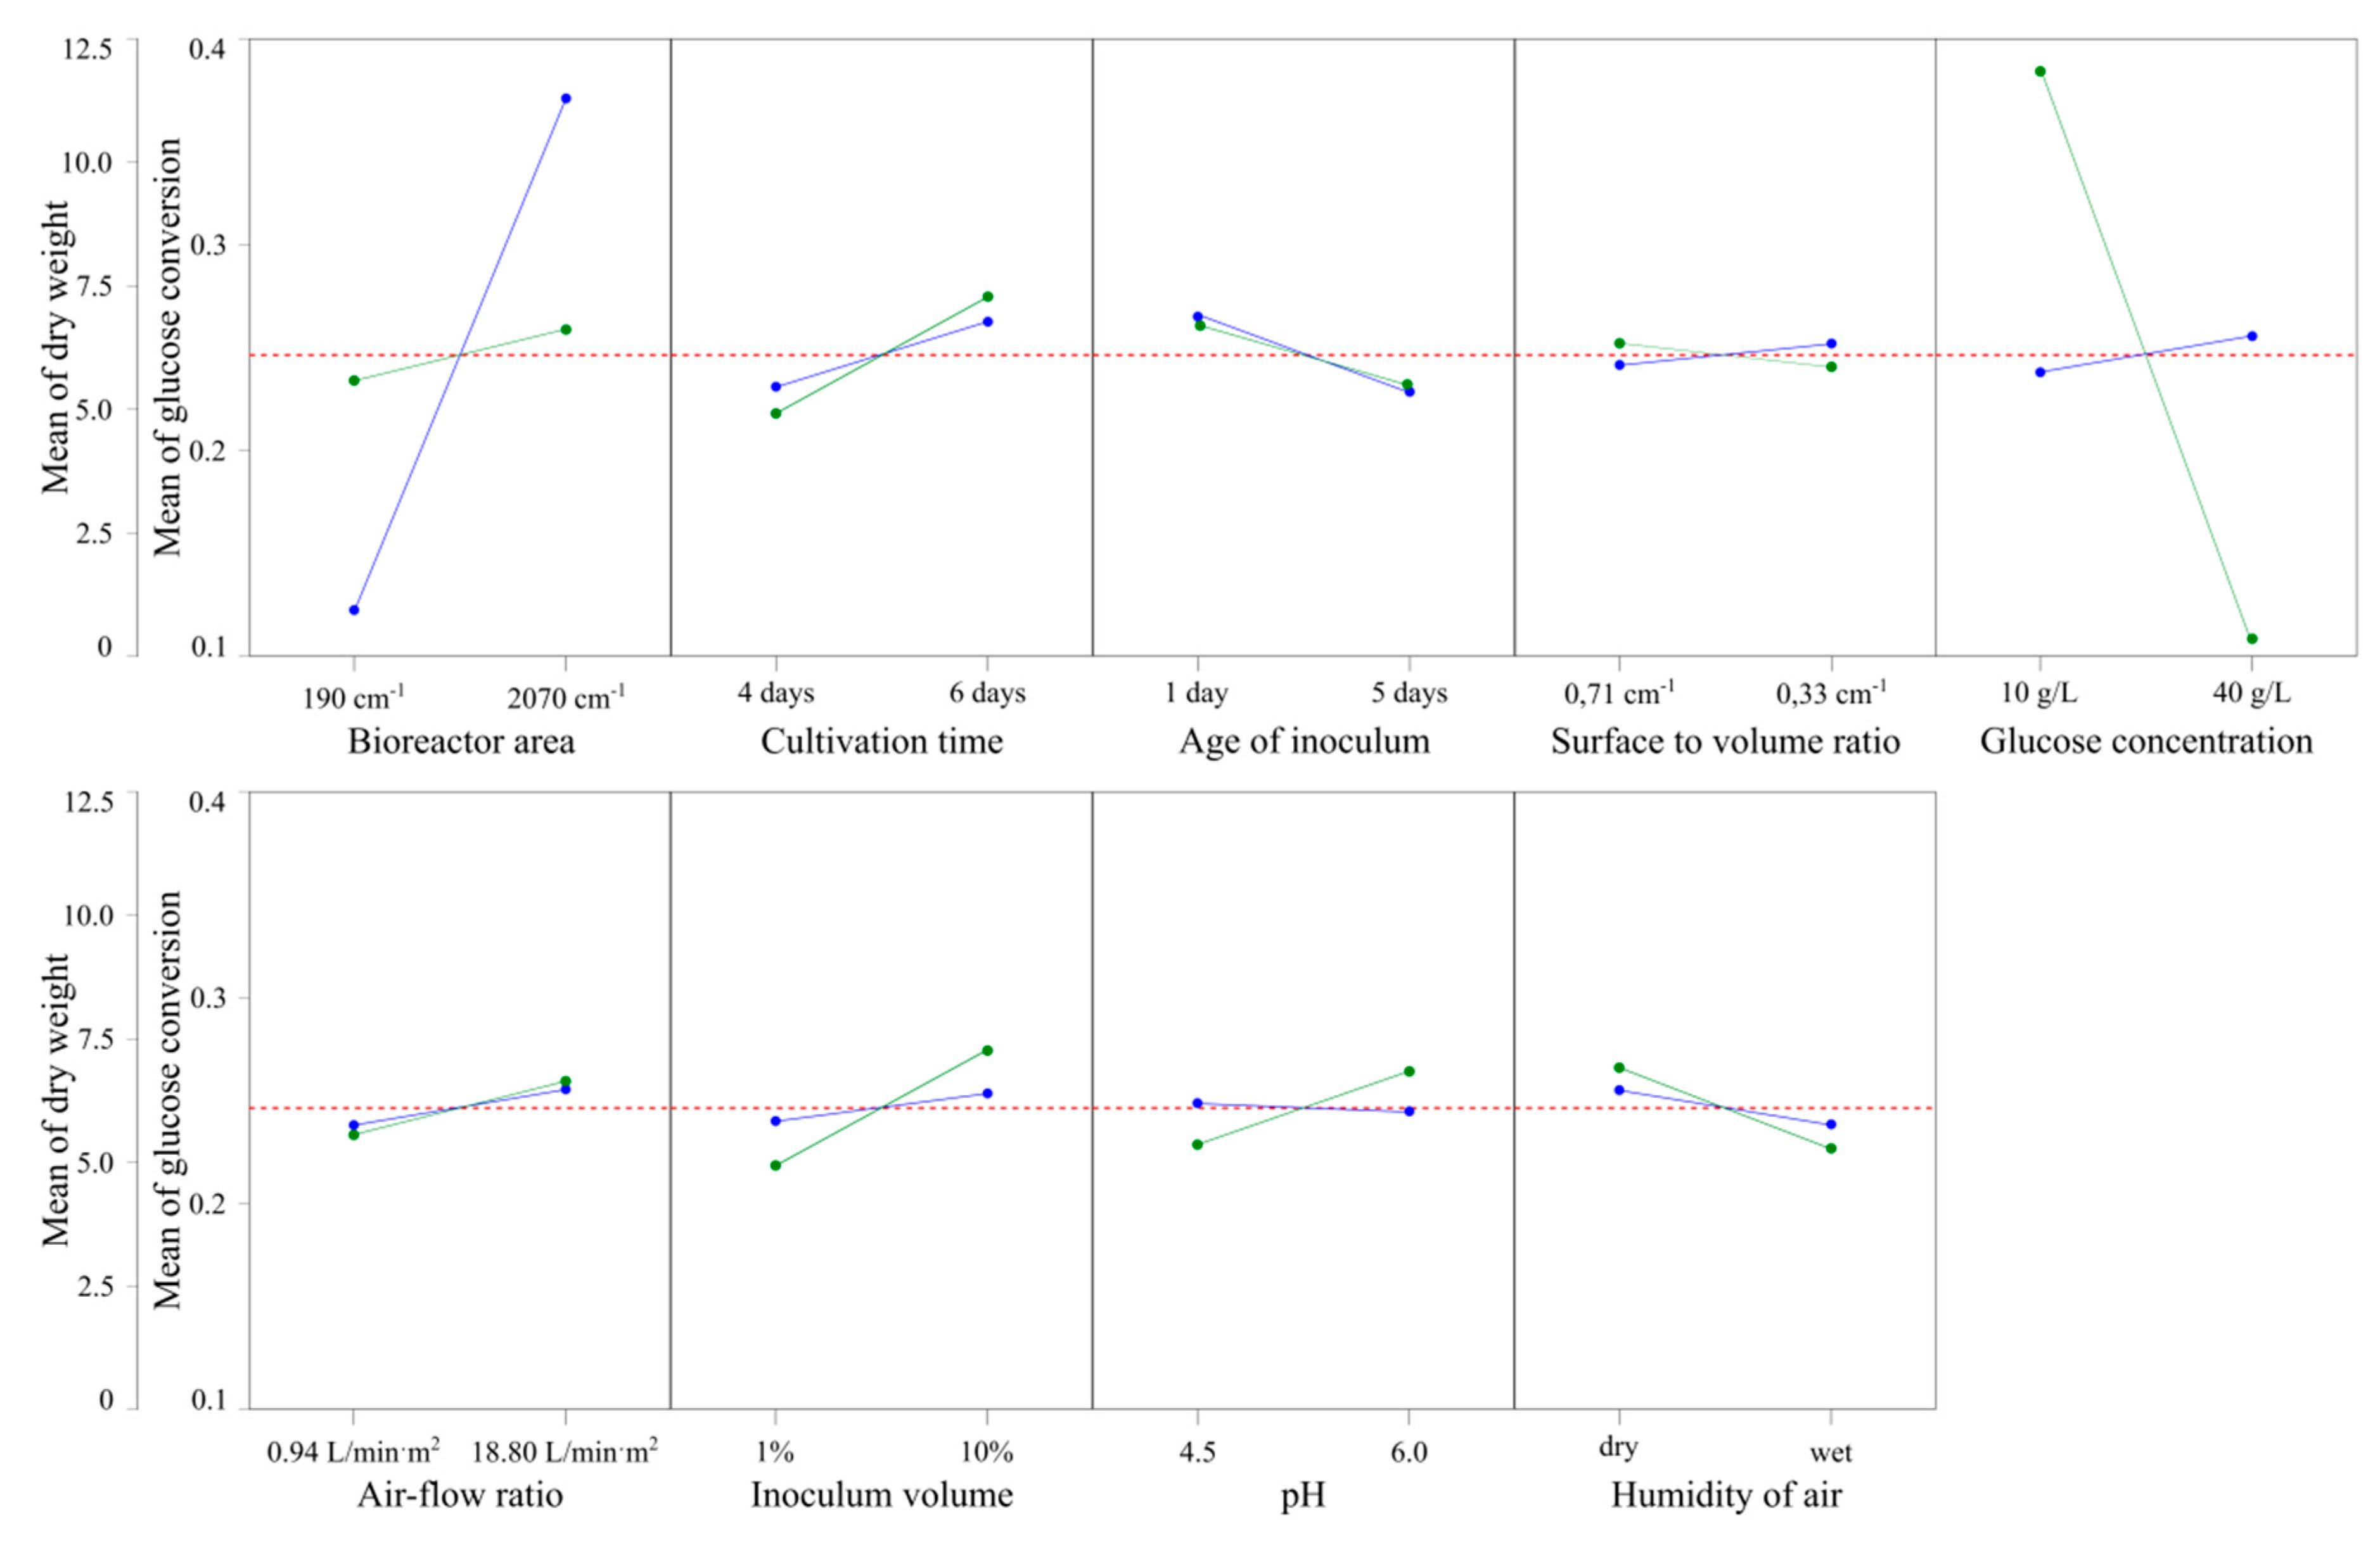
3.1. Evaluation of Impact of Process Parameters on BNC Biosynthesis Yield

The Plackett–Burman design was used to identify the most important factors in terms of the BNC production. This statistical method is a useful tool for the identification of factors which significantly influence the process without a detailed analysis of correlation between them. Based on literature, nine factors were typed to this research, namely bioreactor area, surface to volume ratio, air flow ratio, humidity of air, glucose concentration, pH, age and volume of inoculum, and cultivation time. The effects of examined input variables were calculated based on results presented in Table 2 and visualized in Figure 2 as Pareto charts and in Figure 3 as a main effect plots. The analysis performed for the yield calculated as the dry weight per surface unit is presented in Appendix A.
From the Pareto charts and main effect plots it can be seen that almost all the studied variables have significant effects on BNC biosynthesis. In case of the dry weight of cellulose, only the s/v ratio and pH were not significantly effective (p value at 0.465 and 0.063, respectively), while for glucose conversion the s/v ratio was insignificant (p value at 0.232). The most important factor to maximize the dry weight of cellulose was bioreactor area (Figure 2a) with a contribution of 94.6% (Table 3) followed by the age of inoculum and incubation time. For glucose conversion the highest impact of glucose concentration was noted, with a contribution of 87.1%. The high impact of cultivation time and inoculum volume was also observed. Various studies based on PBD approaches were done to determine the most significant factors that increase BNC yield for different strains. Mohite, Kamalja, and Patil reported that the highest influencers of BNC yield were the temperature, pH, sucrose, and MgSO4 concentration in case of agitated culture of K. hansenii NCIM 2529 [23]. Hegde et al. observed that the most effective variables for high BNC biosynthesis by G. persimmonis were the nitrogen source and glucose concentration [11]. In case of G. xylinus cultured in the carob-haricot bean medium, the highest impact of incubation time and nitrogen source, followed by inoculum ratio, was observed [12]. On the other hand, Saleh et al. reported significant positive effects of MgSO4, pH, ethanol, and yeast extract on BNC production by K. hansenii AS.5 in Yamanaka medium [24]. It seems that the influence of factors varies for different bacterial strains, culture media, and culture conditions. Moreover, statistical significance of individual variables is dependent on the rational settings of low and high levels of studied factors.
In our studies, there were four parameters (X1, X2, X7, and X8) with positive effects on both studied responses, and two factors which negatively affected both the dry weight of cellulose and glucose conversion (X3 and X11). Namely, higher bioreactor area, longer incubation time, higher air-flow ratio, and higher concentration of inoculum lead to more efficient BNC production (Figure 3). On the other hand, age of inoculum and moist air instead of dry have a contrary trend.
The six factors which had a significant effect on at least one response will be taken into consideration in the second stage of this study which involves detailed analysis of the impact of culture conditions on the yield and mechanical properties. Studied variables have the continuous characteristic of setting values and it is possible to determine their impact on both responses in a wide range. Bioreactor area and humidity of air were significant, but in the SAF bioreactor, those parameters have only two settable values. Therefore, their impact will be discussed in the next step based on PBD data. The impact of air-flow ratio will be studied using the dry air and bioreactor area of 2070 cm2. Another study will be carried out with a bioreactor with an area of 190 cm2. To avoid high differences in results between experiments the production of BNC will be assessed as a yield per 1 L of culture medium (g/L).

3.2. Impact of the Bioreactor Settings on the Yield and Mechanical Properties of Bacterial Nanocellulose

Selection of the most suitable process parameters for BNC production can significantly influence both the yield and properties of BNC. Tensile strength is one of the parameters which characterize the quality of BNC, besides crystallinity and high water holding capacity (WHC) in a lot of applications. In this paper, we propose a two-stage approach to simultaneously study the impact of a wide range of factors on the yield and mechanical properties of bacterial cellulose. In the first step, we focused on the fast screening of variables affecting the production yield. Afterwards, for the chosen significant process parameters, the mechanical strength was correlated with the yield depending on the value of individual variables.
Screening of process parameters which influence the biosynthesis yield was designed using PBD. We assessed two responses connected with the yield, namely dry weight of cellulose and glucose conversion ratio. The first allows direct evaluation of the yield, whereas the glucose conversion ratio shows economical aspects of the process. In our study, we used modified standard bioreactors for static culture. The SAF bioreactor allows introduction of fresh air inside the bioreactor without movement of the growing cellulose membrane. The Plackett–Burman design matrix contained nine variables at two levels. Analysis of the data shows that seven or eight of them significantly influence the dry weight of cellulose or glucose conversion ratio, respectively.
Bioreactor area was the factor which most affected the dry weight of cellulose, but in case of glucose conversion ratio and the yield, calculated as the dry weight per surface volume, its impact was lower. In static culture, BNC is formed across the surface of the media at the air–liquid interface. Therefore, the greater the surface area of the bioreactor, the higher cellulose mass should be obtained [25]. Basu, Vadanan, and Lim also studied the effect of bioreactor area on the dry weight of cellulose, yield, and glucose conversion ratio [13]. The authors reported that this parameter strongly affects the dry weight of cellulose as a result of oxygen transfer for the growth of cells. On the other hand, the impact of bioreactor area on the production yield and glucose conversion ratio was insignificant. This is in accordance with our results, where the bioreactor area had the positive effect on the glucose conversion ratio, but its contribution was only 0.7%. The obtained results allow the conclusion that at the production scale, the bioreactor area does not affect cost in terms of the amount of cellulose achievable per unit volume of medium.
Surface to volume (s/v) ratio is the only variable which was insignificant for both studied responses. This parameter is inverse to the high of medium in bioreactor. The higher the depth of the medium, the lower s/v ratio obtained. If the volume of the medium is not the limiting factor during culture, BNC could grow up to the stagnation point [25]. In this condition, the thickness and dry weight of pellicle are not strongly affected by the s/v ratio. For optimization of the production yield, the s/v ratio should be maximized by taking into account other process parameters. First of all, the thickness of membranes, and therefore the medium depth, depends on the used Komagataeibacter strain. Previous studies reported an optimal surface to volume ratio for K. xylinus E25 at 0.71 cm−1 [26], while for other strains the s/v ratio of 2.2 cm−1 and 0.39 cm−1 [25] gave the highest yield. Also, for higher volumes (lower s/v ratio) of medium, there are more bacteria cells added with inoculum than in case of lower medium volume, although the density of cells is the same. Due to the aerobic nature of Komagataeibacter strains, most of the bacteria grow at the air–liquid interface, not in the entire volume of medium. Therefore, for higher volumes of medium, the surface density of bacteria is greater and it drives more extensive biosynthesis yield at early stages in the lag phase [14]. In this context, the s/v ratio should be connected with a parameter defining cell density per surface unit, not the volumetric density. Moreover, the thickness of the BNC membrane increases with time. For long-time culture, a higher amount of medium must be used. On the other hand, the membrane grows only to the stagnation point due to the limitations of oxygen or nutrients [8]. For economically profitable production, the minimum depth of medium in the designed conditions should be only a little higher than maximum predicted thickness of the BNC. In case of a lower amount of medium, less dry weight of cellulose will be obtained. Contrarily, a higher amount of medium will result in the wastage of the culture medium and lower BNC yield per volume unit. The optimum s/v ratio for K. xylinus E25 was reported as 0.71 cm−1. In our study we used 0.71 cm−1 and 0.33 cm−1 which can be calculated as a 1.4 cm and 3.0 cm of medium depth, respectively. The lack of significant effect on both dry weight of cellulose and glucose conversion ratio confirms that the s/v ratio at 0.71 cm−1 is enough for sufficient production yield.
Production of BNC in a SAF bioreactor is connected to two parameters, namely the air-flow ratio and the humidity of air. Both factors affected the dry weight of cellulose and glucose conversion ratio (Figure 4).
Detailed study showed that cellulose yield (Figure 4a) and mechanical strength (Figure 4b) were positively regulated by the air-flow ratio. Impact of that parameter was evaluated after 4- and 6-day cultures. A similar bioreactor set was designed by Dobre et al. [15], with slight differences. In contrast to our studies, air was introduced by an air distributor from the top, not parallel to the membrane and the air specific flow rate was between 0.21 and 0.63 cm3/cm2·s, which can be calculated as 126 and 378 L/m2·min. The applied air flow ratio was much higher than air flow used in our study. In this condition, authors reported significant effects on water specific use, which is related to water evaporation. Nevertheless, the BNC yield was not affected. Presumably, a lower air-flow ratio is preferable for efficient production. From Figure 4a it can be seen that, after a 4-day culture, the dry weight of cellulose from culture fed with air was 24–28% higher than the control condition. Furthermore, the dry weight of 4-day-BNC from the tested condition was slightly higher than the dry weight of 6-day-BNC from the control condition. On the other hand, the air flow ratio was significant in terms of 6-day culture, but the differences were lower. It can be explained that cellulose growing in the presence of air flow at 4.7–18.8 L/m2·min reached the bottom of bioreactor after 4 days and further biosynthesis is limited. For higher yield, the lower s/v ratio should be considered. We can conclude that air flow increases the production rate from 0.55 g/L/day (6-day culture, standard condition) to 0.91 g/L/day (4-day culture, air-flow ratio at 9.4 L/m2/min) at the biosynthesis yield 3.31 g/L and 3.63 g/L, respectively. Therefore, in the favorable condition, the productivity was improved by 65%. Acceleration of BNC biosynthesis is probably caused by higher diffusion of nutrients as a consequence of water evaporation. Thus, bacteria trapped in the upper part of the membrane have better access to carbon and nitrogen sources. Data obtained for the humidity of air are in accordance with our conclusions. The moisture in air limited the water evaporation and a negative effect of humid air on cellulose dry weight was observed (Figure 3). Also, continuous supply of fresh air results in ventilation of cultures from carbon dioxide, and oxygen concentration is unchanged during cultivation. Modification of the bioreactor set also caused changes in mechanical parameters of BNC. Despite showing only slight differences in dry weight of cellulose after 6-day culture, the stress was increased from 4.77 MPa (control condition) to 6.39 MPa (air-flow ratio at 9.4 L/m2/min). Additionally, the membranes from cultures with air-flow were more stretchable. The strain for control BNC was only 25%, while for BNC from tested condition was 34–40%. The Young modulus was not significantly changed.

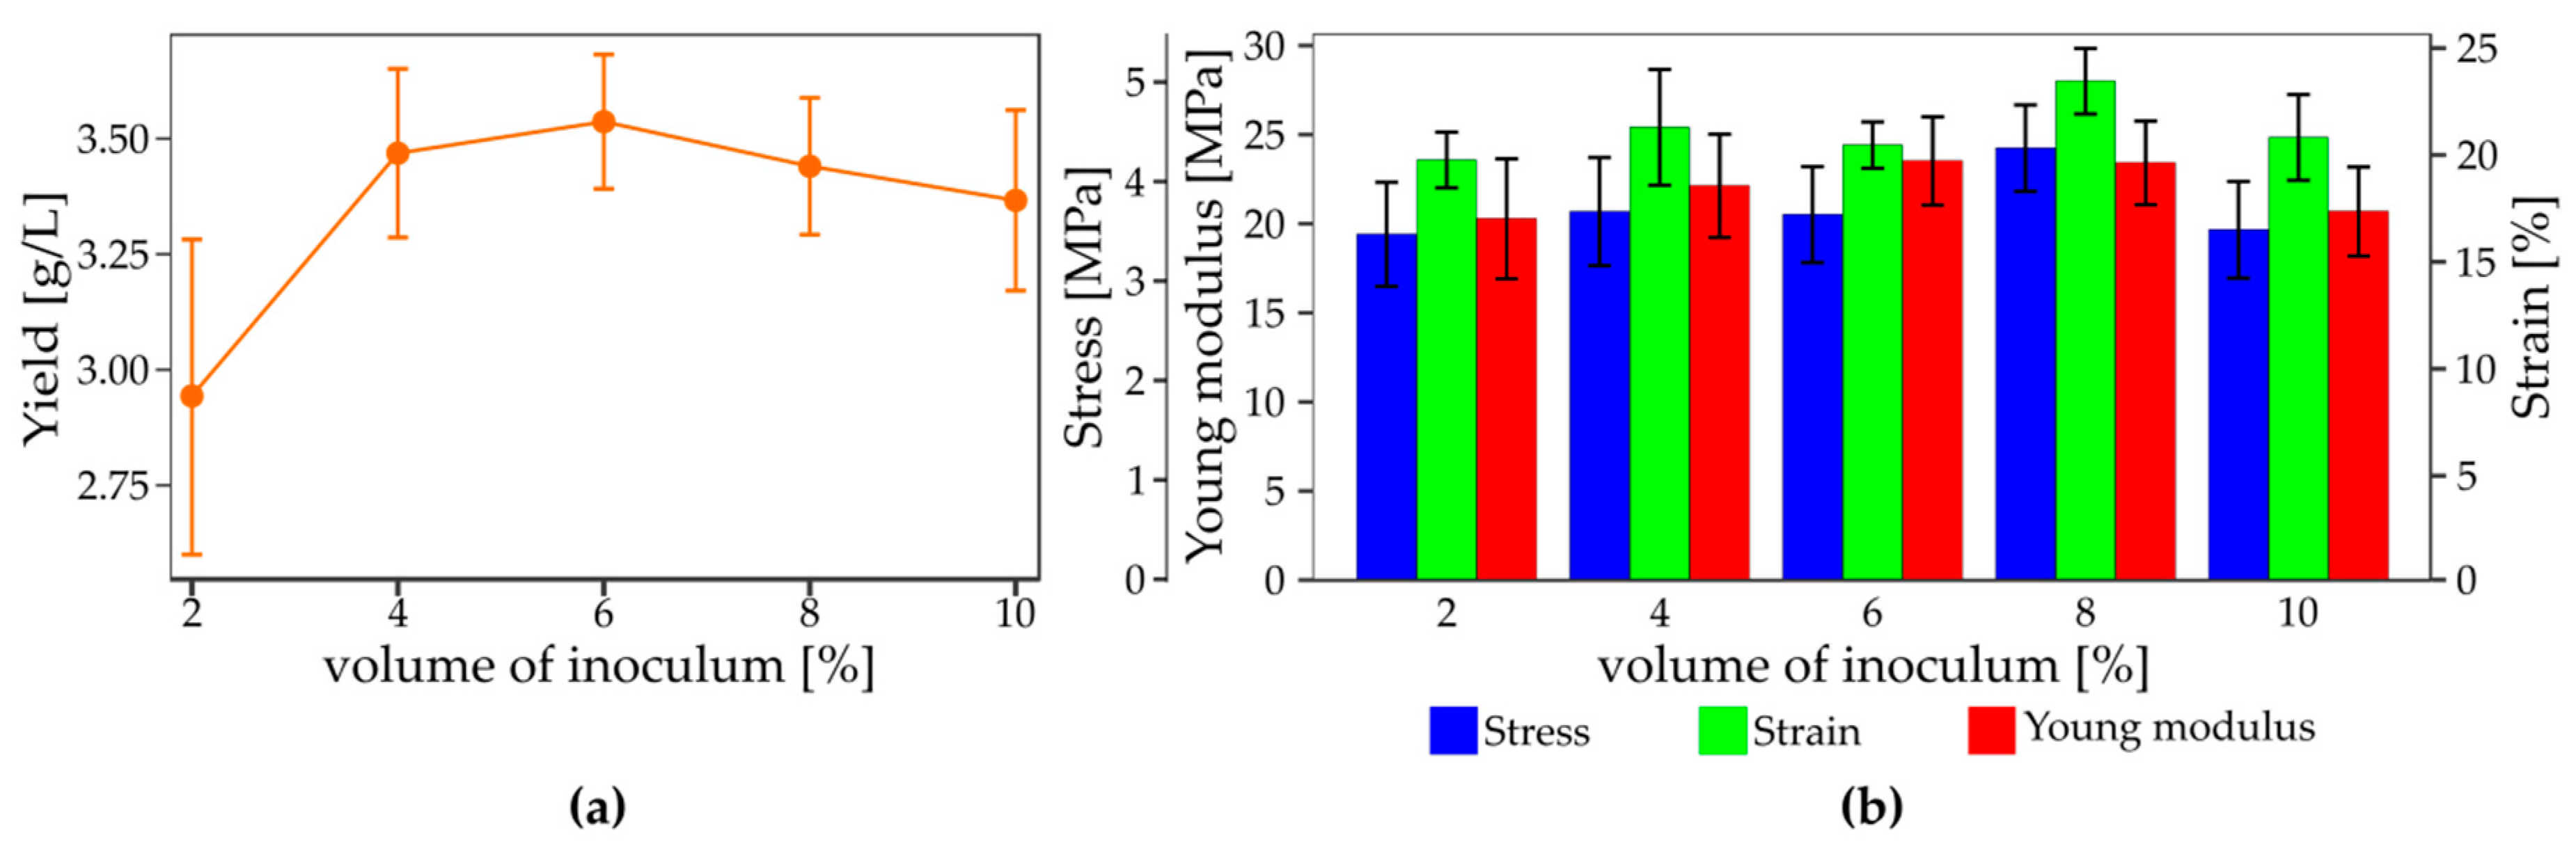
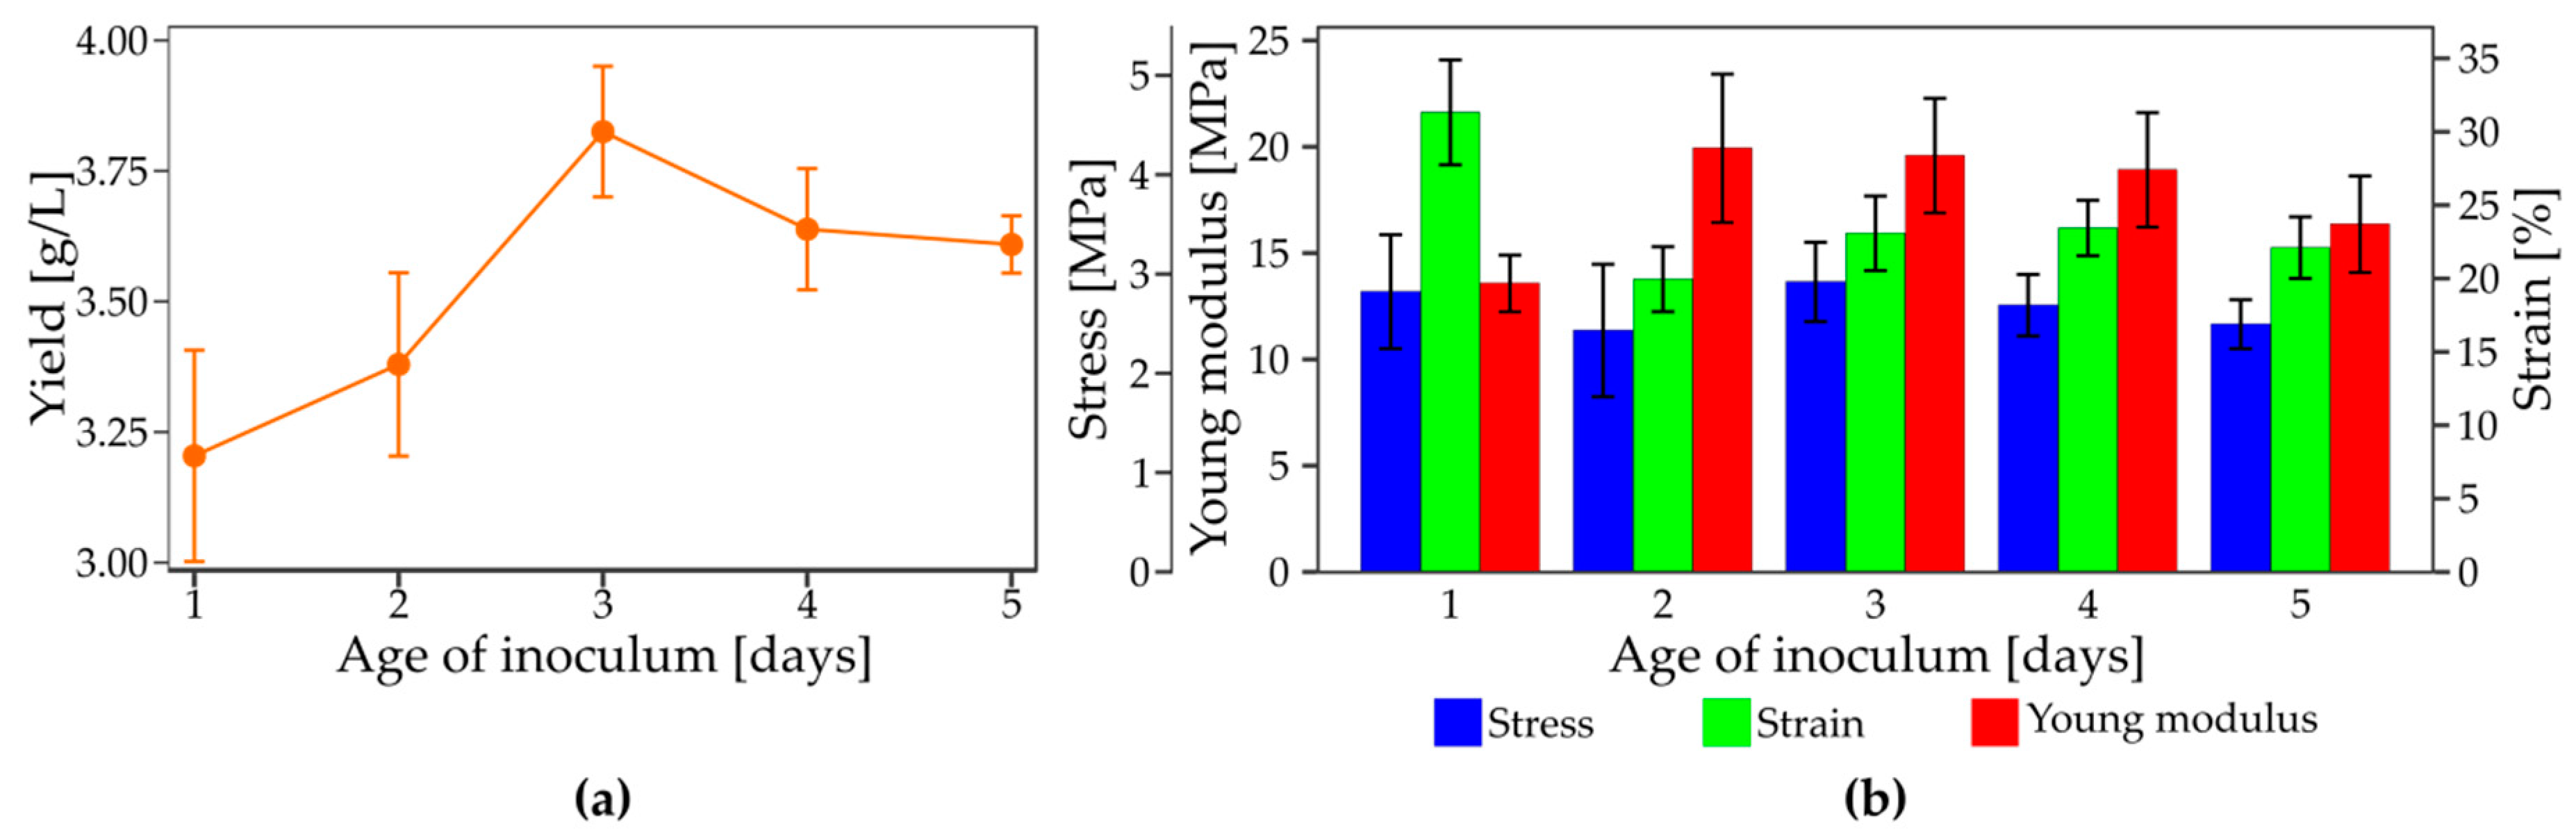
3.3. The Influence of Inoculum Parameters on the Yield and Mechanical Properties of Bacterial Nanocellulose

Inoculum parameters, such as inoculation ratio (%) and age of inoculum, should be considered before each biotechnological process. In our study, we tested the volume of inoculum in the range of 2–10% with a 2% interval (Figure 5) and the age of inoculum from 1 to 5 days (Figure 6).
In case of inoculum volume, there are no differences for 4–10% of inoculum. Only at 2% we observed a decrease in the BNC yield. From PBD study it was concluded that this parameter has a positive impact on the dry weight of cellulose and glucose conversion ratio. The studied inoculation ratio was 1% (low level) and 10% (high level), thus the data are in agreement. Due to the fact that K. xylinus produces BNC only in the aerobic zone at the air–liquid interface, the defined number of cells is required for efficient production of cellulose. Hornung et al. reported that approximately 10% of the total bacterial cells produce BNC during culture [8]. Therefore, the initial inoculum volume 4% is enough for even distribution of active K. xylinus E25 cells in aerobic zone. Other authors also studied the impact of inoculum volume on BNC yield [27,28]. Hutchens et al. applied different inoculation ratios (1:5 and 1:10) and did not observe any significant effect on production yield [27], similar to Zeng et al. who used 3% and 6% of inoculum in their study [28]. On the other hand, Bilgi et al. reported a significant difference between 5% and 15% of inoculum which was also assessed in the PBD study [12]. The authors used K. xylinus ATCC 700178 cultivated in SH medium without the ethanol addition. In these conditions there were likely not enough metabolically active cells at 5% of inoculum to spread cells even in the aerobic zone. Mechanical strength (Figure 5b) was not influenced by inoculum volume and tensile parameters correlate with the yield of BNC.
In case of the age of inoculum, its impact on BNC biosynthesis was significant. The productivity of bacteria cells is related to the length of the adaptation phase and the time required to initiate BNC production [29]. The adaptation phase of bacteria is affected by cell density, age, physiological state [30], and bacterial strain. The growth pattern for K. xylinus E25 was previously reported [31]. In case of cultures supplemented with ethanol, a rapid exponential growth can be observed in the first days of incubation. Afterwards, the growth increases slower until the maximum cell density is achieved. In the third day of incubation, K. xylinus E25 starts to produce metabolites, such as cellulose and gluconic acid. It is a specific period during which cells become metabolically active. On the fourth day of culture begins the stationary phase. Based on our results, the highest BNC yield can be obtained from 3-day inoculum (Figure 6a). Therefore, a late phase of exponential growth, where bacteria cells are active, is the most favorable timing to transfer inoculum into fermentation medium. Regardless of the impact of the age of inoculum on BNC yield, this parameter influenced the mechanical strength of biomaterial only in the case of 1-day inoculum (Figure 6b). Young cells exhibit rapid growth, have a longer lag phase, and start to produce cellulose later. Thus, the tridimensional structure of BNC can be looser causing higher ability to stretch and lower the Young modulus.

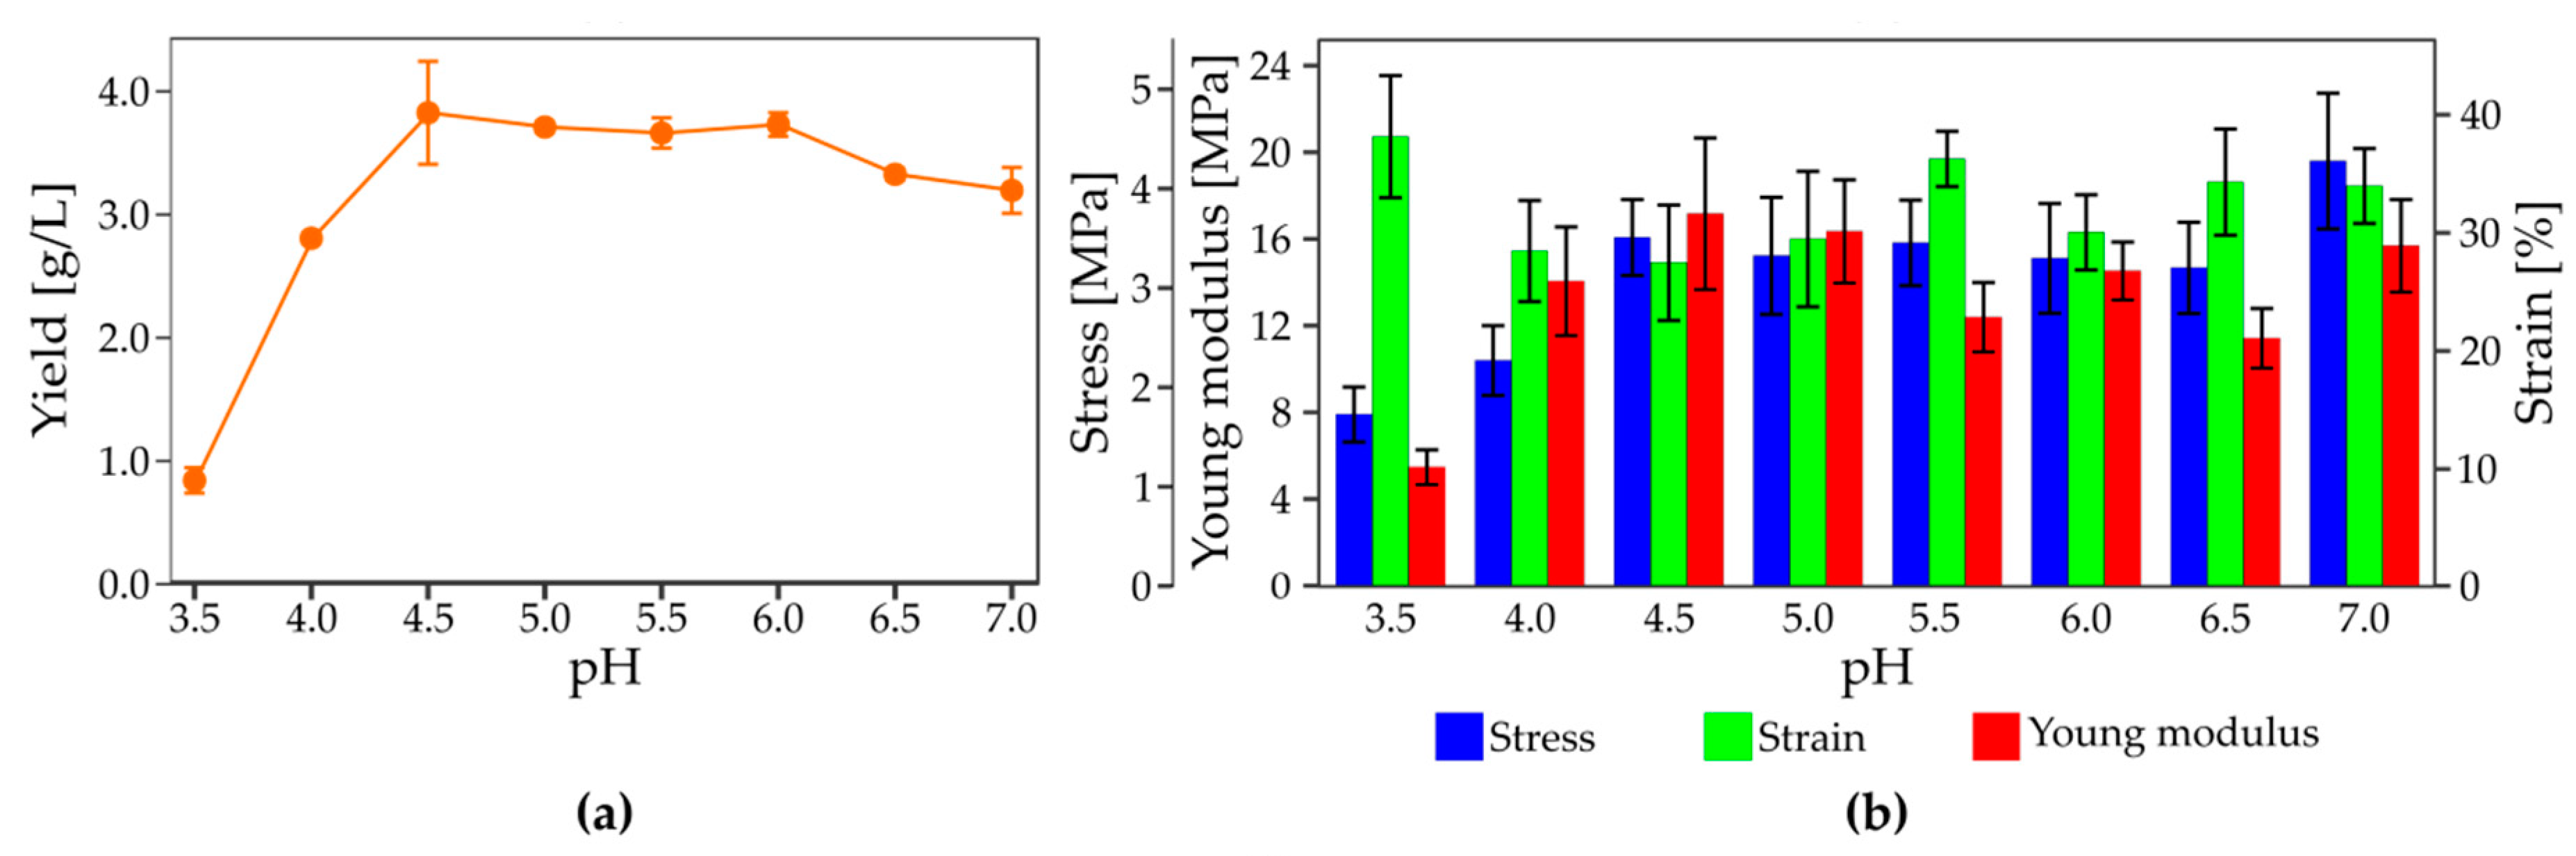
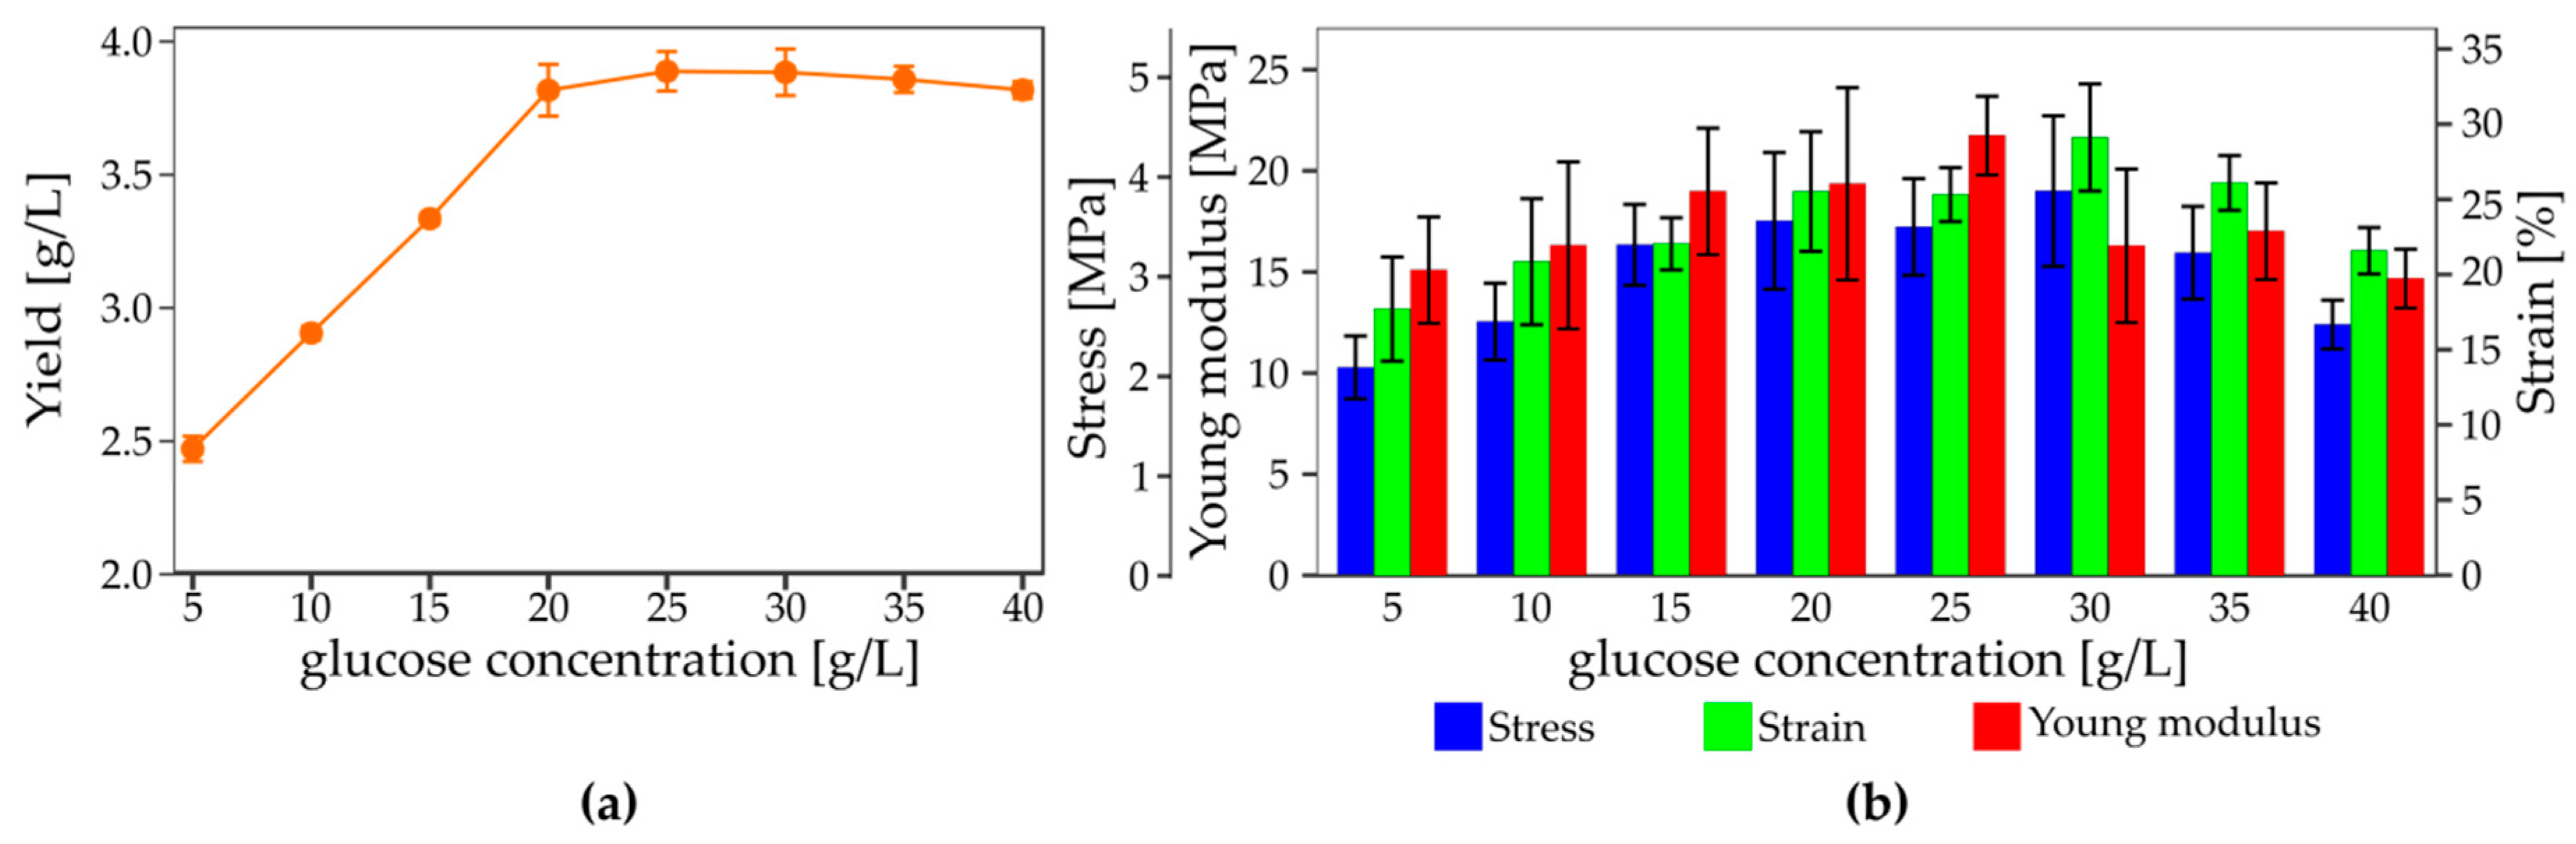
3.4. The Effect of Culture Condition on the Yield and Mechanical Properties of Bacterial Nanocellulose

After the PBD study, the effect of pH on the dry weight of cellulose was insignificant, unlike its impact on the glucose conversion ratio (Figure 2). In the next step, we determined the influence of pH on the BNC yield and mechanical strength in the wide range of values (Figure 7).
From Figure 7a it can be seen that the highest BNC production was obtained over a pH range between 4.5 and 6.0 without a specific maximum. For higher pH values a slight decrease in the yield was noted, while for more acidic medium (pH 3.5) the yield was reduced to 0.68 g/L. Also, at pHs below 3.5 and over 7.5, K. xylinus E25 did not produce cellulose. The value of pH had a similar effect on tensile parameters (Figure 7b). For membranes produced in media with pH 3.5 the stress and Young modulus were decreased about 2 and 3 times, respectively. Strain significant differences were observed, but there was not any specific trend noted. For media with higher pH, the mechanical strength was unaffected. Generally, cellulose-producing bacteria produce good quality BNC in the pH range of 4.0–7.0 [32]. The optimum is dependent on the bacteria strain. K. xylinus ATCC 700178 produces BNC with similar yield in media with pH between 4.5 and 6.2 [12]. Son et al. reported that in case of strain Acetobacter sp. A9, a high level of cellulose production occurred at pH 4.5 and 7.5 with the maximum at 6.5 [33]. The medium with pH 5.5 was optimal for K. hansenii AS.5 and for another pH values the decrease in cellulose production was observed [24]. According to Pourramezan, Roayaei, and Qezelbash, the highest BNC yield in culture of Acetobacter sp. 4B-2 was observed at pH 7.0 [34], while for the K. medellensis strain from Colombian vinegar the optimal pH was 3.5 [35]. Most of the strains are more sensitive to lower pH and below 3.0 cells cease to produce cellulose, thus normally pH of culture media is adjusted to 5.0 or 6.0 [36]. In addition, during the culture in a medium containing glucose, gluconic acid is produced and released into medium as a product of glucose oxidation. That results in pH decrease. Therefore, for low initial pH, the yield is diminished and the mechanical strength is not satisfactory. In our study (data not shown), the final pH for media with a pH range between 4.5 and 7.0 was >3.5. In the case of initial pHs of 4.0 and 3.5, the value of pH dropped to 3.4 and 3.2, respectively, which could inactivate BNC biosynthesis.
Glucose concentration strongly affects both the yield (Figure 8a) and tensile stress of BNC (Figure 8b).
The yield is increased with the increase of glucose concentration from 5 to 20 g/L. For higher concentrations up to 35 g/L there are no significant differences, but the slight decrease in the yield was observed at 40 g/L of glucose. The mechanical properties of membranes correlate with the yield in the range of glucose concentrations between 5 and 30 g/L. The highest stress (about 3.5 MPa) was achieved for BNC synthesized in medium containing 15–30 g/L of the carbon source. For lower and higher glucose concentrations, the stress is diminished to 2.0 and 2.5 MPa in case of 5 and 40 g/L glucose, respectively. BNC membranes are more stretchable for 20–35 g/L of glucose than for other concentrations. In case of the Young modulus (%) the trend has the shape of a bell curve, but due to high standard deviations we cannot clearly correlate these mechanical parameters with the glucose concentration in medium. Although the yield and mechanical properties are influenced by glucose concentration, the relationships between the factor and studied responses are not the same. For low concentrations of glucose, the yield was connected with a lack of carbon source in medium at the end of the culture. After a 6-day culture in medium, there were only 0.69, 1.39 and 2.39 g/L glucose for initial concentrations of 5, 10, and 15 g/L, respectively (data not shown). Therefore, glucose was exhausted and BNC biosynthesis was limited. Because of the lower yield, the mechanical strength was decreased. For 40 g/L the value of pH was 3.0 at the end of the culture, which can be ascribed to higher oxidation of glucose to gluconic acid. In this condition, only a slight decrease in the yield was noted, but tensile properties were significantly affected similar to the culture with an initial pH at 3.5. Other authors reported similar effects of glucose concentration on BNC yield, but do not correlate it with the mechanical strength of membranes. Saleh et al. observed that glucose between 15 and 25 g/L did not affect cellulose production [24]. Rani and Appaiah reported that BNC yield decreased with an increase in the initial glucose concentration between 40 and 200 g/L and connected that effect with the diminished pH value below 3.0 [37]. Negative impact of high glucose content was also observed in shaking conditions [33], but the inhibiting concentration was higher (50 g/L) than in stationary culture.
Figure 9a,b shows both the BNC yield and productivity, with time course of cultivation. As it can be seen at Figure 9a, the yield is increasing during the entire incubation time. On the first day, only 0.47 g/L was achieved, whereas after a 7-day culture the yield was over 4 g/L. On the other hand, the highest productivity was noted on the fifth day of incubation. For longer cultivation times, the productivity decreased.
There are several possibilities why the productivity decreases after 5 days of cultivation. Hornung et al. described the wall effect as a factor limiting BNC production [38]. According to this research, the maximum thickness of membrane in glass cuboid bioreactor is 20 mm, but stagnation in BNC growth should be observed earlier. In our study, we used an s/v ratio of 0.71 cm−1, which was 1.4 cm medium high, so the maximum thickness of the pellicle was less than 1.4 cm and in standard conditions the medium was exhausted after 6–7 days. On the other hand, in cultures with introduced air above the membrane, BNC reaches the bottom in the fourth day. Thus, we cannot discard the possibility of limiting the biosynthesis by the wall effect in favorable conditions. Secondly, the final pH was 3.50 on the fifth day of culture and for longer cultures the pH decreased below 3.5, which also had an impact on the production rate. Also important is the physiological state of cells during the incubation time. As we mentioned, the highest production rate is related to the late exponential stage, but the stationary phase starts from the fourth day of cultivation. Furthermore, bacteria switches its metabolism into acetic acid consumption instead of glucose [31], despite the relatively high concentration of remaining glucose. Reduction of glucose metabolism results in lower UDP-glucose biosynthesis which is a priming metabolite for cellulose polymerization. Time of culture also influences the mechanical properties of the membrane (Figure 9c). Tensile stress was changed until the third day of culture and stayed constant. Inverse relationship was observed for strain. Initially, the pellicle was able to stretch up to 35–40%, but after the third day of incubation, the value of stress was significantly lower. For 5- to 7-day cultures, the strain was twice lower than of 1-day BNC. Young modulus was increasing until 5 days. The low value of the Young modulus for membranes at short cultivation times was a consequence of low stress and high strain of BNC.

4. Conclusions

Bacterial nanocellulose has a wide range of applications in medicine, as wound dressings, scaffolds, and prosthesis, in the food industry, as a packaging component, a low calorie additive and emulsifier, and in electronic devices and many other applications. The bottleneck for the implementation of BNC products on the market is the high cost of BNC production. One approach to solve this problem is the development of a new production strategy which allows enhancement of the yield and productivity of BNC. On the other hand, it is important to maintain the quality of membranes. In our study we proposed a new surface air-flow bioreactor for BNC which enables the increase in the productivity by 65% through the control of culture ventilation. The quality of the BNC can be assessed by mechanical parameters, such as tensile strength and the Young modulus. BNC produced in the SAF bioreactor exhibits improved mechanical strength which can be related to a higher quality of that biomaterial. Additionally, we studied a wide range of different process parameters which can alter the yield or mechanical parameters of bacterial nanocellulose. The greatest influence on both studied responses was proven for such factors as the air-flow ratio, glucose concentration, and culture time. The highest achieved yield was 4.11 g/L and the highest productivity was 0.91 g/L/day. In terms of the mechanical strength, the stress of BNC membranes varied from 0.8 to 6.39 MPa depending on culture condition, while the Young modulus was in the range 1.92–23.52 MPa. This data defines the rational area of input factor variability in static culture of K. xylinus E25 and could serve as a useful basis for further simultaneous optimization of the yield and tensile strength.

Author Contributions

Conceptualization, I.C. and S.B.; formal analysis, I.C.; methodology, I.C.; supervision, S.B.; visualization, I.C. and M.R.; writing—original draft, I.C.; writing—review and editing, I.C., M.R. and S.B. All authors have read and agreed to the published version of the manuscript.

Funding

This research received no external funding.

Acknowledgments

The authors would like to thank Jolanta Płoszyńska and Piotr Harążka for technical support. The authors thank Benoit Panissie for careful reading of this manuscript and English corrections.

Conflicts of Interest

The authors declare no conflict of interest.

Appendix A. Evaluation of the Impact of Process Parameters on BNC Yield Calculated as a Dry Weight per Surface Unit

BNC yield calculated as a dry weight per surface unit (g/m2) allows presentation of the effect of examined factors without obvious relationships between the dry weight and surface area of the bioreactor. The effects of variables were calculated based on the data presented in the Table A1 and visualized in the Figure A1 and Figure A2, as a Pareto chart and the main effect plots, respectively.
Table A1. Results of yield calculated as a dry weight per surface unit.
RunDry Weight per Surface Unit (g/m2)
148.6884 ± 1.3215
263.5197 ± 1.9778
354.9247 ± 1.1248
439.8042 ± 3.9889
566.0580 ± 2.6467
650.9638 ± 0.5906
770.8474 ± 4.2226
845.2614 ± 3.4003
937.3333 ± 1.4692
1058.1203 ± 1.8651
1145.1158 ± 0.6353
1242.9842 ± 0.5702
Table A2. Plackett–Burman design % contribution and p-value of the parameters.
Bioreactor AreaCultivation TimeAge of InoculumSurface to Volume RatioGlucose ConcentrationAir-Flow RatioInoculum VolumepHHumidity of Air
Dry weight of cellulose (g)
Contribution (%)7.1047.360.053.660.0214.9814.110.7711.93
p-value0.0050.0000.7960.0380.8670.0000.0000.3250.001
Figure A1. Pareto chart of the standardized effects of process parameters on dry weight per surface unit.
Applsci 10 03850 g0a1
Figure A2. Main effect plots of the studied parameters for dry weight per surface unit.
Applsci 10 03850 g0a2
From Figure A1 and Figure A2 it can be seen that most of the parameters had a significant effect on dry weight per surface unit, namely bioreactor area, cultivation time, surface to volume ratio, air-flow ratio, inoculum volume, and humidity of air. The highest positive influence on the studied response was the cultivation time (47.36%), followed by the air-flow ratio (14.98%) and inoculum volume (14.11%) (Table A2).
The impact of the bioreactor surface on dry weight per surface unit was highly reduced in comparison to the influence on the dry weight. That factor had a significant positive effect on yield (g/m2), but its contribution was only 7.1%.

References

  1. Jonas, R.; Farah, L.F. Production and application of microbial cellulose. Polym. Degrad. Stab. 1998, 59, 101–106. [Google Scholar] [CrossRef]
  2. Portela, R.; Leal, C.R.; Almeida, P.L.; Sobral, R.G. Bacterial cellulose: A versatile biopolymer for wound dressing applications. Microb. Biotechnol. 2019, 12, 586–610. [Google Scholar] [CrossRef] [PubMed]
  3. Fontana, J.D.; De Souza, A.M.; Fontana, C.K.; Torriani, I.L.; Moreschi, J.C.; Gallotti, B.J.; De Souza, S.J.; Narcisco, G.P.; Bichara, J.A.; Farah, L.F.X. Acetobacter cellulose pellicle as a temporary skin substitute. Appl. Biochem. Biotechnol. 1990, 24, 253–264. [Google Scholar] [CrossRef] [PubMed]
  4. Scherner, M.; Reutter, S.; Klemm, D.; Sterner-Kock, A.; Guschlbauer, M.; Richter, T.; Langebartels, G.; Madershahian, N.; Wahlers, T.; Wippermann, J. In vivo application of tissue-engineered blood vessels of bacterial cellulose as small arterial substitutes: Proof of concept? J. Surg. Res. 2014, 189, 340–347. [Google Scholar] [CrossRef]
  5. Cielecka, I.; Szustak, M.; Gendaszewska-Darmach, E.; Kalinowska, H.; Ryngajllo, M.; Maniukiewicz, W.; Bielecki, S. Novel bionanocellulose/κ-carrageenan composites for tissue engineering. Appl. Sci. 2018, 8, 1352. [Google Scholar] [CrossRef] [Green Version]
  6. Singhsa, P.; Narain, R.; Manuspiya, H. Physical structure variations of bacterial cellulose produced by different Komagataeibacter xylinus strains and carbon sources in static and agitated conditions. Cellulose 2018, 25, 1571–1581. [Google Scholar] [CrossRef]
  7. Borzani, W.; de Souza, S.J. Mechanism of the film thickness increasing during the bacterial production of cellulose on non-agitaded liquid media. Biotechnol. Lett. 1995, 17, 1271–1272. [Google Scholar] [CrossRef]
  8. Hornung, M.; Ludwig, M.; Gerrard, A.M.; Schmauder, H.P. Optimizing the production of bacterial cellulose in surface culture: Evaluation of substrate mass transfer influences on the bioreaction (Part 1). Eng. Life Sci. 2006, 6, 537–545. [Google Scholar] [CrossRef]
  9. Park, J.K.; Khan, T.; Jung, J.Y. Bacterial Cellulose. In Handbook of hydrocolloids; Phillips, G.O., Williams, P.A., Eds.; Woodhead Publishing Limited: Abington, PA, USA, 2009; pp. 724–739. ISBN 978-1-84569-414-2. [Google Scholar]
  10. Klemm, D.; Heublein, B.; Fink, H.P.; Bohn, A. Cellulose: Fascinating biopolymer and sustainable raw material. Angew. Chem. Int. Ed. 2005, 44, 3358–3393. [Google Scholar] [CrossRef]
  11. Bhadri, G.; Hedge, S.; Narsapur, K.; Koppal, S.; Oswa, P.; Turmuri, N.; Jumnal, V.; Hungund, B. Statistical Optimization of Medium Components by Response Surface Methodology for Enhanced Production of Bacterial Cellulose by Gluconacetobacter persimmonis. J. Bioprocess. Biotech. 2013, 4, 142. [Google Scholar]
  12. Bilgi, E.; Bayir, E.; Sendemir-Urkmez, A.; Hames, E.E. Optimization of bacterial cellulose production by Gluconacetobacter xylinus using carob and haricot bean. Int. J. Biol. Macromol. 2016, 90, 2–10. [Google Scholar] [CrossRef] [PubMed]
  13. Basu, A.; Vadanan, S.V.; Lim, S. Rational design of a scalable bioprocess platform for bacterial cellulose production. Carbohydr. Polym. 2019, 207, 684–693. [Google Scholar] [CrossRef] [PubMed]
  14. Rodrigues, A.C.; Fontão, A.I.; Coelho, A.; Leal, M.; Soares da Silva, F.A.G.; Wan, Y.; Dourado, F.; Gama, M. Response surface statistical optimization of bacterial nanocellulose fermentation in static culture using a low-cost medium. New Biotechnol. 2019, 49, 19–27. [Google Scholar] [CrossRef] [PubMed] [Green Version]
  15. Dobre, T.; Stoica, A.; Parvulescu, O.C.; Stroescu, M.; Iavorschi, G. Factors influence on bacterial cellulose growth in static reactors. Rev. Chim. 2008, 59, 591–594. [Google Scholar] [CrossRef]
  16. Cielecka, I.; Szustak, M.; Kalinowska, H.; Gendaszewska-Darmach, E.; Ryngajłło, M.; Maniukiewicz, W.; Bielecki, S. Glycerol-plasticized bacterial nanocellulose-based composites with enhanced flexibility and liquid sorption capacity. Cellulose 2019, 26, 5409–5426. [Google Scholar] [CrossRef] [Green Version]
  17. Cheng, K.C.; Catchmark, J.M.; Demirci, A. Effect of different additives on bacterial cellulose production by Acetobacter xylinum and analysis of material property. Cellulose 2009, 16, 1033–1045. [Google Scholar] [CrossRef]
  18. Ruka, D.R.; Simon, G.P.; Dean, K.M. In situ modifications to bacterial cellulose with the water insoluble polymer poly-3-hydroxybutyrate. Carbohydr. Polym. 2013, 92, 1717–1723. [Google Scholar] [CrossRef]
  19. Gea, S.; Bilotti, E.; Reynolds, C.T.; Soykeabkeaw, N.; Peijs, T. Bacterial cellulose-poly(vinyl alcohol) nanocomposites prepared by an in-situ process. Mater. Lett. 2010, 64, 901–904. [Google Scholar] [CrossRef]
  20. Fernandes, M.; Gama, M.; Dourado, F.; Souto, A.P. Development of novel bacterial cellulose composites for the textile and shoe industry. Microb. Biotechnol. 2019, 12, 650–661. [Google Scholar] [CrossRef] [Green Version]
  21. Numata, Y.; Kono, H.; Tsuji, M.; Tajima, K. Structural and mechanical characterization of bacterial cellulose–polyethylene glycol diacrylate composite gels. Carbohydr. Polym. 2017, 173, 67–76. [Google Scholar] [CrossRef]
  22. Ebrahimi, E.; Babaeipour, V.; Meftahi, A.; Alibakhshi, S. Effects of bio-production process parameters on bacterial cellulose mechanical properties. J. Chem. Eng. Jpn. 2017, 50, 857–861. [Google Scholar] [CrossRef]
  23. Mohite, B.V.; Kamalja, K.K.; Patil, S.V. Statistical optimization of culture conditions for enhanced bacterial cellulose production by Gluconoacetobacter hansenii NCIM 2529. Cellulose 2012, 19, 1655–1666. [Google Scholar] [CrossRef]
  24. Saleh, A.K.; Soliman, N.A.; Farrag, A.A.; Ibrahim, M.M.; El-Shinnawy, N.A.; Abdel-Fattah, Y.R. Statistical optimization and characterization of a biocellulose produced by local Egyptian isolate Komagataeibacter hansenii AS.5. Int. J. Biol. Macromol. 2020, 144, 198–207. [Google Scholar] [CrossRef] [PubMed]
  25. Ruka, D.R.; Simon, G.P.; Dean, K.M. Altering the growth conditions of Gluconacetobacter xylinus to maximize the yield of bacterial cellulose. Carbohydr. Polym. 2012, 89, 613–622. [Google Scholar] [CrossRef] [PubMed]
  26. Krystynowicz, A.; Czaja, W.; Wiktorowska-Jezierska, A.; Gonçalves-Miśkiewicz, M.; Turkiewicz, M.; Bielecki, S. Factors affecting the yield and properties of bacterial cellulose. J. Ind. Microbiol. Biotechnol. 2002, 29, 189–195. [Google Scholar] [CrossRef]
  27. Hutchens, S.A.; León, R.V.; O’Neill, H.M.; Evans, B.R. Statistical analysis of optimal culture conditions for Gluconacetobacter hansenii cellulose production. Lett. Appl. Microbiol. 2007, 44, 175–180. [Google Scholar] [CrossRef]
  28. Zeng, X.; Small, D.P.; Wan, W. Statistical optimization of culture conditions for bacterial cellulose production by Acetobacter xylinum BPR 2001 from maple syrup. Carbohydr. Polym. 2011, 85, 506–513. [Google Scholar] [CrossRef]
  29. Yassine, F.; Bassil, N.; Chokr, A.; El Samrani, A.; Serghei, A.; Boiteux, G.; El Tahchi, M. Two-step formation mechanism of Acetobacter cellulosic biofilm: Synthesis of sparse and compact cellulose. Cellulose 2016, 23, 1087–1100. [Google Scholar] [CrossRef]
  30. Rolfe, M.D.; Rice, C.J.; Lucchini, S.; Pin, C.; Thompson, A.; Cameron, A.D.S.; Alston, M.; Stringer, M.F.; Betts, R.P.; Baranyi, J.; et al. Lag phase is a distinct growth phase that prepares bacteria for exponential growth and involves transient metal accumulation. J. Bacteriol. 2012, 194, 686–701. [Google Scholar] [CrossRef] [Green Version]
  31. Ryngajłło, M.; Jacek, P.; Cielecka, I.; Kalinowska, H.; Bielecki, S. Effect of ethanol supplementation on the transcriptional landscape of bionanocellulose producer Komagataeibacter xylinus E25. Appl. Microbiol. Biotechnol. 2019, 103, 6673–6688. [Google Scholar] [CrossRef] [Green Version]
  32. Galas, E.; Krystynowicz, A.; Tarabasz-Szymanska, L.; Pankiewicz, T.; Rzyska, M. Optimization of the production of bacterial cellulose using multivariable linear regression analysis. Acta Biotechnol. 1999, 19, 251–260. [Google Scholar] [CrossRef]
  33. Son, H.-J.; Heo, M.-S.; Kim, Y.-G.; Lee, S.-J. Optimization of fermentation conditions for the production of bacterial cellulose by a newly isolated Acetobacter sp.A9 in shaking cultures. Biotechnol. Appl. Biochem. 2001, 33, 1–5. [Google Scholar] [CrossRef] [PubMed]
  34. Pourramezan, G.Z.; Roayaei, A.M.; Qezelbash, Q.R. Optimization of culture conditions for bacterial cellulose production by Acetobacter sp. 4B-2. Biotechnology 2009, 8, 150–154. [Google Scholar] [CrossRef]
  35. Castro, C.; Zuluaga, R.; Álvarez, C.; Putaux, J.L.; Caro, G.; Rojas, O.J.; Mondragon, I.; Gañán, P. Bacterial cellulose produced by a new acid-resistant strain of Gluconacetobacter genus. Carbohydr. Polym. 2012, 89, 1033–1037. [Google Scholar] [CrossRef]
  36. Çoban, E.P.; Biyik, H. Evaluation of different pH and temperatures for bacterial cellulose production in HS (Hestrin-Scharmm) medium and beet molasses medium. Afr. J. Microbiol. Res. 2011, 5, 1037–1045. [Google Scholar]
  37. Rani, M.U.; Appaiah, A. Optimization of culture conditions for bacterial cellulose production from Gluconacetobacter hansenii UAC09. Ann. Microbiol. 2011, 61, 781–787. [Google Scholar] [CrossRef]
  38. Hornung, M.; Ludwig, M.; Gerrard, A.M.; Schmauder, H.P. Optimizing the production of bacterial cellulose in surface culture: Evaluation of product movement influences on the bioreaction (Part 2). Eng. Life Sci. 2006, 6, 546–551. [Google Scholar] [CrossRef]
Figure 1. The surface air-flow (SAF) bioreactor. The experimental setup contains 3 glass trays with an area of 2070 or 190 cm2, depending on the culture variant. Air is fed by a compressor and passed through the automatic rotameter, which allows measurement and regulation of the air flow ratio. Between rotameter and bioreactors, two safety valves cutting off the air supply are located. Air is purified on sterile filters (PTFE, 0.22 µm) and is introduced into the bioreactors by two spigots placed in the side walls. Air leaves the bioreactors by two outlets placed in the top cover.
Applsci 10 03850 g001
Figure 2. Pareto charts of the standardized effects of process parameters on (a) dry weight of cellulose and (b) glucose conversion into cellulose. The X symbols correspond to factors, where X1 is bioreactor area, X2-cultivation time, X3-age of inoculum, X4-s/v ratio, X5-glucose concentration, X7-air-flow ratio, X9-volume of inoculum, X10-pH, and X11-humidity of air. The red line is a reference line at 2.056.
Applsci 10 03850 g002
Figure 3. Main effect plots of studied parameters for dry weight of cellulose (blue lines) and glucose conversion into cellulose (green lines).
Applsci 10 03850 g003
Figure 4. Impact of air-flow ratio on (a) biosynthesis yield and (b) tensile parameters of bacterial nanocellulose after 6-day culture.
Applsci 10 03850 g004
Figure 5. Impact of inoculum volume on (a) biosynthesis yield and (b) tensile parameters of bacterial nanocellulose.
Applsci 10 03850 g005
Figure 6. Impact of age of inoculum on (a) biosynthesis yield and (b) tensile parameters of bacterial nanocellulose.
Applsci 10 03850 g006
Figure 7. Impact of pH on (a) biosynthesis yield and (b) tensile parameters of bacterial nanocellulose.
Applsci 10 03850 g007
Figure 8. Impact of glucose concentration on (a) biosynthesis yield and (b) tensile parameters of bacterial nanocellulose.
Applsci 10 03850 g008
Figure 9. Impact of culture time on (a) biosynthesis yield, (b) productivity, and (c) tensile parameters of bacterial nanocellulose.
Applsci 10 03850 g009
Table 1. Factors assigned at two levels in the Plackett–Burman design.
Factor SymbolFactorLow Level (−1)High Level (+1)
X1Bioreactor area (cm2)1902070
X2Cultivation time (days)46
X3Age of inoculum (days)15
X4Surface to volume ratio (cm−1)0.710.33
X5Glucose concentration (g/L)1040
X6Dummy factor 1−1+1
X7Air flow ratio (L/min·m2)0.9418.80
X8Dummy factor 2−1+1
X9Inoculum volume (%)110
X10pH4.06.5
X11Humidity of airdrywet
Table 2. Plackett–Burman design matrix and results. Symbols X correspond to factors, where X1 is bioreactor area, X2-cultivation time, X3-age of inoculum, X4-s/v ratio, X5-glucose concentration, X7-air-flow ratio, X9-inoculum volume, X10-pH, and X11-humidity of air.
RunX1X2X3X4X5X6X7X8X9X10X11Dry Weight [g]Glucose Conversion
(gBNC/gglucose)
1+1−1+1−1−1−1+1+1+1−1+110.0785 ± 0.27360.3999 ± 0.0118
2+1+1−1+1−1−1−1+1+1+1−113.1486 ± 0.40940.5223 ± 0.0085
3−1+1+1−1+1−1−1−1+1+1+11.0436 ± 0.02140.1306 ± 0.0036
4+1−1+1+1−1+1−1−1−1+1+18.2395 ± 0.82570.2797 ± 0.0074
5+1+1−1+1+1−1+1−1−1−1+113.6740 ± 0.54790.1073 ± 0.0055
6+1+1+1−1+1+1−1+1−1−1−110.5495 ± 0.12230.1084 ± 0.0006
7−1+1+1+1−1+1+1−1+1−1−11.3461 ± 0.08020.3971 ± 0.0145
8−1−1+1+1+1−1+1+1−1+1−10.8600 ± 0.06460.1058 ± 0.0123
9−1−1−1+1+1+1−1+1+1−1+10.7093 ± 0.02790.0606 ± 0.0017
10+1−1−1−1+1+1+1−1+1+1−112.0309 ± 0.38610.1638 ± 0.0083
11−1+1−1−1−1+1+1+1−1+1+10.8572 ± 0.01210.4114 ± 0.0047
12−1−1−1−1−1−1−1−1−1−1−10.8167 ± 0.01080.3271 ± 0.0234
Table 3. Plackett–Burman design % contribution and p-value of the parameters.
Bioreactor AreaCultivation TimeAge of InoculumSurface to Volume RatioGlucose ConcentrationAir-Flow RatioInoculum VolumepHHumidity of Air
Dry weight of cellulose (g)
Contribution (%)94.611.532.040.170.470.460.280.020.42
p-value0.0000.0000.0000.0630.0030.0030.0190.4650.005
Glucose conversion ratio (gglucose/gBNC)
Contribution (%)0.703.660.920.1587.090.773.531.442.56
p-value0.0130.0000.0050.2320.0000.0090.0000.0010.000

