Technical Note

Effect of Missing Vines on Total Leaf Area Determined by NDVI Calculated from Sentinel Satellite Data: Progressive Vine Removal Experiments

by
Sergio Vélez
1,*,
Enrique Barajas
1,
José Antonio Rubio
1,
Rubén Vacas
1 and
Carlos Poblete-Echeverría
2,*
1
Instituto Tecnológico Agrario de Castilla y León (ITACyL), Unidad de Cultivos Leñosos y Hortícolas, 47071 Valladolid, Spain
2
Department of Viticulture and Oenology, Faculty of AgriSciences, Stellenbosch University, Private Bag X1, Matieland 7602, South Africa
*
Authors to whom correspondence should be addressed.
Appl. Sci. 2020, 10(10), 3612; https://doi.org/10.3390/app10103612
Submission received: 24 April 2020 / Revised: 17 May 2020 / Accepted: 19 May 2020 / Published: 23 May 2020
(This article belongs to the Special Issue Applications of Remote Image Capture System in Agriculture)

Abstract

:

Featured Application

Sentinel-2 images were sensitive to change in the vegetation contained in the pixel. The reduction in the NDVI values was proportional to the reduction in the vegetation, following a linear relationship. The quantitative relationship obtained in this study is valuable since a vineyard, once established, generally loses grapevines each year due to diseases, abiotic stress, etc., so it is important to consider the effect of the missing vines in order to have a correct estimation of the vineyard vigour.

Abstract

Remote Sensing (RS) allows the estimation of some important vineyard parameters. There are several platforms for obtaining RS information. In this context, Sentinel satellites are a valuable tool for RS since they provide free and regular images of the earth’s surface. However, several problems regarding the low-resolution of the imagery arise when using this technology, such as handling mixed pixels that include vegetation, soil and shadows. Under this condition, the Normalized Difference Vegetation Index (NDVI) value in a particular pixel is an indicator of the amount of vegetation (canopy area) rather than the NDVI from the canopy (as a vigour expression), but its reliability varies depending on several factors, such as the presence of mixed pixels or the effect of missing vines (a vineyard, once established, generally loses grapevines each year due to diseases, abiotic stress, etc.). In this study, a vine removal simulation (greenhouse experiment) and an actual vine removal (field experiment) were carried out. In the field experiment, the position of the Sentinel-2 pixels was marked using high-precision GPS. Controlled removal of vines from a block of cv. Cabernet Sauvignon was done in four steps. The removal of the vines was done during the summer of 2019, matching with the start of the maximum vegetative growth. The Total Leaf Area (TLA) of each pixel was calculated using destructive field measurements. The operations were planned to have two satellite images available between each removal step. As a result, a strong linear relationship (R2 = 0.986 and R2 = 0.72) was obtained between the TLA and NDVI reductions, which quantitatively indicates the effect of the missing vines on the NDVI values.

1. Introduction

Remote sensing (RS) is a tool that allows information on distant objects to be obtained quickly and accurately [1]. A practical way to use remote sensing in viticulture is by using vegetation indices (VIs) and its potential relies on their ability to estimate grape quality and yield using spectral information [2]. The VIs are algebraic combinations designed to highlight the contrast of plant vigour and its properties (e.g., canopy biomass, absorbed radiation, chlorophyll content). These indices are based on the fact that healthy plants show a high Near-InfraRed (NIR) reflectance and very low red reflectance [3,4]. The Normalized Difference Vegetation Index (NDVI) [5] has proved to be a useful indicator of the status of the vineyard with several applications, such as for sub-block management [6,7,8,9,10,11,12] and estimating the leaf area index, (LAI and can correlate with certain parameters such as total anthocyanins, total phenols, soil moisture, clay and sand content, berry pH, soluble solids, vine size and yield components [13,14,15]. NDVI has also been useful for establishing a correlation between Photosynthetically Active Biomass (PAB) and total phenolics and colour [16], assessing the water status spatial variability within the vineyard [17] and monitoring quality characteristics in table grapes [18]. Furthermore, within-field NDVI patterns are quite stable between seasons [19].
In RS, a key parameter to choose is the platform on which the sensor is mounted. At present, unmanned aerial vehicle (UAV) platforms have been extensively used for studying and exploring vineyards [20,21,22,23,24,25]. In general, UAV offers the possibility to obtain high-resolution multispectral imagery, however, the benefit of the high resolution is restricted by some UAV limitations, such as stability on windy days/areas, as well as piloting capabilities and global navigation satellite system/inertial navigation system (GNNS/INA) quality [26,27]. Also, regulations established in most countries might be a problem for properly developing the capabilities of UAVs [28]. Another issue is the cost of each operation, and above a certain scale size, an image taken by satellite may be more convenient than others [29]. In this context, satellites can be used for several applications, for example, mapping vineyard plant and soil water status [30], harvest prediction [31] and to analyse the spatial heterogeneity in the evapotranspiration [32]. Modern image satellite analysis allows the combining of information from different sensors mounted on different satellites in order to improve spatial resolution [33,34], even in the presence of clouds [35], although it should be noted that not all sensors provide the same information. There are several satellites which are used to obtain spatial information and they can be divided into two main groups depending on the cost of the images: free-to-use satellites and paid satellites. Regarding free-to-use satellites, Landsat and Sentinel satellites can be very useful and they have been used for applications as disparate as detecting motions before a landslide [36], ice flow measurements and the quantification of seasonal ice velocities [37], to assess the bloom dynamics of almond orchards [38] and to classify vineyards according to their vigour [39,40]. Some authors [41] have discussed the differences in the information collected from the Sentinel-2A MSI sensor and the Landsat-8 OLI sensor. They found that the MSI surface reflectance was greater than the OLI surface reflectance in almost all bands and that the MSI surface NDVI was greater than the OLI surface NDVI. In this sense, Sentinel-2 satellites (Copernicus Project of the European Space Agency) can be particularly useful due to their free status and the relative ease of access to their web platform (https://scihub.copernicus.eu/). In addition, Sentinel-2 imagery has a spatial resolution of 10 m on the pixel side and a temporal resolution of 10 days; 5 days if we combine the images from the two existing satellites currently in the constellation. Sentinel-2 provides multiple bands from which to obtain information, including the Near-InfraRed (NIR) and the Red, which allow the calculation of the NDVI [42].
Remotely sensed images can be classified into two groups [43] according to their spatial resolution: (i) low-spatial-resolution imagery, in which the majority of pixels contain reflectance information from the grapevines and the inter-row space, and (ii) high-spatial-resolution imagery, in which the majority of pixels contain information only from grapevines or only from inter-row space. Therefore, when using low-resolution imagery, the NDVI value of the pixel is an indicator of the amount of vegetation (canopy area) rather than the NDVI from the canopy of the vines (pure value without the influence of the background). In this context, the main limitation of Sentinel-2 is that the spatial resolution and within-block information could not be accurate in the case of small blocks or blocks with complex borders [44]. This is a widespread problem in satellite imagery because within a vineyard pixel there are plants, soil and shadows, which influence the correct calculation of the coefficients of the crop [45]. More precisely, the NDVI obtained by the satellite and the LAI measured with a photographic ground-truth method can be related [46] and the images from the Worldview-2 satellite, with a resolution of 0.5 to 2 m2, can be used to indicate that the amount of vegetation contained in a pixel varies according to its size. Therefore, with 0.5 m2 it will be possible to find pixels with 100% vegetation, however, with 2m2 there will only be mixed pixels of vegetation and soil. Instead of Worldview-2, Sentinel-2 can be used, but this will lead to a much greater problem, since, instead of a 2m2 resolution, Sentinel-2 will have a resolution of 100m2, so all the pixels will be mixed and will contain several plants as well as soil and shadows. It is important to note that soils have a great influence on the calculation of the NDVI [47] and that the average NDVI values for vines can be up to 3 times larger than the average NDVI values for pure soil [48]. Some authors [49] have established that pixels with an NDVI lower than 0.6 should be removed because they are not vegetation. Shadows are mainly influenced by the distance between plants and rows, but also by the characteristics of the plants [50]. Thus, in the same lighting, more vegetation will imply more shadow, an important factor since shaded pixels have low reflectance and modify the values we would expect if there were only vegetation and soil. Several authors have tried to solve this problem, trying to correct the shading in UAV and satellite images [51,52,53,54,55]. Additionally, NDVI can be greatly influenced by viticulture practices (e.g., canopy management and irrigation), so these practices should be considered [56].
Considering the inherent mixed-pixel characteristic of Sentinel-2 imagery in vineyards and the effect of missing vines (a vineyard, once established, generally loses grapevines each year due to diseases, abiotic stress, etc.), the objective of the present study was to analyse the effect of missing vines on mixed pixels using the NDVI as a reference index (NDVI = (NIR − Red)/(NIR + Red)). Our approach was to work with real measurements of vegetation reductions at pixel level evaluated by Sentinel-2 satellites, in order to understand the relationship between the vegetation contained in a pixel and the information captured by the satellite. To this end, two related experiments were performed: (i) a simulation under control conditions (greenhouse experiment) and (ii) a field experiment implementing a progressive vine removal protocol in four steps to check the sensitivity of the satellite images to the loss of vegetative mass within the study area.

2. Materials and Methods

2.1. Greenhouse Experiment

To test the concept of the NDVI reduction, a vine removal simulation was done under control conditions in a greenhouse using pot-grown cv. Cabernet Sauvignon grapevines (Department of Viticulture and Oenology, Stellenbosch University, South Africa). In order to carry out the progressive removal simulation, 12 one-year-old vines were selected and maintained in a greenhouse under natural light at 26 °C and 65% humidity.
The vines were located in two rows to simulate a Vertical Shoot Positioned (VSP) trellis system with a distance between rows of 55 cm and a distance between vines of 27.5 cm. Three random vines were removed each time until all vines in the simulated pixel area were removed.
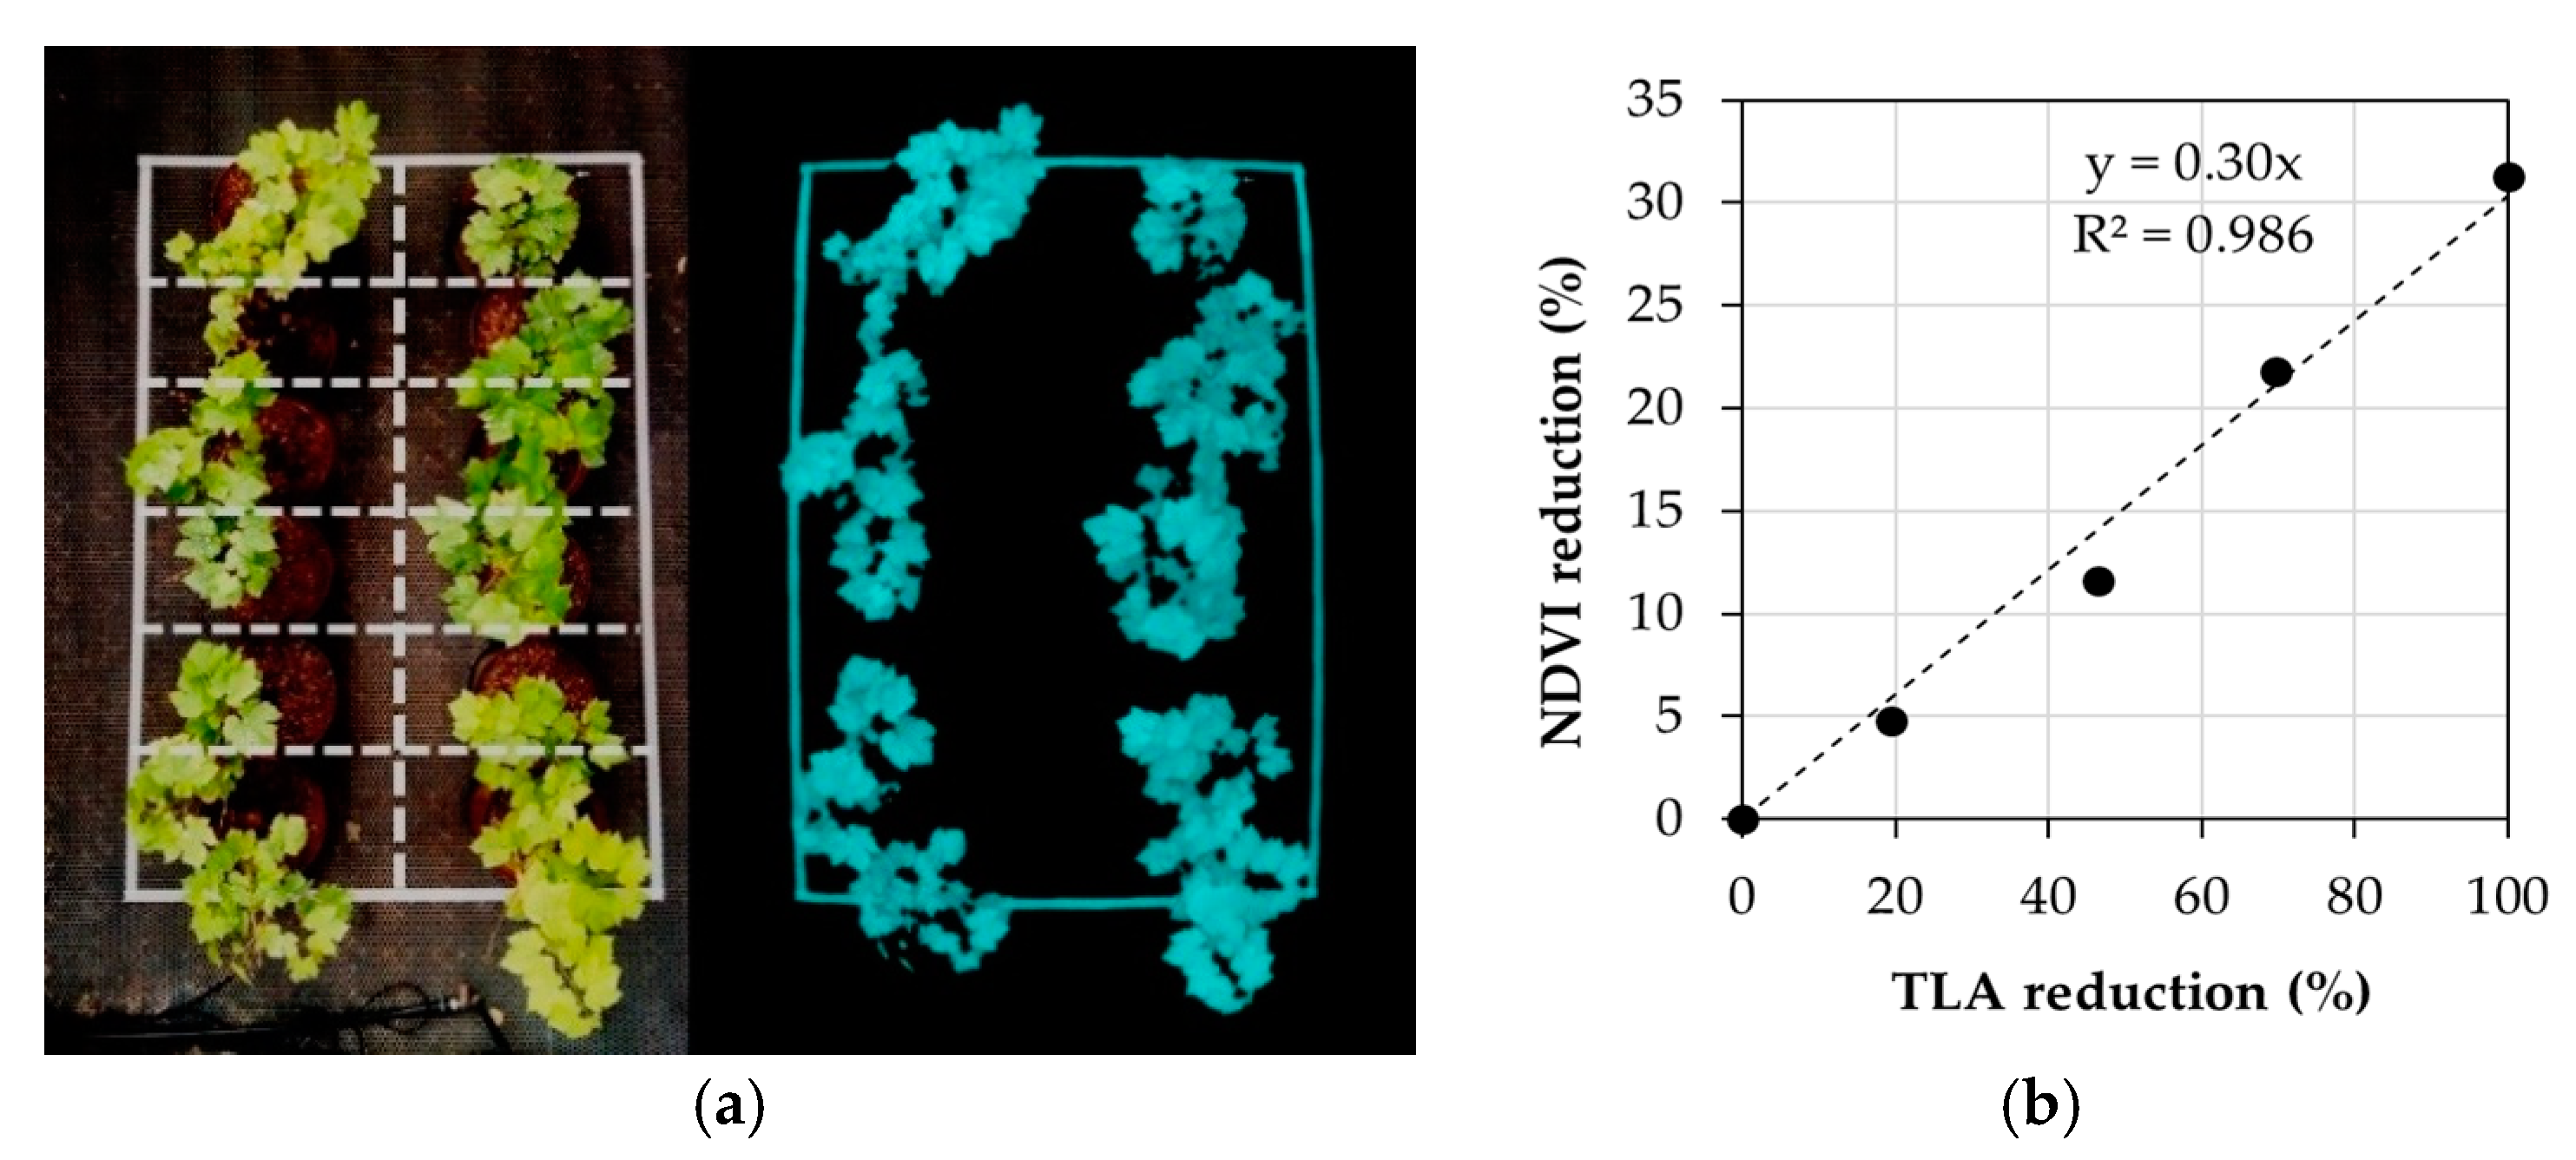
A multispectral camera (Sequoia, Parrot SA, Paris, France) was used to capture images in each step of the removal simulation. The Sequoia camera has four 1.2-megapixel monochrome sensors which collect global shutter imagery along four discrete spectral bands: Green (550 nm), Red (660 nm), Red-Edge (735 nm) and Near-Infrared (NIR) (790 nm); a standard RGB camera and a sunshine sensor that continuously captures the light conditions in the same spectral bands as the multispectral sensor. The pipeline of the image analysis is shown in Figure 1. Since the satellite images are mixed pixels, a single pixel was simulated to encompass both the soil and plants.

2.2. Field Experiment

Subsequently, a large-scale field experiment was carried out on a vineyard (cv. Cabernet Sauvignon), located in Zamadueñas Estate (coordinates: 41.7013° N, 4.7088° W, Valladolid, Spain), belonging to the Agricultural Technology Institute of Castilla y León (ITACyL). The vineyard was trellis-trained, with a bilateral Royat cordon pruning system, with eight spurs per plant and two buds per thumb, with 2.2 × 1.2 m row and plant-spacing, respectively, and NE-SO orientation. The soil was kept free of weeds and any other element that could affect the NDVI [56]. The vineyard was not irrigated, although in previous years it had been irrigated. The accumulated rainfall from 1 January to 31 July 2019 was 133.12 mm.
During the months of June and July 2019, a progressive vine removal experiment was developed in four phases (Figure 2). Three Sentinel-2 pixels (10 × 10 m) were selected within the vineyard, with 38 grapevines inside each pixel. In each phase, a quarter of the vegetative mass of each pixel was eliminated and the last to be removed equated to the elimination of the remnant vegetation. Each grapevine was cut in the lower-middle part of the trunk (Figure 3a,b) and all the material was extracted from the vineyard. A GPS Triumph-2 JAVAD GNSS model with centimetre accuracy was used to mark the pixels in the field to ensure that the grapevines within the studied area (Figure 3c) were removed. The GPS TRIUMPH-2 (JAVAD GNSS INC, San Jose, CA, USA) has 216 channels of dual-frequency GPS and GLONASS and can connect via Bluetooth and WiFi to a mobile phone to access the local GNSS Reference Station Network. A work schedule was established in order to obtain two Sentinel-2 images between each removal, one for each satellite.
The dates of the removal of the vines were 28 June, 8 July, 19 July and 29 July 2019. The experiment was carried out at this specific time due to the proximity of veraison, since at this phenological stage the relationship between leaf area and NDVI is greater [41]. To calculate the Total Leaf Area (TLA), the area of each leaf of the removed plants was measured in the laboratory (Figure 3d) using Easy Leaf Area application [57]. Easy Leaf Area measures leaf area non-destructively, calculated automatically from green leaf and red scale areas. This procedure was performed each time the vines were removed.
Regarding the spatial information, free-cloud atmospherically corrected images were downloaded (between 11 June 2019 and 20 August 2019) from the European Space Agency (ESA) Copernicus Project website. NDVI was calculated for each step using a customized code in R v.3.6.2. (Figure 1b) from the Sentinel-2 satellite images corresponding to the T30TUM tile. Sentinel 2A and 2B were used in combination to minimize variations in sensors, satellite orbit, pixel misregistration, clouds and radiometry. Images corresponding to the two satellites were downloaded and the values of the available free-cloud images were averaged between each vine removal.
All image and data analyses were carried out using customized codes written in an R statistical program (version 3.6X, R Foundation for Statistical Computing (R Core Team 2019), https://www.R-project.org/, Vienna, Austria) and MATLAB (Version R2019b, The MathWorks Inc., http://www.mathworks.com, Natick, MA, USA). A t-test for independent samples was performed in R for the statistical comparison of each removal step.

3. Results

3.1. Greenhouse Experiment

The greenhouse simulation (Figure 4) showed a clear relationship (R2 = 0.986) between the reduction of NDVI and TLA. The NDVI values are the simulated mixed pixel values. When the vines were removed from the simulated mixed pixel (around 2 m2), the NDVI values decreased linearly until reaching the base soil values (defined in this case as NDVI = 0.20). The slope of the linear equation is 0.3 (y = 0.3x), so for each 20% of reduction in the TLA, the reduction in NDVI is around 6%.

3.2. Field Experiment

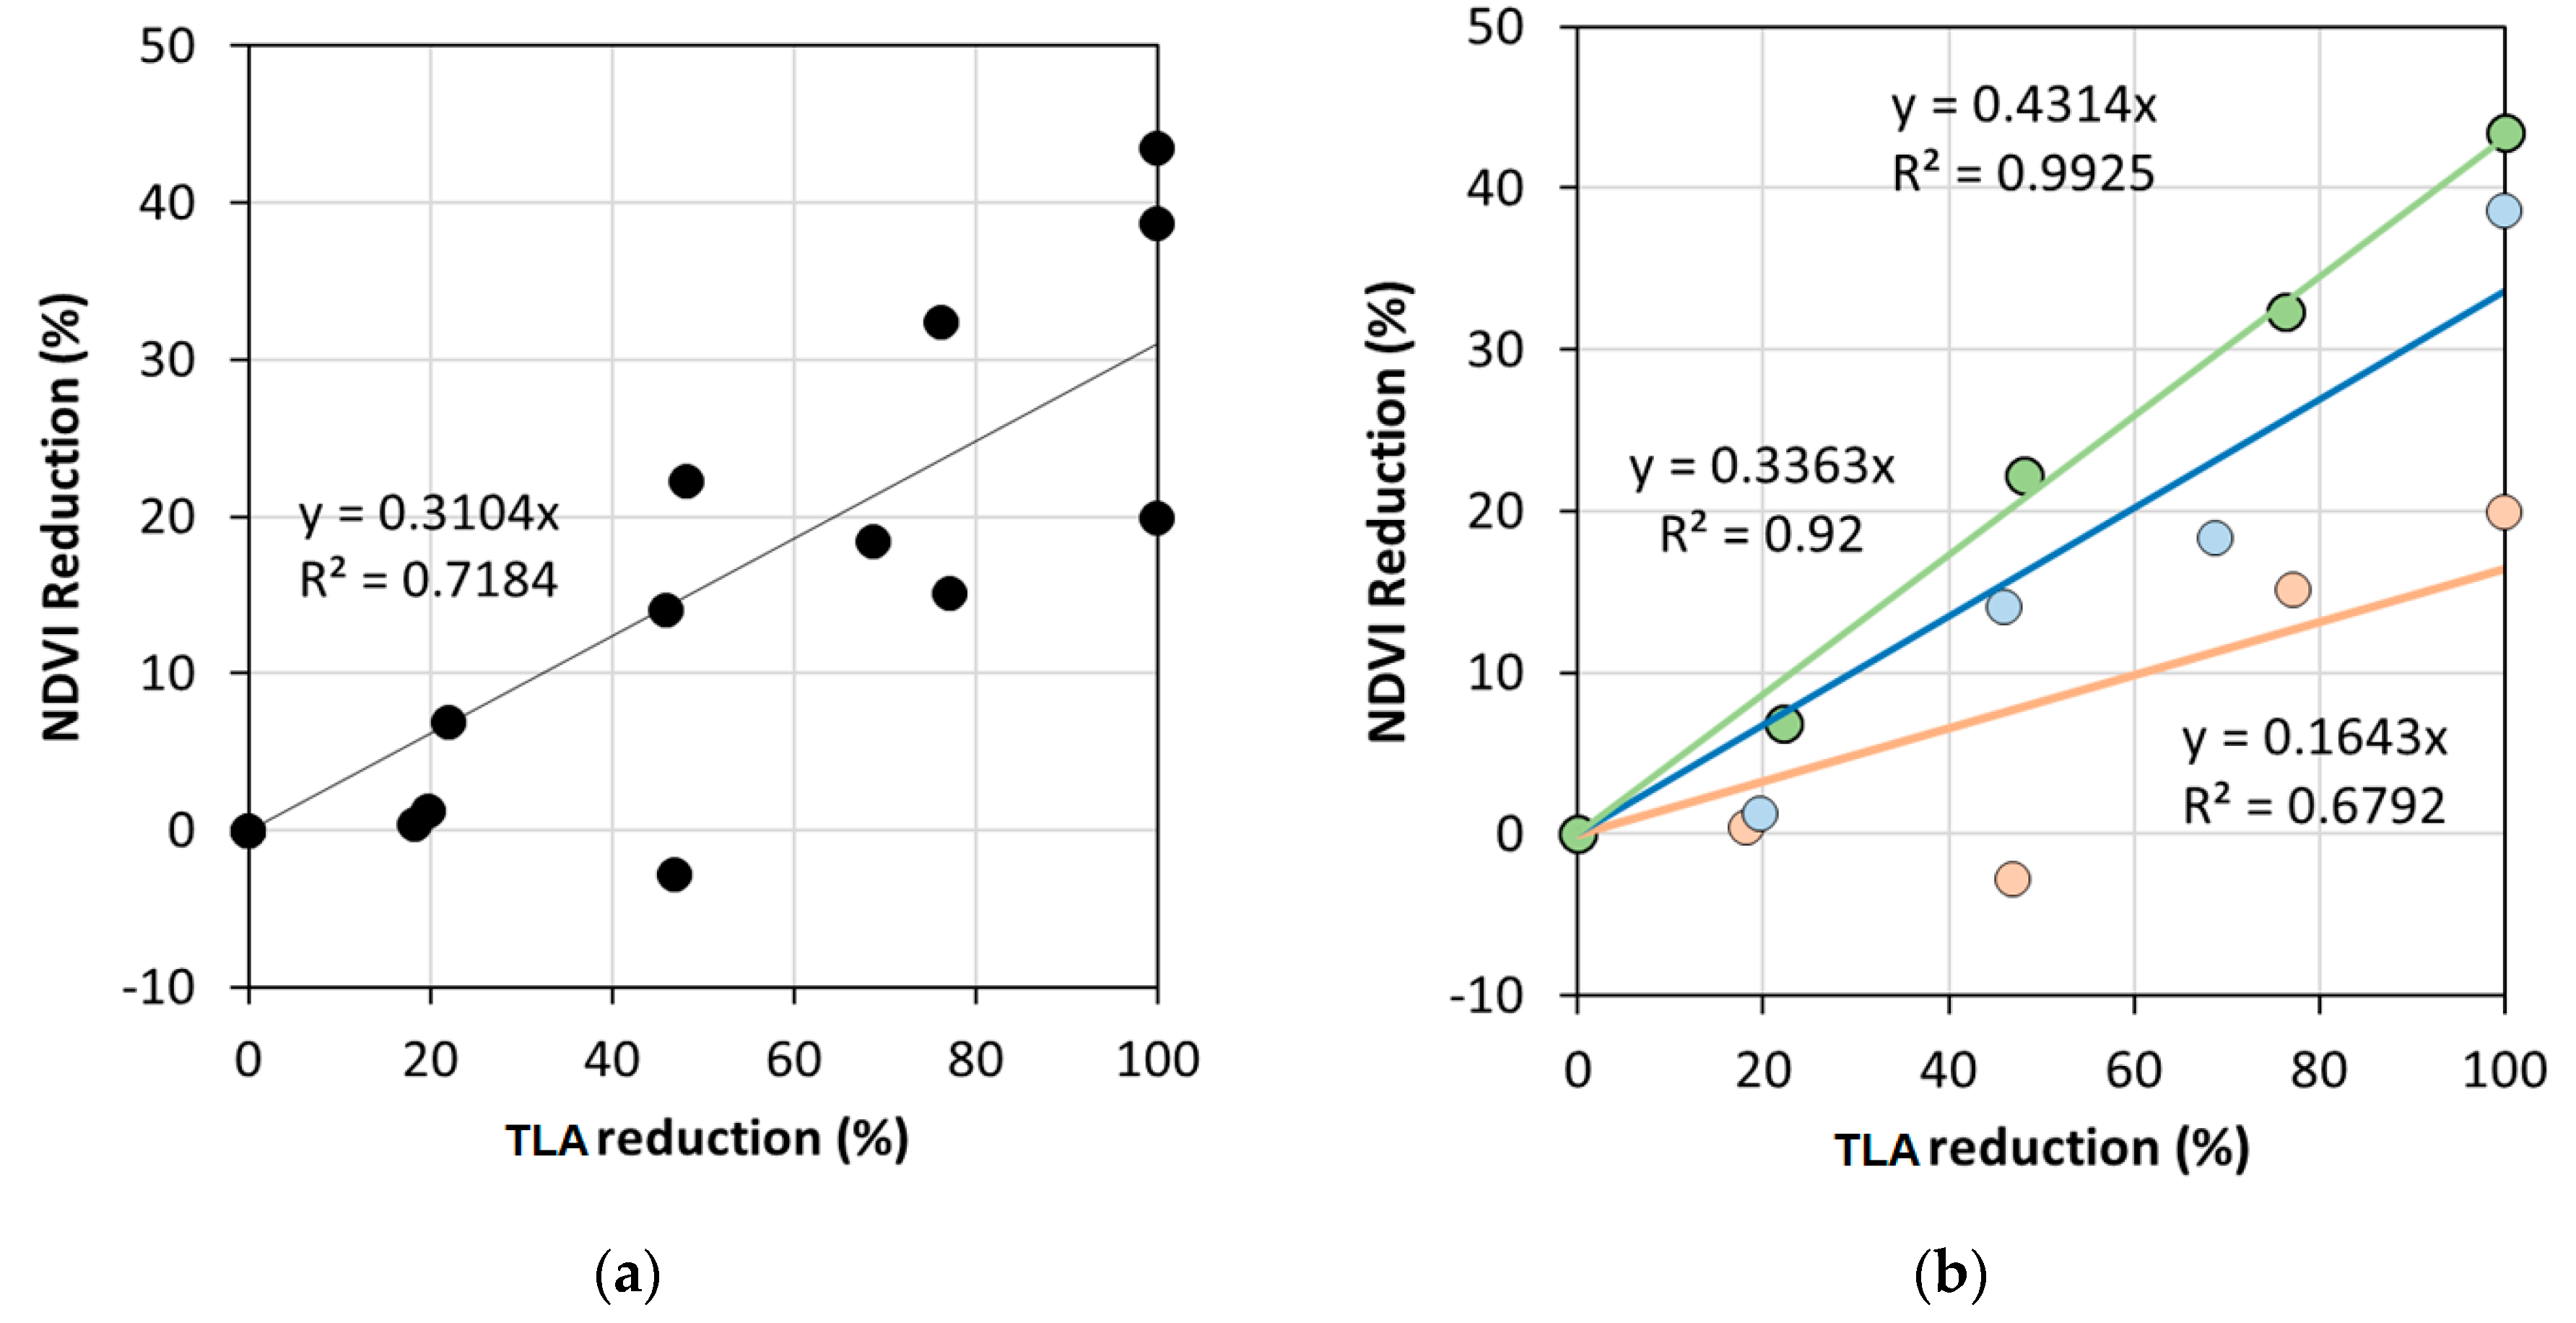
A reduction in the NDVI value is observed after each vine removal until it reaches the base soil values (NDVI values between 0.17 to 0.19), except in pixel 1 (Figure 5). The starting NDVI values, which correspond to the maximum vine cover, were 0.251, 0.321 and 0.306, for pixels 1, 2 and 3, respectively. In Figure 6a all values from all of the pixels from the dataset were used and a linear relationship was found between the reduction in NDVI and TLA (R2 = 0.72) with a slope of 0.32 (y = 0.3104x), showing that for each 20% of reduction in the TLA, the NDVI is reduced by around 7%, similar to the greenhouse experiment result. Moreover, if the dataset is disaggregated by pixel (Figure 6b), the determination coefficients are 0.92, 0.68 and 0.99 for pixels 1, 2 and 3, respectively.
The p-values for the comparison of each pair of removal steps are shown in Table 1. As expected, all removal steps had significant differences in TLA. However, concerning NDVI, only a few pairs of treatments had significant differences and in no case between two consecutive steps, which indicate a low sensitivity of the index to small changes in the vegetation amount.

4. Discussion

This study has approached the mixed pixel effect in two different ways: a laboratory approach (greenhouse) and a full-scale approach with a field experiment. Two experiments presented consistent results, showing the same pattern of NDVI reduction. The gradual reduction in NDVI showed in Figure 5b is expected because the leaf area within the pixel is reduced and NDVI is sensitive to changes in the vegetation [15]. There is an inconsistency in the pixel 1 trend, probably because the vegetation of the adjacent vines was moved and therefore the horizontal leaf area exposed to the satellite increased, although it could also be due to a variation in the reflectivity collected by the Sentinel in that specific image, since, if an analysis is performed using the image of 6/7/2019 corresponding to the Sentinel-2B satellite, an increase in NDVI can be observed in all the pixels of the tile. The influence of humidity in the soil is disregarded [58] since there was no significant rainfall in the period.
In the field experiment, initial NDVI values were between 0.25 and 0.32 with final values between 0.17 and 0.19. The starting NDVI values correspond to the maximum vine cover and indicate a different level of vigour in the selected pixels (Figure 5b). The final NDVI values correspond to bare soil and are consistent with the results of other authors [47]. It has been observed that the reduction in the NDVI value is proportional to the loss of TLA, finding that in the greenhouse experiment and the field experiment the slopes of the regression line were very similar. Therefore, if the vegetation within the pixel is reduced by 20%, the NDVI will be reduced proportionally by 6–7%. This also indicates that, considering the components of a mixed pixel [46], the vegetation and the associated shade effect 30–35%, so the remaining value is being influenced by the soil. These results are similar to the values reported by other authors [48], which indicate that the effect of the soil can be up to 3 times that of the vegetation.
If the field dataset is disaggregated per pixel, the difference between pixels is clearly observed (Figure 6b). This could be due to differences in vigour within the vineyard, since the vigour of the vineyard is related to the NDVI values [39,40]. Another important aspect to consider is the orientation of the row regarding the position of the Sentinel-2 pixels. The orientation combined with the space between rows creates an irregular grid effect. Therefore, if the orientation is not perfectly aligned with the pixel position, the number of vines per pixel is irregular. In our case, this effect was clear, with values of 38, 37 and 39 vines for the pixels 1, 2 and 3, respectively.
The trend lines presented in the results have very high R2 values, however, these lines were just made in order to observe the trend and to highlight the relationship that has been shown, not to establish a model, since they are strongly influenced by the extreme values (0% and 100% of reduction), and it would be desirable to have a greater amount of data to develop a model. It is also important to note that there may be misregistration of pixels, which are improved regularly by updating the Processing Baseline, so in future studies the algorithm might be ameliorated, allowing more accuracy in the process [59].
Looking at the results of the t-test, although the TLA was significantly reduced between each removal step, the differences in the NDVI were not significant until the amount of vegetation was reduced with two removal steps. For example, there are differences between the first and the last removal, and between the second and the last, but there is no difference between the third and the fourth. This indicates that, although the NDVI is affected by the reduction of TLA, it is not overly sensitive to small reductions in the vegetation amount.

5. Conclusions

In this study, a relationship between the Total Leaf Area (TLA) and the Normalized Difference Vegetation Index (NDVI) was developed to analyse the effect of missing vines on NDVI values at pixel level (10 × 10 m). This study has demonstrated that it is possible to estimate quantitatively the impact that the decrease in vegetation in a vineyard has on the NDVI values. Our results show that it is possible to use the NDVI calculated from the Sentinel-2 images to identify the change in the vegetation in the pixel. Furthermore, it is worth noting that the reduction in the NDVI values is proportional to the reduction in the vegetation, following a linear relationship. The quantitative relationship obtained in this study is valuable since a vineyard, once established, generally loses grapevines each year due to diseases, abiotic stress, etc., so it is worth analysing the effect of the missing vines in order to have a clear understanding of the vineyard vigour.
The field experiment was conducted in a vineyard with a vertical trellis and this system has become a standard in today’s viticulture. Moreover, in this work, the results of the two experiments are very similar, since the greenhouse experiment simulated the same row and plant distance as the field experiment, so the results obtained in this study could be used as a reference for vineyards with similar trellis characteristics (distance between rows and vines). However, it might be worthwhile to check whether this result can be extrapolated to other trellis systems or vineyards with different canopy or soil management practices, analysing the influence of the elimination of vegetation in vineyards with different soils and different characteristics. Further research would be desirable in this direction.
In further studies, it might be interesting to explore the possibility of removing a specific area of vines within a vineyard to calibrate the entire vineyard and use this technique to calibrate the background adjustment factor (L) of vegetation indexes such as SAVI, or even develop new indexes that take into account parameters related to the canopy, such as the influence of shadows or the linear meters of vertical trellis contained in each pixel.
Although the results are clear and promising, the limitations of this study should be considered due to the complexity and effort involved in an operation of this type in a vineyard. Operations on a larger scale are desirable in order to cover a greater number of pixels and vines to obtain more robust results covering different vineyard conditions.

Author Contributions

Conceptualization: S.V., E.B., J.A.R., C.P.-E.; methodology: S.V., E.B., J.A.R., C.P.-E., R.V.; Data acquisition: S.V., E.B., R.V., C.P.-E.; Data processing: S.V., E.B., R.V., C.P.-E.; Data analysis: S.V., E.B., C.P.-E.; resources, S.V., E.B., J.A.R., C.P.-E.; writing—original draft: S.V.; writing—review and editing: E.B., C.P.-E.; supervision: E.B., J.A.R., C.P.-E.; project administration: E.B., J.A.R.; funding acquisition: E.B., J.A.R. All authors have read and agreed to the published version of the manuscript.

Funding

This work has been possible thanks to the economic support of Junta de Castilla y León (Spain), Instituto Tecnológico Agrario de Castilla y León (ITACyL), the project INIA RTA2014-00077-C02, FPI-INIA2016-017 and FEDER funds.

Acknowledgments

We thank the staff of Viticulture for their cooperation in the vineyard operations.

Conflicts of Interest

The authors declare no conflict of interest.

References

  1. Krishna, K.R. Push Button Agriculture: Robotics, Drones, Satellite-Guided Soil and Crop Management; Apple Academic Press: Oxfordshire, UK, 2016. [Google Scholar]
  2. Hall, A.; Lamb, D.W.; Holzapfel, B.; Louis, J. Optical remote sensing applications in viticulture—A review. Aust. J. Grape Wine Res. 2002, 8, 36–47. [Google Scholar] [CrossRef]
  3. Proffitt, A.P.B. Precision Viticulture: A New Era in Vineyard Management and Wine Production; Winetitles Pty Ltd.: Broadview, SA, Australia, 2006. [Google Scholar]
  4. Bachmann, F.; Herbst, R.; Gebbers, R.; Hafner, V.V. Micro UAV Based Georeferenced Orthophoto Generation in VIS + NIR for Precision Agriculture. Int. Arch. Photogramm. Remote Sens. Spatial Inf. Sci. 2013, XL-1/W2, 11–16. [Google Scholar] [CrossRef] [Green Version]
  5. Rouse, J.W., Jr.; Haas, R.H.; Schell, J.A.; Deering, D.W. Monitoring vegetation systems in the Great Plains with ERTS. In Proceedings of the Third ERTS Symposium, NASA SP-351 1. U.S., Government Printing Office, Washington, DC, USA, 10–14 December 1973; pp. 309–317. [Google Scholar]
  6. Johnson, L.F.; Bosch, D.F.; Williams, D.C.; Lobitz, B.M. Remote sensing of vineyard management zones: Implications for wine quality. Appl. Eng. Agric. 2001, 17, 557–560. [Google Scholar] [CrossRef]
  7. Tagarakis, A.; Liakos, V.; Fountas, S.; Koundouras, S.; Gemtos, T.A. Management zones delineation using fuzzy clustering techniques in grapevines. Precis. Agric. 2013, 14, 18–39. [Google Scholar] [CrossRef]
  8. Martinez-Casasnovas, J.A.; Agelet-Fernandez, J.; Arno, J.; Ramos, M.C. Analysis of vineyard differential management zones and relation to vine development, grape maturity and quality. Span. J. Agric. Res. 2012, 10, 326. [Google Scholar] [CrossRef] [Green Version]
  9. Santesteban, L.G.; Guillaume, S.; Royo, J.B.; Tisseyre, B. Are precision agriculture tools and methods relevant at the whole-vineyard scale? Precis. Agric. 2013, 14, 2–17. [Google Scholar] [CrossRef] [Green Version]
  10. Santesteban, L.G.; Urretavizcaya, I.; Miranda, C.; Garcia, A.; Royo, J.B. Agronomic significance of the zones defined within vineyards early in the season using NDVI and fruit load information. In Proceedings of the Precision Agriculture ’13: Papers Presented at the 9th European Conference on Precision Agriculture, Lleida, Catalonia, Spain, 7–11 July 2013; ISBN 978-90-8686-224-5 . [Google Scholar]
  11. Urretavizcaya, I.; Miranda, C.; Royo, J.B.; Santesteban, L.G. Within-vineyard zone delineation in an area with diversity of training systems and plant spacing using parameters of vegetative growth and crop load. In Proceedings of the Precision Agriculture ’15: Papers Presented at the 10th European Conference on Precision Agriculture, Volcani Center, Rishon LeTsiyon, Israel, 12–16 July 2015; ISBN 978-90-8686-267-2. [Google Scholar]
  12. Cancela, J.J.; Fandiño, M.; Rey, B.J.; Dafonte, J.; González, X.P. Discrimination of irrigation water management effects in pergola trellis system vineyards using a vegetation and soil index. Agric. Water Manag. 2017, 183, 70–77. [Google Scholar] [CrossRef]
  13. Johnson, L.F. Temporal stability of an NDVI-LAI relationship in a Napa Valley vineyard. Aust. J. Grape Wine Res. 2003, 9, 96–101. [Google Scholar] [CrossRef]
  14. Towers, P.C.; Strever, A.; Poblete-Echeverría, C. Comparison of Vegetation Indices for Leaf Area Index Estimation in Vertical Shoot Positioned Vine Canopies with and without Grenbiule Hail-Protection Netting. Remote Sens. 2019, 11, 1073. [Google Scholar] [CrossRef] [Green Version]
  15. Ledderhof, D.; Brown, R.; Reynolds, A.; Jollineau, M. Using remote sensing to understand Pinot noir vineyard variability in Ontario. Can. J. Plant Sci. 2016, 96, 89–108. [Google Scholar] [CrossRef]
  16. Lamb, D.W.; Weedon, M.M.; Bramley, R.G.V. Using remote sensing to predict grape phenolics and colour at harvest in a Cabernet Sauvignon vineyard: Timing observations against vine phenology and optimising image resolution. Aust. J. Grape Wine Res. 2008, 10, 46–54. [Google Scholar] [CrossRef] [Green Version]
  17. Baluja, J.; Diago, M.P.; Balda, P.; Zorer, R.; Meggio, F.; Morales, F.; Tardaguila, J. Assessment of vineyard water status variability by thermal and multispectral imagery using an unmanned aerial vehicle (UAV). Irrig. Sci. 2012, 30, 511–522. [Google Scholar] [CrossRef]
  18. Anastasiou, E.; Balafoutis, A.; Darra, N.; Psiroukis, V.; Biniari, A.; Xanthopoulos, G.; Fountas, S. Satellite and Proximal Sensing to Estimate the Yield and Quality of Table Grapes. Agriculture 2018, 8, 94. [Google Scholar] [CrossRef] [Green Version]
  19. Kazmierski, M.; Glémas, P.; Rousseau, J.; Tisseyre, B. Temporal stability of within-field patterns of NDVI in non irrigated Mediterranean vineyards. OENO One 2011, 45, 61. [Google Scholar] [CrossRef]
  20. Matese, A.; Di Gennaro, S.F.; Berton, A. Assessment of a canopy height model (CHM) in a vineyard using UAV-based multispectral imaging. Int. J. Remote Sens. 2017, 38, 2150–2160. [Google Scholar] [CrossRef]
  21. Santesteban, L.G.; Di Gennaro, S.F.; Herrero-Langreo, A.; Miranda, C.; Royo, J.B.; Matese, A. High-resolution UAV-based thermal imaging to estimate the instantaneous and seasonal variability of plant water status within a vineyard. Agr. Wat. Manag. 2017, 183, 49–59. [Google Scholar] [CrossRef]
  22. Weiss, M.; Baret, F. Using 3D Point Clouds Derived from UAV RGB Imagery to Describe Vineyard 3D Macro-Structure. Remote Sens. 2017, 9, 111. [Google Scholar] [CrossRef] [Green Version]
  23. Mathews, A.; Jensen, J. Visualizing and Quantifying Vineyard Canopy LAI Using an Unmanned Aerial Vehicle (UAV) Collected High Density Structure from Motion Point Cloud. Remote Sens. 2013, 5, 2164–2183. [Google Scholar] [CrossRef] [Green Version]
  24. Zarco-Tejada, P.J.; Guillén-Climent, M.L.; Hernández-Clemente, R.; Catalina, A.; González, M.R.; Martín, P. Estimating leaf carotenoid content in vineyards using high resolution hyperspectral imagery acquired from an unmanned aerial vehicle (UAV). Agric. Forest Meteorol. 2013, 171–172, 281–294. [Google Scholar] [CrossRef] [Green Version]
  25. Poblete-Echeverría, C.; Olmedo, G.; Ingram, B.; Bardeen, M. Detection and Segmentation of Vine Canopy in Ultra-High Spatial Resolution RGB Imagery Obtained from Unmanned Aerial Vehicle (UAV): A Case Study in a Commercial Vineyard. Remote Sens. 2017, 9, 268. [Google Scholar] [CrossRef] [Green Version]
  26. Maes, W.H.; Steppe, K. Perspectives for Remote Sensing with Unmanned Aerial Vehicles in Precision Agriculture. Trends Plant Sci. 2019, 24, 152–164. [Google Scholar] [CrossRef] [PubMed]
  27. Nex, F.; Remondino, F. UAV for 3D mapping applications: A review. Appl. Geomat. 2014, 6, 1–15. [Google Scholar] [CrossRef]
  28. Stöcker, C.; Bennett, R.; Nex, F.; Gerke, M.; Zevenbergen, J. Review of the Current State of UAV Regulations. Remote Sens. 2017, 9, 459. [Google Scholar] [CrossRef] [Green Version]
  29. Matese, A.; Toscano, P.; Di Gennaro, S.; Genesio, L.; Vaccari, F.; Primicerio, J.; Belli, C.; Zaldei, A.; Bianconi, R.; Gioli, B. Intercomparison of UAV, Aircraft and Satellite Remote Sensing Platforms for Precision Viticulture. Remote Sens. 2015, 7, 2971–2990. [Google Scholar] [CrossRef] [Green Version]
  30. Borgogno-Mondino, E.; Novello, V.; Lessio, A.; Tarricone, L.; de Palma, L. Intra-vineyard variability description through satellite-derived spectral indices as related to soil and vine water status. Acta Hortic. 2018, 1197, 59–68. [Google Scholar] [CrossRef]
  31. Sun, L.; Gao, F.; Anderson, M.C.; Kustas, W.P.; Alsina, M.M.; Sanchez, L.; Sams, B.; McKee, L.; Dulaney, W.; White, W.A.; et al. Daily Mapping of 30 m LAI and NDVI for Grape Yield Prediction in California Vineyards. Remote Sens. 2017, 9, 317. [Google Scholar] [CrossRef] [Green Version]
  32. Knipper; Kustas; Anderson; Alsina; Hain; Alfieri; Prueger; Gao; McKee; Sanchez Using High-Spatiotemporal Thermal Satellite ET Retrievals for Operational Water Use and Stress Monitoring in a California Vineyard. Remote Sens. 2019, 11, 2124. [CrossRef] [Green Version]
  33. Chang, J.; Shoshany, M. Mediterranean shrublands biomass estimation using Sentinel-1 and Sentinel-2. In Proceedings of the 2016 IEEE International Geoscience and Remote Sensing Symposium (IGARSS), Beijing, China, 10 July 2016; pp. 5300–5303. [Google Scholar] [CrossRef]
  34. Stumpf, A.; Michéa, D.; Malet, J.-P. Improved Co-Registration of Sentinel-2 and Landsat-8 Imagery for Earth Surface Motion Measurements. Remote Sens. 2018, 10, 160. [Google Scholar] [CrossRef] [Green Version]
  35. Navarro, A.; Rolim, J.; Miguel, I.; Catalão, J.; Silva, J.; Painho, M.; Vekerdy, Z. Crop Monitoring Based on SPOT-5 Take-5 and Sentinel-1A Data for the Estimation of Crop Water Requirements. Remote Sens. 2016, 8, 525. [Google Scholar] [CrossRef] [Green Version]
  36. Lacroix, P.; Bièvre, G.; Pathier, E.; Kniess, U.; Jongmans, D. Use of Sentinel-2 images for the detection of precursory motions before landslide failures. Remote Sens. Environ. 2018, 215, 507–516. [Google Scholar] [CrossRef]
  37. Kääb, A.; Winsvold, S.; Altena, B.; Nuth, C.; Nagler, T.; Wuite, J. Glacier Remote Sensing Using Sentinel-2. Part I: Radiometric and Geometric Performance, and Application to Ice Velocity. Remote Sens. 2016, 8, 598. [Google Scholar] [CrossRef] [Green Version]
  38. Chen, B.; Jin, Y.; Brown, P. An enhanced bloom index for quantifying floral phenology using multi-scale remote sensing observations. ISPRS J. Photogramm. Remote Sens. 2019, 156, 108–120. [Google Scholar] [CrossRef]
  39. Vélez, S.; Rubio, J.A.; Andrés, M.I.; Barajas, E. Agronomic classification between vineyards (‘Verdejo’) using NDVI and Sentinel-2 and evaluation of their wines. Vitis J. Grapevine Res. 2019, 58, 33–38. [Google Scholar] [CrossRef]
  40. Di Gennaro, S.F.; Dainelli, R.; Palliotti, A.; Toscano, P.; Matese, A. Sentinel-2 Validation for Spatial Variability Assessment in Overhead Trellis System Viticulture Versus UAV and Agronomic Data. Remote Sens. 2019, 11, 2573. [Google Scholar] [CrossRef] [Green Version]
  41. Zhang, H.K.; Roy, D.P.; Yan, L.; Li, Z.; Huang, H.; Vermote, E.; Skakun, S.; Roger, J.-C. Characterization of Sentinel-2A and Landsat-8 top of atmosphere, surface, and nadir BRDF adjusted reflectance and NDVI differences. Remote Sens. Environ. 2018, 215, 482–494. [Google Scholar] [CrossRef]
  42. European Space Agency (ESA). SENTINEL-2 User Handbook; ESA Standard Document: 2015; Available online: https://sentinel.esa.int/documents/247904/685211/Sentinel-2_User_Handbook (accessed on 25 March 2020).
  43. Hall, A.; Louis, J.P.; Lamb, D.W. Low-resolution remotely sensed images of winegrape vineyards map spatial variability in planimetric canopy area instead of leaf area index. Aust. J. Grape Wine Res. 2008, 14, 9–17. [Google Scholar] [CrossRef]
  44. Devaux, N.; Crestey, T.; Leroux, C.; Tisseyre, B. Potential of Sentinel-2 satellite images to monitor vine fields grown at a territorial scale. OENO One 2019, 53. [Google Scholar] [CrossRef]
  45. Johnson, L.; Scholasch, T. Remote Sensing of Shaded Area in Vineyards. Horttech 2005, 15, 859–863. [Google Scholar] [CrossRef] [Green Version]
  46. Fuentes, S.; Poblete-Echeverría, C.; Ortega-Farias, S.; Tyerman, S.; De Bei, R. Automated estimation of leaf area index from grapevine canopies using cover photography, video and computational analysis methods: New automated canopy vigour monitoring tool. Aust. J. Grape Wine Res. 2014, 20, 465–473. [Google Scholar] [CrossRef]
  47. Montandon, L.; Small, E. The impact of soil reflectance on the quantification of the green vegetation fraction from NDVI. Remote Sens. Environ. 2008, 112, 1835–1845. [Google Scholar] [CrossRef]
  48. Poblete-Echeverría, C.; Acevedo-Opazo, C.; Ortega-Farías, S.; Valdés-Gómez, H.; Nuñez, R. Study of NDVI spatial variability over a Merlot vineyard-plot in Maule Region using a hand held Spectroradiometer. In Proceedings of the 8th Fruit, Nut, and Veg Prod Eng Symp FRUTIC, Concepción, Chile, 5–9 January 2009; pp. 182–189. [Google Scholar]
  49. Hall, A.; Lamb, D.W.; Holzapfel, B.P.; Louis, J.P. Within-season temporal variation in correlations between vineyard canopy and winegrape composition and yield. Precis. Agric. 2011, 12, 103–117. [Google Scholar] [CrossRef]
  50. Prichard, T.; Hanson, B.; Schwankl, L.; Verdegaal, P.; Smith, R. Deficit Irrigation of Quality Winegrapes Using Micro-Irrigation Techniques; UC Coop Extension, Dept. of LAWR. UC Davis, 2004; Available online: http://cesanluisobispo.ucdavis.edu/files/89518.pdf (accessed on 22 March 2020).
  51. Wang, Q.J.; Tian, Q.J.; Lin, Q.Z.; Li, M.X.; Wang, L.M. An improved algorithm for shadow restoration of high spatial resolution imagery. In Proceedings of the Proc. SPIE 7123, Remote Sensing of the Environment: 16th National Symposium on Remote Sensing of China, Beijing, China, 7–10 September 2007; p. 71230D. [Google Scholar] [CrossRef]
  52. Zhang, Z.; Chen, F. A shadow processing method of high spatial resolution remote sensing image. In Proceedings of the 2010 3rd International Congress on Image and Signal Processing, Yantai, China, 16–18 October 2010; pp. 816–820. [Google Scholar] [CrossRef]
  53. Aboutalebi, M.; Torres-Rua, A.F.; McKee, M.; Kustas, W.; Nieto, H.; Coopmans, C. Behavior of vegetation/soil indices in shaded and sunlit pixels and evaluation of different shadow compensation methods using UAV high-resolution imagery over vineyards. In Proceedings of the Autonomous Air and Ground Sensing Systems for Agricultural Optimization and Phenotyping III., Orlando, FL, USA, 18–19 April 2018; Thomasson, J.A., McKee, M., Moorhead, R.J., Eds.; SPIE: Orlando, FL, USA, 2018; p. 6. [Google Scholar] [CrossRef]
  54. Wu, J.; Bauer, M. Evaluating the Effects of Shadow Detection on QuickBird Image Classification and Spectroradiometric Restoration. Remote Sens. 2013, 5, 4450–4469. [Google Scholar] [CrossRef] [Green Version]
  55. Ma, H.; Qin, Q.; Shen, X. Shadow Segmentation and Compensation in High Resolution Satellite Images. In Proceedings of the IGARSS 2008-2008 IEEE International Geoscience and Remote Sensing Symposium, Boston, MA, USA, 8–11 July 2008; pp. II-1036–II-1039. [Google Scholar] [CrossRef]
  56. Fountas, S.; Anastasiou, E.; Balafoutis, A.; Koundouras, S.; Theoharis, S.; Theodorou, N. The influence of vine variety and vineyard management on the effectiveness of canopy sensors to predict winegrape yield and quality. In Proceedings of the International Conference of Agricultural Engineering, Zurich, Switzerland, 6–10 July 2014. [Google Scholar]
  57. Easlon, H.M.; Bloom, A. Easy Leaf Area: Automated Digital Image Analysis for Rapid and Accurate Measurement of Leaf Area. Apps Plant Sci. 2014, 2, 1400033. [Google Scholar] [CrossRef] [PubMed]
  58. Lobell, D.B.; Asner, G.P. Moisture Effects on Soil Reflectance. Soil Sci. Soc. Am. J. 2002, 66, 6. [Google Scholar] [CrossRef]
  59. Yan, L.; Roy, D.P.; Li, Z.; Zhang, H.K.; Huang, H. Sentinel-2A multi-temporal misregistration characterization and an orbit-based sub-pixel registration methodology. Remote Sens. Environ. 2018, 215, 495–506. [Google Scholar] [CrossRef]
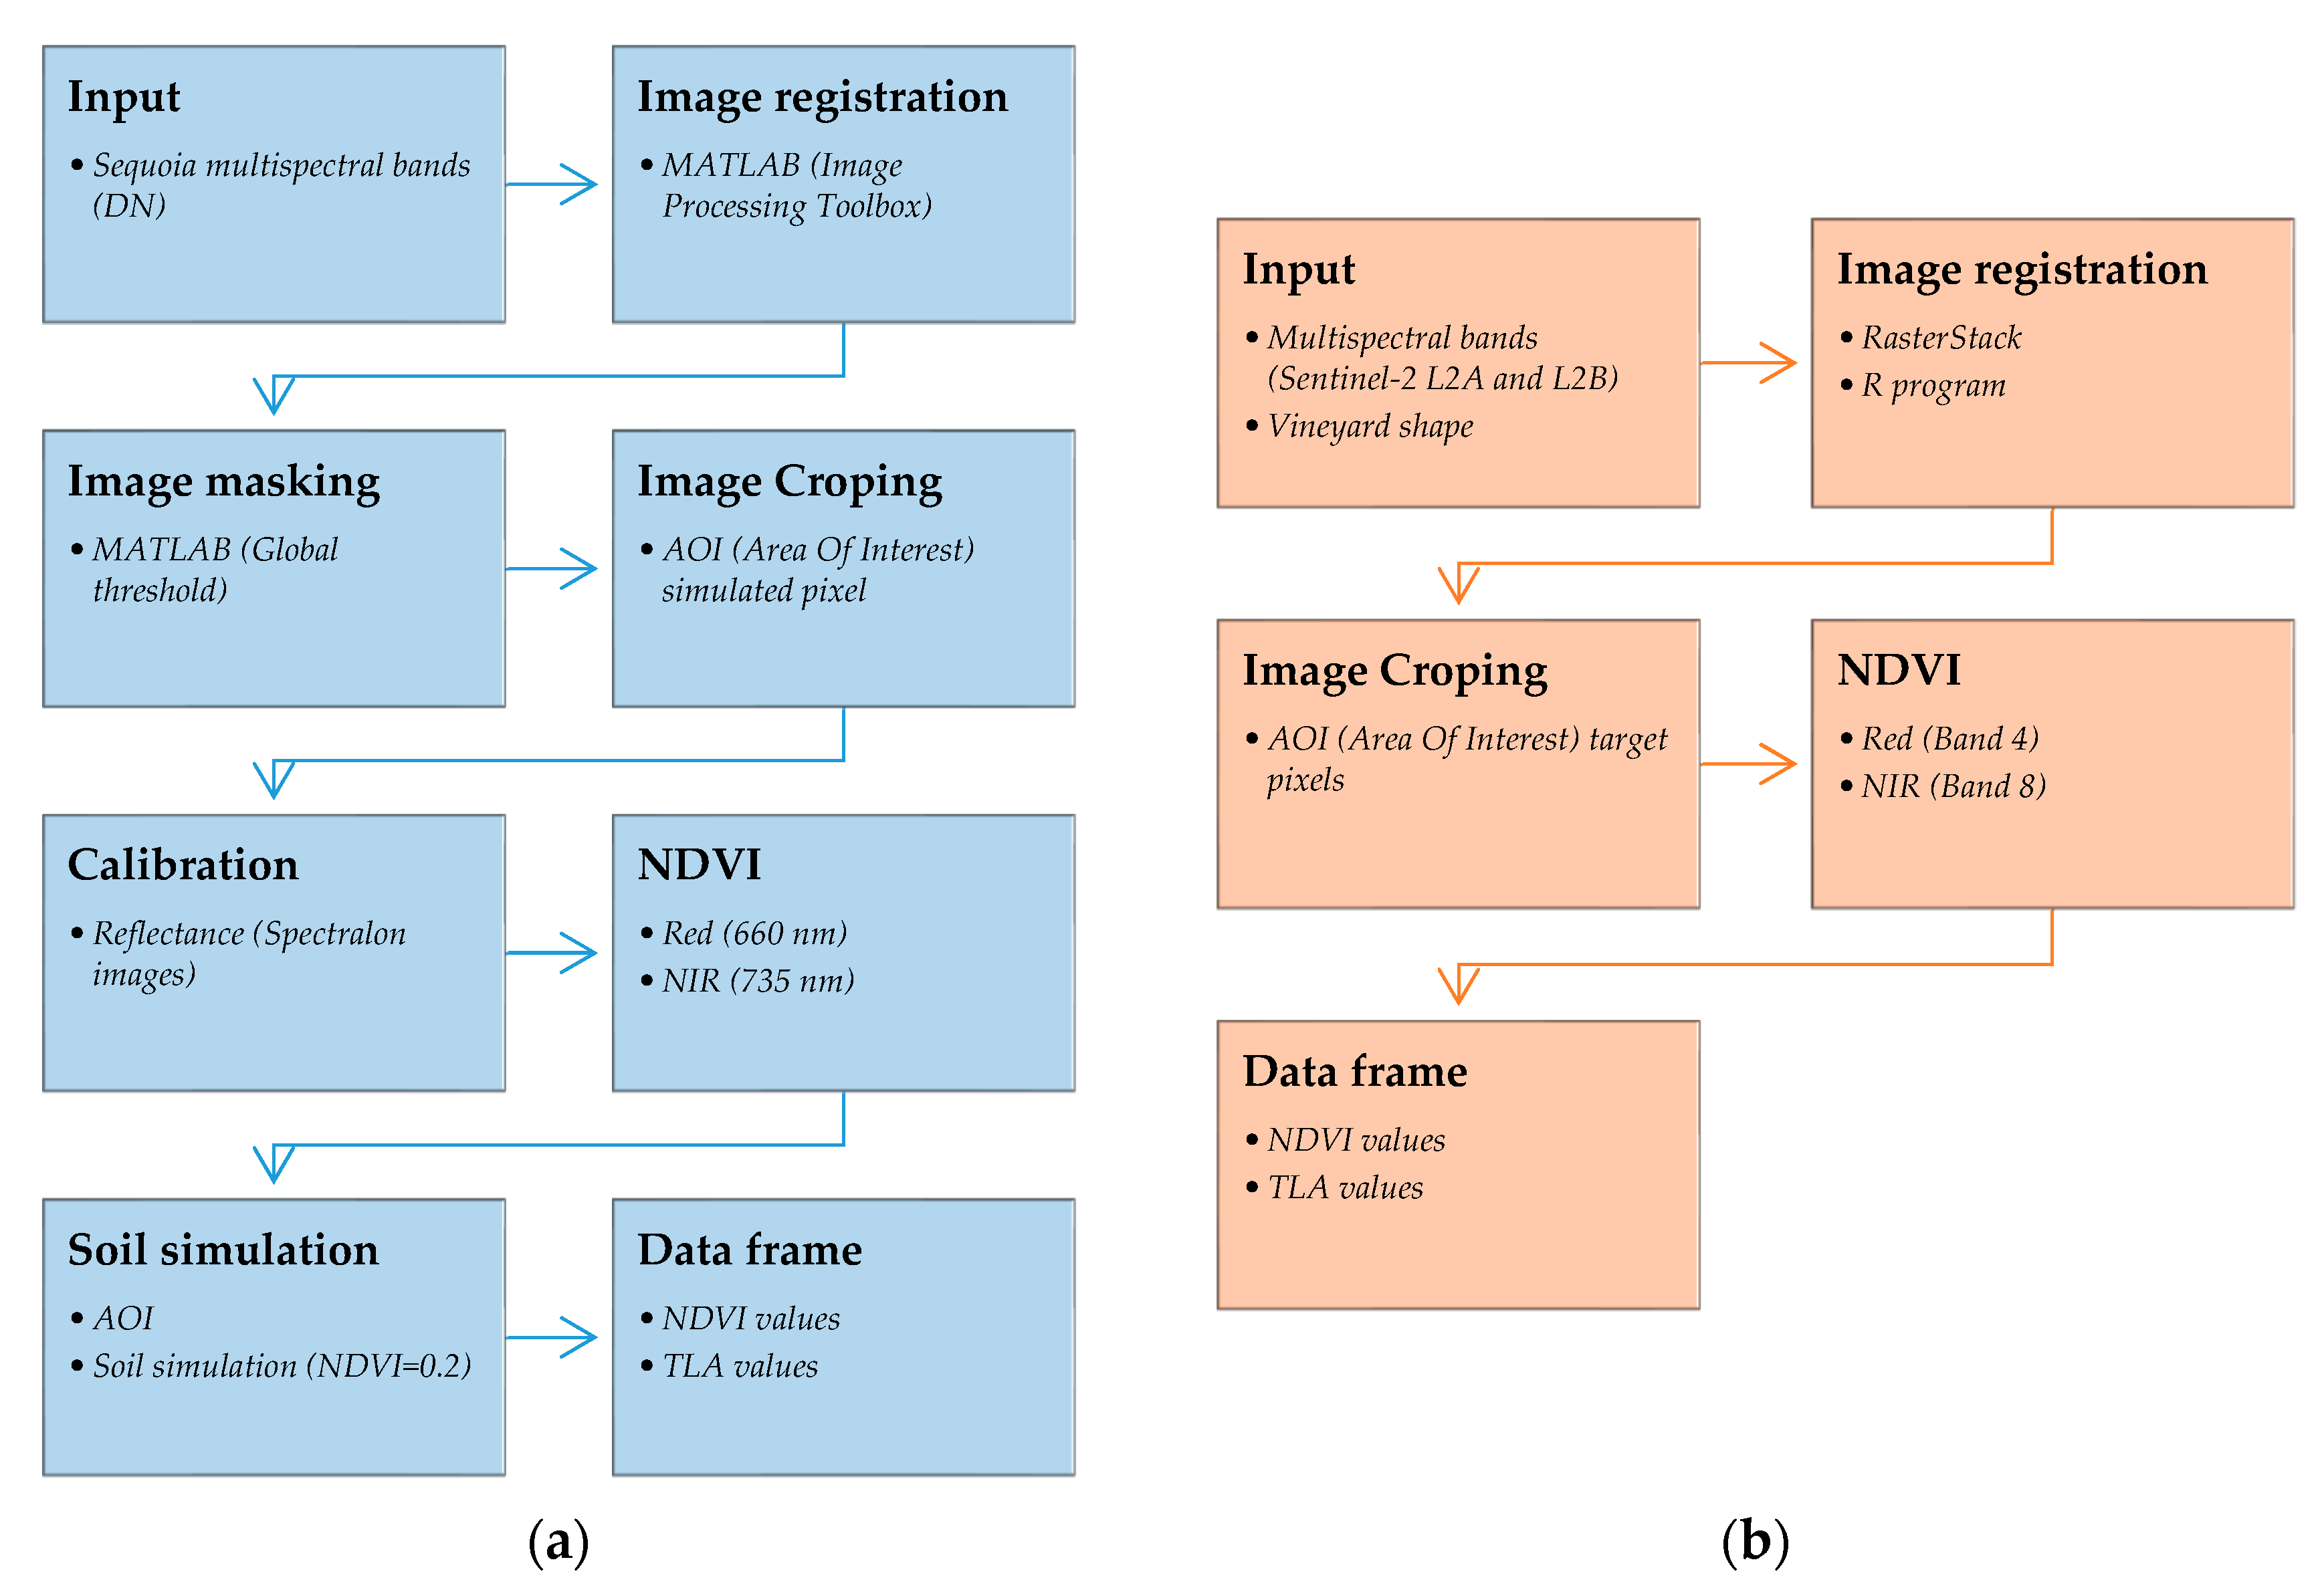
Figure 1. Pipeline of (a) greenhouse image analysis (b) field experiment image analysis. NDVI: Normalized Difference Vegetation Index. TLA: Total Leaf Area.
Applsci 10 03612 g001
Figure 2. Schematic representation of the four-step vine removal implemented in the field experiment.
Applsci 10 03612 g002
Figure 3. (a) Removal of the vines; (b) Detail of the removed vines; (c) Marked pixels in the vineyard and (d) Example of the leaf area measurements using the Easy Leaf Area application.
Applsci 10 03612 g003
Figure 4. (a) Example of the mask used to isolate the vines; (b) The relationship between them. Normalized Difference Vegetation Index (NDVI) reduction (%) and Total Leaf Area (TLA) reduction (%) as pixel-based.
Applsci 10 03612 g004
Figure 5. (a) Detail of the vine removal by phase. (b) TLA (m2) and NDVI values in each pixel.
Applsci 10 03612 g005
Figure 6. Relationship between NDVI (%) and TLA reduction (%) (a) in all pixels (b) per pixel.
Applsci 10 03612 g006
Table 1. p-values from the t-test comparison of Normalized Difference Vegetation Index (NDVI) and total leaf area (TLA) in the field experiment.
TLA
Step0Step1Step2Step3Step4
NDVIStep0 0.0180.0030.0010.001
Step10.396 0.002<0.001<0.001
Step20.1200.148 <0.001<0.001
Step30.0390.0450.113 0.002
Step40.0130.0110.0050.079
Grey colour denotes p-values < 0.05. Diagonal values were excluded and marked in black.